Download to read offline
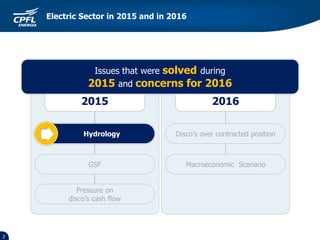
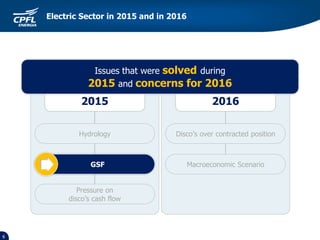
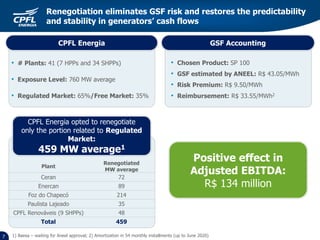
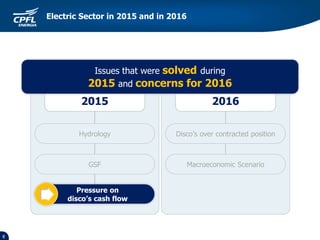
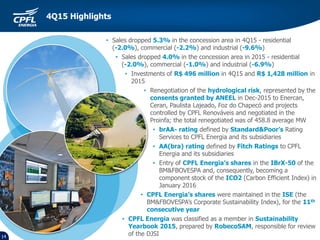
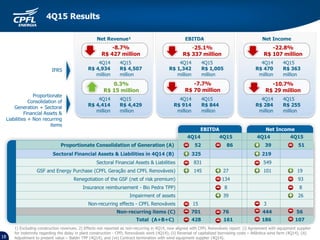
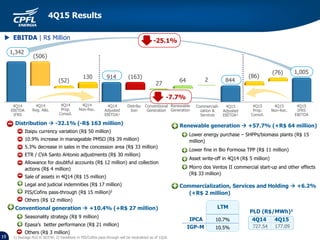
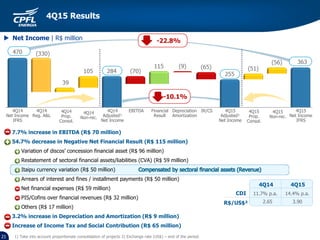
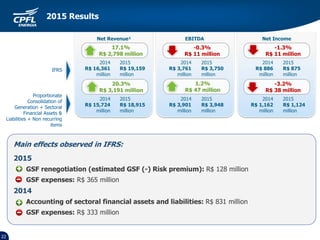

- CPFL Energia reported financial results for 4Q15 and full year 2015. Net income decreased 25.1% in 4Q15 and 22.8% for the full year. - Key factors impacting results were lower energy sales, higher allowance for doubtful accounts, adjustments to regulatory assets and liabilities, and non-recurring effects in 4Q14 that did not repeat. - Issues addressed in 2015 included renegotiation of hydrological risk (GSF), which eliminated future risk and stabilized cash flows for generators. However, macroeconomic challenges in Brazil continued to negatively impact sales.


