Download to read offline

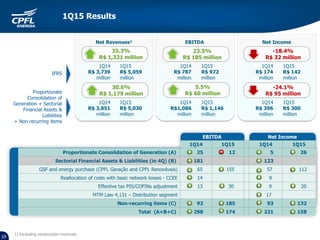
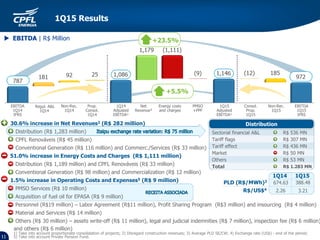
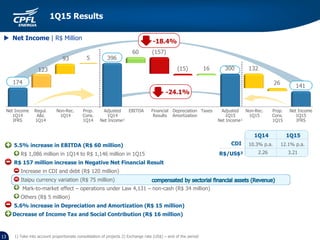
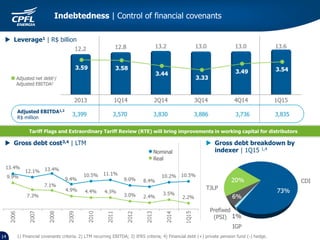
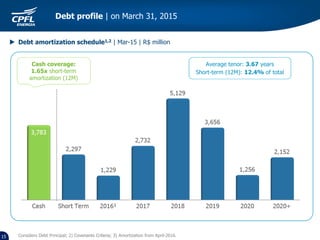

1) CPFL Energia reported its 1Q15 results, with net revenues increasing 30.6% compared to 1Q14. Energy costs and charges increased 51.0% primarily in the distribution and renewable generation segments. 2) Adjusted EBITDA increased 23.5% to R$1,321 million in 1Q15. Net income decreased 18.4% to R$300 million due to a R$157 million increase in negative net financial results. 3) The company maintained control of its financial leverage and debt amortization schedule with cash coverage of 1.65x for short-term debt.


