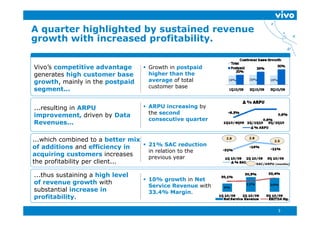
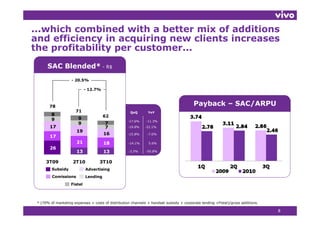
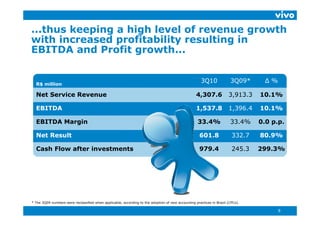
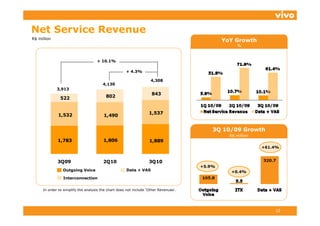
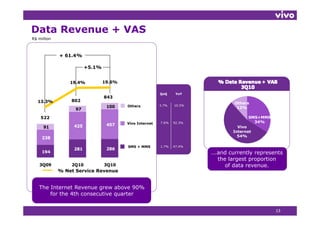
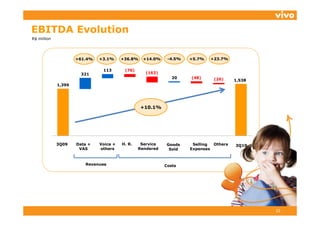
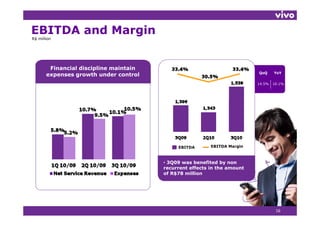
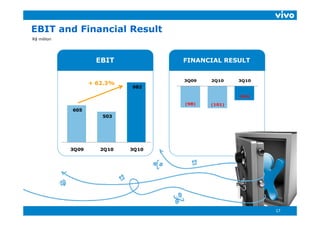
Vivo had a strong third quarter with sustained revenue growth and increased profitability:
- Revenue grew 10.1% to R$4.3 billion due to increased customer base and higher postpaid subscriber growth.
- EBITDA grew 10.1% to R$1.54 billion and margins remained steady at 33.4% due to efficiency gains in acquiring customers.
- Net income increased 80.9% to R$601.8 million as a result of the revenue growth and profitability gains.
Présentation des résultats financiers Ericsson (Q4 2009)Ericsson France
Ericsson a publié ce matin les résultats de l’entreprise pour l’année 2009. Hans Vestberg, nouvellement président-directeur général du groupe depuis le 1er janvier 2010, a commenté les faits saillants au cours d’une conférence de presse en Suède. L’intégralité de ses commentaires est disponible ci-dessous.
Plus d'informations : http://www.blog-ericssonfrance.com/2010/01/le-pdg-du-groupe-ericsson-commente-les-resultats-2009/
3. A quarter highlighted by sustained revenue
growth with increased profitability.
th ith i d fit bilit
Vivo’s competitive advantage Growth in postpaid
generates high customer base higher than the
growth, mainly in the postpaid average of total
customer base
segment...
t
...resulting in ARPU ARPU increasing by
improvement, d i
i t driven b D t
by Data the second
consecutive quarter
Revenues...
...which combined to a better mix
which 2.8
28 2.8
28
2.5
of additions and efficiency in 21% SAC reduction
in relation to the
acquiring customers increases previous year
the profitability per client...
p yp SAC/ARPU (months)
...thus sustaining a high level
10% growth in Net
of revenue growth with
Service Revenue with
substantial increase in 33.4% Margin.
i
profitability.
3
4. Vivo’s competitive advantage generates high
customer base growth, mainly in the postpaid
growth
segment...
Increase in 3G Promotions designed Largest own The right handset
Coverage for each segment stores chain portfolio
Concept stores with customized
services for high-end customers
+18.2%
+3.1%
QoQ YoY
56.0 57.7
48.9 6.4% 30.3%
2.3% 15.3%
Prepaid Postpaid Postpaid Blended
4
5. ...thus keeping a customer base even more
active, mainly in outgoing calls...
ti i l i t i ll
Customers
MOU VOICE TRAFFIC Recharging
Minutes Million of minutes % of prepaid
customer base
+ 29.2%
+53.1%
+ 0.9% +4.6%
QoQ YoY + 4.9 p.p.
114 115
18,744 19,600 QoQ YoY
89 24 25 4.2% 10 7%
4 2% -10.7%
6.0% 5.2%
28 12,800
90 90 0.0% 47.5% 4.2%
4 2% 74 8%
74.8%
61
3Q09 2Q10 3Q10
Outgoing Incoming Outgoing Incoming Sep-09 Sep/10
5
6. ...resulting in ARPU improvement, specially in
the
th outgoing ARPU...
t i ARPU
ARPU – R$
Outgoing ARPU Evolution
- 7.4%
+ 0.8%
27.2
25.0 25.2 Q Q
QoQ YoY
11.0 -1.1% -15.5%
9.4 9.3
16.2 15.6 15.9 1.9% -1.9%
3Q09 2Q10 3Q10
Outgoing Incoming
6
7. ...driven by the high adoption and
profitability of data services...
Growth of 3G Plans
Data + VAS ARPU – R$
Customer Base
19%
+112% 13%
Data ARPU/Total ARPU
7
8. ...which combined with a better mix of additions
and efficiency in acquiring new clients increases
d ffi i i i i li t i
the profitability per customer...
SAC Blended* - R$
- 20.5%
- 12.7%
78 Payback – SAC/ARPU
71 QoQ YoY
8 62
9 9
-17.6% -11.3%
9 7
17 7 -19.8% -22.1%
19
16 -15.8% -7.0%
17
21 18 -14.1% 5.6%
26
13 13 -2.5% -50.8%
3T09 2T10 3T10
Subsidy Advertising
Comissions Lending
Fistel
* (70% of marketing expenses + costs of distribution channels + handset subsidy + corporate lending +Fistel)/gross additions.
8
9. ...thus keeping a high level of revenue growth
with i
ith increased profitability resulting in
d fit bilit lti i
EBITDA and Profit growth...
R$ million
3Q10 3Q09* Δ%
Net Service Revenue 4,307.6 3,913.3 10.1%
EBITDA 1,537.8 1,396.4 10.1%
EBITDA Margin 33.4% 33.4% 0.0 p.p.
Net Result 601.8 332.7 80.9%
Cash Flow after investments 979.4 245.3 299.3%
* The 3Q09 numbers were reclassified when applicable, according to the adoption of new accounting practices in Brazil (CPCs).
9
10. ...and strengthening the basis for a sustainable
long term growth
growth.
Gaining know-how and ...and universalizing
innovating in p
g products and services… the 3G coverage
FINANCIAL SERVICES
Co-Branded Card Vivo
Itaúcard
Mobile Checking Account
Bradesco Santander Broker
Mobile Payments with
MasterCard, Itaú and
RedeCard
VIVO S
VIVO’S SERVICE STORE
MOBILE LEARNING
Language courses
through the mobile
phone
10
12. Net Service Revenue
R$ million
YoY Growth
%
+ 10 1%
10.1%
+ 4.3%
4,308
4,130
3,913
843
522 802
1,532 1,537
1 537
1,490
3Q 10/09 Growth
R$ million
1,783 1,806
1 806 1,889
+61.4%
3Q09 2Q10 3Q10
+5.9%
Outgoing Voice Data + VAS +0.4%
Interconnection
In order to simplify the analysis the chart does not include ‘Other Revenues’.
Other Revenues
12
13. Data Revenue + VAS
R$ million
+ 61.4%
+5.1%
19.4% 19.6%
QoQ YoY
843
13.3% 802
Others
100 Others 3.7% 10.5%
97 12%
522 SMS+MMS
Vivo Internet 7.6% 92.3% 34%
425 457
91 Vivo
Internet
238 54%
SMS + MMS 1.7% 47.4%
281 286
194 ...and currently represents
the largest proportion
3Q09 2Q10 3Q10 of data revenue
revenue.
% Net Service Revenue
The Internet Revenue grew above 90%
g
for the 4th consecutive quarter
13
14. Operating Expenses*
R$ million
Service Rendered Goods Sold Selling Expenses
+ 15%
+ 3% - 5% + 6%
+ 10% - 6%
925 1,038
, 1,064 954
847 896
452 394 431
General and H. R. Fistel, Fust, Funtel
Administrative
+ 10%
+ 15% + 37%
+ 6% + 6% - 2%
266 281 269 264
154 167 177 206 240
* Excluding Depreciation.
14
15. EBITDA Evolution
R$ million
+61.4% +3.1% +36.8% +14.0% -4.5% +5.7% +23.7%
113 (76)
321 (163)
20 (48) (26) 1,538
1,396
+10.1%
3Q09 Data + Voice + H. R. Service Goods Selling Others 3Q10
VAS others Rendered Sold Expenses
Revenues Costs
C
15
16. EBITDA and Margin
g
R$ million
Financial discipline maintain
QoQ YoY
expenses growth under control
14.5% 10.1%
EBITDA EBITDA Margin
• 3Q09 was benefited by non
Q y
recurrent effects in the amount
of R$78 million
16
17. EBIT and Financial Result
R$ million
EBIT FINANCIAL RESULT
3Q09 2Q10 3Q10
+ 62.3%
982
(64)
(98) (101)
605
503
3Q09 2Q10 3Q10
17
18. Net Result and Cash Flow
R$ million
Net Result Cash Flow
+ 81%
+ 155%
Profit Evolution
fi l i
235 35 (142)
602
141
333
+81%
18
19. Gross and Net Debt
R$ million
Gross Debt Net Debt
- 17.1% - 43.2%
- 6.6% -28.1%
5,167.3
5 167 3 4,245.1
4 245 1
4,588.4
4,284.5 3,355.3
68% 2,411.8
78% 81%
32% 22% 19%
3Q09 2Q10 3Q10 3Q09 2Q10 3Q10
Short Term Long Term
Credit Rating: ‘brAAA’
19
21. Investors and
Shareholders
Customers
VIVO VALUES
VIVO VALUES
Trust
Enthusiasm
Interaction
Quality
Simplicity
Employees and Sustainability
Partners
Businesses
B i
21