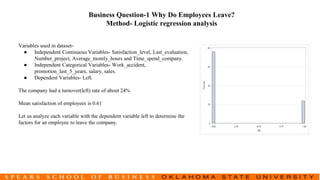
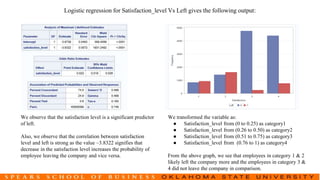
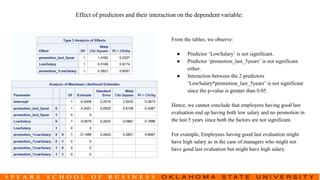
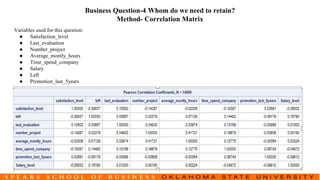
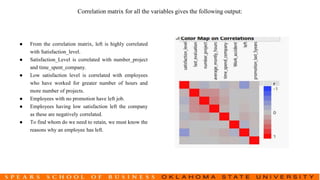
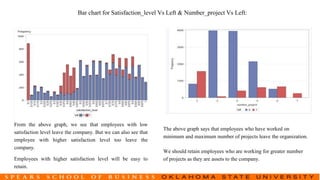
Malegaon Call Girls Service ☎ ️82500–77686 ☎️ Enjoy 24/7 Escort Service
Database Marketing Project Slides
1. MKTG 5983 - Database Marketing - Final Project
Group-14
Dataset- Human Resources Analytics
Why are our best and most experienced employees leaving prematurely?
Group Members:
Bhavana Baheti (A20115372)
Chakradhar Pathi (A20096739)
Ishan Malpotra (A20104861)
Mrunali Kadam (A20114076)
Ravali Musty (A20101635)
2. Scope of the project:
Human resources data which contains the employee’s features in his stint at the organization. The behavioral aspects of an employee
are analyzed against organizational features to make informed decisions. There might be several aspects that influence employee’s
productivity at the company like high job satisfaction, good pay etc. Inversely there might be factors that drive him to leave the
company. A good analysis is necessary to understand what factors are impacting the most. In our dataset we deal with around 15000
employees in company and 10 features.
Primary focus is on the following questions:
1. Why do employees leave?
2. What are the factors that keep employees satisfied in the job?
3. Do employees who have good last evaluation end up with low salary or no promotion?
4. Whom do we need to retain?
Overview
3. Variables used in dataset-
● Independent Continuous Variables- Satisfaction_level, Last_evaluation,
Number_project, Average_montly_hours and Time_spend_company.
● Independent Categorical Variables- Work_accident,
promotion_last_5_years, salary, sales.
● Dependent Variables- Left.
The company had a turnover(left) rate of about 24%
Mean satisfaction of employees is 0.61
Let us analyze each variable with the dependent variable left to determine the
factors for an employee to leave the company.
Business Question-1 Why Do Employees Leave?
Method- Logistic regression analysis
4. Logistic regression for Satisfaction_level Vs Left gives the following output:
We observe that the satisfaction level is a significant predictor
of left.
Also, we observe that the correlation between satisfaction
level and left is strong as the value –3.8322 signifies that
decrease in the satisfaction level increases the probability of
employee leaving the company and vice versa.
We transformed the variable as:
● Satisfaction_level from (0 to 0.25) as category1
● Satisfaction_level from (0.26 to 0.50) as category2
● Satisfaction_level from (0.51 to 0.75) as category3
● Satisfaction_level from (0.76 to 1) as category4
From the above graph, we see that employees in category 1 & 2
likely left the company more and the employees in category 3 &
4 did not leave the company in comparison.
5. Logistic regression for Last_evalutation Vs Left gives the following output:
From the above graph, we observe that the distribution is
bimodal.
Employees with Category 2(low) & 4(high) more likely left the
company and employees with Category 3(medium) rarely left
the company.
We transformed the variable as:
● Last_Evaluation from (0 to 0.25) as category1
● Last_Evaluation from (0.26 to 0.50) as category2
● Last_Evaluation from (0.51 to 0.75) as category3
● Last_Evaluation from (0.76 to 1) as category4
6. Logistic regression for Number_project Left gives the following output:
We observe from the above table that Numer_project
is a significant predictor of left.
We also observe that the correlation between project
number and left is 0.0451. Hence, there is not much
correlation between the two variables.
Further, looking into the plot above we interpret that the
employees having Number_project as 2, 6 and 7 most likely
left the company.
7. Logistic regression for Time_Spend_Company Vs Left gives the following output:
We observe Time_Spend_Company is a significant predictor
of left since the p-value is less than 0.05.
We also see the correlation between Time_Spend_Company
and left is 0.2107 which means for every 1 year increase in
the time spend at the company, the probability of employee
leaving the company increased by 0.2107.
From the above graph, we see that the employees who worked for 5
years left the company more likely.
In contrast, the employees who worked for 6 years or more did not
leave the company.
The employees who spent 2 years at the company rarely left.
8. Logistic regression for Promotion_last_5 years Vs Left gives the following output:
We can see from the above table that ‘promotion_last_5years’ is a significant predictor of left .
We also observe that the correlation between ‘promotion_last_5years’ and left is strong with value -1.6174 which signifies that for each
promotion an employee gets, the probability of him leaving the company decreases by -1.6174.
From the above graph we observe that the employees who are promoted in last 5 years are more likely to stay in the company than the
employees who are not promoted.
9. Logistic regression for Average_montly_hours Vs Left gives the following output:
We observe from the above table that the
‘Average_monthly_hours’ is a significant predictor of left.
We also observe that the correlation between
‘Average_monthly_hours’ and left is 0.00336 i.e., for each
unit increase in ‘Average_monthly_hours’, increase 0.00336
units of the probability of employee leaving the company.
From the above graph, it is clearly seen that the employees who spent
more numbers of monthly hours more likely left the company.
In addition, we can also see that a portion of employees with low
‘average_monthly_hours’ also likely left the company.
10. Logistic regression for Work_accident Vs Left gives the following output:
We can see from the above table that the ‘Work_accident’ is
a significant predictor of left.
We also see that the correlation between Work accident and
left is 1.4517.
The above graph says that the employees who did not leave the
company are the employees who encountered the work_accident.
However, this is in contrast to the real scenario.
11. Logistic regression for Salary Vs Left gives the following output:
From the above table, we see that the Salary is a significant
predictor of left.
Also we can see the correlation between Salary(high) and left
is -1.2856 when you are controlling for Salary(low).
From the above graph, we can interpret that employees with low and
medium salaries likely left the company.
And the employees with high salaries rarely left the company.
12. Logistic regression for Department Vs Left gives the following output:
From the above table, we observe that overall model is significant for department.
We can clearly see from the graph that the sales, support and technical departments have the highest attrition rate. The management
department has the lowest attrition rate.
13. Stepwise logistic regression is used to check the significant predictors of the model
The above Summary table and likelihood estimates mentions all the
significant predictors which fit the model.
14. Summary
● Barely any employees left with high salary
● Employees with low to average salaries tend to leave the company.
● More than half of the employees with 2,6, and 7 projects left the company
● All of the employees with 7 projects left the company
● There is an increase in employee turnover rate as project count increases
● Employees with low performance tend to leave the company more
● Employees with high performance tend to leave the company more
● The employees that stayed is within 0.6-0.8 evaluation
● Employees who had less hours of work (~150 hours or less) left the company
more
● Employees who had too many hours of work (~250 or more) left the company
● Employees who had really low satisfaction levels (0.2 or less) left the company
more
● Employees who had low satisfaction levels (0.3~0.5) left the company more
● Employees who had really high satisfaction levels (0.7 or more) left the company
more.
15. The Multiple regression for Satisfaction_level as dependent
variable and all the other independent variables is performed
using the stepwise method.
Stepwise method gives all significant factors and determines
the satisfaction level of the employees.
We clearly see the factors that determine the satisfaction level
of the employee are the variables-
● Last_Evaluation
● Number_Project
● Average_monthly_hours
● Time_spend_company
● Left.
The below model explains 19.79% of the variability.
From the ANOVA model, we can conclude the overall model
is significant as p<0.0001
We analyze each of the variables individually on how they
determine the satisfaction level of the employee without
taking into account the controlling of other variables.
Business Question-2 What are the factors that keep employees satisfied in the job?
Method - Multiple regression analysis
16. Bar chart of Satisfaction_level(Mean) vs Left & Satisfaction_level(Mean) vs Number_project:
From the graph, we observe that all the employees
who haven’t left the company have a mean
satisfaction level of 0.67.
All employees who left the company have a mean
satisfaction level of 0.44 which makes logical sense
as only the people who are least satisfied tend to
leave the company.
From the above graph, employees having 4 projects
have the highest mean satisfaction level.
The most satisfying employees in the organization have
projects between 3 to 5.
Those Employees who have 7 projects have the least
mean satisfaction levels which makes sense.
17. Bar chart of Satisfaction_level(Mean) Vs Time_spent_company & Scatterplot of Satisfaction_level vs
Average_monthly_hours:
From the above graph, we see that Satisfaction_level was
high for the employees who are just about 2 to 3 years old
in the company.
Mean satisfaction_level was the lowest for the employees
who have worked for 4 years.
The mean satisfaction level gradually increases as the
employee spends longer than 4 years with the company.
The above graph points out that the least satisfied employees are the
ones who work more than 240 monthly hours on an average.
The employees who work on an average of 140 to 275 monthly hours
have good satisfaction levels.
A fair bunch of employees have an average satisfaction level of 0.4
who work on an average of 130 to 160 hours indicating that they
would be more satisfied if they are assigned more work than the
usual less amount of work.
18. Bar chart of Satisfaction level(Mean) vs Last_Evaluation:
We interpret the graph as:
● The employees whose satisfaction level was low
were the ones who couldn’t perform well as their
Last_Evaluation falls in category 2.
● The employees whose satisfaction level was high
were the ones who were appreciated well for their
performance as their Last_Evaluation falls in
category 3.
● The employees whose satisfaction level was good
were the ones whose last_evaluation falls in the
category 4. Probably the employees are not getting
enough appreciation for their work and hence their
satisfaction level was not as high as the employees
whose Last_Evaluation falls in category 3.
Firstly, The Last_Evaluation continuous variable has been
converted to a categorical variable for easy analysis.
We transformed the variable as:
● Last_Evaluation from (0 to 0.25) as category1
● Last_Evaluation from (0.26 to 0.50) as category2
● Last_Evaluation from (0.51 to 0.75) as category3
● Last_Evaluation from (0.76 to 1) as category4
19. Summary
● Factors that determine the satisfaction level of the employee are the variables - Last_Evaluation, Number_Project,
Average_monthly_hours, time_spend_company, Left.
● Employees who haven’t left the firm have a better satisfaction levels compared to the employees who have left.
● Employees who have the average number of projects between 3 and 5 have the most satisfaction levels.
● Employees who work on an average of 140 to 275 monthly hours have the best satisfaction levels.
● Employees who have Last_Evaluation as 3 (good) or 4 (very good) are happy and have good satisfaction levels.
● Employees who spent time in the company between 2 to 3 years and over 5 years are well satisfied.
20. Question 3 - Do employees who have good last evaluation end up with low salary or no promotion?
Method - Logistic Regression
● A narrowed analysis
● Dependent variable - Employees with good last
evaluation.
● Dependent variable - Transformed to categorical
variable with good last evaluation.
● New dependent variable - ‘Good Evaluation’
● Predictor ‘salary’ is transformed to ‘LowSalary’
● Logistic regression performed-
○ ‘Good Evaluation’ - dependent variable
○ ‘LowSalary’ - Predictor 1
○ ‘promotion_last_5years’ - Predictor 2
● Interaction term ‘LowSalary*promotion_last_5years’
is also considered.
21. Effect of predictors and their interaction on the dependent variable:
From the tables, we observe:
● Predictor ‘LowSalary’ is not significant.
● Predictor ‘promotion_last_5years’ is not significant
either.
● Interaction between the 2 predictors
‘LowSalary*promotion_last_5years’ is not significant
since the p-value is greater than 0.05.
Hence, we cannot conclude that employees having good last
evaluation end up having both low salary and no promotion in
the last 5 years since both the factors are not significant.
For example, Employees having good last evaluation might
have high salary as in the case of managers who might not
have good last evaluation but might have high salary.
22. Business Question-4 Whom do we need to retain?
Method- Correlation Matrix
Variables used for this question:
● Satisfaction_level
● Last_evaluation
● Number_project
● Average_montly_hours
● Time_spend_company
● Salary
● Left
● Promotion_last_5years
23. Correlation matrix for all the variables gives the following output:
● From the correlation matrix, left is highly correlated
with Satisfaction_level.
● Satisfaction_Level is correlated with number_project
and time_spent_company.
● Low satisfaction level is correlated with employees
who have worked for greater number of hours and
more number of projects.
● Employees with no promotion have left job.
● Employees having low satisfaction left the company
as these are negatively correlated.
● To find whom do we need to retain, we must know the
reasons why an employee has left.
24. Bar chart for Satisfaction_level Vs Left & Number_project Vs Left:
From the above graph, we see that employees with low
satisfaction level leave the company. But we can also see that
employee with higher satisfaction level too leave the
company.
Employees with higher satisfaction level will be easy to
retain.
The above graph says that employees who have worked on
minimum and maximum number of projects leave the organization.
We should retain employees who are working for greater number
of projects as they are assets to the company.
25. Bar chart for Last_Evaluation Vs Left & Average_monthly_hours Vs Left:
From the above graph, we observe that employees with least
and higher last_evaluation leave the company.
Employees with least last_evaluation between 0.36 and 0.44
might be those who have joined company recently.
Employees with higher last_evaluation should be retained as
they are an asset to the company.
The above graph suggests that employees with highest
average_monthly_hours and lowest average_monthly_hours
have left organization.
Hence, number of average_monthly_hours for employee on
higher end can be reduced to retain the employee
26. Bar chart for Salary Vs Left:
From the above graph, we observe that employees with low
salary level(3) and medium salary level(2) have left
organization
Very few employees with high salary do not leave
organization.
Salary of employees should be increased if we need to retain
them.
Summary
Following are the employees organization needs to retain.
● Employees having higher last_evaluation rate are
assets to an organization and should be retained.
● Employees who are working for more number of
projects.
● Employees who have average_working_hours value
between 159 to 213 hours are most likely to not leave
organization.
● Employees who are working for higher than
average_working_hours can be retained.
● Employees having higher satisfaction_level are easy
to retain as they are satisfied with the organization.