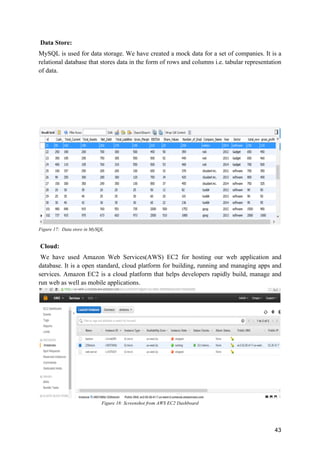
SlideShare a Scribd company logo
1
Project Report
On
COMPANY STOCKS PREDICTION
CMPE 239 Web And Data Mining
By: Team- Data Crunchers
Ashish Srivastava (009606571)
Chhavi Gupta (010106616)
Jay Vora (010126714)
Shubhi Yede (010038730)
Surbhi Garg (010090210)
2
ACKNOWLEDGMENT
We, Team: Data Crunchers, take this opportunity to thank Prof. Chandrasekar
Vuppalapati, for his constant support, co-ordination and encouragement. The
lectures helped us in experimenting new technologies and think in a different
way. We also thank him for his patience during the course of the project.
We are also grateful to our friends for their support and feedback about our
Project.
3
ABSTRACT:
Forecasting stock return is an important financial subject that has attracted researcher’s
attention for many years. It involves an assumption that fundamental information publicly
available in the past has some predictive relationships to the future stock returns. This study
tries to help the investors in the stock market to decide the better timing for buying or selling
stocks based on the knowledge extracted from the historical prices of such stocks. The
decision taken will be based on the data mining techniques such as K-Means Clustering, TF-
IDF, Single Value Decomposition and Vector Space Model.
This project focuses on the predicting future stocks of companies in IT sector based on the
company’s past 3 years of data and Twitter data. The purpose is to provide a systematic
analysis of the company’s financial data and determine company’s future stocks. In twenty
first century, stocks have become the most prominent factor to determine the growth for
companies. Therefore forecasting their stocks will help them in the world of globalization and
increasing economy, and to compete with other companies to achieve optimum share in the
market. This prediction will also be helpful for those who wish to invest in stock market.
4
Table of Contents
1. PROJECT DESCRIPTION:......................................................................5
2. REQUIREMENTS:...................................................................................6
3. UI DESIGN PRINCIPLES–STORYBOARD, WIREFRAMES:..............7
4. HIGH LEVEL ARCHITECTURE DESIGN:..........................................12
5. DATASETS AND DATA PATTERNS:..................................................13
6. DATA ARCHITECTURE:.......................................................................14
7. DATA FLOW DIAGRAM:......................................................................15
8. DATA MINING PRINCIPLES AND ALGORITHMS:..........................23
9. KDD PRINCIPLES:.................................................................................32
10. DATA TOOLS:........................................................................................35
11. DESIGN PATTERNS..............................................................................36
12. Node JS Express MVC framework:.........................................................36
13. Front End – EJS:.......................................................................................36
14. Middle tier-Express:.................................................................................39
15. Data Store:................................................................................................43
16. Cloud:.......................................................................................................43
17. CLIENT SIDE
DESIGN:..................................................................................................43
18. LOAD
TESTING:................................................................................................47
19. REFERENCES:.......................................................................................50
PROJECT DESCRIPTION: Motivation
In this project, we have implemented the Data mining techniques, which have been applied
for stock trading to predict the rise and fall of stock prices before the actual event of an
increase, or decrease in the stock price occurs. In particular the project will demonstrate the
application of Support Vector Machines, Linear Regression, Prediction using Naïve Bayes
Algorithm, State vector model, Vector Space Model and k-means in detail along with the
benefits and pitfalls of each method. The project introduces the parameters and variables that
can be used in order to recognize the patterns in stock prices which can be helpful in the
future prediction of stocks and how they can be combined with other algorithms to improve
the accuracy of such prediction systems. Note: The main goal of the project was to study and
apply as many data mining algorithms as possible on a dataset involving a particular domain,
namely the Stock Market, as opposed to coming up with a newer (and/or better) algorithm
that is more efficient in predicting the price of a stock. We have tried to briefly research the
background which is essential to the study of the domain of financial prediction systems. We
have showcased the results obtained from the application of the algorithms we have used by
5
plotting various kinds of graphs which are simpler and amenable to an end user
understanding on the financial dataset in the project.
The stock market is an essential way for companies to raise money. Companies can raise
additional financial capital by being publicly traded in order to expand their business by
selling shares of ownership. Historically it is known that share prices can have a major
influence on economic activities and can be an indicator of social mood. The stock market
movements has always been a rich and interesting subject with such many factors to be
analyzed that for a long time it would be considered unpredictable. The application of new
computerized mathematical methods over the past few decades developed by companies such
as Merrill Lynch and other financial management companies have created models that can
maximize their returns while minimizing their risks. Stock market prediction has been around
for years but it has been giving a new method of prediction thanks to the rise of social media.
The objective of this project is to analyze Twitter feeds for activities and trends associated
with a brand and to see how their stock market shares are related and if they are affected to
the twitter activity. This analysis will look at the relationship of the amount of tweets for
specific brands on NASDAQ such as IBM, FB, and Picasa etc. These brands where chosen
since they are innovative technology companies that are on the same stock exchange.
Therefore gathering of the twitter data was not time zone dependent. Sample stock market
data was collected from the Yahoo Finance website, there they provide historical data for the
NASDAQ. Java scripts were used to acquire the tweets through Twitters API service. The
Tweets for each brand were then counted using Amazon Web Service and Text Wrangler.
The counted tweets were subsequently analyzed using R studio. The Data was the visualized
using high charts and a user friendly analysis using various kinds of graphs will be presented
to the end user.
Figure 1: Stock Market Prediction
6
REQUIREMENTS:
1. Twitter Feeds:
Feed pages should be present in the system to update the latest feeds continuously,
based on the user preferences and search history.
2. Hashtag Sentiment Streaming:
Streaming of tweets could be done based on keywords that are most popularly
tweeted.
3. Financial Data:
Financial Data of companies are required in order to process the data.
UI DESIGN PRINCIPLES–STORYBOARD, WIREFRAMES:
7
Figure 2- Wireframe
Figure 3 – Wireframe
Storyboard Events:
1. User browses through our website
2. Selects the Predict tab where you enter the company’s name and the criteria which talks
about the company
3. Click on Analyze button.
4. HighChart would be displayed for that company
5. Click on Start Prediction.
6. Bar graph is displayed with positive, negative and neutral twitter sentiments.
ANDROID APP:
We have Created Web-Hybrid Android App. Hybrid applications are coded in HTML, CSS
and JavaScript. They are run through the invisible browser that is packaged into a native
application.
· Can access Native APIs
· Distribute through App Stores
· Can run on multiple platforms
Tools Used:
· Android Studio
· GenyMotion for emulation
Screenshots:
8
Figure 4 – Home Screen
Figure 5 – Team Information
9
Figure 6 – Enter Company to predict its Stocks
Figure 7 – Data from Twitter
Source Code:
import android.os.Bundle;
import android.support.design.widget.FloatingActionButton;
import android.support.design.widget.Snackbar;
import android.support.v7.app.AppCompatActivity;
import android.support.v7.widget.Toolbar;
import android.view.View;
import android.view.Menu;
import android.view.MenuItem;
10
import android.webkit.WebView;
public class Main extends AppCompatActivity {
@Override
protected void onCreate(Bundle savedInstanceState) {
super.onCreate(savedInstanceState);
setContentView(R.layout.activity_main);
Toolbar toolbar = (Toolbar) findViewById(R.id.toolbar);
setSupportActionBar(toolbar);
String url = "http://10.189.107.200:3000/";
WebView view = (WebView) this.findViewById(R.id.webView);
view.loadUrl(url);
FloatingActionButton fab = (FloatingActionButton) findViewById(R.id.fab);
fab.setOnClickListener(new View.OnClickListener() {
@Override
public void onClick(View view) {
Snackbar.make(view, "Replace with your own action",
Snackbar.LENGTH_LONG)
.setAction("Action", null).show();
}
});
}
@Override
public boolean onCreateOptionsMenu(Menu menu) {
// Inflate the menu; this adds items to the action bar if it is present.
getMenuInflater().inflate(R.menu.menu_main, menu);
return true;
}
@Override
public boolean onOptionsItemSelected(MenuItem item) {
// Handle action bar item clicks here. The action bar will
// automatically handle clicks on the Home/Up button, so long
// as you specify a parent activity in AndroidManifest.xml.
int id = item.getItemId();
//noinspection SimplifiableIfStatement
if (id == R.id.action_settings) {
return true;
}
return super.onOptionsItemSelected(item);
}
}
AndroidManifest.xml
11
<?xml version="1.0" encoding="utf-8"?>
<manifest xmlns:android="http://schemas.android.com/apk/res/android"
package="com.example.chhavigupta.dataapp">
<uses-permission android:name="android.permission.INTERNET"/>
<application
android:allowBackup="true"
android:icon="@mipmap/ic_launcher"
android:label="@string/app_name"
android:supportsRtl="true"
android:theme="@style/AppTheme">
<activity
android:name=".Main"
android:label="@string/app_name"
android:theme="@style/AppTheme.NoActionBar">
<intent-filter>
<action android:name="android.intent.action.MAIN" />
<category android:name="android.intent.category.LAUNCHER" />
</intent-filter>
</activity>
</application>
</manifest>
HIGH LEVEL ARCHITECTURE DESIGN:
12
Figure 8: High Level Architecture
Description:
1. Data are stored in MySQL database.
2. Dataset from MySQL is fetched to perform computation.
3. We are running predictive algorithm on the fetched data.
4. The algorithm scans through all the fetched data and predicts the result.
5. The result is passed to the visualization tool.
6. Using high charts, the data is represented on our web application.
13
Figure 9: Flow: High Level Architecture
DATASETS AND DATA PATTERNS:
Figure 10: Data Patterns
DATA ARCHITECTURE:
14
Figure 11: Architecture for twitter sentiment analysis
Description:
1. Need to do twitter authentication so that one can access twitter data.
2. Pull out the tweets from twitter which are based on user input
3. As we only need text we have to filter out the tweets
4. Retweets are not necessary we have to remove them
5. Delete all special character and digits
6. Delete hyperlinks and spaces
7. Delete all tagging i.e @ people
8. This will all result in the preprocessed data
9. Now apply SVD, K-Means Clustering, SVM, TF-IDF
This algorithm displays a bar graph with positive, negative and neutral sentiments as shown
above.
Data Flow Diagram:
15
Figure 12: Data Flow Diagram
Twitter Data Analysis: Source Code:
/**
* AFINN-based sentiment analysis for Node.js
*
* @package sentiment
* @author Shubhi Yede <shubhi.yede@gmail.com>
*/
/**
* Dependencies
*/
var extend = require('extend-object');
var afinn = require('../build/AFINN.json');
/**
* Tokenizes an input string.
*
* @param {String} Input
*
* @return {Array}
*/
function tokenize (input) {
//console.log(input);
var result = input
.replace(/[^a-zA-Z- ]+/g, '')
.replace('/ {2,}/',' ')
.toLowerCase()
.split(' ');
//console.log(result);
return result;
}
function log10(val) {
return Math.log(val) / Math.LN10;
16
}
function TF(freq){
var tf=1+log10(1+log10(freq));
return tf;
}
function IDF(d,dt){
var idf=log10((1+d)/dt);
return idf;
}
function cosineDistance(v1, v2){
var numerator=0,sqrt_v1=0,sqrt_v2=0;
for(var i=0; i<v1.length; i++){
numerator+=v1[i]*v2[i];
sqrt_v1+=Math.pow(v1[i],2);
sqrt_v2+=Math.pow(v2[i],2);
}
sqrt_v1 = Math.sqrt(sqrt_v1);
sqrt_v2 = Math.sqrt(sqrt_v2);
var denominator = sqrt_v1 * sqrt_v2;
if(denominator > 0){
var cosineDistance = numerator / denominator;
return cosineDistance;
}
else
return 0;
}
function cosineSimilarity(v1,v2){
var angle=Math.acos(cosineDistance(v1, v2));
angle=Math.round(angle * 100) / 100;
return angle;
}
function mult(X, Y){
//X (r1 x c1) Y(r2 x c2)
//c1 == r2
console.log("X rows = "+ X.length + " X columns = "+ X[0].length+ " Y rows = " +
Y.length + " Y columns = " + Y[0].length);
if(X[0].length != Y.length){
console.log('Invalid dimension!');
return null;
}
// dimensions
var m = X.length, n = Y[0].length, d = Y.length;
// multiplication
var Z = new Array(X.length);
for(var i = 0; i < X.length; ++i){
17
Z[i] = new Array(Y[0].length);
for(var j = 0; j < Y[0].length; ++j){
Z[i][j] = X[i].map(function(x, k){
return x * Y[k][j];
}).reduce(function(a, b){ return a + b; }, 0);
}
}
return Z;
}
/**
* Performs sentiment analysis on the provided input "phrase".
*
* @param {String} Input phrase
* @param {Object} Optional sentiment additions to AFINN (hash k/v pairs)
*
* @return {Object}
*/
module.exports = function (phrase, inject, callback) {
// Parse arguments
if (typeof phrase === 'undefined') phrase = '';
if (typeof inject === 'undefined') inject = null;
if (typeof inject === 'function') callback = inject;
if (typeof callback === 'undefined') callback = null;
// Merge
if (inject !== null) {
afinn = extend(afinn, inject);
}
// Storage objects
/*
column=words
rows=tweets_word_freq
stock, equity, asset, liability, revenue, EBITDA, profit, loss, cash, up, down
tw1
tw2
tw3
tw4
tw5
*/
var counter = [0,0,0,0,0,0,0,0,0,0,0];
var vsm = [];
//stock equity asset liability revenue EBITDA profit loss cash up down
var relevant_words = ["stock", "equity", "asset", "liability", "revenue", "EBITDA",
"profit", "loss", "cash", "up","down"];
var relevant_words_weight = [3,3,3,3,3,3,3,3,3,3,3];
var score=0;
console.log("VSM:");
//console.log("phrase.length:"+phrase.length);
18
var new_row_vector = [];
for(var i=0; i<phrase.length ; ++i){
//Tokenization
var tokens = tokenize(phrase[i]);
var len = tokens.length;
new_row_vector = [0,0,0,0,0,0,0,0,0,0,0];
while (len--) {
var word = tokens[len];
if (!afinn.hasOwnProperty(word)){
continue;
}
var weight = afinn[word];
//to measure if tweet is positive or negative
score += weight;
//Vector Space Model
//to find if tweet is relevant or irrelevant
var index = relevant_words.indexOf(word);
if(index > -1){
new_row_vector[index]+=relevant_words_weight[index];
counter[index]+=1;
}
}
vsm.push(new_row_vector);
//console.log(new_row_vector);
//console.log("score="+score);
}
//Display Vector Space Model
for(var i=0; i<vsm.length; ++i){
console.log(vsm[i]);
}
//TF-IDF
var idf_array = [];
var d=vsm.length;
for(var i=0; i<11; ++i){
var dt=counter[i];
idf_array.push(IDF(d,dt));
}
var TD_IDF_matrix = vsm;
console.log("TF-IDF");
var tweetTF_IDF_Weight = [];
var maxWeight = -1000;
var minWeight = 1000;
19
var maxWeightTweet = -1;
var minWeightTweet = -1;
var weightSum=0;
for(i=0; i<vsm.length; ++i){
weightSum=0;
for(j=0; j<11; ++j){
if(vsm[i][j] > 0){
//tf-idf weight of relevant_word[j] in tweet[i] is given by:
TD_IDF_matrix[i][j]=TF(vsm[i][j])*idf_array[j];
TD_IDF_matrix[i][j]=Math.round(TD_IDF_matrix[i][j] * 100) / 100;
weightSum+=TD_IDF_matrix[i][j];
}
console.log(TD_IDF_matrix[i]);
}
tweetTF_IDF_Weight.push(weightSum);
if(weightSum < minWeight){
minWeightTweet=i;
minWeight=weightSum;
}
if(weightSum > maxWeight){
maxWeightTweet=i;
maxWeight=weightSum;
}
}
console.log("maxWeightTweet="+maxWeightTweet+ " and its weight="+maxWeight);
console.log("minWeightTweet="+minWeightTweet+ " and its weight="+minWeight);
//Cosine similarity
console.log("Cosine similarity:");
/*
var cosineAngle_matrix = [];
console.log("totalTweets="+totalTweets);
for(i=0; i<totalTweets-1; ++i){
var v1 = vsm[i];
for(j=i+1; j<totalTweets ; ++j){
var v2 = vsm[j];
cosineAngle_matrix.push([i,j,cosineSimilarity(v1,v2)]);
}
}
//Display Cosine Similarity
for(var i=0; i<cosineAngle_matrix.length; ++i){
console.log(cosineAngle_matrix[i]);
}
*/
var vector1 = vsm[maxWeightTweet];
var vector2 = vsm[minWeightTweet];
var maxAngle = cosineSimilarity(vector1,vector2);
20
console.log("Opposite tweets deflect by "+maxAngle);
//LSA using SVD
var svd = require('node-svd').svd;
console.log('-----calculating svd-----');
var res = svd(vsm, 0, { U: true, V: true, debug: 2});
console.log('---');
var U = res.U;
var S = res.S;
var V = res.V;
console.log('U = %s', JSON.stringify(U));
console.log('S = %s', JSON.stringify(S));
console.log('V = %s', JSON.stringify(V));
var rows, columns;
rows=vsm.length;
columns = vsm[0].length;
console.log('vsm is a '+rows+' by '+columns+' matrix');
rows=U.length;
columns = U[0].length;
console.log('U is a '+rows+' by '+columns+' matrix');
//console.log('U = %s', JSON.stringify(U));
//Displaying U
for (i=0; i<rows; ++i){
for (j=0; j<columns; ++j){
//U[i][j]=Math.round(U[i][j] * 100) / 100;
process.stdout.write(U[i][j]+', ');
}
process.stdout.write('n');
}
var newS = [];
console.log("Creating New S ");
for (i=0; i<S.length; ++i){
var tuple = [];
for(j=0; j<S.length; ++j){
tuple.push(0);
}
var temp = tuple;
temp[i] = S[i];
newS.push(temp);
}
rows=newS.length;
columns = newS[0].length;
console.log('!!!!!!! newS is a '+rows+' by '+columns+' matrix');
21
//Displaying newS
for (i=0; i<rows; ++i){
for (j=0; j<columns; ++j){
process.stdout.write(newS[i][j]+', ');
}
process.stdout.write('n');
}
rows=V.length;
columns = V[0].length;
console.log('V is a '+rows+' by '+columns+' matrix');
//Displaying V
for (i=0; i<rows; ++i){
for (j=0; j<columns; ++j){
//V[i][j]=Math.round(V[i][j] * 100) / 100;
process.stdout.write(V[i][j]+', ');
}
process.stdout.write('n');
}
//features in decending order in S ...
var feature1 = S[0]; //strongest
var feature2 = S[1]; //next strongest
var VS = mult(V,newS);
rows=VS.length;
columns = VS[0].length;
console.log('VS is a '+rows+' by '+columns+' matrix that describes relation between
relevant words and features');
//Displaying VS
for (i=0; i<rows; ++i){
for (j=0; j<columns; ++j){
process.stdout.write(VS[i][j]+', ');
}
process.stdout.write('n');
}
//Determining which relevant word is part of which of the two stongest features.
var feature1Words = [];
var feature2Words = [];
var feature1Sentiment=0;
var feature2Sentiment=0;
for (i=0; i<rows; ++i){
if(VS[i][0] > VS[i][1]){
feature1Words.push(relevant_words[i]);
if(afinn.hasOwnProperty(relevant_words[i])){
var weight = afinn[relevant_words[i]];
22
feature1Sentiment+=weight;
}
}
else if(VS[i][0] < VS[i][1]){
feature2Words.push(relevant_words[i]);
if(afinn.hasOwnProperty(relevant_words[i])){
var weight = afinn[relevant_words[i]];
feature2Sentiment+=weight;
}
}
}
console.log("Feature1 words = "+feature1Words);
console.log("Feature2 words = "+feature2Words);
var US = mult(U,newS);
rows=US.length;
columns = US[0].length;
console.log('US is a '+rows+' by '+columns+' matrix that describes relation between tweets
and features');
var tweetCoordinates = [];
for (i=0; i<rows; ++i){
for (j=0; j<columns; ++j){
process.stdout.write(US[i][j]+', ');
}
// f1:x-axis,f2:y-axis
tweetCoordinates.push([US[i][0],US[i][1]]);
process.stdout.write('n');
}
rows=tweetCoordinates.length;
columns = tweetCoordinates[0].length;
console.log('tweetCoordinates is a '+rows+' by '+columns+' matrix');
for (i=0; i<rows; ++i){
for (j=0; j<columns; ++j){
process.stdout.write(tweetCoordinates[i][j]+', ');
}
process.stdout.write('n');
}
//k-means clustering
var clusterfck = require("clusterfck");
var kmeans = new clusterfck.Kmeans();
// Calculate clusters.
var clusters = kmeans.cluster(tweetCoordinates, 2);
console.log('clusters matrix');
for (i=0; i<clusters.length; ++i){
console.log("cluster "+i+1);
23
for (j=0; j<clusters[i].length; ++j){
process.stdout.write(clusters[i][j]+' ; ');
}
process.stdout.write('n');
}
console.log("CLUSTERING RESULT");
console.log("Cluster 1 for words: ["+feature1Words+"] is of
density="+clusters[0].length+" and sentimentScore="+feature1Sentiment);
console.log("Cluster 2 for words: ["+feature2Words+"] is of
density="+clusters[1].length+" and sentimentScore="+feature2Sentiment);
var result = {
score: score,
vsm: vsm,
feature1Words: feature1Words,
feature2Words: feature2Words,
feature1Sentiment: feature1Sentiment,
feature2Sentiment: feature2Sentiment,
VS: VS,
US: US,
clusters: clusters
};
if (callback === null) return result;
process.nextTick(function () {
callback(null, result);
});
};
DATA MINING PRINCIPLES AND ALGORITHMS:
Company Stock Prediction- The project is using Predictive Analysis.
Predictive Analytics:
Predictive analytics is not the actual outcome that would take place in future. It is just a
method or form of extracting/generating useful information, from the existing data sets, so as
to regulate patterns that could help us determine, or in other words, ‘predict’ the future trends
and outcomes.
For this purpose of analyzing and predicting the unknown future trends, we make use of
variety of techniques from data mining, modeling and machine learning. These techniques
understand and analyze both, the past and current data, to make analysis and predictions for
future.
Ample of industries make use of this predicated analysis in there day-to-day work and its
demand is increasing in other fields as well.
Marketing, health-cares, travel, retailers, insurance, fraud detection and many other fields
have also realized the usefulness of predictive analysis.
24
Predictive Modeling or Predictive analytics is nothing but an area of data mining where its
objective is to extract useful knowledge from the available data (past and present) and use the
same knowledge for identifying patterns and predict behavior of future.
Predictive Models Usage:
Predictive Models are used to predict the future outcome by performing comparison of the
values with huge data sets. In our project, we are predicting company’s stocks based on its
past year’s data.
Benefits of Predictive Modeling:
· It enhances the efficiency and truthfulness of our predictions
· Helps us get accurate and reliable results.
· Helps in building efficient models that work more with the limited data provided
· Reduces pain of adjusting and calculating values each time, saving time.
· It provides better diagnostics that help in better managing, controlling and decision-
making process.
1. Vector Space Model:
In order to find similarity and relationship between each query interface, we use
a Vector Space Model representation of these interfaces. The query interfaces in
the deep web can be represented as a set of interfaces and a set of attributes of
these interfaces [1].
A = {a1,a2,...am} (1)
F = {f1, f2,... fn} (2)
Where F is a set of n query interfaces and A is a set of m attributes of query
interfaces. To represent query interface in the form of a Vector Space Model we
take F as the column index of the VSM matrix and A as row index of VSM. It
compares query interface with attributes and hence ranks the query interfaces
based on their similarity with each other. The query interfaces are represented in
the form of a vector and the attributes are the dimensions of the vector space.
The Vector Space Model is a high dimensional m x n matrix denoted by C(m×n) .
vfn
! "!
= tf a1, fn( ),tf a2, fn( ),tf a3, fn( ),....,tf am, fn( )( )(3)
Here vfn
! "!
is the query interface vector.
C(m×n) f1 f2 … fn
a1 tf a1, fn( ) tf a1, fn( ) … tf a1, fn( )
a2 tf a1, fn( ) tf a1, fn( ) … tf a1, fn( )
25
… … … …
am tf a1, fn( ) tf a1, fn( ) … tf a1, fn( )
Table. 1. Represents high dimensional VSM matrix C(m×n)
plotting query interface vectors against their attributes. Here
tf am, fn( ) is the term frequency of attribute am
in query interface fn
.
A. Calculate TF-IDF weight
Now that we have the Vector Space Model of interfaces in Deep Web, we
have to find a way to measure the importance of an attribute with respect to
another attribute in a deep web query interface. For this, we use the TF-IDF
weights [1].
TF-IDF weight is calculated based on the VSM as follows:
1)Calculate Term Frequency
Term Frequency TF( f,a) is calculated as follows:
TF( f,a) =
0 freq( f,a) = 0
1+ log(1+ log( freq( f,a))) otherwise.
!
"
#
$#
(4)
where freq( f,a) is the number of occurrences of attribute f in query interface a .
2) Calculate Inverse Document Frequency
The inverse document frequency computes the importance of an attribute on
basis of its occurrence in the query interface vector. The greater its
occurrence, the more important it is with reference to context. IDF is
calculated as:
IDF(a) = log
1+ | f |
| fa |
(5)
where | f | is the query interface collection and | fa |is the number of query
interfaces in which the attributea appears.
3) Calculate TF-IDF weight
The TF − IDF( f,a) weight is calculated as:
TF − IDF( f,a) = TF( f,a)× IDF(a) (6)
26
where TF( f,a) is the term frequency of attributea in query interface f and
IDF(a)is inverse document frequency of attributea .
B. Calculate Cosine Similarity distance between cluster objects
Now that we have the query interfaces in the form of vectors in a high
dimensional vector space, we need to be able to calculate the similarity between
two vectors. For this we use the Cosine similarity to measure the similarity or
dissimilarity between pair of query interfaces [3-4].
To illustrate the cosine similarity between two query interfaces, refer to the
vector representation of the query interfaces below:
Fig. 13. Graph showing vectors of query interfaces d1
, d2
plotted in the vector space. The angle θ shows the deflection
between the two vectors [4].
Lets consider v(
!"
d1) ,v
!
(d2 )to be the two query interface vectors that we want
to calculate similarity for. The Cosine Similarity is the cosine of the angle
between the two vectors calculates as:
sim(d1,d2 ) =
V
!"
(d1)⋅V
!"
(d2 )
|V
!"
(d1) ||V
!"
(d2 ) |
, (7)
Where numerator is the dot product of the two query interface vectors.
27
Fig. 14. Graph showing vectors A and B plotted in the vector space. The angle θ shows the deflection between the two
vectors [4].
Dot Product of any two vectors A andB is calculated as follows:
a
!
⋅b
!
=| a || b | cosθ (8)
The Denominator is the Euclidean distance, which is calculated as:
Vi
2
! "!
(d)
i=1
n
∑ (9)
where Vi represents the vector for which we are calculating the Euclidean
distance in an n dimensional space.
Thus the Cosine Similarity will determine how much two query interface
vectors deflect from each other. A large value of cosine angle suggests that the
query interfaces are very similar and a smaller value suggest dissimilar vetors.
2. Latent Semantic Relationship:
The VSM gives a complete picture of similarity between two query interfaces.
The next challenge is to be able to use this knowledge of similarity to determine
the relationship between two query interfaces. For this purpose, the vectorial
semantics in Natural Language Processing provides a technique called LSA that
is Latent Semantic Analysis. This technique is used for analyzing the
relationships between query interfaces and the attribute terms in them by
producing another set of related query interfaces and attributes [1-2].
A. Single Value Decomposition
Let d1, d2, d3, d4 represent query interfaces among which we want to
determine relationship. Let a, b, c, d, e, f be set of attributes of these query
interfaces. Then the VSM model will look like follows:
28
Table. 2. Showing VSM matrix A plotting query vectors di against attributes a, b, etc [2].
VSM is a high dimensional matrix and in order to determine relationship, we
need a low dimensional matrix. For this purpose, we need a decomposition
algorithm that preserves the columns structure of simulator while reducing the
amount of rows in the matrix. Here we use Single Value Decomposition
algorithm (SVD) to achieve the same.
The SVD algorithm reduces the VSM matrix into three smaller matrices U,
S and Vt. There is a new scale to measure relationship called feature. Feature
can be defined as a set of attributes that refer to a particular feature of the query
interface. For instance, attribute words like “Linux, computation, processor”
could correspond to feature like “computers”. This new scale feature will be
used in the decomposed matrices and will help reduce the amount of rows by
grouping attributes.
The decomposition is shown as follows:
A =U × S ×VT
(10)
Table. 3. Showing VSM matrix U plotting features fi against attributes a, b, etc [2].
29
Table. 4. Showing VSM matrix S plotting features fi against features fi
[2]
Table. 5. Showing VSM matrix Vt plotting features fi against query interfaces [2].
In order to interpret the relationship between query interfaces, we calculate
product of pairs of decomposed matrices.
Table. 6. Showing VSM matrix VtS plotting features fi against query interfaces di [2].
Fig. 15. Plotting point in VtS matrix [2]
This matrix shows how two query interfaces d1 and d2 are different from d3
and d4. The blue and the green points plotted on the graph are way apart which
30
shows the dissimilarity between them.
Table. 7. Showing VSM matrix US plotting features fi against attributes a, b, etc [2].
Fig. 16. Plotting points in US matrix [2].
This matrix shows how three attributes a, b, c are aligned with feature f1. It
also highlights that the attribute c has stronger association with feature f1 as
compared to a and b. The blue and the green points plotted on the graph
represent the pictographically relationship derived from the matrix.
3. Clustering using K-mean algorithm:
Clustering of Deep Web Query Interfaces is an important step in this process.
Query interfaces in the same group will refer to the same domain and those in
different groups will refer to different domains [1].
The k-Means clustering algorithm is an efficient unsupervised learning
algorithm. In a k-Means clustering we start with n data points that are to be
clustered in a d-dimensional space denoted by Rd
[5].
Our goal is to determine a set of k center points such that the mean square
distance of each of these n data points is reduced to a minimum from its nearest
center. This mean square distance is donated as:
J(V) = (|| xi − vj ||)2
j=1
ci
∑
i=1
c
∑ (11)
where || xi − vj || represents Euclidean distance from xi to vj , ci denotes the
31
number of data points that are in cluster I and c denotes number of cluster
centers.
1) From the set of Cluster enters, randomly select a center say ‘c’
2) For each data point in the set, calculate distance from the data point to the
cluster centers.
3) Assign a data point to a cluster based on the minimum distance between the
data point and respective cluster center as compared to distance from all the
cluster centers.
4) Recalculate the new cluster centers using following equation:
vi = (1/ ci ) xj
j=1
ci
∑ (12)
5) For each data point in the set, recalculate distance from the data point to the
new set of cluster centers.
Check if a data point was reassigned to another cluster, if so then repeat from
step 3, if not then stop.
4. Clustering:
Clustering is the process of examining a collection of “points,” and grouping the
points into “clusters” according to some distance measure. The goal is that
points in the same cluster have a small distance from one another, while points
in different clusters are at a large distance from one another.
Fig.17. Clustering Procedure
32
Stocks Prediction Algorithm:
We have used following terms in making the prediction for stocks:
Category, Equity, Total Assets, Total Liability, Operating Margin Ratio,
Current Asset, Gross Profit, Share Value, Debt Equity, EBITDA, Total
Revenue, Full Time Employee, Gross Margin, Cash and Cash Equivalence.
Algorithm:
1. Fetching values for the above terms from the dataset and Twitter for
specified company.
2. To make prediction following Data Mining Techniques were applied:
a) Representation of tweets in Vector Space Model
b) Calculate TF-IDF weights of above terms to determine relative
strength of tweets based on these terms
c) Calculate Cosine Similarity between any pair of tweets to find the
maximum deflection between strongest positive tweet and
strongest negative tweet.
d) Latent Symantic Analysis of Tweets is done using Single Value
Decomposition to determine the following:
• Which is the strongest feature
• Relation between tweets and feature
• To map tweets on x-y plane
e) Calculate K-means Clustering for tweet co-ordinates to form two
distinct clusters that suggest if stock rates of company will go up or
down in future.
3. The algorithm uses past 3 years of financial records of the company and
K-Means clustering result for final prediction.
KDD PRINCIPLES:
KDD or Knowledge Discovery in Databases is a multidisciplinary branch of
science that deals with data storage and data access, algorithms that are highly
scalable and has huge data sets. The processes that are usually included in KDD
are: Selection, Processing, Transformation, Data Mining and Evaluation. The
overall process of finding and interpreting patterns from data involves recursive
33
application of these steps.
Figure 18: KDD Model
The overall process of finding and interpreting patterns from data involves the
repeated application of the following steps:
1. Developing an understanding of
• the application domain
• the relevant prior knowledge
• the goals of the end-user
2. Creating a target data set: selecting a data set, or focusing on a subset of
variables, or data samples, on which discovery is to be performed.
3. Data cleaning and preprocessing.
• Removal of noise or outliers.
• Collecting necessary information to model or account for noise.
• Strategies for handling missing data fields.
• Accounting for time sequence information and known changes.
4. Data reduction and projection.
• Finding useful features to represent the data depending on the goal of the
task.
• Using dimensionality reduction or transformation methods to reduce the
effective number of variables under consideration or to find invariant
representations for the data.
5. Choosing the data mining task.
• Deciding whether the goal of the KDD process is classification,
regression, clustering, etc.
6. Choosing the data mining algorithms.
34
• Selecting method(s) to be used for searching for patterns in the data.
• Deciding which models and parameters may be appropriate.
• Matching a particular data mining method with the overall criteria of the
KDD process.
4. Data mining
• Searching for patterns of interest in a particular representational form or a
set of such representations as classification rules or trees, regression,
clustering, and so forth.
8. Interpreting mined patterns.
9. Consolidating discovered knowledge.
This knowledge can be used for further processing of data.
Make a note of these observations and conclusions to prepare a document that
can be put forward to different stakeholders.
We have been using KDD approach in our project for extracting useful
information (tweet feeds) from the database. This knowledge involved
exploring and analyzing large amounts of data to find patterns for big data based
on positive, negative, neutral sentiments. Each tweet belongs to either of these
sentiment classes. Inclusion of the neutral class has been in the model in order
to classify those tweets that did not belong to positive or negative class.
All the steps used and applied were in accordance with KDD principles. These
steps were observed, analyzed and put to use to arrive at a conclusion of getting
clean data. Here are the steps that were evenly followed in our project on similar
grounds after which we were able to classify the tweet feeds (positive, negative,
neutral)
• Separating Tweets and Retweets (Pre-processing),
• Filtering special characters (Cleaning),
• Naïve Bayes Classification for Sentiment analysis of tweets on Twitter
(Feature Selection and Extraction), Applying K-Means Clustering, TF-
IDF,
• Separating html links, removing hashtags # from the data used(Data
Mining),
• Remove all @people and unnecessary spaces (Interpretation and
Evaluation).
35
DATA TOOLS:
Data Analytics using NodeJS libraries and Data mining concepts:
We have used NodeJS libraries like:
• npm svd - This library takes the input as a VSM that we create for twitter
tweets. It then applies the Single Value Decomposition algorithm on this
matrix. It allows us to specify if we want transpose of any of the
decomposed matrices. It also allows to specify the verbosity of output. It
gives us 3 decomposed matrices U,S and V. We use these matrices to
compare tweets against relevant words.
• npm clusterfck - This library performs k-means clustering on given data
points. We have converted twitter tweets into x,y coordinates and are
using this library to cluster these data points and show them on a scatter
graph. These clusters help us determine if a stock value is likely to
increase or decrease and by how much amount.
• npm-twit - This library is used as the twitter api to get desired tweets. We
use this library to perform search on the twitter api. We take the
company’s name and get tweets related to its stocks.
Data Mining Steps:
a) Data extraction
b) Data cleaning
c) Data loading
d) Data transformation
e) Predictive modelling
f) Data visualization
With its growing list of packages, NodeJS libraries can now connect with other data stores
such as MySQL, SQLite, Hadoop and MongoDB for data storage activities. NodeJS allows
performing Data Analytics by various statistical and machine learning operation as follows:
a) Regression
b) Classification
c) Clustering
d) Recommendation
e) Text Mining.
High Charts
High Charts are used to create interactive charts on the web. We have used high charts for
data visualization. Highcharts is a charting library in JavaScript, offering us an easy way of
adding interactive charts to our web site or web application. Highcharts supports line, spline,
area, areaspline, column, bar, pie, scatter, angular gauges, arearange, areasplinerange,
columnrange, bubble, box plot, error bars, funnel, waterfall and polar chart types. We have
used high charts for plotting bar graphs and pie charts.
36
DESIGN PATTERNS
Node JS Express MVC framework:
Express is a minimal and flexible Node.js web application framework that provides a robust
set of features for web application. We have Node JS express MVC framework since it
provides a lot of in built packages for different functionalities which we plan to achieve.
Since it has a great support and bunch of features, Express is one of the best framework for
Node.
Front End – EJS:
EJS stands for Embedded JavaScript, it is essentially HTML with JavaScript based features
embedded for templating. EJS is primarily HTML but with additional features which allows
us to reuse pieces of our components. If we have any HTML project, then all we need to do is
to rename it to .ejs extension and we can start using EJS.
For Highchart-1
<!DOCTYPE html>
<html lang="en">
<head>
<meta charset="utf-8">
<meta name="viewport" content="width=device-width, initial-scale=1.0">
<meta name="description" content="">
<meta http-equiv="X-UA-Compatible" content="IE=edge">
<meta name="viewport" content="width=device-width, initial-scale=1">
<meta name="author" content="">
<link href="css/bootstrap.min.css" rel="stylesheet">
<!-- Custom CSS -->
<link href="css/stylish-portfolio.css" rel="stylesheet">
<!-- Custom Fonts -->
<link href="font-awesome/css/font-awesome.min.css" rel="stylesheet" type="text/css">
<link
href="http://fonts.googleapis.com/css?family=Source+Sans+Pro:300,400,700,300italic,400ita
lic,700italic"
rel="stylesheet" type="text/css">
<script src="http://ajax.googleapis.com/ajax/libs/jquery/1.10.2/jquery.min.js"></script>
<script src="http://code.highcharts.com/highcharts.js"></script>
<script src="http://code.highcharts.com/highcharts-3d.js"></script>
<script src="http://code.highcharts.com/highcharts-more.js"></script>
<script src="http://code.highcharts.com/modules/solid-gauge.js"></script>
<script src="http://code.highcharts.com/modules/exporting.js"></script>
37
<!--<link rel="shortcut icon" href="assets/images/gt_favicon.png">-->
<style type="text/css">
.chartSize {
height: 100%;
width: 50%;
position: relative;
}
.scrollit {
overflow: scroll;
height: 350px;
}
</style>
<script type="text/javascript">
function generateMeterResults() {
var gaugeOptions = {
chart: {
type: 'solidgauge'
},
title: null,
pane: {
center: ['50%', '85%'],
size: '140%',
startAngle: -90,
endAngle: 90,
background: {
backgroundColor: (Highcharts.theme && Highcharts.theme.background2) || '#EEE',
innerRadius: '60%',
outerRadius: '100%',
shape: 'arc'
}
},
tooltip: {
enabled: false
},
// the value axis
yAxis: {
stops: [
[0.1, '#DF5353'], // red
[0.5, '#DDDF0D'], // yellow
[0.9, '#55BF3B'] // green
],
lineWidth: 0,
minorTickInterval: null,
tickPixelInterval: 400,
38
tickWidth: 0,
title: {
y: -70
},
labels: {
y: 16
}
},
plotOptions: {
solidgauge: {
dataLabels: {
y: 5,
borderWidth: 0,
useHTML: true
}
}
}
};
twitterSearch.js
var util = require('util'),
twit = require('twit'),
sentimentAnalysis = require('./twitterSentimentAnalysis.js');
var config = {
consumer_key: 'WhYExrBdjaQKyArMvJhxjHiHt',
consumer_secret:
'WZ81G6ADuk2RJgGRVMsRZMGgJcUudbC7W2xdhTTx1Miqbhr68y',
access_token: '2433226039-ALNzRIdqRR3StA2GZSXyPDuMJMhp5rm604BWktz',
access_token_secret: 'nwUXQJsFraf4wd2SB8ls3BKQiB5uAWVEWO1Ea6cLk9ifB'
};
exports.getTweets = function getTweets(comp1, criteria, callback) {
var twitterClient = new twit(config);
var tweetsPolarity = [];
var positive = 0;
var negative = 0;
var neutral = 0;
var twitQuery = comp1 + ' ' + criteria + ' since:2015-01-01';
var analysisResult;
twitterClient.get('search/tweets', {q: twitQuery, count: 100}, function (err, data) {
39
var totalTweets = data.statuses;
var tweets = [];
console.log(JSON.stringify(totalTweets));
console.log("totalTweets.length="+totalTweets.length);
for (var i = 0; i < totalTweets.length; i++) {
totalTweets[i].text = totalTweets[i].text.replace(/^RT/, "");
totalTweets[i].text = totalTweets[i].text.replace(/^ReTw/, "");
tweets.push(totalTweets[i].text);
}
console.log("tweets.length="+tweets.length);
analysisResult=sentimentAnalysis(tweets);
/*
tweetsPolarity.push(positive);
tweetsPolarity.push(negative);
tweetsPolarity.push(neutral);
callback(err, tweetsPolarity, tweets);
*/
callback(err, analysisResult, tweets);
}
);
}
twitterSentimentAnalysis.js
var sentiment = require('sentiment');
module.exports = function(text) {
return sentiment(text);
};
Middle tier – Express:
We have used Express as a middleware for Node JS framework. An express application is a
series of middleware calls. Middleware is a function with access to the request object(req),
response object(res) and the next middleware in line in the request-response cycle of an
Express application. Middleware can do the following:
1. Execute code
2. Make changes to the request
3. End the request response cycle
4. Call the next middleware in the stack
An express application can use following kinds of middleware:
1. Application level middleware
2. Router level middleware
3. Error handling middleware
40
4. Built in middleware
5. Third party middleware
We have used application level middleware. Application level middleware are bound to an
instance of express.
App.js
var express = require('express');
var path = require('path');
var logger = require('morgan');
var cookieParser = require('cookie-parser');
var bodyParser = require('body-parser');
var routesBase = require('./routes/index');
var analysis = require('./routes/analysis');
var app = express();
// view engine setup
app.set('views', path.join(__dirname, 'views'));
app.set('view engine', 'ejs');
app.use(logger('dev'));
app.use(bodyParser.json());
app.use(bodyParser.urlencoded({extended: false}));
app.use(cookieParser());
app.use(express.static(path.join(__dirname, 'public')));
app.use('/', routesBase);
app.post('/getStats', analysis.getStats);
// catch 404 and forward to error handler
app.use(function (req, res, next) {
var err = new Error('Not Found');
err.status = 404;
next(err);
});
// error handlers
// development error handler
// will print stacktrace
if (app.get('env') === 'development') {
app.use(function (err, req, res, next) {
res.status(err.status || 500);
res.render('error', {
message: err.message,
error: err
});
});
}
// production error handler
41
// no stacktraces leaked to user
app.use(function (err, req, res, next) {
res.status(err.status || 500);
res.render('error', {
message: err.message,
error: {}
});
});
module.exports = app;
Analysis.js
var mysql = require('./mysql');
var tweetStats = require('./twitterSearch');
exports.getStats = function (req, res) {
var compFirst = req.param("comp1").toLowerCase().trim();
var criteria = "stock";//"stock equity asset liability revenue EBITDA profit loss cash up
down";
var compSecond = req.param("comp2").toLowerCase().trim();
var getStats = "select * from mytable1 where Company_Name='" + compFirst + "' OR
Company_Name='" + compSecond + "'";
var polarity = [0,0,0];
var analysisResult;
tweetStats.getTweets(compFirst, criteria, function (err, result, twits) {
if (err) {
throw err;
}
analysisResult = result;
var tweets = twits;
console.log("score="+analysisResult.score);
mysql.fetchData(getStats, function (err, rows) {
console.log("rows="+rows.length);
if (rows.length < 6) {
res.render('index', {error: "Error"});
console.log(err);
}
else {
//console.log("pol..." + polarity);
var year2012="2012";
var year2013="2013";
var year2014="2014";
var i;
var comp1 = [];
42
var comp2 = [];
var current_Share_Value=1;
for (var i = 0; i < rows.length; i++) {
if (rows[i].Company_Name.toUpperCase() === compFirst.toUpperCase()) {
comp1.push(rows[i]);
console.log(rows[i].Share_Values);
if(rows[i].Year.toUpperCase() === year2014.toUpperCase()){
current_Share_Value=rows[i].Share_Values;
}
}
else if (rows[i].Company_Name.toUpperCase() === compSecond.toUpperCase()) {
comp2.push(rows[i]);
}
}
var avg = (comp1[0].Share_Values+comp1[1].Share_Values+comp1[2].Share_Values)/3;
var increase_by = avg-current_Share_Value;
var predict_share_value = parseInt((increase_by*100)/current_Share_Value);
/*
var result = {
score: score,
vsm: vsm,
feature1Words: feature1Words, //X-axis f1(w1,w4,w7)
feature2Words: feature2Words, //Y-axis f2(w1,w2,w3)
VS: VS,
US: US,
clusters: clusters
//clusters[0] - red array of (x,y) -ve <X< +ve
//clusters[1] - green array of (x,y) -ve <Y< +ve
};
*/
res.render('viewStats', {
data: rows,
comp1: comp1,
comp2: comp2,
polarity: polarity,
tweets: tweets,
finalPercent: predict_share_value
});
}
// render or error
});
});
}
43
Data Store:
MySQL is used for data storage. We have created a mock data for a set of companies. It is a
relational database that stores data in the form of rows and columns i.e. tabular representation
of data.
Figure 17: Data store in MySQL
Cloud:
We have used Amazon Web Services(AWS) EC2 for hosting our web application and
database. It is a open standard, cloud platform for building, running and managing apps and
services. Amazon EC2 is a cloud platform that helps developers rapidly build, manage and
run web as well as mobile applications.
Figure 18: Screenshot from AWS EC2 Dashboard
44
CLIENT SIDE DESIGN:
45
46
47
LOAD TESTING:
The load testing was conducted on our web application using the following
tool:
Load Impact tool:
In this tool we tried load testing our web application by supplying 25 virtual
users on our application and checking its performance. We tested our
application for 5 minutes by giving different number of users and monitoring its
performance. Below images will give you the detail overview of the
performance of our application with different number of users.
48
49
Following screenshot shows the result of 25 virtual machines.
These virtual machines were tested on auto generated scenarios. As you can see,
there were 138 auto-generated scenarios and all are passed successfully.
50
REFERENCES:
[1]. Wikipedia, 'Mergers and acquisitions', 2015. [Online]. Available: http://en.wikipedia.org/wiki/Mergers_and_acquisitions#Acquisition.
[2]. Finance.yahoo.com, 2015. [Online]. Available: http://finance.yahoo.com
[3]. Google.com, 'Google Finance: Stock market quotes, news, currency conversions & more', 2015. [Online].
Available: https://www.google.com/finance.

More Related Content

Similar to Prediction system report and results-Jay Vora

Crowd Hero Business Plan
Crowd Hero Business PlanCrowd Hero Business Plan
Crowd Hero Business Plan
Thomas O'Brien
 
Design Report
Design ReportDesign Report
Design Report
Yosef Gamble
 
Dss project analytics writeup
Dss project analytics writeup Dss project analytics writeup
Dss project analytics writeup
Andrey Skroznikov, M.B.A.
 
Stock Market Prediction using Alpha Vantage API and Machine Learning Algorithm
Stock Market Prediction using Alpha Vantage API and Machine Learning AlgorithmStock Market Prediction using Alpha Vantage API and Machine Learning Algorithm
Stock Market Prediction using Alpha Vantage API and Machine Learning Algorithm
IRJET Journal
 
How To Start A Reflective Essay 8 Tips For Writing A
How To Start A Reflective Essay 8 Tips For Writing AHow To Start A Reflective Essay 8 Tips For Writing A
How To Start A Reflective Essay 8 Tips For Writing A
Lisa Martinez
 
GERSIS INDUSTRY CASES
GERSIS INDUSTRY CASESGERSIS INDUSTRY CASES
GERSIS INDUSTRY CASES
Sergej Markov
 
Smart Traffic Monitoring System Report
Smart Traffic Monitoring System ReportSmart Traffic Monitoring System Report
Smart Traffic Monitoring System Report
ALi Baker
 
Stock Market Prediction Analysis
Stock Market Prediction AnalysisStock Market Prediction Analysis
Stock Market Prediction Analysis
IRJET Journal
 
final project execution vajv.pdf
final project execution vajv.pdffinal project execution vajv.pdf
final project execution vajv.pdf
VictorAntonioJimenez4
 
FYP
FYPFYP
Decentralized exchange-Banco: presented by Pentagon
Decentralized exchange-Banco: presented by PentagonDecentralized exchange-Banco: presented by Pentagon
Decentralized exchange-Banco: presented by Pentagon
LuyaoZhangPhD
 
Running head PROJECT PROPOSAL 1 PROJECT PROPOSAL 2.docx
Running head PROJECT PROPOSAL 1 PROJECT PROPOSAL 2.docxRunning head PROJECT PROPOSAL 1 PROJECT PROPOSAL 2.docx
Running head PROJECT PROPOSAL 1 PROJECT PROPOSAL 2.docx
todd581
 
thesis_jinxing_lin
thesis_jinxing_linthesis_jinxing_lin
thesis_jinxing_lin
jinxing lin
 
Organizational Strategy Final Project
Organizational Strategy Final ProjectOrganizational Strategy Final Project
Organizational Strategy Final Project
Pedram Keyvani
 
Narrative Mind Week 7 H4D Stanford 2016
Narrative Mind Week 7 H4D Stanford 2016Narrative Mind Week 7 H4D Stanford 2016
Narrative Mind Week 7 H4D Stanford 2016
Stanford University
 
How to Apply Machine Learning with R, H20, Apache Spark MLlib or PMML to Real...
How to Apply Machine Learning with R, H20, Apache Spark MLlib or PMML to Real...How to Apply Machine Learning with R, H20, Apache Spark MLlib or PMML to Real...
How to Apply Machine Learning with R, H20, Apache Spark MLlib or PMML to Real...
Kai Wähner
 
IRJET- Stock Market Prediction using Machine Learning Techniques
IRJET- Stock Market Prediction using Machine Learning TechniquesIRJET- Stock Market Prediction using Machine Learning Techniques
IRJET- Stock Market Prediction using Machine Learning Techniques
IRJET Journal
 
STOCK MARKET PREDICTION USING MACHINE LEARNING IN PYTHON
STOCK MARKET PREDICTION USING MACHINE LEARNING IN PYTHONSTOCK MARKET PREDICTION USING MACHINE LEARNING IN PYTHON
STOCK MARKET PREDICTION USING MACHINE LEARNING IN PYTHON
IRJET Journal
 
IRJET- Virtual Business Analyst using a Progressive Web Application
IRJET- Virtual Business Analyst using a Progressive Web ApplicationIRJET- Virtual Business Analyst using a Progressive Web Application
IRJET- Virtual Business Analyst using a Progressive Web Application
IRJET Journal
 
Software Requirements Specification
Software Requirements SpecificationSoftware Requirements Specification
Software Requirements Specification
Srishti Sabarwal
 

Similar to Prediction system report and results-Jay Vora (20)

Crowd Hero Business Plan
Crowd Hero Business PlanCrowd Hero Business Plan
Crowd Hero Business Plan
 
Design Report
Design ReportDesign Report
Design Report
 
Dss project analytics writeup
Dss project analytics writeup Dss project analytics writeup
Dss project analytics writeup
 
Stock Market Prediction using Alpha Vantage API and Machine Learning Algorithm
Stock Market Prediction using Alpha Vantage API and Machine Learning AlgorithmStock Market Prediction using Alpha Vantage API and Machine Learning Algorithm
Stock Market Prediction using Alpha Vantage API and Machine Learning Algorithm
 
How To Start A Reflective Essay 8 Tips For Writing A
How To Start A Reflective Essay 8 Tips For Writing AHow To Start A Reflective Essay 8 Tips For Writing A
How To Start A Reflective Essay 8 Tips For Writing A
 
GERSIS INDUSTRY CASES
GERSIS INDUSTRY CASESGERSIS INDUSTRY CASES
GERSIS INDUSTRY CASES
 
Smart Traffic Monitoring System Report
Smart Traffic Monitoring System ReportSmart Traffic Monitoring System Report
Smart Traffic Monitoring System Report
 
Stock Market Prediction Analysis
Stock Market Prediction AnalysisStock Market Prediction Analysis
Stock Market Prediction Analysis
 
final project execution vajv.pdf
final project execution vajv.pdffinal project execution vajv.pdf
final project execution vajv.pdf
 
FYP
FYPFYP
FYP
 
Decentralized exchange-Banco: presented by Pentagon
Decentralized exchange-Banco: presented by PentagonDecentralized exchange-Banco: presented by Pentagon
Decentralized exchange-Banco: presented by Pentagon
 
Running head PROJECT PROPOSAL 1 PROJECT PROPOSAL 2.docx
Running head PROJECT PROPOSAL 1 PROJECT PROPOSAL 2.docxRunning head PROJECT PROPOSAL 1 PROJECT PROPOSAL 2.docx
Running head PROJECT PROPOSAL 1 PROJECT PROPOSAL 2.docx
 
thesis_jinxing_lin
thesis_jinxing_linthesis_jinxing_lin
thesis_jinxing_lin
 
Organizational Strategy Final Project
Organizational Strategy Final ProjectOrganizational Strategy Final Project
Organizational Strategy Final Project
 
Narrative Mind Week 7 H4D Stanford 2016
Narrative Mind Week 7 H4D Stanford 2016Narrative Mind Week 7 H4D Stanford 2016
Narrative Mind Week 7 H4D Stanford 2016
 
How to Apply Machine Learning with R, H20, Apache Spark MLlib or PMML to Real...
How to Apply Machine Learning with R, H20, Apache Spark MLlib or PMML to Real...How to Apply Machine Learning with R, H20, Apache Spark MLlib or PMML to Real...
How to Apply Machine Learning with R, H20, Apache Spark MLlib or PMML to Real...
 
IRJET- Stock Market Prediction using Machine Learning Techniques
IRJET- Stock Market Prediction using Machine Learning TechniquesIRJET- Stock Market Prediction using Machine Learning Techniques
IRJET- Stock Market Prediction using Machine Learning Techniques
 
STOCK MARKET PREDICTION USING MACHINE LEARNING IN PYTHON
STOCK MARKET PREDICTION USING MACHINE LEARNING IN PYTHONSTOCK MARKET PREDICTION USING MACHINE LEARNING IN PYTHON
STOCK MARKET PREDICTION USING MACHINE LEARNING IN PYTHON
 
IRJET- Virtual Business Analyst using a Progressive Web Application
IRJET- Virtual Business Analyst using a Progressive Web ApplicationIRJET- Virtual Business Analyst using a Progressive Web Application
IRJET- Virtual Business Analyst using a Progressive Web Application
 
Software Requirements Specification
Software Requirements SpecificationSoftware Requirements Specification
Software Requirements Specification
 

Recently uploaded

basic-wireline-operations-course-mahmoud-f-radwan.pdf
basic-wireline-operations-course-mahmoud-f-radwan.pdfbasic-wireline-operations-course-mahmoud-f-radwan.pdf
basic-wireline-operations-course-mahmoud-f-radwan.pdf
NidhalKahouli2
 
A review on techniques and modelling methodologies used for checking electrom...
A review on techniques and modelling methodologies used for checking electrom...A review on techniques and modelling methodologies used for checking electrom...
A review on techniques and modelling methodologies used for checking electrom...
nooriasukmaningtyas
 
International Conference on NLP, Artificial Intelligence, Machine Learning an...
International Conference on NLP, Artificial Intelligence, Machine Learning an...International Conference on NLP, Artificial Intelligence, Machine Learning an...
International Conference on NLP, Artificial Intelligence, Machine Learning an...
gerogepatton
 
Electric vehicle and photovoltaic advanced roles in enhancing the financial p...
Electric vehicle and photovoltaic advanced roles in enhancing the financial p...Electric vehicle and photovoltaic advanced roles in enhancing the financial p...
Electric vehicle and photovoltaic advanced roles in enhancing the financial p...
IJECEIAES
 
DfMAy 2024 - key insights and contributions
DfMAy 2024 - key insights and contributionsDfMAy 2024 - key insights and contributions
DfMAy 2024 - key insights and contributions
gestioneergodomus
 
New techniques for characterising damage in rock slopes.pdf
New techniques for characterising damage in rock slopes.pdfNew techniques for characterising damage in rock slopes.pdf
New techniques for characterising damage in rock slopes.pdf
wisnuprabawa3
 
Technical Drawings introduction to drawing of prisms
Technical Drawings introduction to drawing of prismsTechnical Drawings introduction to drawing of prisms
Technical Drawings introduction to drawing of prisms
heavyhaig
 
Exception Handling notes in java exception
Exception Handling notes in java exceptionException Handling notes in java exception
Exception Handling notes in java exception
Ratnakar Mikkili
 
Understanding Inductive Bias in Machine Learning
Understanding Inductive Bias in Machine LearningUnderstanding Inductive Bias in Machine Learning
Understanding Inductive Bias in Machine Learning
SUTEJAS
 
Heat Resistant Concrete Presentation ppt
Heat Resistant Concrete Presentation pptHeat Resistant Concrete Presentation ppt
Heat Resistant Concrete Presentation ppt
mamunhossenbd75
 
Swimming pool mechanical components design.pptx
Swimming pool  mechanical components design.pptxSwimming pool  mechanical components design.pptx
Swimming pool mechanical components design.pptx
yokeleetan1
 
Advanced control scheme of doubly fed induction generator for wind turbine us...
Advanced control scheme of doubly fed induction generator for wind turbine us...Advanced control scheme of doubly fed induction generator for wind turbine us...
Advanced control scheme of doubly fed induction generator for wind turbine us...
IJECEIAES
 
Recycled Concrete Aggregate in Construction Part III
Recycled Concrete Aggregate in Construction Part IIIRecycled Concrete Aggregate in Construction Part III
Recycled Concrete Aggregate in Construction Part III
Aditya Rajan Patra
 
14 Template Contractual Notice - EOT Application
14 Template Contractual Notice - EOT Application14 Template Contractual Notice - EOT Application
14 Template Contractual Notice - EOT Application
SyedAbiiAzazi1
 
132/33KV substation case study Presentation
132/33KV substation case study Presentation132/33KV substation case study Presentation
132/33KV substation case study Presentation
kandramariana6
 
KuberTENes Birthday Bash Guadalajara - K8sGPT first impressions
KuberTENes Birthday Bash Guadalajara - K8sGPT first impressionsKuberTENes Birthday Bash Guadalajara - K8sGPT first impressions
KuberTENes Birthday Bash Guadalajara - K8sGPT first impressions
Victor Morales
 
Wearable antenna for antenna applications
Wearable antenna for antenna applicationsWearable antenna for antenna applications
Wearable antenna for antenna applications
Madhumitha Jayaram
 
Iron and Steel Technology Roadmap - Towards more sustainable steelmaking.pdf
Iron and Steel Technology Roadmap - Towards more sustainable steelmaking.pdfIron and Steel Technology Roadmap - Towards more sustainable steelmaking.pdf
Iron and Steel Technology Roadmap - Towards more sustainable steelmaking.pdf
RadiNasr
 
2. Operations Strategy in a Global Environment.ppt
2. Operations Strategy in a Global Environment.ppt2. Operations Strategy in a Global Environment.ppt
2. Operations Strategy in a Global Environment.ppt
PuktoonEngr
 
Modelagem de um CSTR com reação endotermica.pdf
Modelagem de um CSTR com reação endotermica.pdfModelagem de um CSTR com reação endotermica.pdf
Modelagem de um CSTR com reação endotermica.pdf
camseq
 

Recently uploaded (20)

basic-wireline-operations-course-mahmoud-f-radwan.pdf
basic-wireline-operations-course-mahmoud-f-radwan.pdfbasic-wireline-operations-course-mahmoud-f-radwan.pdf
basic-wireline-operations-course-mahmoud-f-radwan.pdf
 
A review on techniques and modelling methodologies used for checking electrom...
A review on techniques and modelling methodologies used for checking electrom...A review on techniques and modelling methodologies used for checking electrom...
A review on techniques and modelling methodologies used for checking electrom...
 
International Conference on NLP, Artificial Intelligence, Machine Learning an...
International Conference on NLP, Artificial Intelligence, Machine Learning an...International Conference on NLP, Artificial Intelligence, Machine Learning an...
International Conference on NLP, Artificial Intelligence, Machine Learning an...
 
Electric vehicle and photovoltaic advanced roles in enhancing the financial p...
Electric vehicle and photovoltaic advanced roles in enhancing the financial p...Electric vehicle and photovoltaic advanced roles in enhancing the financial p...
Electric vehicle and photovoltaic advanced roles in enhancing the financial p...
 
DfMAy 2024 - key insights and contributions
DfMAy 2024 - key insights and contributionsDfMAy 2024 - key insights and contributions
DfMAy 2024 - key insights and contributions
 
New techniques for characterising damage in rock slopes.pdf
New techniques for characterising damage in rock slopes.pdfNew techniques for characterising damage in rock slopes.pdf
New techniques for characterising damage in rock slopes.pdf
 
Technical Drawings introduction to drawing of prisms
Technical Drawings introduction to drawing of prismsTechnical Drawings introduction to drawing of prisms
Technical Drawings introduction to drawing of prisms
 
Exception Handling notes in java exception
Exception Handling notes in java exceptionException Handling notes in java exception
Exception Handling notes in java exception
 
Understanding Inductive Bias in Machine Learning
Understanding Inductive Bias in Machine LearningUnderstanding Inductive Bias in Machine Learning
Understanding Inductive Bias in Machine Learning
 
Heat Resistant Concrete Presentation ppt
Heat Resistant Concrete Presentation pptHeat Resistant Concrete Presentation ppt
Heat Resistant Concrete Presentation ppt
 
Swimming pool mechanical components design.pptx
Swimming pool  mechanical components design.pptxSwimming pool  mechanical components design.pptx
Swimming pool mechanical components design.pptx
 
Advanced control scheme of doubly fed induction generator for wind turbine us...
Advanced control scheme of doubly fed induction generator for wind turbine us...Advanced control scheme of doubly fed induction generator for wind turbine us...
Advanced control scheme of doubly fed induction generator for wind turbine us...
 
Recycled Concrete Aggregate in Construction Part III
Recycled Concrete Aggregate in Construction Part IIIRecycled Concrete Aggregate in Construction Part III
Recycled Concrete Aggregate in Construction Part III
 
14 Template Contractual Notice - EOT Application
14 Template Contractual Notice - EOT Application14 Template Contractual Notice - EOT Application
14 Template Contractual Notice - EOT Application
 
132/33KV substation case study Presentation
132/33KV substation case study Presentation132/33KV substation case study Presentation
132/33KV substation case study Presentation
 
KuberTENes Birthday Bash Guadalajara - K8sGPT first impressions
KuberTENes Birthday Bash Guadalajara - K8sGPT first impressionsKuberTENes Birthday Bash Guadalajara - K8sGPT first impressions
KuberTENes Birthday Bash Guadalajara - K8sGPT first impressions
 
Wearable antenna for antenna applications
Wearable antenna for antenna applicationsWearable antenna for antenna applications
Wearable antenna for antenna applications
 
Iron and Steel Technology Roadmap - Towards more sustainable steelmaking.pdf
Iron and Steel Technology Roadmap - Towards more sustainable steelmaking.pdfIron and Steel Technology Roadmap - Towards more sustainable steelmaking.pdf
Iron and Steel Technology Roadmap - Towards more sustainable steelmaking.pdf
 
2. Operations Strategy in a Global Environment.ppt
2. Operations Strategy in a Global Environment.ppt2. Operations Strategy in a Global Environment.ppt
2. Operations Strategy in a Global Environment.ppt
 
Modelagem de um CSTR com reação endotermica.pdf
Modelagem de um CSTR com reação endotermica.pdfModelagem de um CSTR com reação endotermica.pdf
Modelagem de um CSTR com reação endotermica.pdf
 

Prediction system report and results-Jay Vora

  • 1. 1 Project Report On COMPANY STOCKS PREDICTION CMPE 239 Web And Data Mining By: Team- Data Crunchers Ashish Srivastava (009606571) Chhavi Gupta (010106616) Jay Vora (010126714) Shubhi Yede (010038730) Surbhi Garg (010090210)
  • 2. 2 ACKNOWLEDGMENT We, Team: Data Crunchers, take this opportunity to thank Prof. Chandrasekar Vuppalapati, for his constant support, co-ordination and encouragement. The lectures helped us in experimenting new technologies and think in a different way. We also thank him for his patience during the course of the project. We are also grateful to our friends for their support and feedback about our Project.
  • 3. 3 ABSTRACT: Forecasting stock return is an important financial subject that has attracted researcher’s attention for many years. It involves an assumption that fundamental information publicly available in the past has some predictive relationships to the future stock returns. This study tries to help the investors in the stock market to decide the better timing for buying or selling stocks based on the knowledge extracted from the historical prices of such stocks. The decision taken will be based on the data mining techniques such as K-Means Clustering, TF- IDF, Single Value Decomposition and Vector Space Model. This project focuses on the predicting future stocks of companies in IT sector based on the company’s past 3 years of data and Twitter data. The purpose is to provide a systematic analysis of the company’s financial data and determine company’s future stocks. In twenty first century, stocks have become the most prominent factor to determine the growth for companies. Therefore forecasting their stocks will help them in the world of globalization and increasing economy, and to compete with other companies to achieve optimum share in the market. This prediction will also be helpful for those who wish to invest in stock market.
  • 4. 4 Table of Contents 1. PROJECT DESCRIPTION:......................................................................5 2. REQUIREMENTS:...................................................................................6 3. UI DESIGN PRINCIPLES–STORYBOARD, WIREFRAMES:..............7 4. HIGH LEVEL ARCHITECTURE DESIGN:..........................................12 5. DATASETS AND DATA PATTERNS:..................................................13 6. DATA ARCHITECTURE:.......................................................................14 7. DATA FLOW DIAGRAM:......................................................................15 8. DATA MINING PRINCIPLES AND ALGORITHMS:..........................23 9. KDD PRINCIPLES:.................................................................................32 10. DATA TOOLS:........................................................................................35 11. DESIGN PATTERNS..............................................................................36 12. Node JS Express MVC framework:.........................................................36 13. Front End – EJS:.......................................................................................36 14. Middle tier-Express:.................................................................................39 15. Data Store:................................................................................................43 16. Cloud:.......................................................................................................43 17. CLIENT SIDE DESIGN:..................................................................................................43 18. LOAD TESTING:................................................................................................47 19. REFERENCES:.......................................................................................50 PROJECT DESCRIPTION: Motivation In this project, we have implemented the Data mining techniques, which have been applied for stock trading to predict the rise and fall of stock prices before the actual event of an increase, or decrease in the stock price occurs. In particular the project will demonstrate the application of Support Vector Machines, Linear Regression, Prediction using Naïve Bayes Algorithm, State vector model, Vector Space Model and k-means in detail along with the benefits and pitfalls of each method. The project introduces the parameters and variables that can be used in order to recognize the patterns in stock prices which can be helpful in the future prediction of stocks and how they can be combined with other algorithms to improve the accuracy of such prediction systems. Note: The main goal of the project was to study and apply as many data mining algorithms as possible on a dataset involving a particular domain, namely the Stock Market, as opposed to coming up with a newer (and/or better) algorithm that is more efficient in predicting the price of a stock. We have tried to briefly research the background which is essential to the study of the domain of financial prediction systems. We have showcased the results obtained from the application of the algorithms we have used by
  • 5. 5 plotting various kinds of graphs which are simpler and amenable to an end user understanding on the financial dataset in the project. The stock market is an essential way for companies to raise money. Companies can raise additional financial capital by being publicly traded in order to expand their business by selling shares of ownership. Historically it is known that share prices can have a major influence on economic activities and can be an indicator of social mood. The stock market movements has always been a rich and interesting subject with such many factors to be analyzed that for a long time it would be considered unpredictable. The application of new computerized mathematical methods over the past few decades developed by companies such as Merrill Lynch and other financial management companies have created models that can maximize their returns while minimizing their risks. Stock market prediction has been around for years but it has been giving a new method of prediction thanks to the rise of social media. The objective of this project is to analyze Twitter feeds for activities and trends associated with a brand and to see how their stock market shares are related and if they are affected to the twitter activity. This analysis will look at the relationship of the amount of tweets for specific brands on NASDAQ such as IBM, FB, and Picasa etc. These brands where chosen since they are innovative technology companies that are on the same stock exchange. Therefore gathering of the twitter data was not time zone dependent. Sample stock market data was collected from the Yahoo Finance website, there they provide historical data for the NASDAQ. Java scripts were used to acquire the tweets through Twitters API service. The Tweets for each brand were then counted using Amazon Web Service and Text Wrangler. The counted tweets were subsequently analyzed using R studio. The Data was the visualized using high charts and a user friendly analysis using various kinds of graphs will be presented to the end user. Figure 1: Stock Market Prediction
  • 6. 6 REQUIREMENTS: 1. Twitter Feeds: Feed pages should be present in the system to update the latest feeds continuously, based on the user preferences and search history. 2. Hashtag Sentiment Streaming: Streaming of tweets could be done based on keywords that are most popularly tweeted. 3. Financial Data: Financial Data of companies are required in order to process the data. UI DESIGN PRINCIPLES–STORYBOARD, WIREFRAMES:
  • 7. 7 Figure 2- Wireframe Figure 3 – Wireframe Storyboard Events: 1. User browses through our website 2. Selects the Predict tab where you enter the company’s name and the criteria which talks about the company 3. Click on Analyze button. 4. HighChart would be displayed for that company 5. Click on Start Prediction. 6. Bar graph is displayed with positive, negative and neutral twitter sentiments. ANDROID APP: We have Created Web-Hybrid Android App. Hybrid applications are coded in HTML, CSS and JavaScript. They are run through the invisible browser that is packaged into a native application. · Can access Native APIs · Distribute through App Stores · Can run on multiple platforms Tools Used: · Android Studio · GenyMotion for emulation Screenshots:
  • 8. 8 Figure 4 – Home Screen Figure 5 – Team Information
  • 9. 9 Figure 6 – Enter Company to predict its Stocks Figure 7 – Data from Twitter Source Code: import android.os.Bundle; import android.support.design.widget.FloatingActionButton; import android.support.design.widget.Snackbar; import android.support.v7.app.AppCompatActivity; import android.support.v7.widget.Toolbar; import android.view.View; import android.view.Menu; import android.view.MenuItem;
  • 10. 10 import android.webkit.WebView; public class Main extends AppCompatActivity { @Override protected void onCreate(Bundle savedInstanceState) { super.onCreate(savedInstanceState); setContentView(R.layout.activity_main); Toolbar toolbar = (Toolbar) findViewById(R.id.toolbar); setSupportActionBar(toolbar); String url = "http://10.189.107.200:3000/"; WebView view = (WebView) this.findViewById(R.id.webView); view.loadUrl(url); FloatingActionButton fab = (FloatingActionButton) findViewById(R.id.fab); fab.setOnClickListener(new View.OnClickListener() { @Override public void onClick(View view) { Snackbar.make(view, "Replace with your own action", Snackbar.LENGTH_LONG) .setAction("Action", null).show(); } }); } @Override public boolean onCreateOptionsMenu(Menu menu) { // Inflate the menu; this adds items to the action bar if it is present. getMenuInflater().inflate(R.menu.menu_main, menu); return true; } @Override public boolean onOptionsItemSelected(MenuItem item) { // Handle action bar item clicks here. The action bar will // automatically handle clicks on the Home/Up button, so long // as you specify a parent activity in AndroidManifest.xml. int id = item.getItemId(); //noinspection SimplifiableIfStatement if (id == R.id.action_settings) { return true; } return super.onOptionsItemSelected(item); } } AndroidManifest.xml
  • 11. 11 <?xml version="1.0" encoding="utf-8"?> <manifest xmlns:android="http://schemas.android.com/apk/res/android" package="com.example.chhavigupta.dataapp"> <uses-permission android:name="android.permission.INTERNET"/> <application android:allowBackup="true" android:icon="@mipmap/ic_launcher" android:label="@string/app_name" android:supportsRtl="true" android:theme="@style/AppTheme"> <activity android:name=".Main" android:label="@string/app_name" android:theme="@style/AppTheme.NoActionBar"> <intent-filter> <action android:name="android.intent.action.MAIN" /> <category android:name="android.intent.category.LAUNCHER" /> </intent-filter> </activity> </application> </manifest> HIGH LEVEL ARCHITECTURE DESIGN:
  • 12. 12 Figure 8: High Level Architecture Description: 1. Data are stored in MySQL database. 2. Dataset from MySQL is fetched to perform computation. 3. We are running predictive algorithm on the fetched data. 4. The algorithm scans through all the fetched data and predicts the result. 5. The result is passed to the visualization tool. 6. Using high charts, the data is represented on our web application.
  • 13. 13 Figure 9: Flow: High Level Architecture DATASETS AND DATA PATTERNS: Figure 10: Data Patterns DATA ARCHITECTURE:
  • 14. 14 Figure 11: Architecture for twitter sentiment analysis Description: 1. Need to do twitter authentication so that one can access twitter data. 2. Pull out the tweets from twitter which are based on user input 3. As we only need text we have to filter out the tweets 4. Retweets are not necessary we have to remove them 5. Delete all special character and digits 6. Delete hyperlinks and spaces 7. Delete all tagging i.e @ people 8. This will all result in the preprocessed data 9. Now apply SVD, K-Means Clustering, SVM, TF-IDF This algorithm displays a bar graph with positive, negative and neutral sentiments as shown above. Data Flow Diagram:
  • 15. 15 Figure 12: Data Flow Diagram Twitter Data Analysis: Source Code: /** * AFINN-based sentiment analysis for Node.js * * @package sentiment * @author Shubhi Yede <shubhi.yede@gmail.com> */ /** * Dependencies */ var extend = require('extend-object'); var afinn = require('../build/AFINN.json'); /** * Tokenizes an input string. * * @param {String} Input * * @return {Array} */ function tokenize (input) { //console.log(input); var result = input .replace(/[^a-zA-Z- ]+/g, '') .replace('/ {2,}/',' ') .toLowerCase() .split(' '); //console.log(result); return result; } function log10(val) { return Math.log(val) / Math.LN10;
  • 16. 16 } function TF(freq){ var tf=1+log10(1+log10(freq)); return tf; } function IDF(d,dt){ var idf=log10((1+d)/dt); return idf; } function cosineDistance(v1, v2){ var numerator=0,sqrt_v1=0,sqrt_v2=0; for(var i=0; i<v1.length; i++){ numerator+=v1[i]*v2[i]; sqrt_v1+=Math.pow(v1[i],2); sqrt_v2+=Math.pow(v2[i],2); } sqrt_v1 = Math.sqrt(sqrt_v1); sqrt_v2 = Math.sqrt(sqrt_v2); var denominator = sqrt_v1 * sqrt_v2; if(denominator > 0){ var cosineDistance = numerator / denominator; return cosineDistance; } else return 0; } function cosineSimilarity(v1,v2){ var angle=Math.acos(cosineDistance(v1, v2)); angle=Math.round(angle * 100) / 100; return angle; } function mult(X, Y){ //X (r1 x c1) Y(r2 x c2) //c1 == r2 console.log("X rows = "+ X.length + " X columns = "+ X[0].length+ " Y rows = " + Y.length + " Y columns = " + Y[0].length); if(X[0].length != Y.length){ console.log('Invalid dimension!'); return null; } // dimensions var m = X.length, n = Y[0].length, d = Y.length; // multiplication var Z = new Array(X.length); for(var i = 0; i < X.length; ++i){
  • 17. 17 Z[i] = new Array(Y[0].length); for(var j = 0; j < Y[0].length; ++j){ Z[i][j] = X[i].map(function(x, k){ return x * Y[k][j]; }).reduce(function(a, b){ return a + b; }, 0); } } return Z; } /** * Performs sentiment analysis on the provided input "phrase". * * @param {String} Input phrase * @param {Object} Optional sentiment additions to AFINN (hash k/v pairs) * * @return {Object} */ module.exports = function (phrase, inject, callback) { // Parse arguments if (typeof phrase === 'undefined') phrase = ''; if (typeof inject === 'undefined') inject = null; if (typeof inject === 'function') callback = inject; if (typeof callback === 'undefined') callback = null; // Merge if (inject !== null) { afinn = extend(afinn, inject); } // Storage objects /* column=words rows=tweets_word_freq stock, equity, asset, liability, revenue, EBITDA, profit, loss, cash, up, down tw1 tw2 tw3 tw4 tw5 */ var counter = [0,0,0,0,0,0,0,0,0,0,0]; var vsm = []; //stock equity asset liability revenue EBITDA profit loss cash up down var relevant_words = ["stock", "equity", "asset", "liability", "revenue", "EBITDA", "profit", "loss", "cash", "up","down"]; var relevant_words_weight = [3,3,3,3,3,3,3,3,3,3,3]; var score=0; console.log("VSM:"); //console.log("phrase.length:"+phrase.length);
  • 18. 18 var new_row_vector = []; for(var i=0; i<phrase.length ; ++i){ //Tokenization var tokens = tokenize(phrase[i]); var len = tokens.length; new_row_vector = [0,0,0,0,0,0,0,0,0,0,0]; while (len--) { var word = tokens[len]; if (!afinn.hasOwnProperty(word)){ continue; } var weight = afinn[word]; //to measure if tweet is positive or negative score += weight; //Vector Space Model //to find if tweet is relevant or irrelevant var index = relevant_words.indexOf(word); if(index > -1){ new_row_vector[index]+=relevant_words_weight[index]; counter[index]+=1; } } vsm.push(new_row_vector); //console.log(new_row_vector); //console.log("score="+score); } //Display Vector Space Model for(var i=0; i<vsm.length; ++i){ console.log(vsm[i]); } //TF-IDF var idf_array = []; var d=vsm.length; for(var i=0; i<11; ++i){ var dt=counter[i]; idf_array.push(IDF(d,dt)); } var TD_IDF_matrix = vsm; console.log("TF-IDF"); var tweetTF_IDF_Weight = []; var maxWeight = -1000; var minWeight = 1000;
  • 19. 19 var maxWeightTweet = -1; var minWeightTweet = -1; var weightSum=0; for(i=0; i<vsm.length; ++i){ weightSum=0; for(j=0; j<11; ++j){ if(vsm[i][j] > 0){ //tf-idf weight of relevant_word[j] in tweet[i] is given by: TD_IDF_matrix[i][j]=TF(vsm[i][j])*idf_array[j]; TD_IDF_matrix[i][j]=Math.round(TD_IDF_matrix[i][j] * 100) / 100; weightSum+=TD_IDF_matrix[i][j]; } console.log(TD_IDF_matrix[i]); } tweetTF_IDF_Weight.push(weightSum); if(weightSum < minWeight){ minWeightTweet=i; minWeight=weightSum; } if(weightSum > maxWeight){ maxWeightTweet=i; maxWeight=weightSum; } } console.log("maxWeightTweet="+maxWeightTweet+ " and its weight="+maxWeight); console.log("minWeightTweet="+minWeightTweet+ " and its weight="+minWeight); //Cosine similarity console.log("Cosine similarity:"); /* var cosineAngle_matrix = []; console.log("totalTweets="+totalTweets); for(i=0; i<totalTweets-1; ++i){ var v1 = vsm[i]; for(j=i+1; j<totalTweets ; ++j){ var v2 = vsm[j]; cosineAngle_matrix.push([i,j,cosineSimilarity(v1,v2)]); } } //Display Cosine Similarity for(var i=0; i<cosineAngle_matrix.length; ++i){ console.log(cosineAngle_matrix[i]); } */ var vector1 = vsm[maxWeightTweet]; var vector2 = vsm[minWeightTweet]; var maxAngle = cosineSimilarity(vector1,vector2);
  • 20. 20 console.log("Opposite tweets deflect by "+maxAngle); //LSA using SVD var svd = require('node-svd').svd; console.log('-----calculating svd-----'); var res = svd(vsm, 0, { U: true, V: true, debug: 2}); console.log('---'); var U = res.U; var S = res.S; var V = res.V; console.log('U = %s', JSON.stringify(U)); console.log('S = %s', JSON.stringify(S)); console.log('V = %s', JSON.stringify(V)); var rows, columns; rows=vsm.length; columns = vsm[0].length; console.log('vsm is a '+rows+' by '+columns+' matrix'); rows=U.length; columns = U[0].length; console.log('U is a '+rows+' by '+columns+' matrix'); //console.log('U = %s', JSON.stringify(U)); //Displaying U for (i=0; i<rows; ++i){ for (j=0; j<columns; ++j){ //U[i][j]=Math.round(U[i][j] * 100) / 100; process.stdout.write(U[i][j]+', '); } process.stdout.write('n'); } var newS = []; console.log("Creating New S "); for (i=0; i<S.length; ++i){ var tuple = []; for(j=0; j<S.length; ++j){ tuple.push(0); } var temp = tuple; temp[i] = S[i]; newS.push(temp); } rows=newS.length; columns = newS[0].length; console.log('!!!!!!! newS is a '+rows+' by '+columns+' matrix');
  • 21. 21 //Displaying newS for (i=0; i<rows; ++i){ for (j=0; j<columns; ++j){ process.stdout.write(newS[i][j]+', '); } process.stdout.write('n'); } rows=V.length; columns = V[0].length; console.log('V is a '+rows+' by '+columns+' matrix'); //Displaying V for (i=0; i<rows; ++i){ for (j=0; j<columns; ++j){ //V[i][j]=Math.round(V[i][j] * 100) / 100; process.stdout.write(V[i][j]+', '); } process.stdout.write('n'); } //features in decending order in S ... var feature1 = S[0]; //strongest var feature2 = S[1]; //next strongest var VS = mult(V,newS); rows=VS.length; columns = VS[0].length; console.log('VS is a '+rows+' by '+columns+' matrix that describes relation between relevant words and features'); //Displaying VS for (i=0; i<rows; ++i){ for (j=0; j<columns; ++j){ process.stdout.write(VS[i][j]+', '); } process.stdout.write('n'); } //Determining which relevant word is part of which of the two stongest features. var feature1Words = []; var feature2Words = []; var feature1Sentiment=0; var feature2Sentiment=0; for (i=0; i<rows; ++i){ if(VS[i][0] > VS[i][1]){ feature1Words.push(relevant_words[i]); if(afinn.hasOwnProperty(relevant_words[i])){ var weight = afinn[relevant_words[i]];
  • 22. 22 feature1Sentiment+=weight; } } else if(VS[i][0] < VS[i][1]){ feature2Words.push(relevant_words[i]); if(afinn.hasOwnProperty(relevant_words[i])){ var weight = afinn[relevant_words[i]]; feature2Sentiment+=weight; } } } console.log("Feature1 words = "+feature1Words); console.log("Feature2 words = "+feature2Words); var US = mult(U,newS); rows=US.length; columns = US[0].length; console.log('US is a '+rows+' by '+columns+' matrix that describes relation between tweets and features'); var tweetCoordinates = []; for (i=0; i<rows; ++i){ for (j=0; j<columns; ++j){ process.stdout.write(US[i][j]+', '); } // f1:x-axis,f2:y-axis tweetCoordinates.push([US[i][0],US[i][1]]); process.stdout.write('n'); } rows=tweetCoordinates.length; columns = tweetCoordinates[0].length; console.log('tweetCoordinates is a '+rows+' by '+columns+' matrix'); for (i=0; i<rows; ++i){ for (j=0; j<columns; ++j){ process.stdout.write(tweetCoordinates[i][j]+', '); } process.stdout.write('n'); } //k-means clustering var clusterfck = require("clusterfck"); var kmeans = new clusterfck.Kmeans(); // Calculate clusters. var clusters = kmeans.cluster(tweetCoordinates, 2); console.log('clusters matrix'); for (i=0; i<clusters.length; ++i){ console.log("cluster "+i+1);
  • 23. 23 for (j=0; j<clusters[i].length; ++j){ process.stdout.write(clusters[i][j]+' ; '); } process.stdout.write('n'); } console.log("CLUSTERING RESULT"); console.log("Cluster 1 for words: ["+feature1Words+"] is of density="+clusters[0].length+" and sentimentScore="+feature1Sentiment); console.log("Cluster 2 for words: ["+feature2Words+"] is of density="+clusters[1].length+" and sentimentScore="+feature2Sentiment); var result = { score: score, vsm: vsm, feature1Words: feature1Words, feature2Words: feature2Words, feature1Sentiment: feature1Sentiment, feature2Sentiment: feature2Sentiment, VS: VS, US: US, clusters: clusters }; if (callback === null) return result; process.nextTick(function () { callback(null, result); }); }; DATA MINING PRINCIPLES AND ALGORITHMS: Company Stock Prediction- The project is using Predictive Analysis. Predictive Analytics: Predictive analytics is not the actual outcome that would take place in future. It is just a method or form of extracting/generating useful information, from the existing data sets, so as to regulate patterns that could help us determine, or in other words, ‘predict’ the future trends and outcomes. For this purpose of analyzing and predicting the unknown future trends, we make use of variety of techniques from data mining, modeling and machine learning. These techniques understand and analyze both, the past and current data, to make analysis and predictions for future. Ample of industries make use of this predicated analysis in there day-to-day work and its demand is increasing in other fields as well. Marketing, health-cares, travel, retailers, insurance, fraud detection and many other fields have also realized the usefulness of predictive analysis.
  • 24. 24 Predictive Modeling or Predictive analytics is nothing but an area of data mining where its objective is to extract useful knowledge from the available data (past and present) and use the same knowledge for identifying patterns and predict behavior of future. Predictive Models Usage: Predictive Models are used to predict the future outcome by performing comparison of the values with huge data sets. In our project, we are predicting company’s stocks based on its past year’s data. Benefits of Predictive Modeling: · It enhances the efficiency and truthfulness of our predictions · Helps us get accurate and reliable results. · Helps in building efficient models that work more with the limited data provided · Reduces pain of adjusting and calculating values each time, saving time. · It provides better diagnostics that help in better managing, controlling and decision- making process. 1. Vector Space Model: In order to find similarity and relationship between each query interface, we use a Vector Space Model representation of these interfaces. The query interfaces in the deep web can be represented as a set of interfaces and a set of attributes of these interfaces [1]. A = {a1,a2,...am} (1) F = {f1, f2,... fn} (2) Where F is a set of n query interfaces and A is a set of m attributes of query interfaces. To represent query interface in the form of a Vector Space Model we take F as the column index of the VSM matrix and A as row index of VSM. It compares query interface with attributes and hence ranks the query interfaces based on their similarity with each other. The query interfaces are represented in the form of a vector and the attributes are the dimensions of the vector space. The Vector Space Model is a high dimensional m x n matrix denoted by C(m×n) . vfn ! "! = tf a1, fn( ),tf a2, fn( ),tf a3, fn( ),....,tf am, fn( )( )(3) Here vfn ! "! is the query interface vector. C(m×n) f1 f2 … fn a1 tf a1, fn( ) tf a1, fn( ) … tf a1, fn( ) a2 tf a1, fn( ) tf a1, fn( ) … tf a1, fn( )
  • 25. 25 … … … … am tf a1, fn( ) tf a1, fn( ) … tf a1, fn( ) Table. 1. Represents high dimensional VSM matrix C(m×n) plotting query interface vectors against their attributes. Here tf am, fn( ) is the term frequency of attribute am in query interface fn . A. Calculate TF-IDF weight Now that we have the Vector Space Model of interfaces in Deep Web, we have to find a way to measure the importance of an attribute with respect to another attribute in a deep web query interface. For this, we use the TF-IDF weights [1]. TF-IDF weight is calculated based on the VSM as follows: 1)Calculate Term Frequency Term Frequency TF( f,a) is calculated as follows: TF( f,a) = 0 freq( f,a) = 0 1+ log(1+ log( freq( f,a))) otherwise. ! " # $# (4) where freq( f,a) is the number of occurrences of attribute f in query interface a . 2) Calculate Inverse Document Frequency The inverse document frequency computes the importance of an attribute on basis of its occurrence in the query interface vector. The greater its occurrence, the more important it is with reference to context. IDF is calculated as: IDF(a) = log 1+ | f | | fa | (5) where | f | is the query interface collection and | fa |is the number of query interfaces in which the attributea appears. 3) Calculate TF-IDF weight The TF − IDF( f,a) weight is calculated as: TF − IDF( f,a) = TF( f,a)× IDF(a) (6)
  • 26. 26 where TF( f,a) is the term frequency of attributea in query interface f and IDF(a)is inverse document frequency of attributea . B. Calculate Cosine Similarity distance between cluster objects Now that we have the query interfaces in the form of vectors in a high dimensional vector space, we need to be able to calculate the similarity between two vectors. For this we use the Cosine similarity to measure the similarity or dissimilarity between pair of query interfaces [3-4]. To illustrate the cosine similarity between two query interfaces, refer to the vector representation of the query interfaces below: Fig. 13. Graph showing vectors of query interfaces d1 , d2 plotted in the vector space. The angle θ shows the deflection between the two vectors [4]. Lets consider v( !" d1) ,v ! (d2 )to be the two query interface vectors that we want to calculate similarity for. The Cosine Similarity is the cosine of the angle between the two vectors calculates as: sim(d1,d2 ) = V !" (d1)⋅V !" (d2 ) |V !" (d1) ||V !" (d2 ) | , (7) Where numerator is the dot product of the two query interface vectors.
  • 27. 27 Fig. 14. Graph showing vectors A and B plotted in the vector space. The angle θ shows the deflection between the two vectors [4]. Dot Product of any two vectors A andB is calculated as follows: a ! ⋅b ! =| a || b | cosθ (8) The Denominator is the Euclidean distance, which is calculated as: Vi 2 ! "! (d) i=1 n ∑ (9) where Vi represents the vector for which we are calculating the Euclidean distance in an n dimensional space. Thus the Cosine Similarity will determine how much two query interface vectors deflect from each other. A large value of cosine angle suggests that the query interfaces are very similar and a smaller value suggest dissimilar vetors. 2. Latent Semantic Relationship: The VSM gives a complete picture of similarity between two query interfaces. The next challenge is to be able to use this knowledge of similarity to determine the relationship between two query interfaces. For this purpose, the vectorial semantics in Natural Language Processing provides a technique called LSA that is Latent Semantic Analysis. This technique is used for analyzing the relationships between query interfaces and the attribute terms in them by producing another set of related query interfaces and attributes [1-2]. A. Single Value Decomposition Let d1, d2, d3, d4 represent query interfaces among which we want to determine relationship. Let a, b, c, d, e, f be set of attributes of these query interfaces. Then the VSM model will look like follows:
  • 28. 28 Table. 2. Showing VSM matrix A plotting query vectors di against attributes a, b, etc [2]. VSM is a high dimensional matrix and in order to determine relationship, we need a low dimensional matrix. For this purpose, we need a decomposition algorithm that preserves the columns structure of simulator while reducing the amount of rows in the matrix. Here we use Single Value Decomposition algorithm (SVD) to achieve the same. The SVD algorithm reduces the VSM matrix into three smaller matrices U, S and Vt. There is a new scale to measure relationship called feature. Feature can be defined as a set of attributes that refer to a particular feature of the query interface. For instance, attribute words like “Linux, computation, processor” could correspond to feature like “computers”. This new scale feature will be used in the decomposed matrices and will help reduce the amount of rows by grouping attributes. The decomposition is shown as follows: A =U × S ×VT (10) Table. 3. Showing VSM matrix U plotting features fi against attributes a, b, etc [2].
  • 29. 29 Table. 4. Showing VSM matrix S plotting features fi against features fi [2] Table. 5. Showing VSM matrix Vt plotting features fi against query interfaces [2]. In order to interpret the relationship between query interfaces, we calculate product of pairs of decomposed matrices. Table. 6. Showing VSM matrix VtS plotting features fi against query interfaces di [2]. Fig. 15. Plotting point in VtS matrix [2] This matrix shows how two query interfaces d1 and d2 are different from d3 and d4. The blue and the green points plotted on the graph are way apart which
  • 30. 30 shows the dissimilarity between them. Table. 7. Showing VSM matrix US plotting features fi against attributes a, b, etc [2]. Fig. 16. Plotting points in US matrix [2]. This matrix shows how three attributes a, b, c are aligned with feature f1. It also highlights that the attribute c has stronger association with feature f1 as compared to a and b. The blue and the green points plotted on the graph represent the pictographically relationship derived from the matrix. 3. Clustering using K-mean algorithm: Clustering of Deep Web Query Interfaces is an important step in this process. Query interfaces in the same group will refer to the same domain and those in different groups will refer to different domains [1]. The k-Means clustering algorithm is an efficient unsupervised learning algorithm. In a k-Means clustering we start with n data points that are to be clustered in a d-dimensional space denoted by Rd [5]. Our goal is to determine a set of k center points such that the mean square distance of each of these n data points is reduced to a minimum from its nearest center. This mean square distance is donated as: J(V) = (|| xi − vj ||)2 j=1 ci ∑ i=1 c ∑ (11) where || xi − vj || represents Euclidean distance from xi to vj , ci denotes the
  • 31. 31 number of data points that are in cluster I and c denotes number of cluster centers. 1) From the set of Cluster enters, randomly select a center say ‘c’ 2) For each data point in the set, calculate distance from the data point to the cluster centers. 3) Assign a data point to a cluster based on the minimum distance between the data point and respective cluster center as compared to distance from all the cluster centers. 4) Recalculate the new cluster centers using following equation: vi = (1/ ci ) xj j=1 ci ∑ (12) 5) For each data point in the set, recalculate distance from the data point to the new set of cluster centers. Check if a data point was reassigned to another cluster, if so then repeat from step 3, if not then stop. 4. Clustering: Clustering is the process of examining a collection of “points,” and grouping the points into “clusters” according to some distance measure. The goal is that points in the same cluster have a small distance from one another, while points in different clusters are at a large distance from one another. Fig.17. Clustering Procedure
  • 32. 32 Stocks Prediction Algorithm: We have used following terms in making the prediction for stocks: Category, Equity, Total Assets, Total Liability, Operating Margin Ratio, Current Asset, Gross Profit, Share Value, Debt Equity, EBITDA, Total Revenue, Full Time Employee, Gross Margin, Cash and Cash Equivalence. Algorithm: 1. Fetching values for the above terms from the dataset and Twitter for specified company. 2. To make prediction following Data Mining Techniques were applied: a) Representation of tweets in Vector Space Model b) Calculate TF-IDF weights of above terms to determine relative strength of tweets based on these terms c) Calculate Cosine Similarity between any pair of tweets to find the maximum deflection between strongest positive tweet and strongest negative tweet. d) Latent Symantic Analysis of Tweets is done using Single Value Decomposition to determine the following: • Which is the strongest feature • Relation between tweets and feature • To map tweets on x-y plane e) Calculate K-means Clustering for tweet co-ordinates to form two distinct clusters that suggest if stock rates of company will go up or down in future. 3. The algorithm uses past 3 years of financial records of the company and K-Means clustering result for final prediction. KDD PRINCIPLES: KDD or Knowledge Discovery in Databases is a multidisciplinary branch of science that deals with data storage and data access, algorithms that are highly scalable and has huge data sets. The processes that are usually included in KDD are: Selection, Processing, Transformation, Data Mining and Evaluation. The overall process of finding and interpreting patterns from data involves recursive
  • 33. 33 application of these steps. Figure 18: KDD Model The overall process of finding and interpreting patterns from data involves the repeated application of the following steps: 1. Developing an understanding of • the application domain • the relevant prior knowledge • the goals of the end-user 2. Creating a target data set: selecting a data set, or focusing on a subset of variables, or data samples, on which discovery is to be performed. 3. Data cleaning and preprocessing. • Removal of noise or outliers. • Collecting necessary information to model or account for noise. • Strategies for handling missing data fields. • Accounting for time sequence information and known changes. 4. Data reduction and projection. • Finding useful features to represent the data depending on the goal of the task. • Using dimensionality reduction or transformation methods to reduce the effective number of variables under consideration or to find invariant representations for the data. 5. Choosing the data mining task. • Deciding whether the goal of the KDD process is classification, regression, clustering, etc. 6. Choosing the data mining algorithms.
  • 34. 34 • Selecting method(s) to be used for searching for patterns in the data. • Deciding which models and parameters may be appropriate. • Matching a particular data mining method with the overall criteria of the KDD process. 4. Data mining • Searching for patterns of interest in a particular representational form or a set of such representations as classification rules or trees, regression, clustering, and so forth. 8. Interpreting mined patterns. 9. Consolidating discovered knowledge. This knowledge can be used for further processing of data. Make a note of these observations and conclusions to prepare a document that can be put forward to different stakeholders. We have been using KDD approach in our project for extracting useful information (tweet feeds) from the database. This knowledge involved exploring and analyzing large amounts of data to find patterns for big data based on positive, negative, neutral sentiments. Each tweet belongs to either of these sentiment classes. Inclusion of the neutral class has been in the model in order to classify those tweets that did not belong to positive or negative class. All the steps used and applied were in accordance with KDD principles. These steps were observed, analyzed and put to use to arrive at a conclusion of getting clean data. Here are the steps that were evenly followed in our project on similar grounds after which we were able to classify the tweet feeds (positive, negative, neutral) • Separating Tweets and Retweets (Pre-processing), • Filtering special characters (Cleaning), • Naïve Bayes Classification for Sentiment analysis of tweets on Twitter (Feature Selection and Extraction), Applying K-Means Clustering, TF- IDF, • Separating html links, removing hashtags # from the data used(Data Mining), • Remove all @people and unnecessary spaces (Interpretation and Evaluation).
  • 35. 35 DATA TOOLS: Data Analytics using NodeJS libraries and Data mining concepts: We have used NodeJS libraries like: • npm svd - This library takes the input as a VSM that we create for twitter tweets. It then applies the Single Value Decomposition algorithm on this matrix. It allows us to specify if we want transpose of any of the decomposed matrices. It also allows to specify the verbosity of output. It gives us 3 decomposed matrices U,S and V. We use these matrices to compare tweets against relevant words. • npm clusterfck - This library performs k-means clustering on given data points. We have converted twitter tweets into x,y coordinates and are using this library to cluster these data points and show them on a scatter graph. These clusters help us determine if a stock value is likely to increase or decrease and by how much amount. • npm-twit - This library is used as the twitter api to get desired tweets. We use this library to perform search on the twitter api. We take the company’s name and get tweets related to its stocks. Data Mining Steps: a) Data extraction b) Data cleaning c) Data loading d) Data transformation e) Predictive modelling f) Data visualization With its growing list of packages, NodeJS libraries can now connect with other data stores such as MySQL, SQLite, Hadoop and MongoDB for data storage activities. NodeJS allows performing Data Analytics by various statistical and machine learning operation as follows: a) Regression b) Classification c) Clustering d) Recommendation e) Text Mining. High Charts High Charts are used to create interactive charts on the web. We have used high charts for data visualization. Highcharts is a charting library in JavaScript, offering us an easy way of adding interactive charts to our web site or web application. Highcharts supports line, spline, area, areaspline, column, bar, pie, scatter, angular gauges, arearange, areasplinerange, columnrange, bubble, box plot, error bars, funnel, waterfall and polar chart types. We have used high charts for plotting bar graphs and pie charts.
  • 36. 36 DESIGN PATTERNS Node JS Express MVC framework: Express is a minimal and flexible Node.js web application framework that provides a robust set of features for web application. We have Node JS express MVC framework since it provides a lot of in built packages for different functionalities which we plan to achieve. Since it has a great support and bunch of features, Express is one of the best framework for Node. Front End – EJS: EJS stands for Embedded JavaScript, it is essentially HTML with JavaScript based features embedded for templating. EJS is primarily HTML but with additional features which allows us to reuse pieces of our components. If we have any HTML project, then all we need to do is to rename it to .ejs extension and we can start using EJS. For Highchart-1 <!DOCTYPE html> <html lang="en"> <head> <meta charset="utf-8"> <meta name="viewport" content="width=device-width, initial-scale=1.0"> <meta name="description" content=""> <meta http-equiv="X-UA-Compatible" content="IE=edge"> <meta name="viewport" content="width=device-width, initial-scale=1"> <meta name="author" content=""> <link href="css/bootstrap.min.css" rel="stylesheet"> <!-- Custom CSS --> <link href="css/stylish-portfolio.css" rel="stylesheet"> <!-- Custom Fonts --> <link href="font-awesome/css/font-awesome.min.css" rel="stylesheet" type="text/css"> <link href="http://fonts.googleapis.com/css?family=Source+Sans+Pro:300,400,700,300italic,400ita lic,700italic" rel="stylesheet" type="text/css"> <script src="http://ajax.googleapis.com/ajax/libs/jquery/1.10.2/jquery.min.js"></script> <script src="http://code.highcharts.com/highcharts.js"></script> <script src="http://code.highcharts.com/highcharts-3d.js"></script> <script src="http://code.highcharts.com/highcharts-more.js"></script> <script src="http://code.highcharts.com/modules/solid-gauge.js"></script> <script src="http://code.highcharts.com/modules/exporting.js"></script>
  • 37. 37 <!--<link rel="shortcut icon" href="assets/images/gt_favicon.png">--> <style type="text/css"> .chartSize { height: 100%; width: 50%; position: relative; } .scrollit { overflow: scroll; height: 350px; } </style> <script type="text/javascript"> function generateMeterResults() { var gaugeOptions = { chart: { type: 'solidgauge' }, title: null, pane: { center: ['50%', '85%'], size: '140%', startAngle: -90, endAngle: 90, background: { backgroundColor: (Highcharts.theme && Highcharts.theme.background2) || '#EEE', innerRadius: '60%', outerRadius: '100%', shape: 'arc' } }, tooltip: { enabled: false }, // the value axis yAxis: { stops: [ [0.1, '#DF5353'], // red [0.5, '#DDDF0D'], // yellow [0.9, '#55BF3B'] // green ], lineWidth: 0, minorTickInterval: null, tickPixelInterval: 400,
  • 38. 38 tickWidth: 0, title: { y: -70 }, labels: { y: 16 } }, plotOptions: { solidgauge: { dataLabels: { y: 5, borderWidth: 0, useHTML: true } } } }; twitterSearch.js var util = require('util'), twit = require('twit'), sentimentAnalysis = require('./twitterSentimentAnalysis.js'); var config = { consumer_key: 'WhYExrBdjaQKyArMvJhxjHiHt', consumer_secret: 'WZ81G6ADuk2RJgGRVMsRZMGgJcUudbC7W2xdhTTx1Miqbhr68y', access_token: '2433226039-ALNzRIdqRR3StA2GZSXyPDuMJMhp5rm604BWktz', access_token_secret: 'nwUXQJsFraf4wd2SB8ls3BKQiB5uAWVEWO1Ea6cLk9ifB' }; exports.getTweets = function getTweets(comp1, criteria, callback) { var twitterClient = new twit(config); var tweetsPolarity = []; var positive = 0; var negative = 0; var neutral = 0; var twitQuery = comp1 + ' ' + criteria + ' since:2015-01-01'; var analysisResult; twitterClient.get('search/tweets', {q: twitQuery, count: 100}, function (err, data) {
  • 39. 39 var totalTweets = data.statuses; var tweets = []; console.log(JSON.stringify(totalTweets)); console.log("totalTweets.length="+totalTweets.length); for (var i = 0; i < totalTweets.length; i++) { totalTweets[i].text = totalTweets[i].text.replace(/^RT/, ""); totalTweets[i].text = totalTweets[i].text.replace(/^ReTw/, ""); tweets.push(totalTweets[i].text); } console.log("tweets.length="+tweets.length); analysisResult=sentimentAnalysis(tweets); /* tweetsPolarity.push(positive); tweetsPolarity.push(negative); tweetsPolarity.push(neutral); callback(err, tweetsPolarity, tweets); */ callback(err, analysisResult, tweets); } ); } twitterSentimentAnalysis.js var sentiment = require('sentiment'); module.exports = function(text) { return sentiment(text); }; Middle tier – Express: We have used Express as a middleware for Node JS framework. An express application is a series of middleware calls. Middleware is a function with access to the request object(req), response object(res) and the next middleware in line in the request-response cycle of an Express application. Middleware can do the following: 1. Execute code 2. Make changes to the request 3. End the request response cycle 4. Call the next middleware in the stack An express application can use following kinds of middleware: 1. Application level middleware 2. Router level middleware 3. Error handling middleware
  • 40. 40 4. Built in middleware 5. Third party middleware We have used application level middleware. Application level middleware are bound to an instance of express. App.js var express = require('express'); var path = require('path'); var logger = require('morgan'); var cookieParser = require('cookie-parser'); var bodyParser = require('body-parser'); var routesBase = require('./routes/index'); var analysis = require('./routes/analysis'); var app = express(); // view engine setup app.set('views', path.join(__dirname, 'views')); app.set('view engine', 'ejs'); app.use(logger('dev')); app.use(bodyParser.json()); app.use(bodyParser.urlencoded({extended: false})); app.use(cookieParser()); app.use(express.static(path.join(__dirname, 'public'))); app.use('/', routesBase); app.post('/getStats', analysis.getStats); // catch 404 and forward to error handler app.use(function (req, res, next) { var err = new Error('Not Found'); err.status = 404; next(err); }); // error handlers // development error handler // will print stacktrace if (app.get('env') === 'development') { app.use(function (err, req, res, next) { res.status(err.status || 500); res.render('error', { message: err.message, error: err }); }); } // production error handler
  • 41. 41 // no stacktraces leaked to user app.use(function (err, req, res, next) { res.status(err.status || 500); res.render('error', { message: err.message, error: {} }); }); module.exports = app; Analysis.js var mysql = require('./mysql'); var tweetStats = require('./twitterSearch'); exports.getStats = function (req, res) { var compFirst = req.param("comp1").toLowerCase().trim(); var criteria = "stock";//"stock equity asset liability revenue EBITDA profit loss cash up down"; var compSecond = req.param("comp2").toLowerCase().trim(); var getStats = "select * from mytable1 where Company_Name='" + compFirst + "' OR Company_Name='" + compSecond + "'"; var polarity = [0,0,0]; var analysisResult; tweetStats.getTweets(compFirst, criteria, function (err, result, twits) { if (err) { throw err; } analysisResult = result; var tweets = twits; console.log("score="+analysisResult.score); mysql.fetchData(getStats, function (err, rows) { console.log("rows="+rows.length); if (rows.length < 6) { res.render('index', {error: "Error"}); console.log(err); } else { //console.log("pol..." + polarity); var year2012="2012"; var year2013="2013"; var year2014="2014"; var i; var comp1 = [];
  • 42. 42 var comp2 = []; var current_Share_Value=1; for (var i = 0; i < rows.length; i++) { if (rows[i].Company_Name.toUpperCase() === compFirst.toUpperCase()) { comp1.push(rows[i]); console.log(rows[i].Share_Values); if(rows[i].Year.toUpperCase() === year2014.toUpperCase()){ current_Share_Value=rows[i].Share_Values; } } else if (rows[i].Company_Name.toUpperCase() === compSecond.toUpperCase()) { comp2.push(rows[i]); } } var avg = (comp1[0].Share_Values+comp1[1].Share_Values+comp1[2].Share_Values)/3; var increase_by = avg-current_Share_Value; var predict_share_value = parseInt((increase_by*100)/current_Share_Value); /* var result = { score: score, vsm: vsm, feature1Words: feature1Words, //X-axis f1(w1,w4,w7) feature2Words: feature2Words, //Y-axis f2(w1,w2,w3) VS: VS, US: US, clusters: clusters //clusters[0] - red array of (x,y) -ve <X< +ve //clusters[1] - green array of (x,y) -ve <Y< +ve }; */ res.render('viewStats', { data: rows, comp1: comp1, comp2: comp2, polarity: polarity, tweets: tweets, finalPercent: predict_share_value }); } // render or error }); }); }
  • 43. 43 Data Store: MySQL is used for data storage. We have created a mock data for a set of companies. It is a relational database that stores data in the form of rows and columns i.e. tabular representation of data. Figure 17: Data store in MySQL Cloud: We have used Amazon Web Services(AWS) EC2 for hosting our web application and database. It is a open standard, cloud platform for building, running and managing apps and services. Amazon EC2 is a cloud platform that helps developers rapidly build, manage and run web as well as mobile applications. Figure 18: Screenshot from AWS EC2 Dashboard
  • 45. 45
  • 46. 46
  • 47. 47 LOAD TESTING: The load testing was conducted on our web application using the following tool: Load Impact tool: In this tool we tried load testing our web application by supplying 25 virtual users on our application and checking its performance. We tested our application for 5 minutes by giving different number of users and monitoring its performance. Below images will give you the detail overview of the performance of our application with different number of users.
  • 48. 48
  • 49. 49 Following screenshot shows the result of 25 virtual machines. These virtual machines were tested on auto generated scenarios. As you can see, there were 138 auto-generated scenarios and all are passed successfully.
  • 50. 50 REFERENCES: [1]. Wikipedia, 'Mergers and acquisitions', 2015. [Online]. Available: http://en.wikipedia.org/wiki/Mergers_and_acquisitions#Acquisition. [2]. Finance.yahoo.com, 2015. [Online]. Available: http://finance.yahoo.com [3]. Google.com, 'Google Finance: Stock market quotes, news, currency conversions & more', 2015. [Online]. Available: https://www.google.com/finance.