Download as PDF, PPTX

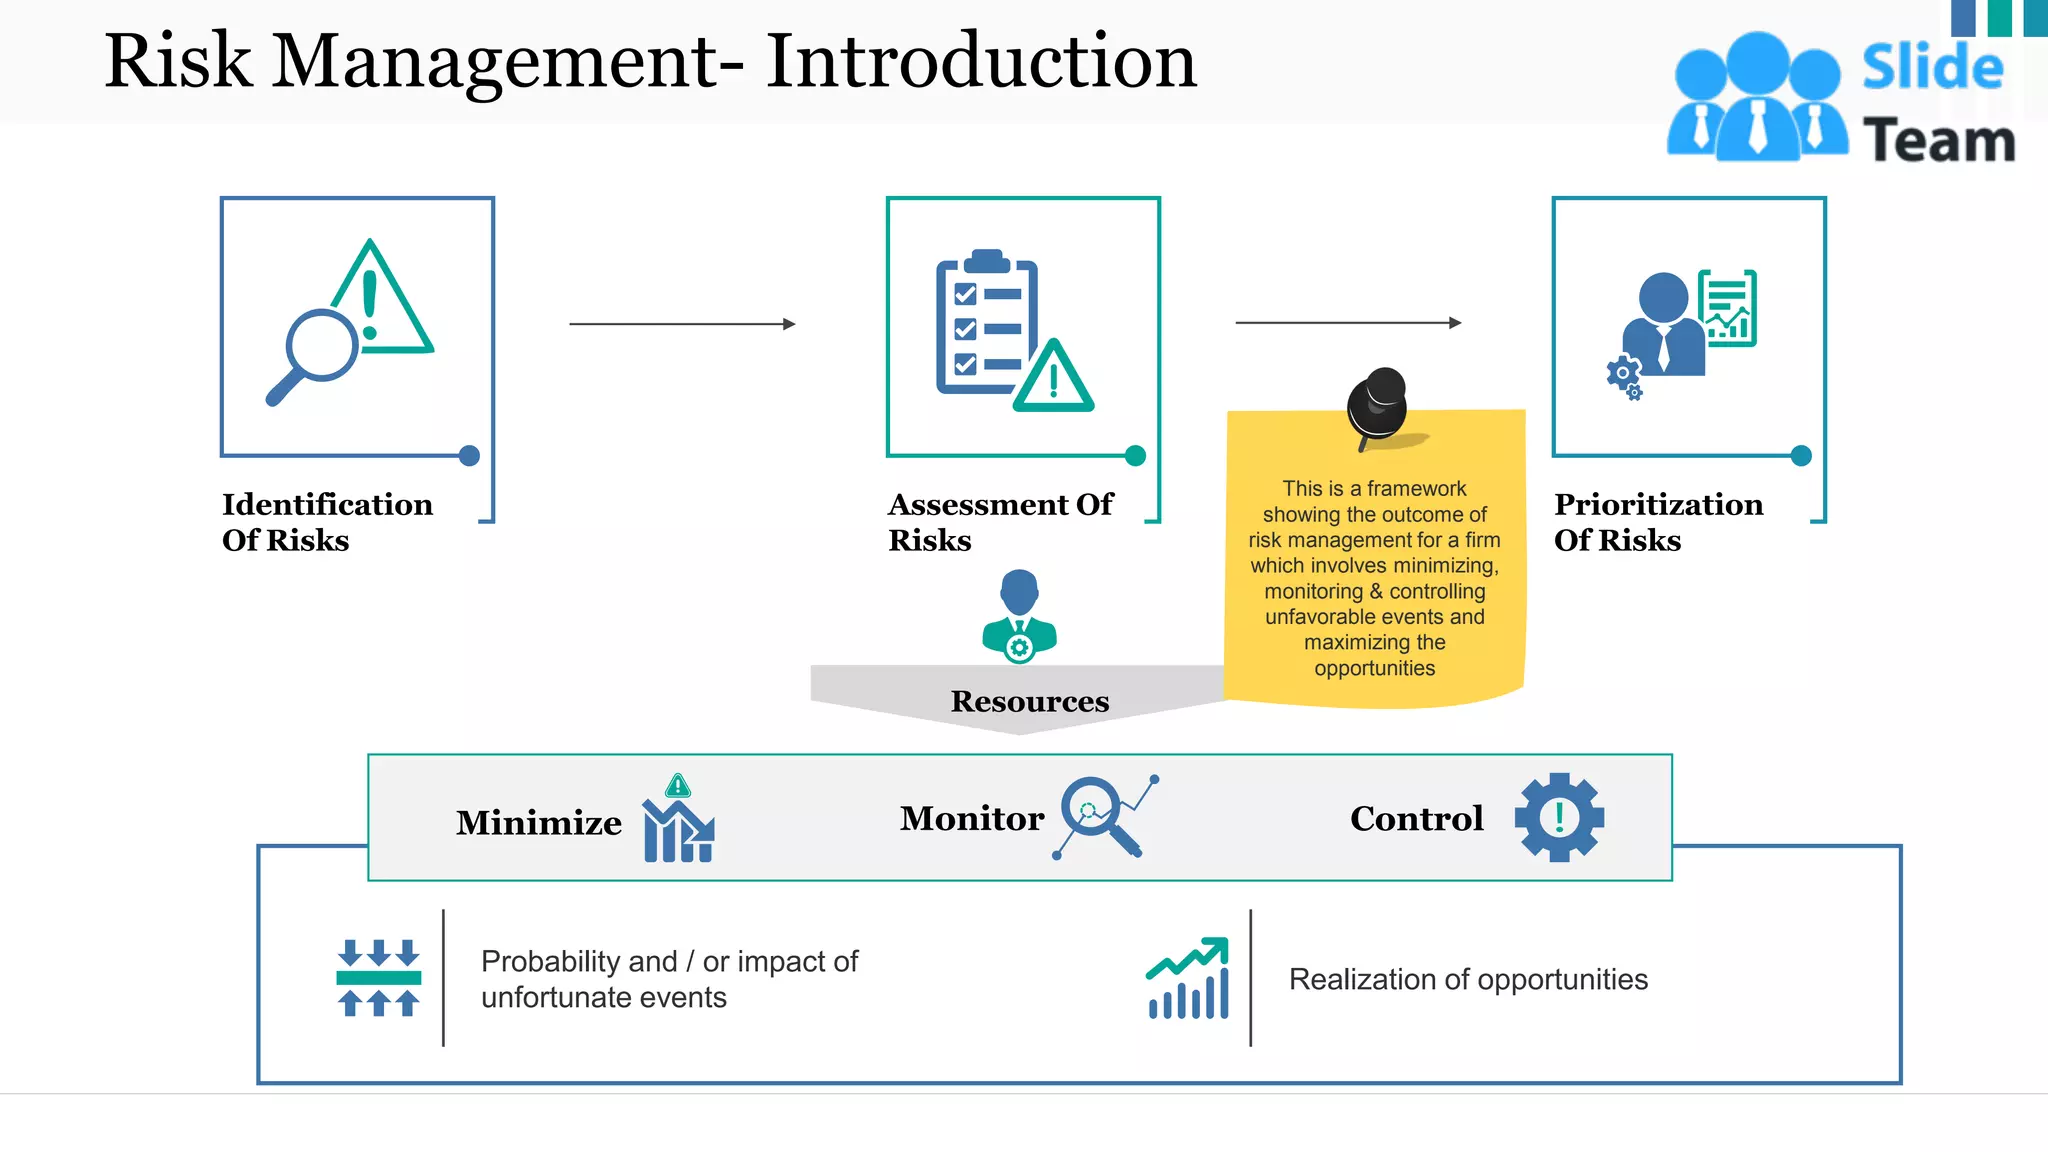
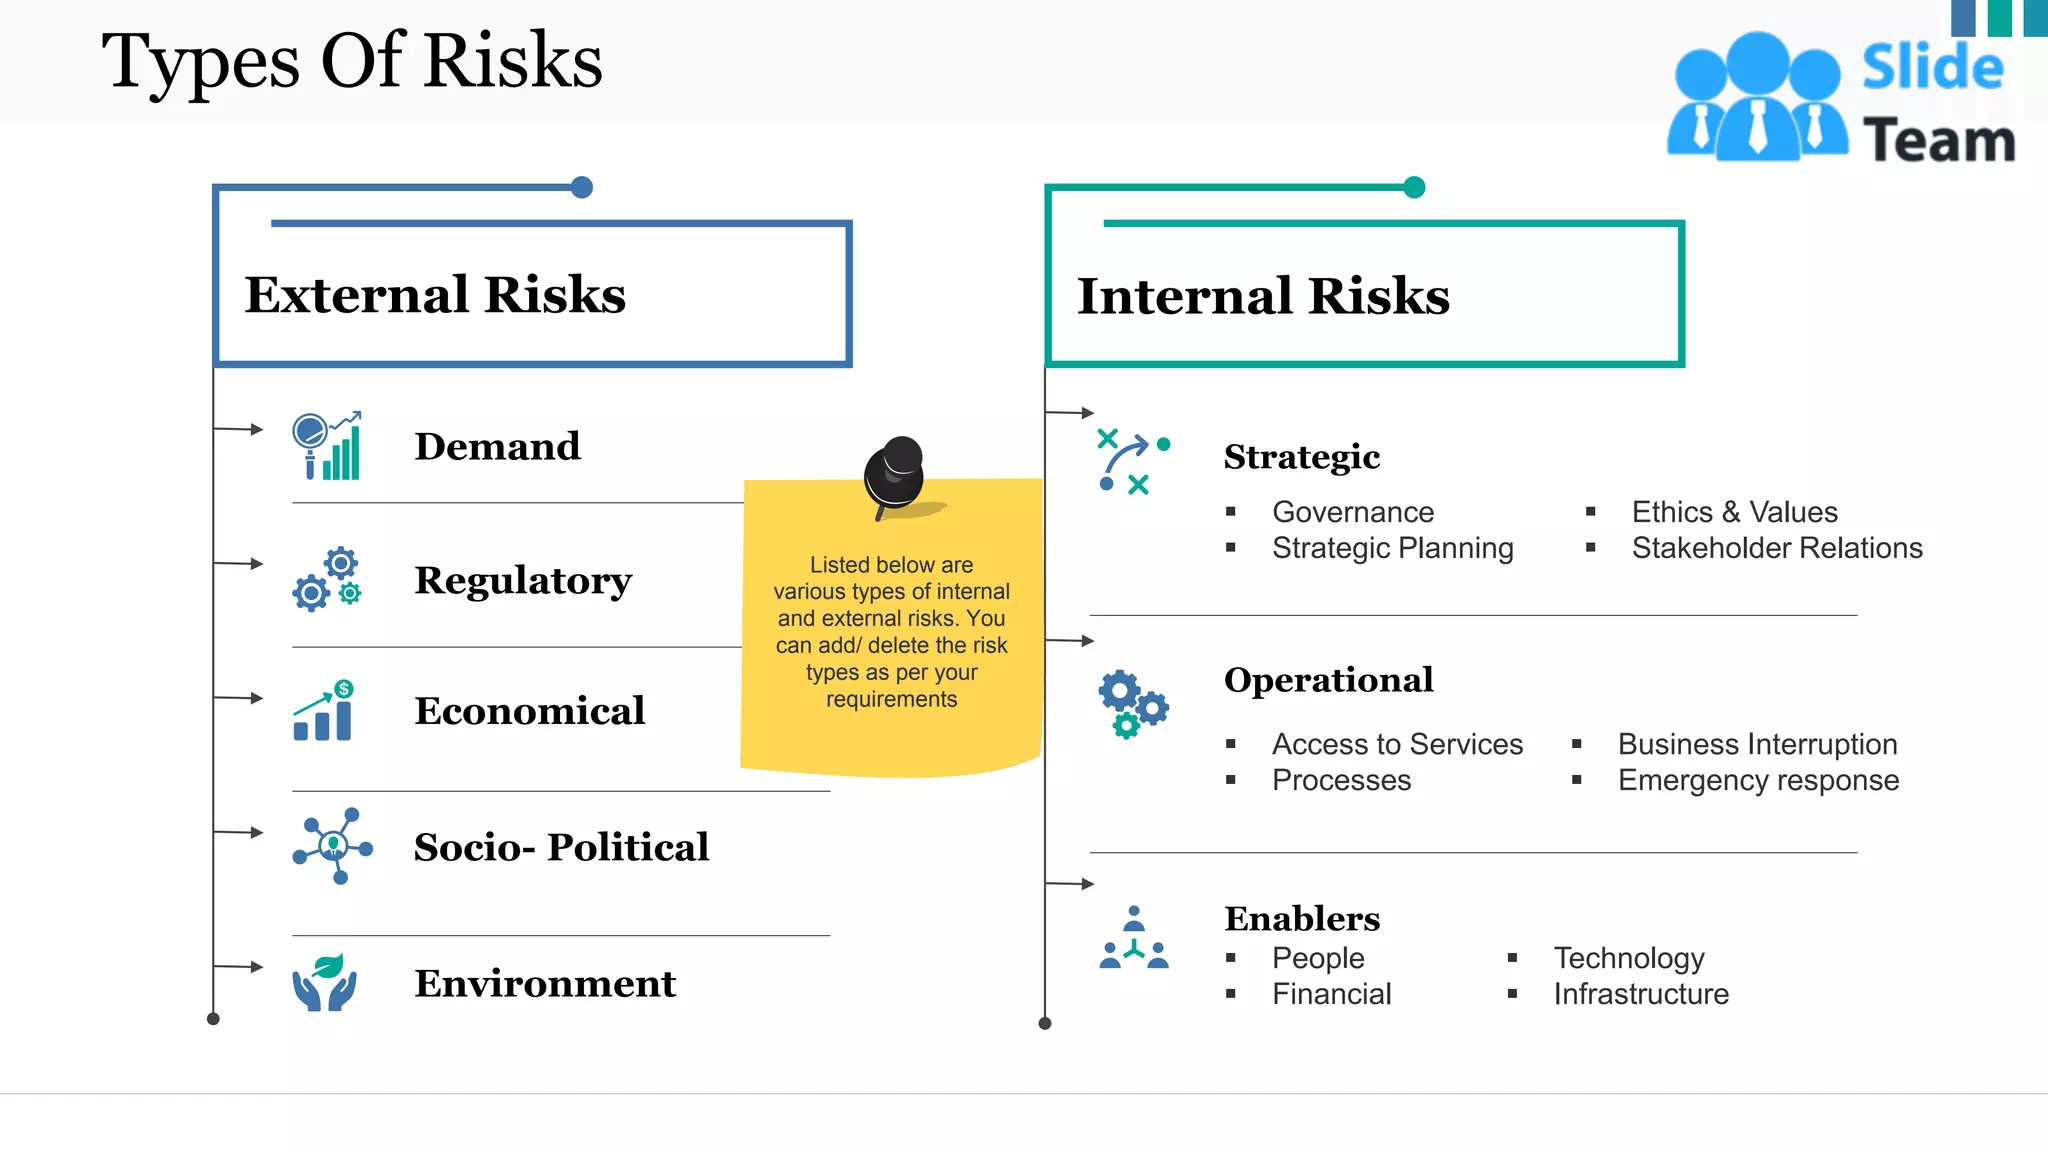
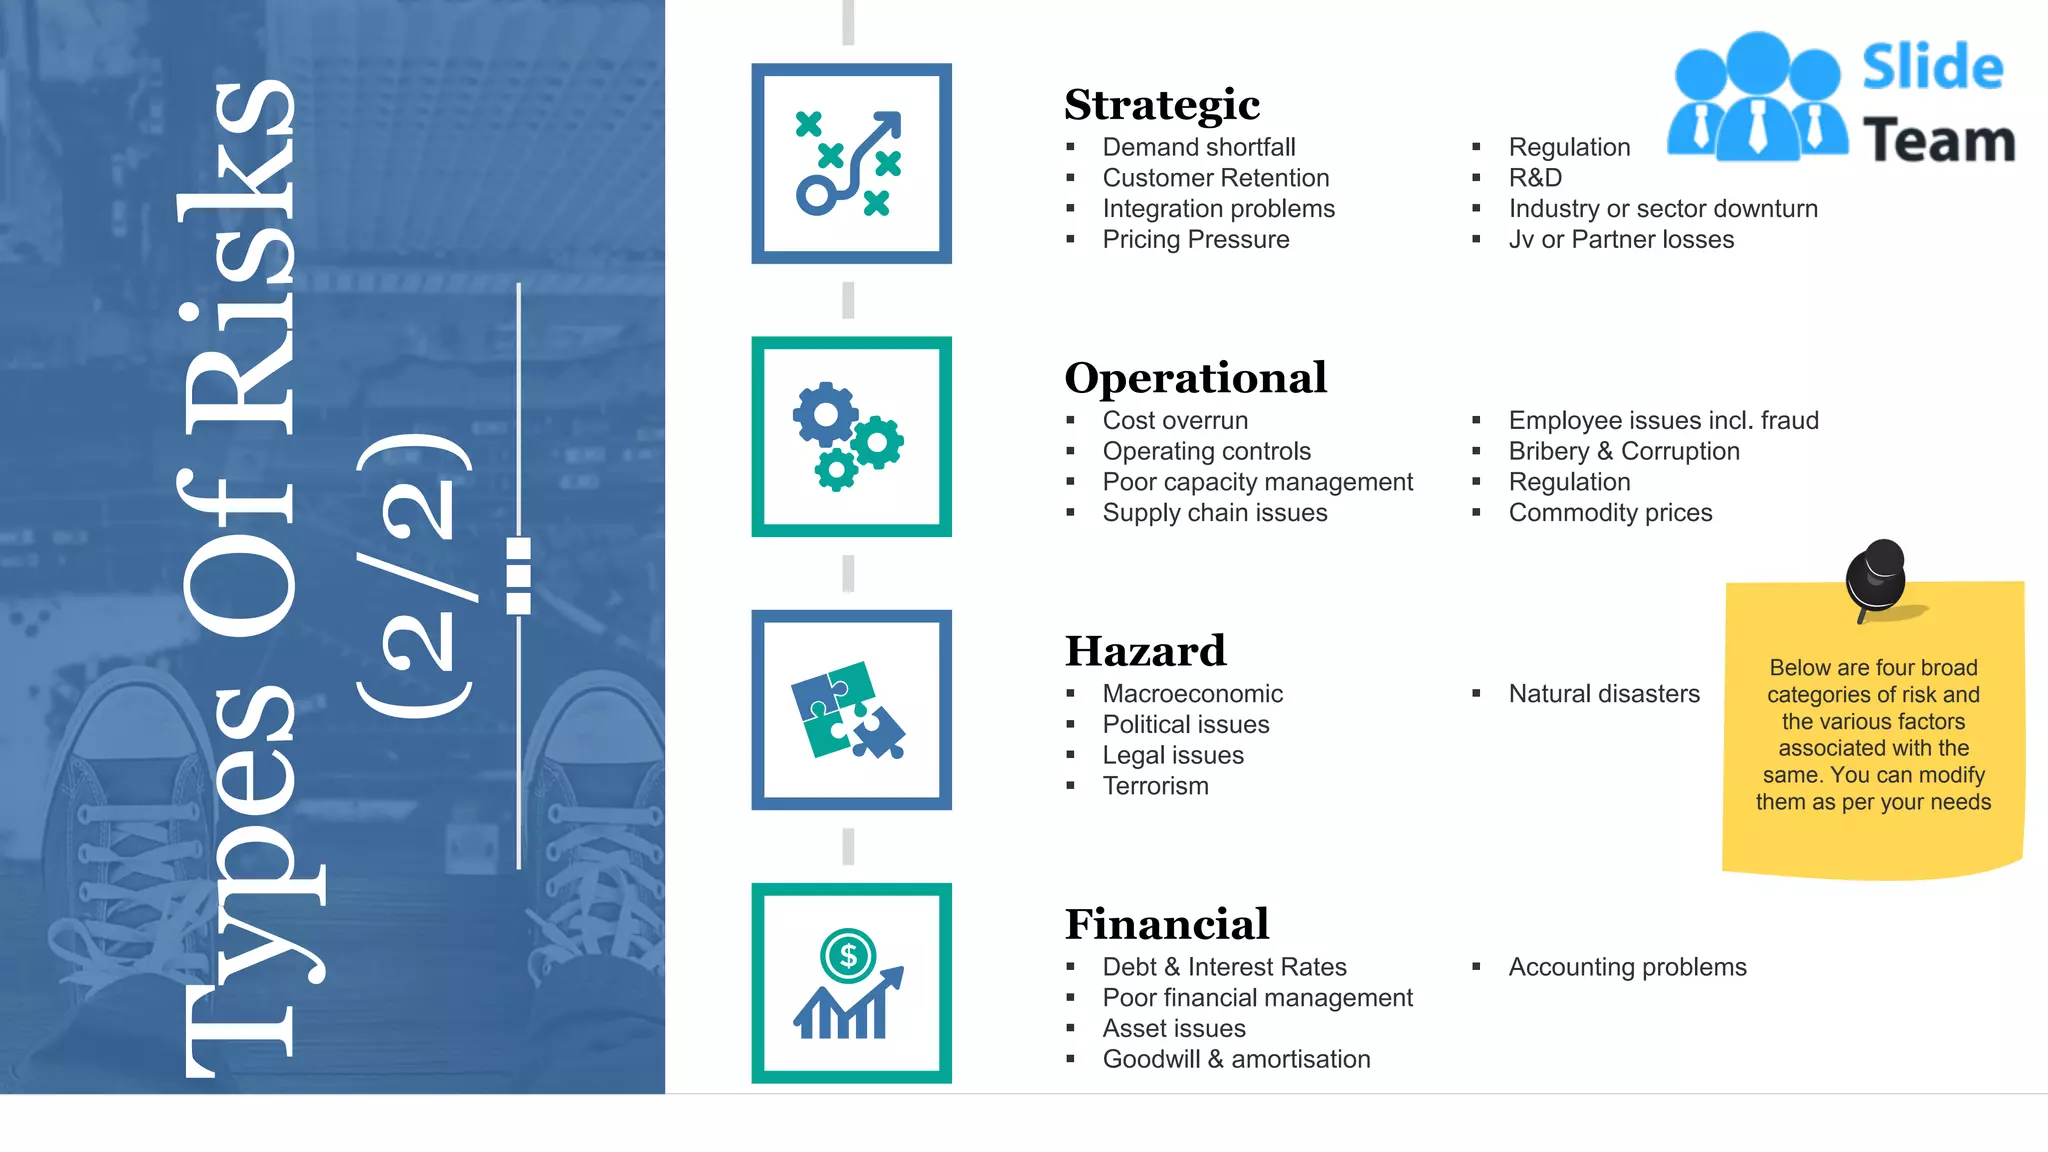
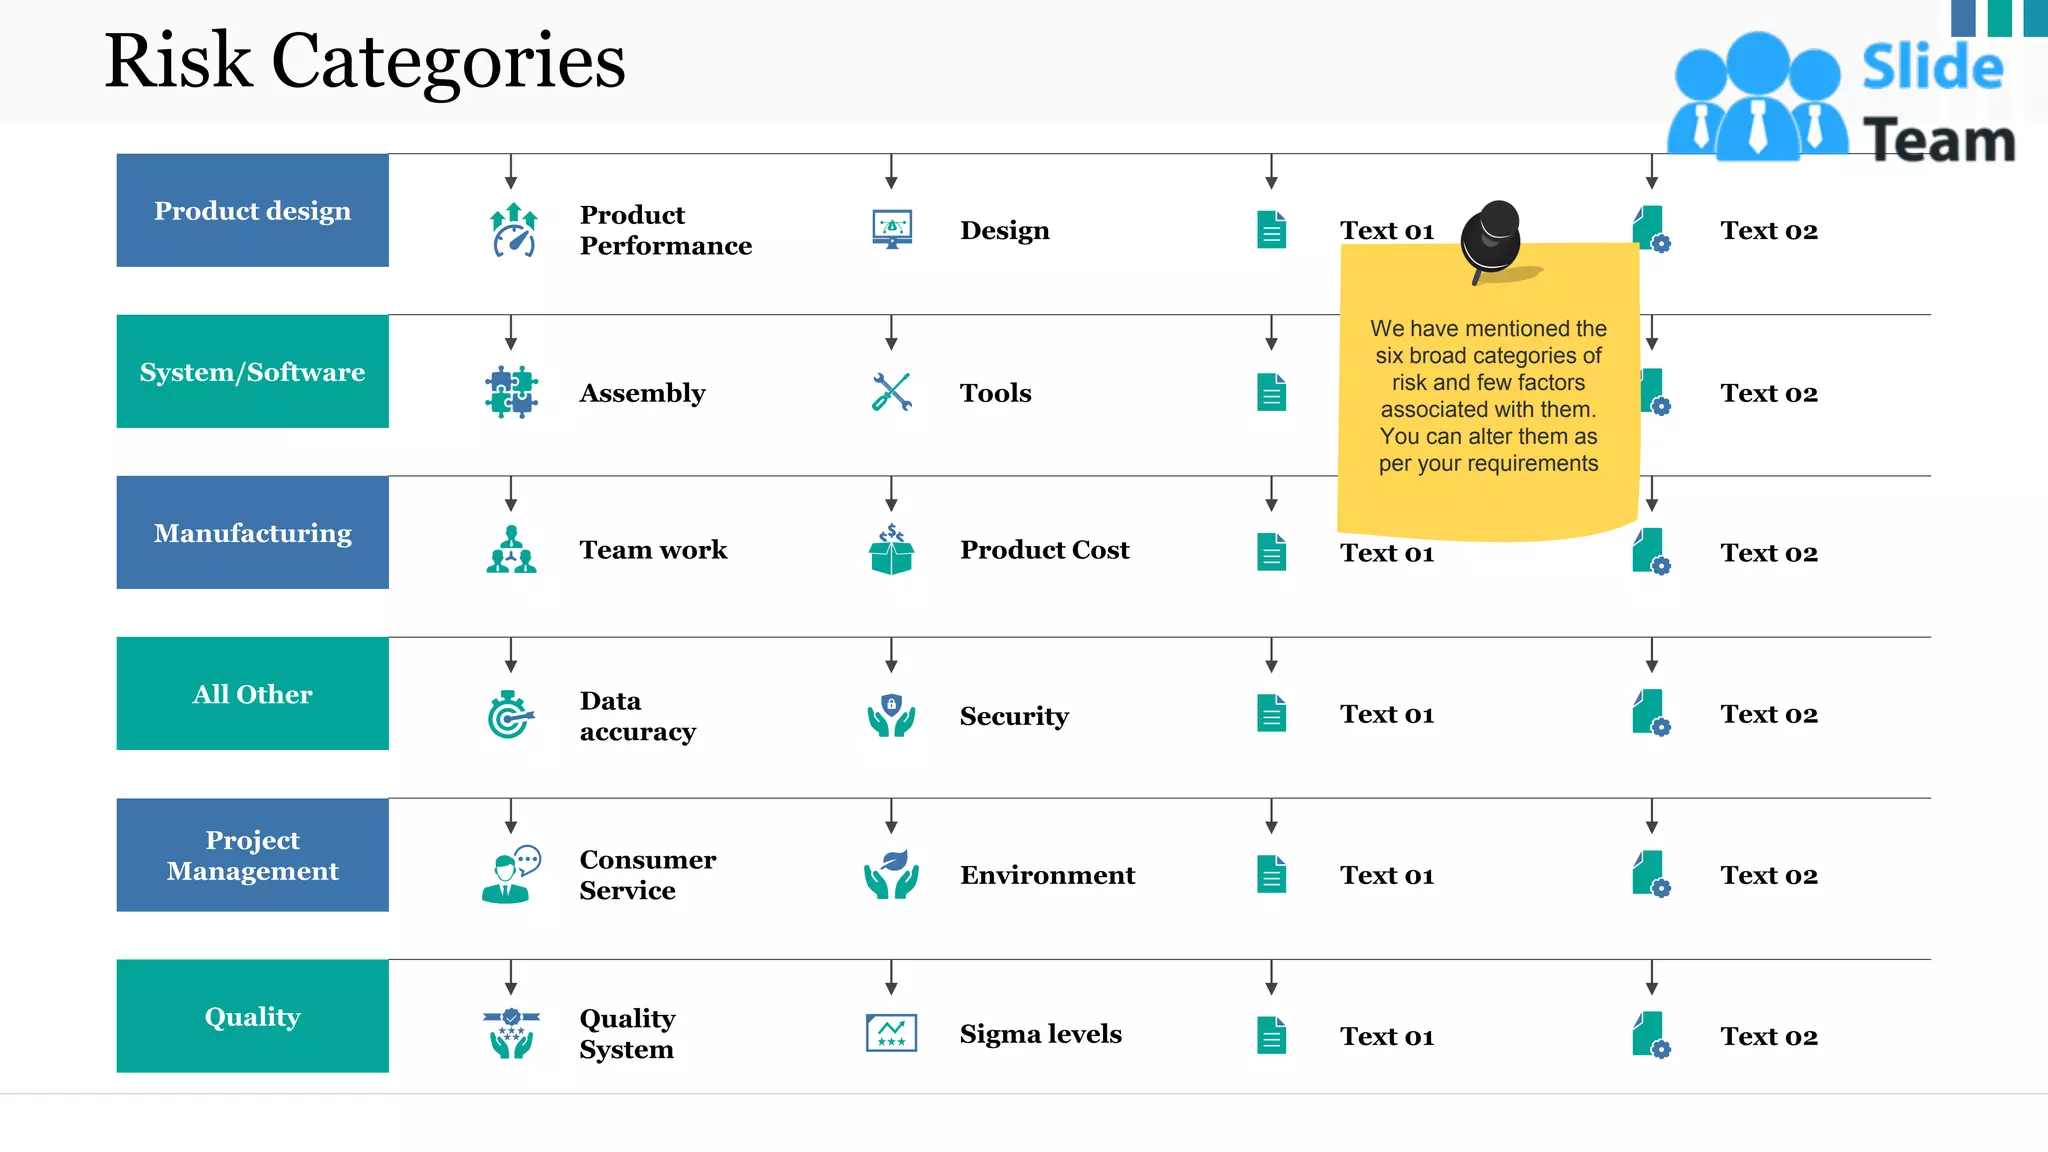
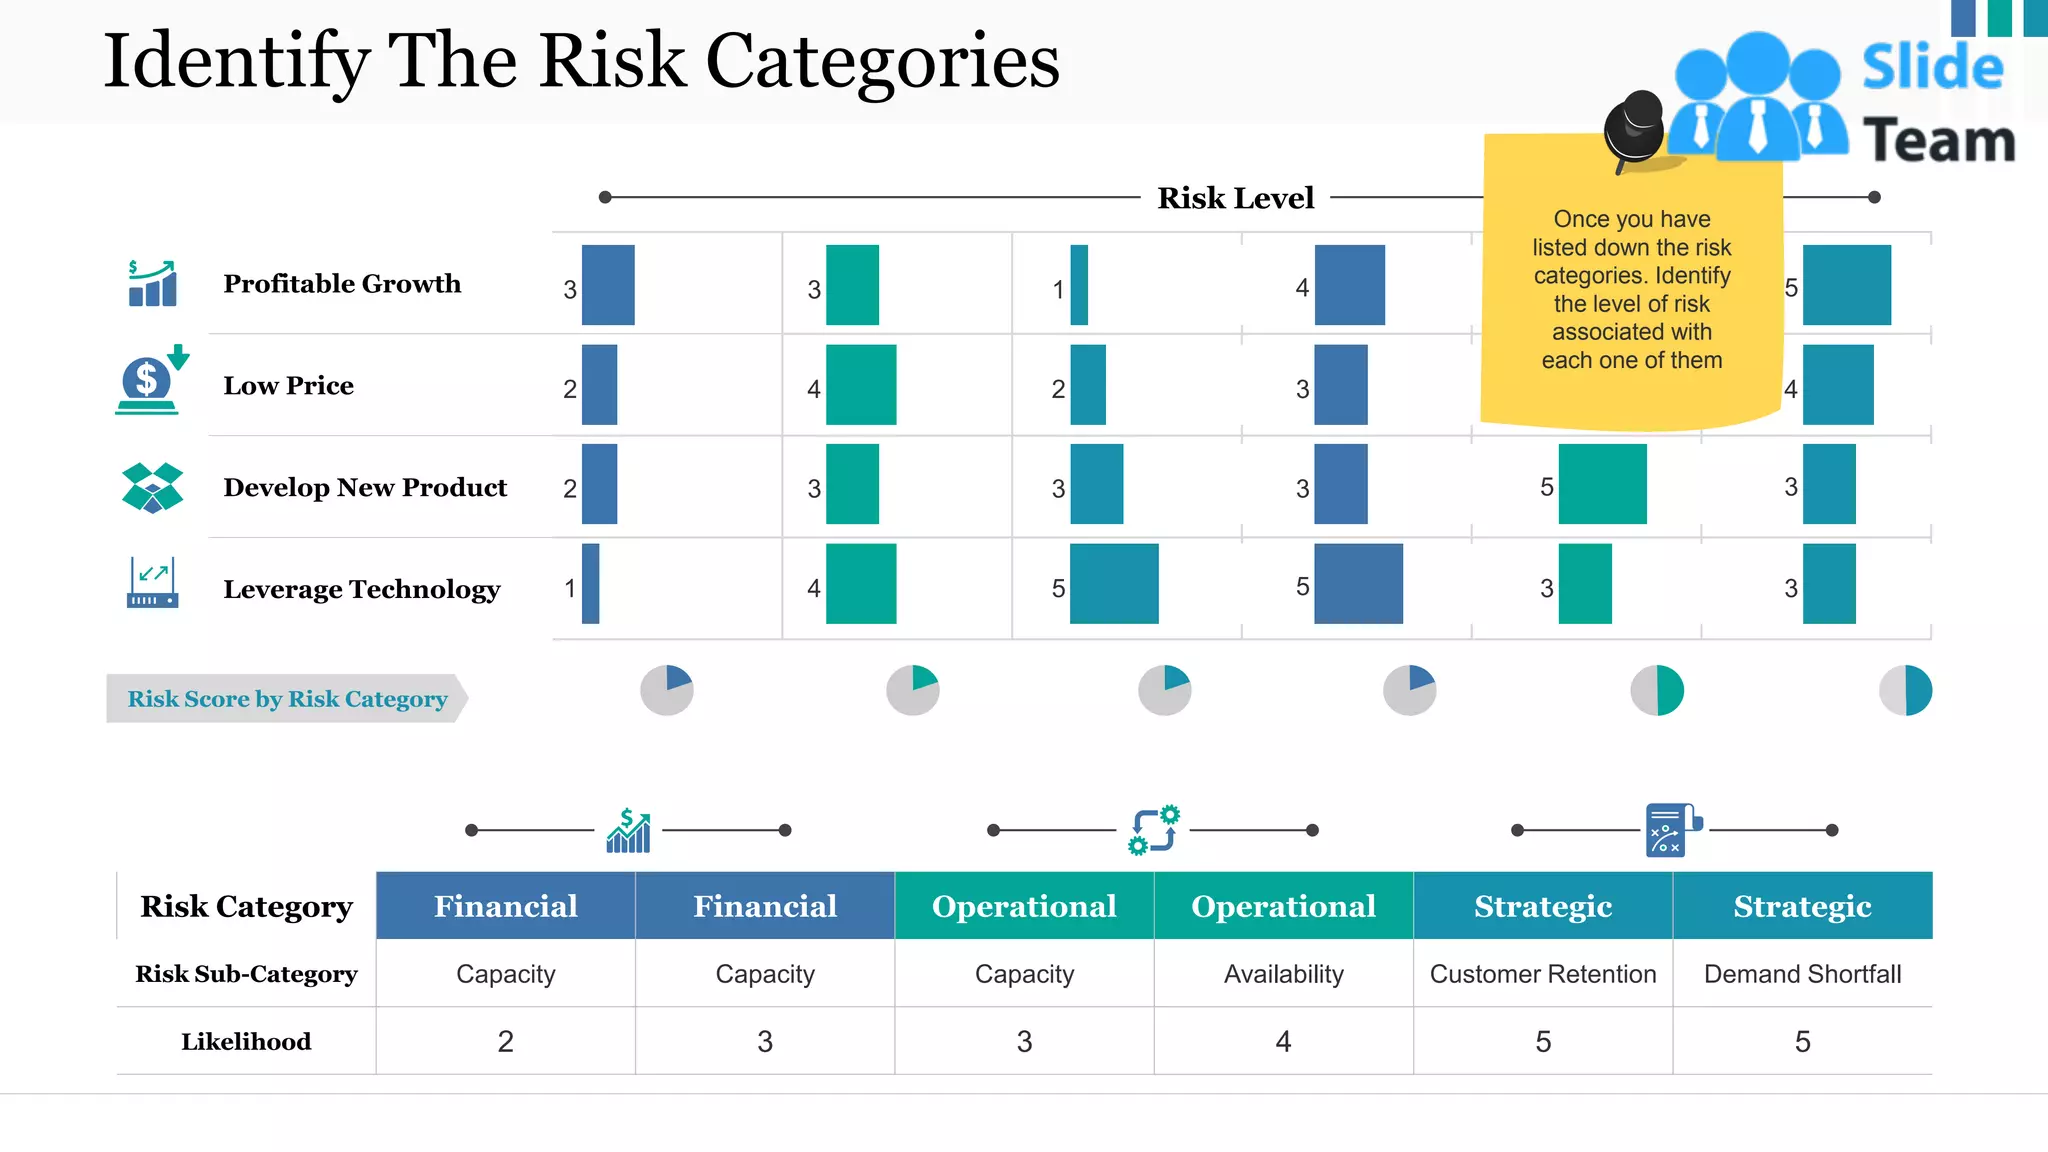
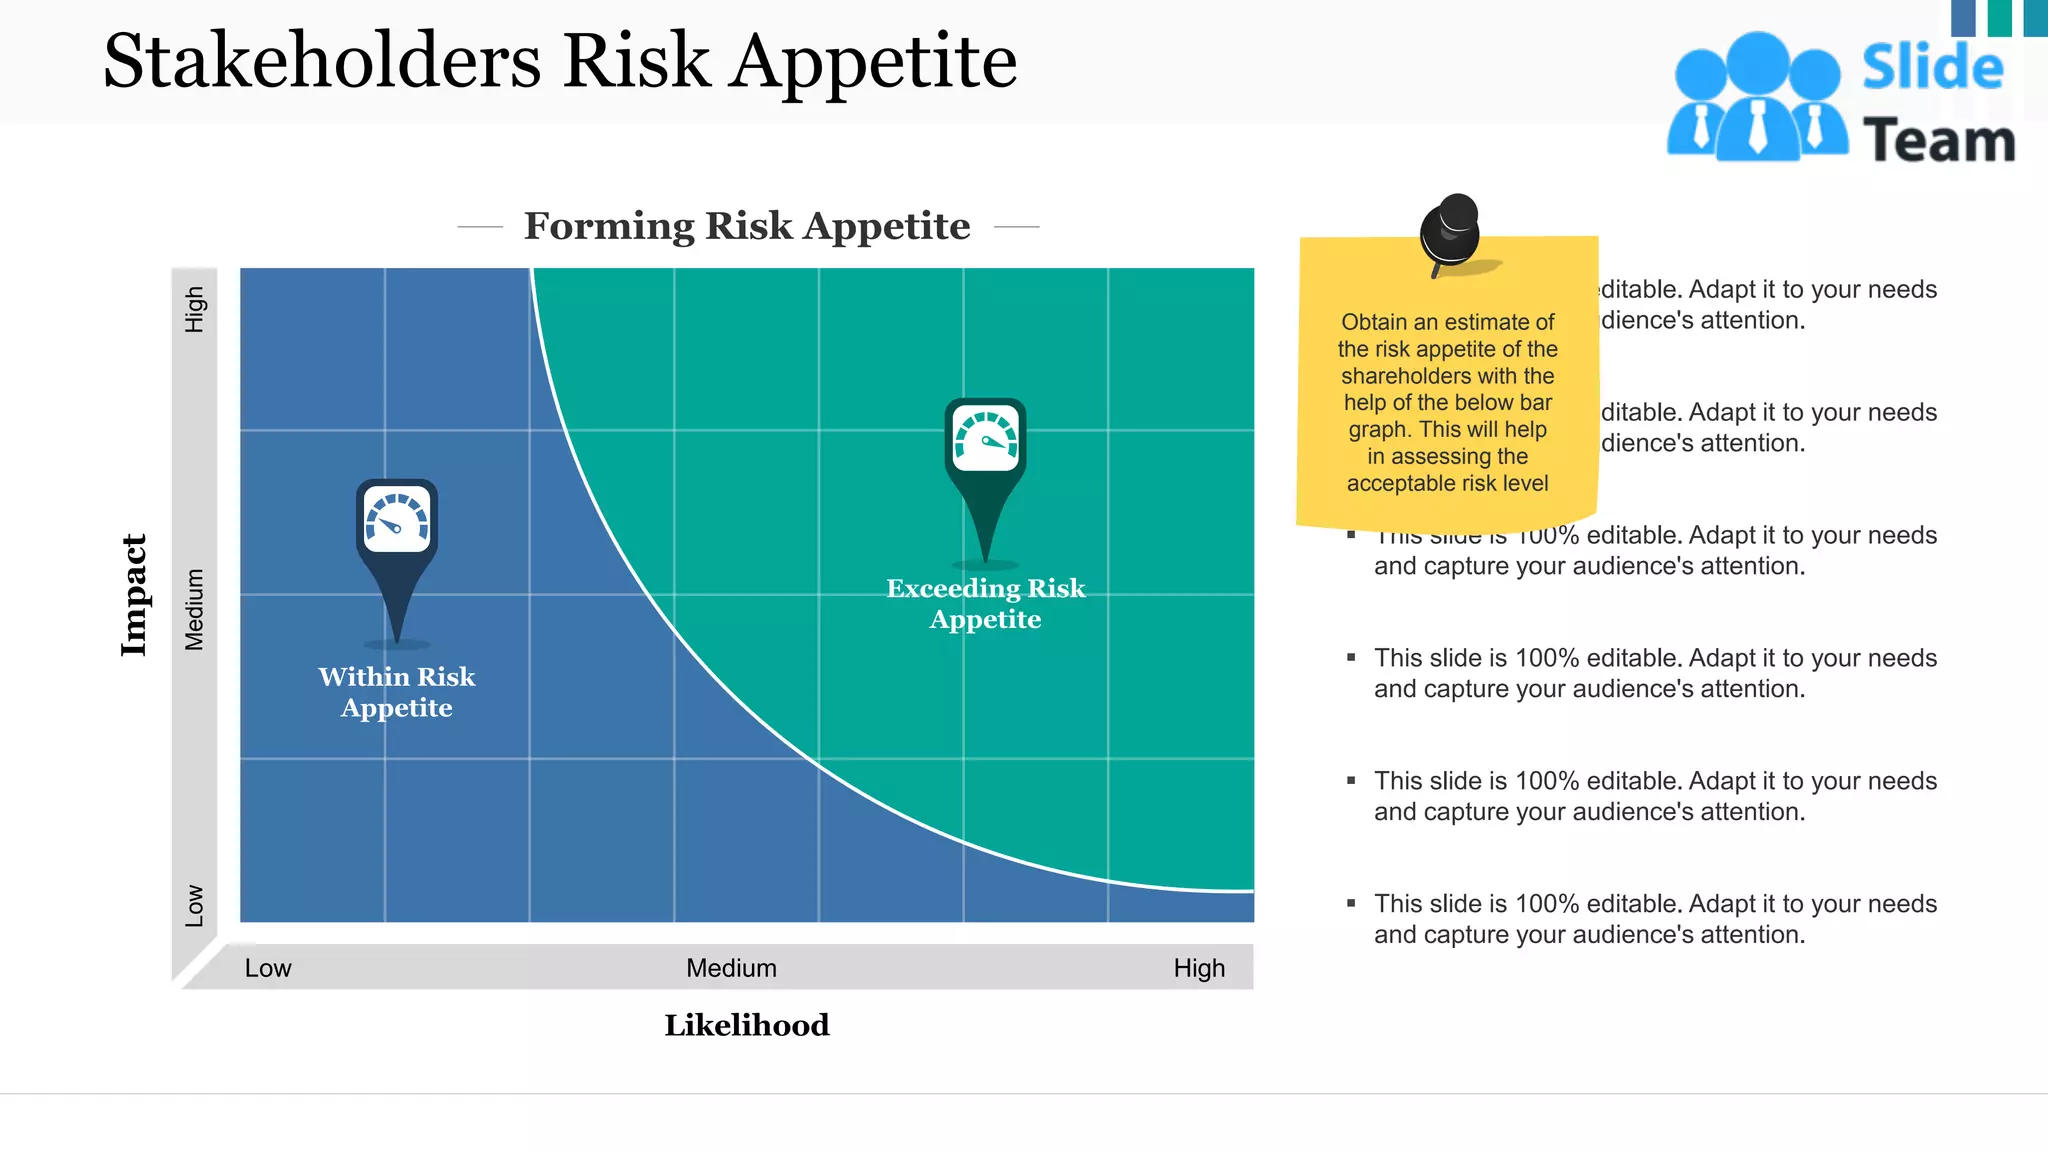
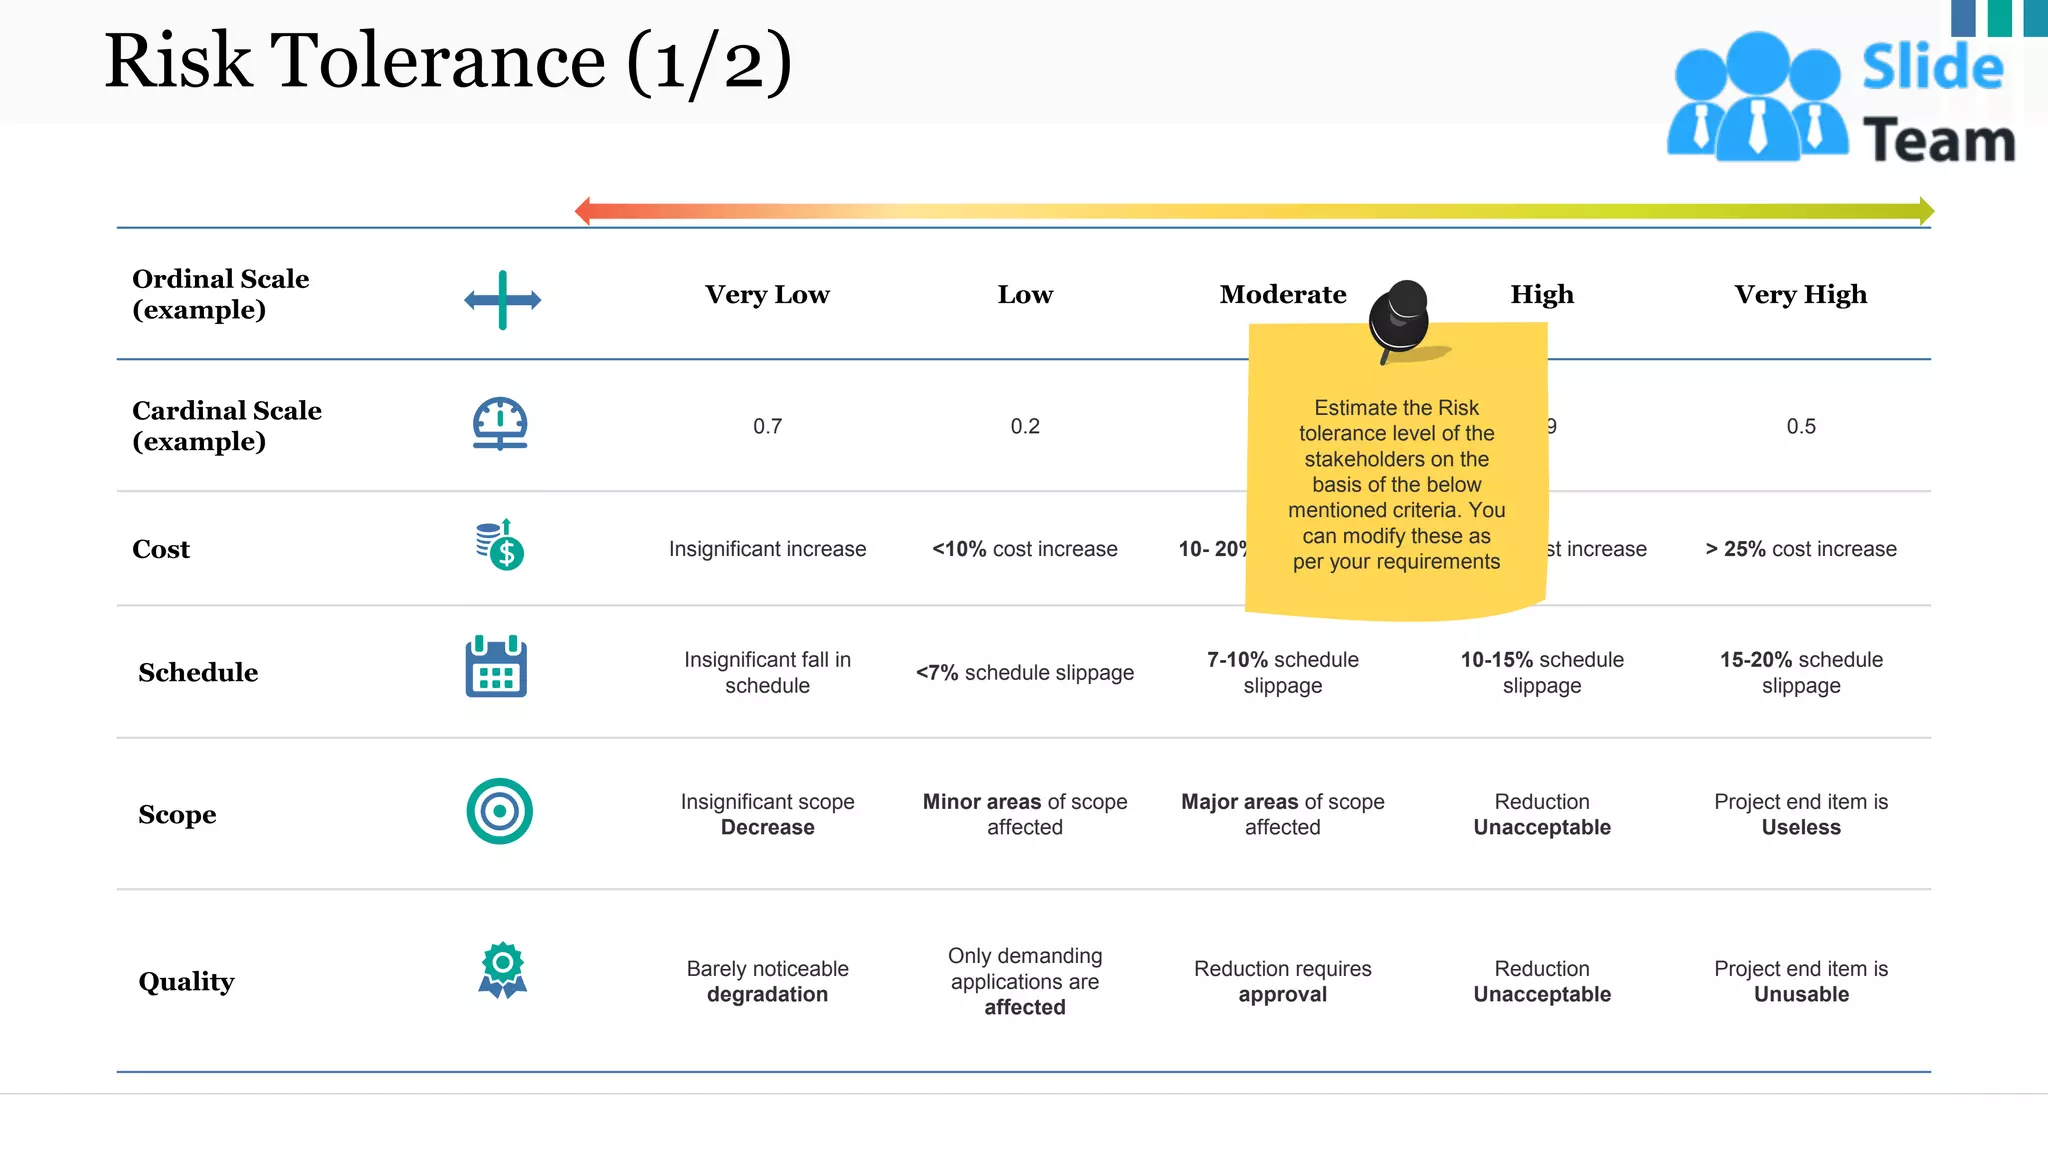
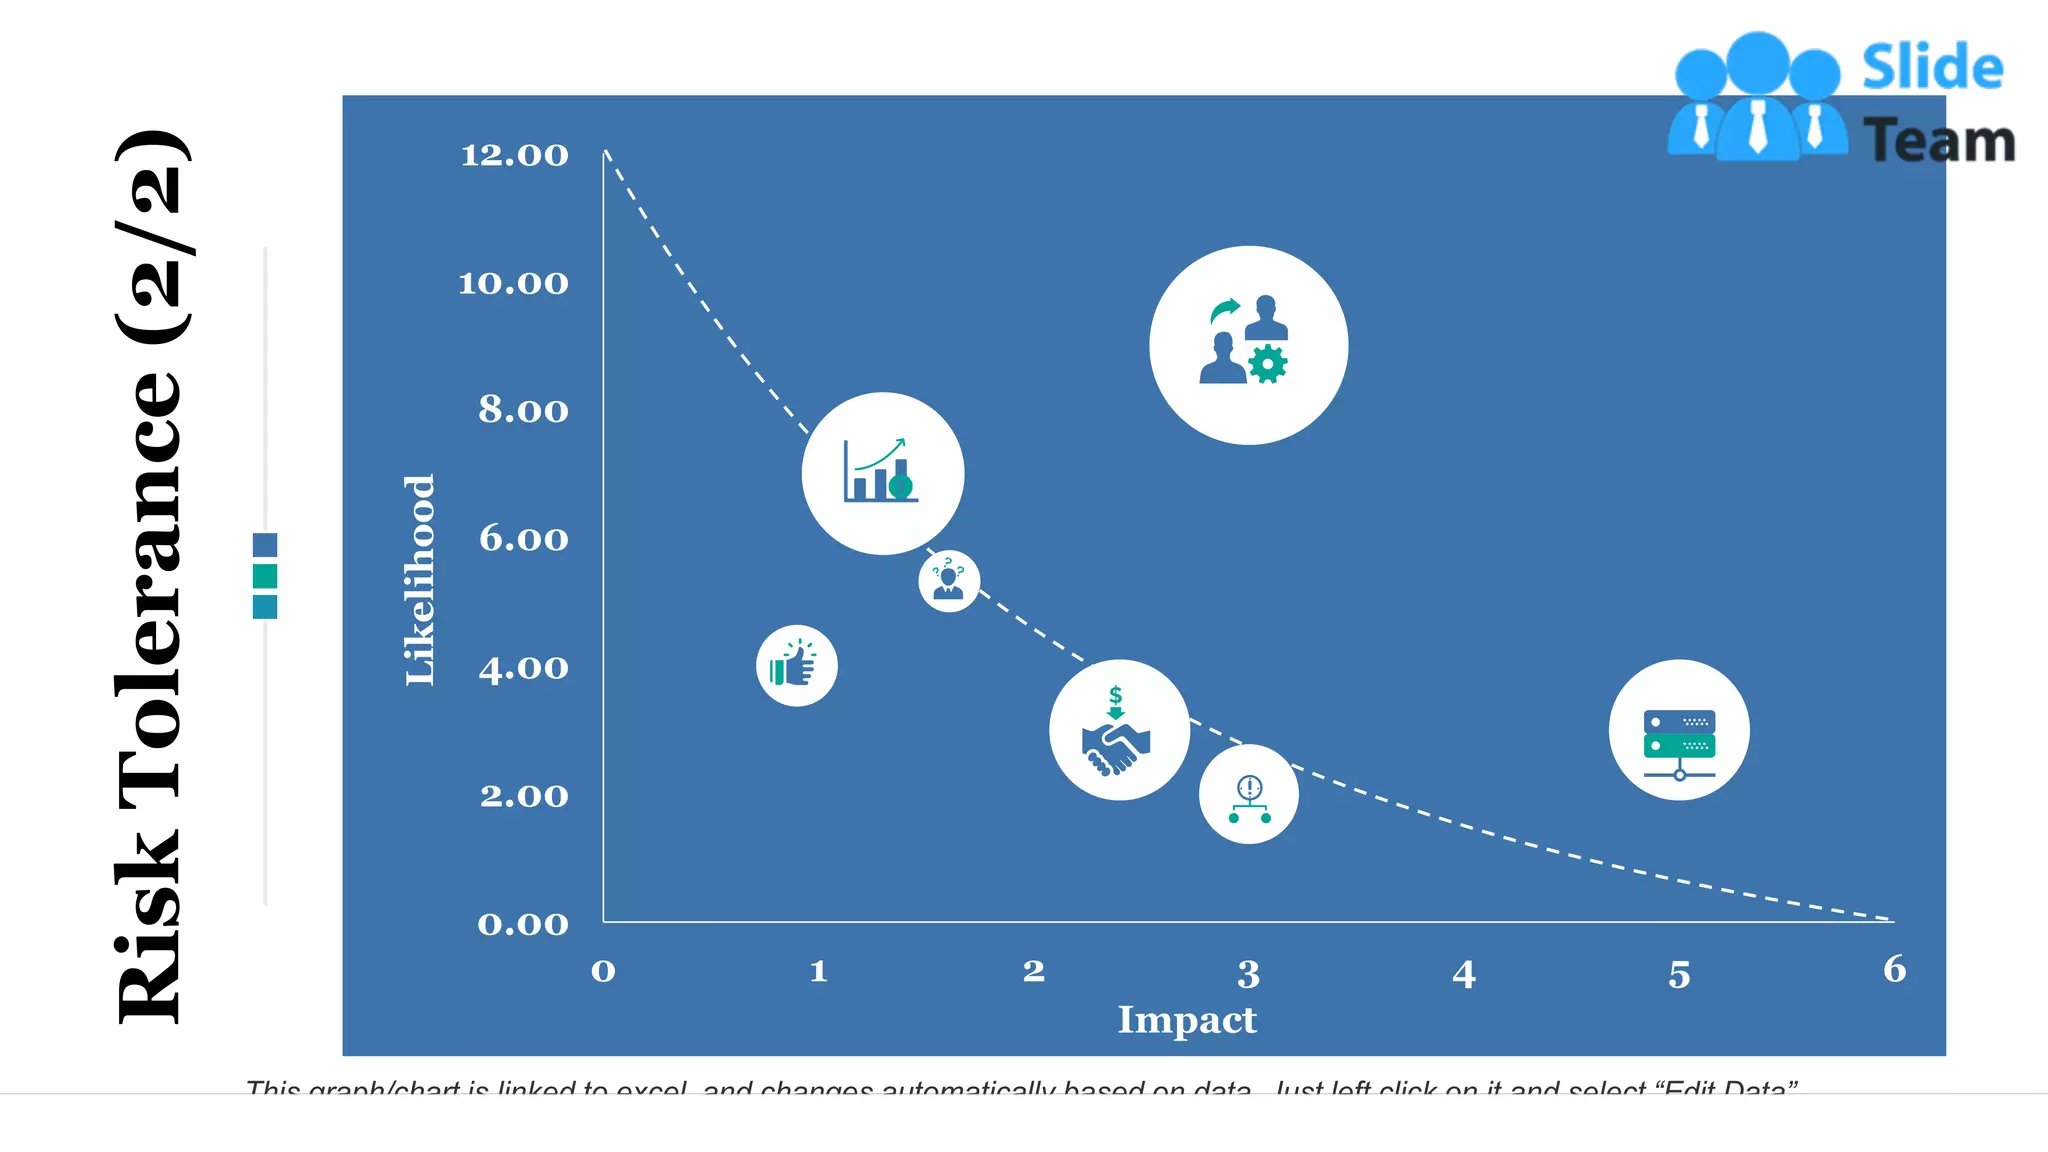
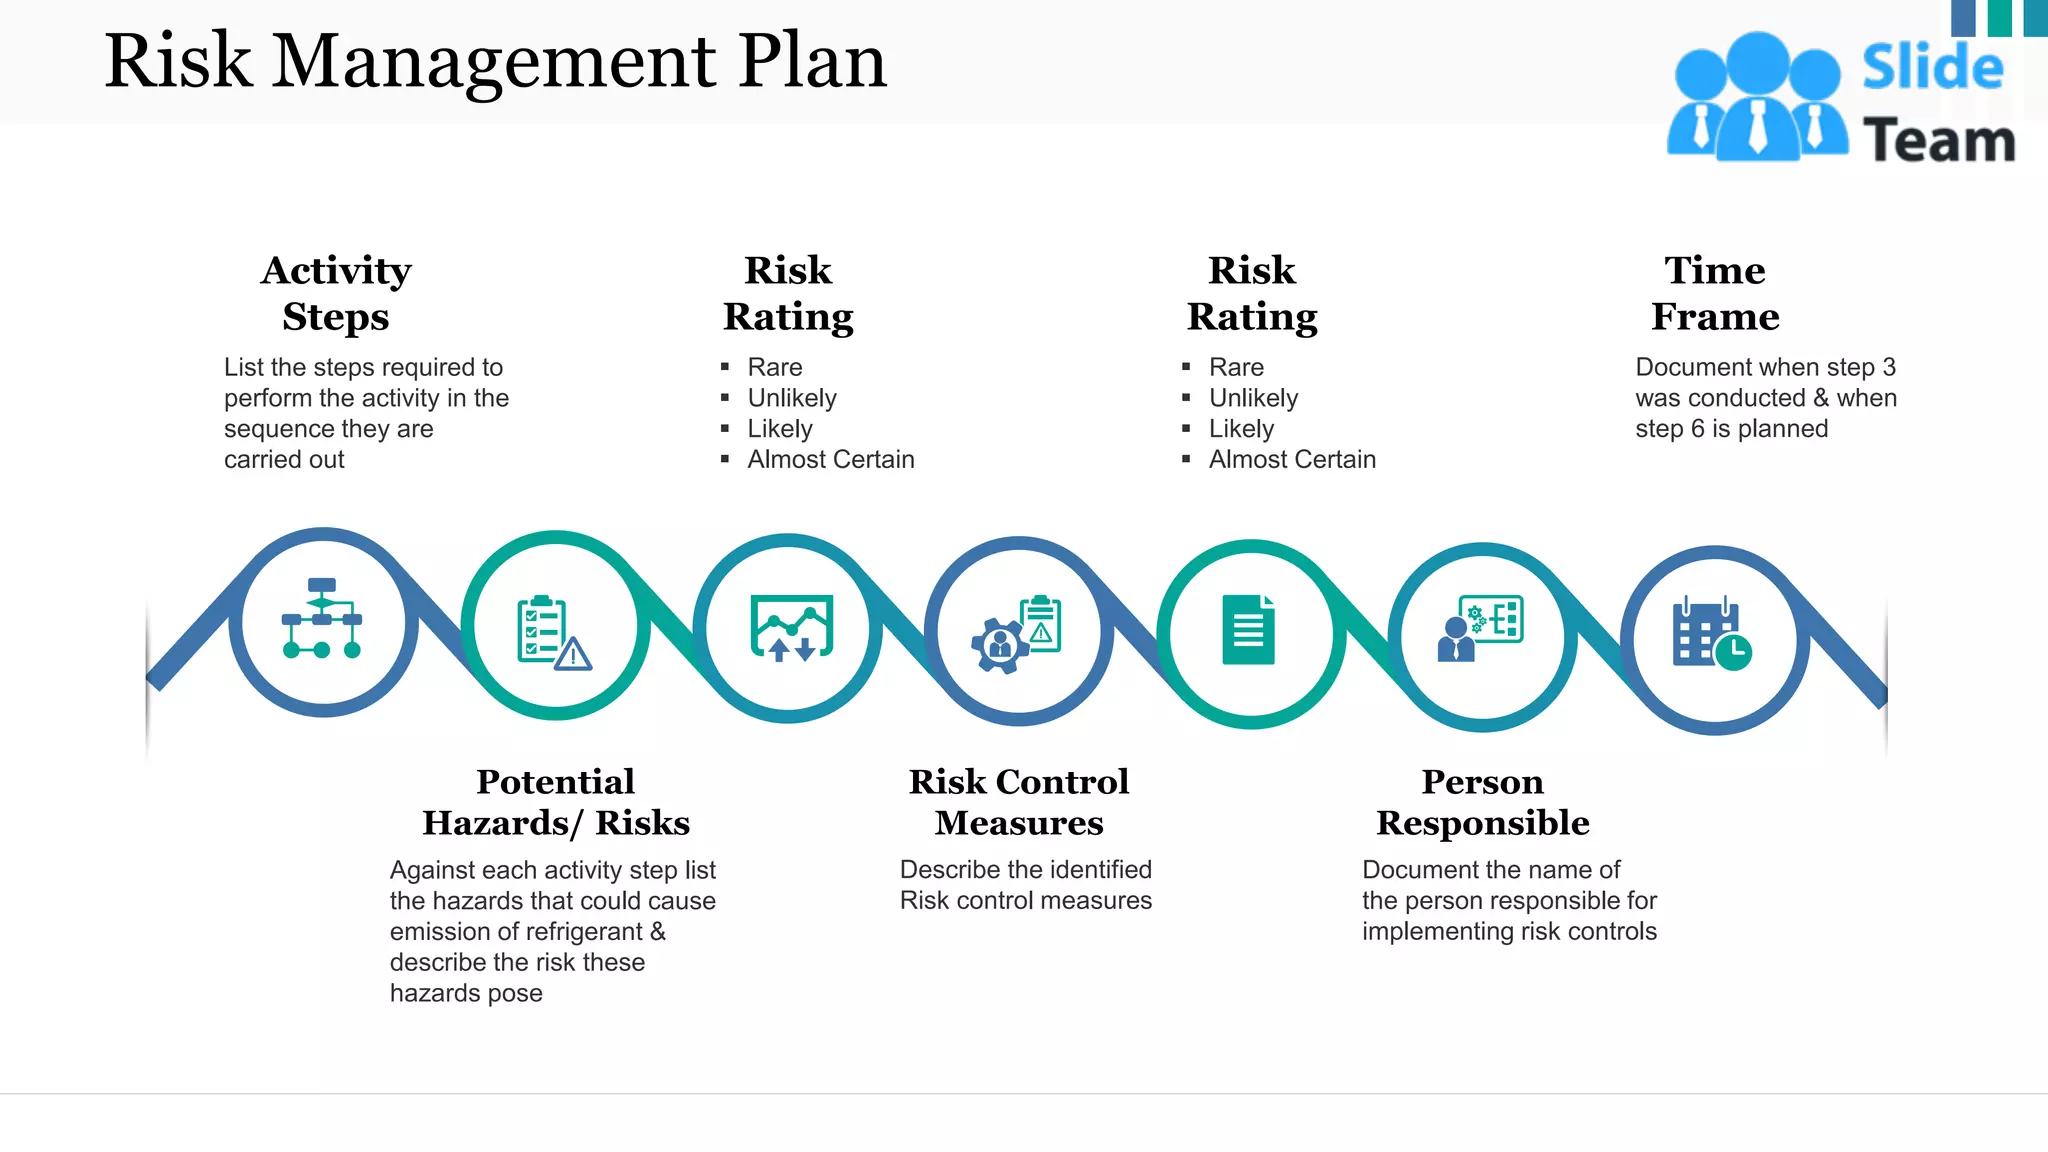


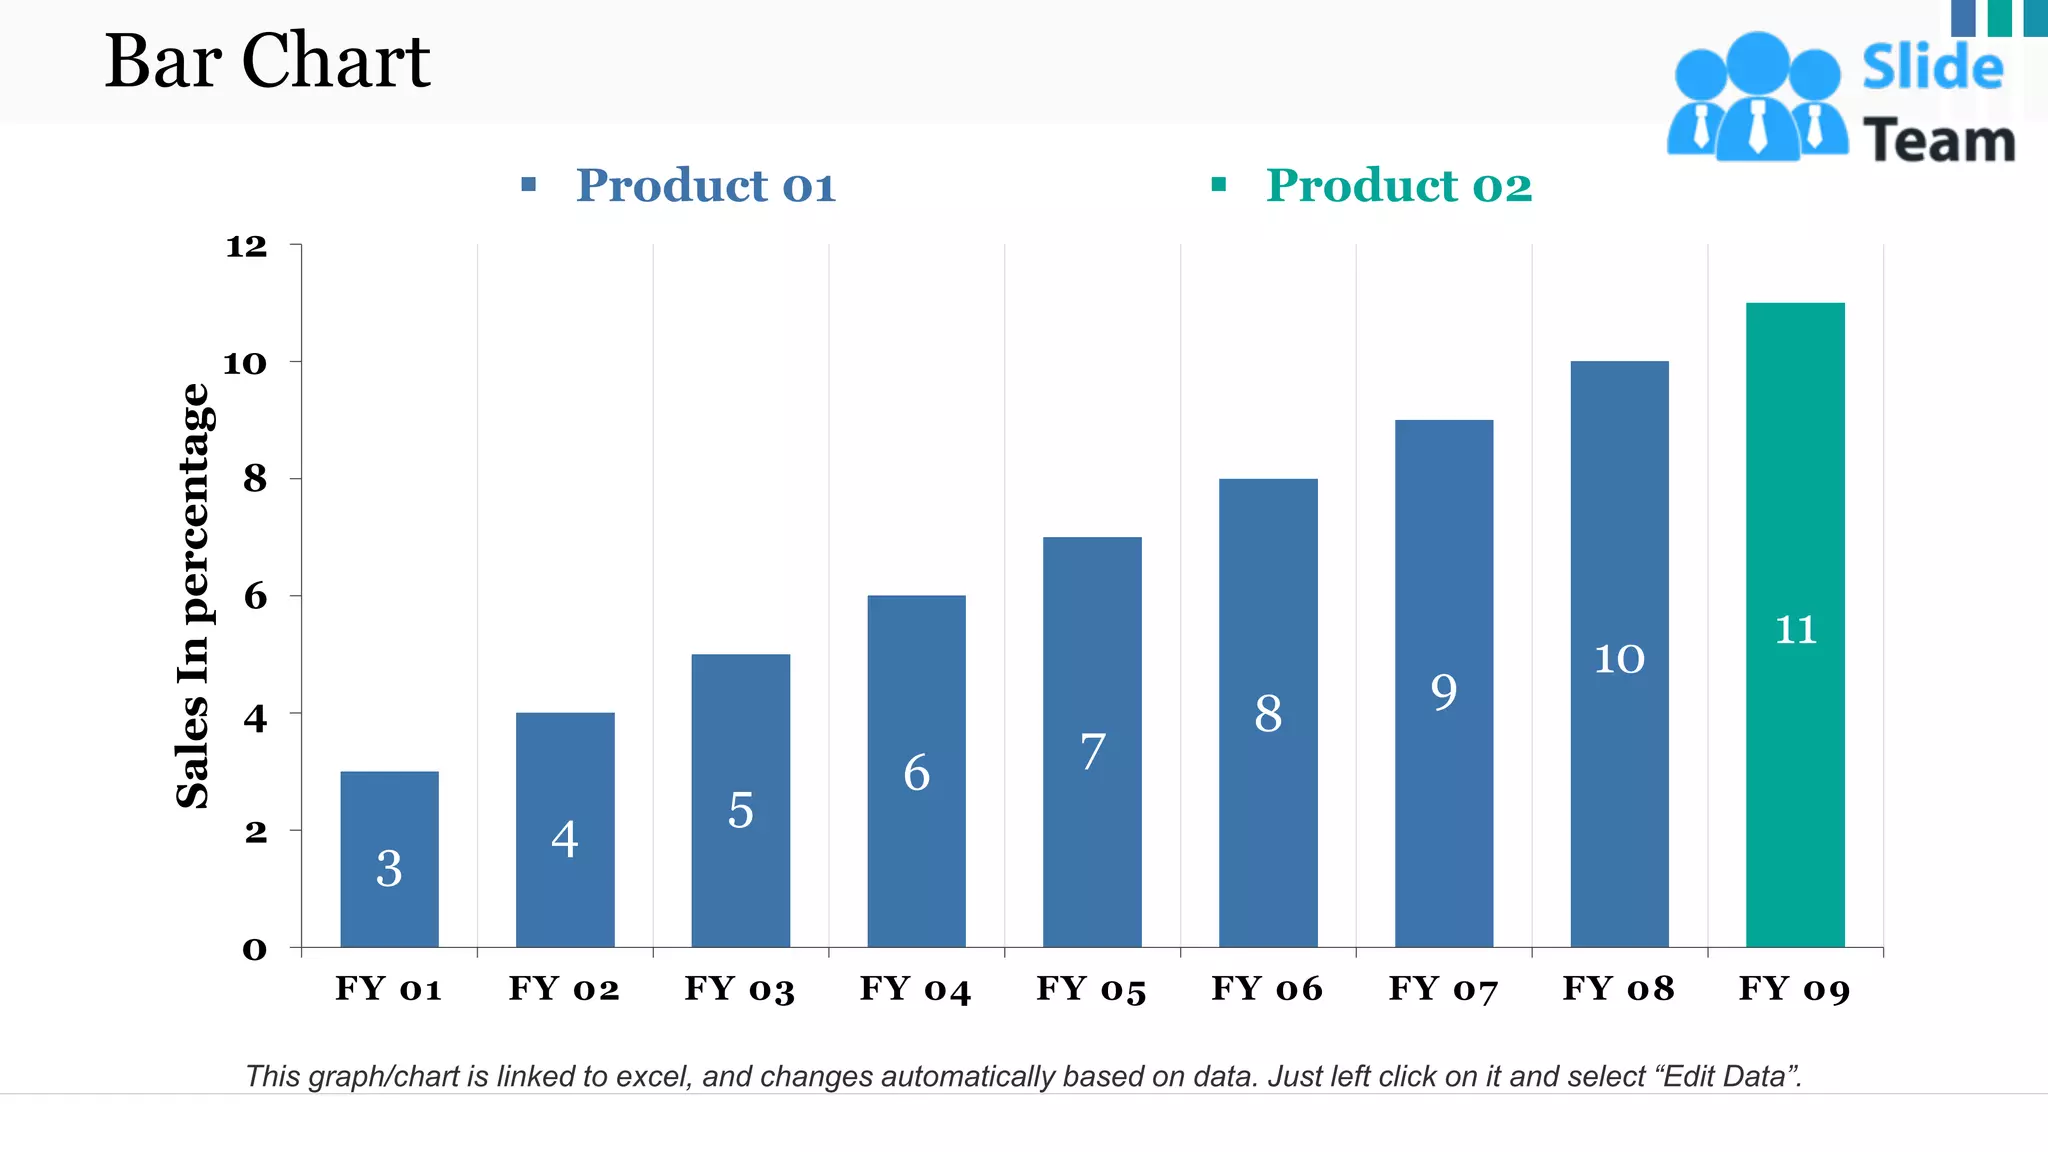
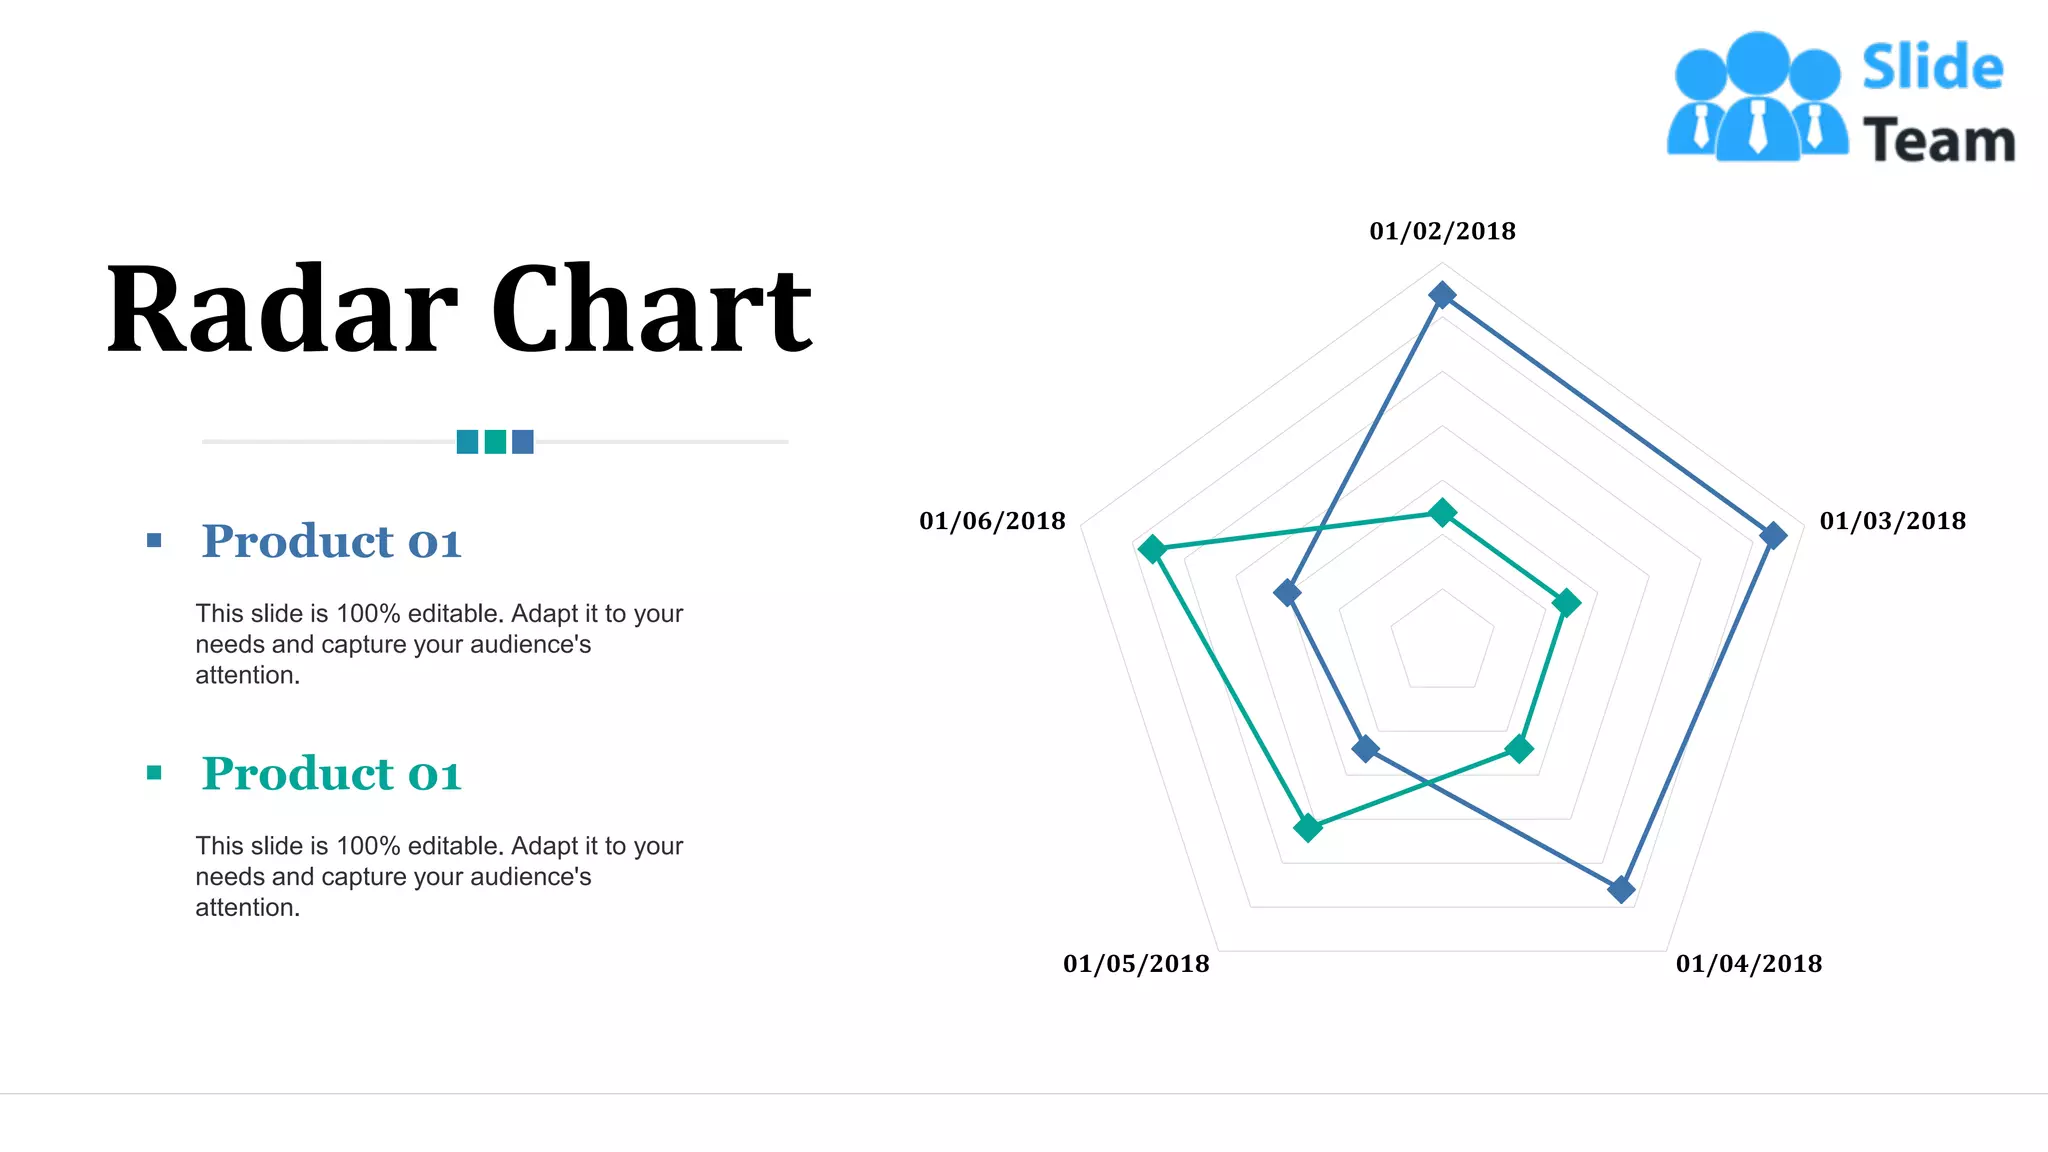


The document provides an overview of risk management, detailing the identification, assessment, and control of both internal and external risks faced by organizations. It categorizes risks into strategic, operational, financial, and hazard types, while also highlighting the importance of determining risk appetite and tolerance levels. Additionally, it outlines the need for a structured risk management plan and includes editable charts and graphs for stakeholder engagement.