Download to read offline
![IJRET: International Journal of Research in Engineering and Technology eISSN: 2319-1163 | pISSN: 2321-7308
__________________________________________________________________________________________
Volume: 02 Issue: 11 | Nov-2013, Available @ http://www.ijret.org 12
PREDICTING CONSTRUCTION PROJECT DURATION WITH SUPPORT
VECTOR MACHINE
Silvana Petruseva1
, Valentina Zileska-Pancovska2
, Vahida Zujo3
1
Asist. Prof., Mathematics Department, Faculty of Civil Engineering, Macedonia, silvana@gf.ukim.edu.mk
2
Full Prof., Department of Management, Faculty of Civil Engineering, Macedonia, valentinazp@gf.ukim.edu.mk
3
Prof., Department of Management, Faculty of Civil Engineering, Boznia and Herzegoovina, vahida.zujo@unmo.ba
Abstract
This paper presents a forecasting model for construction time, using support vector machine (SVM) – recently one of the most
accurate predictive models.
Every construction contract contains project deadline as an essential element of the contract. The practice shows that a considerably
present problem is that of non-compliance of the contracted and real construction time. It's often the case that construction time is
determined arbitrarily. The produced dynamic plans are only of formal character and not a reflection of the real possibilities of the
contractor.
First, a linear regression model has been applied to the data for 75 objects, using Bromilow’s “time cost” model. After that a support
vector machine model to the same data was applied and significant improvement of the accuracy of the prediction was obtained.
Keywords construction time, construction costs, artificial neural network, linear regression, support vector machine
---------------------------------------------------------------------***-------------------------------------------------------------------------
1. INTRODUCTION
Key data on the total of 75 buildings constructed in the
Federation of Bosnia and Herzegovina have been collected
through field studies. Chief engineers of construction
companies have been interviewed on contractual and actually
incurred costs and terms. The collected data contain
information for the contracted and real time of construction,
the contracted and real price of construction and there are also
data for the use of these 75 objects and for the year of
construction .
Australian Bromilow was the first who investigated the
relation between construction price and construction time.
From his research stems the well known “time – cost” model
[3] Afterward the model has been confirmed in many
countries worldwide: UK, China, Malaysia, Croatia etc. [15],
[5],[8],[4].
In Bosnia and Herzegovina similar research was first
conducted in 2008 [38]. The research included seven groups
of objects and “time – cost” model was established for all
seven groups.
This paper will present the research results conducted on 75
structures constructed in the period from 1999 to 2011, in the
field of civil engineering and building construction, as well as
hydro construction
Data were collected for a total of 75 structures built in the
Federation of Bosnia and Herzegovina in the period from 1999
to 2011 using questionnaires and interviews with contractors.
Key data are:
• Object Type;
• Construction Year;
• Contracted And Realized Construction Time;
• Contracted And Realized Construction Price;
• Reasons For Non-Compliance Of Deadline.
From a total of 75 structures, disregard of the contracted
deadline was registered at 55 of them (73%), disregard of the
contracted price was registered at 40 structures (53%), while
simultaneously the contracted deadline and the contracted
price overrun were registered at 36 structures (48%).
Maximum contracted deadline overrun was 100%, and price
68.75% while the average contracted deadline has been
exceeded for 11.55% and 2.77% for the price. Contracted
deadline reduction was registered at 11structures (14.67%),
while simultaneously the contracted deadline and the
contracted price reduction was registered at 2 structures
(2.67%) [39].
Total of five different reasons for non-compliance appear:
• approvals and permits;
• climate;
• incomplete and inaccurate technical documentation;](https://image.slidesharecdn.com/predictingconstructionprojectdurationwithsupport-140807010759-phpapp01/75/Predicting-construction-project-duration-with-support-1-2048.jpg)
![IJRET: International Journal of Research in Engineering and Technology eISSN: 2319-1163 | pISSN: 2321-7308
__________________________________________________________________________________________
Volume: 02 Issue: 11 | Nov-2013, Available @ http://www.ijret.org 13
• material delivery;
• Terms of financing.
This paper presents comparison of two predictive models for
construction time. We shall first present linear regression
model which has been applied to these data for predicting of
the construction time, and after that support vector machine
(SVM) predictive model applied to the same data. Short
overview of linear regression and SVM predictive model will
be presented also.
2. LINEAR REGRESSION PREDICTION MODEL
FOR CONSTRUCTION PROJECT DURATION
Linear regression is an approach to model the relationship
between a scalar dependant variable Y and one or more
explanatory variables denoted x. The case of one explanatory
variable is called simple linear regression. For more than one
explanatory variable, it is called multiple linear regression
[35].
In linear regression data are modeled using linear predictor
functions and unknown model parameters are estimated from
the data.
A linear regression model fits a linear function to a set of data
points. The form of the function is:
nn xxxY ββββ ++++= ......22110
Where Y is the target variable, x1, x2,,… xn, are the predictor
variables, and nβββ ,......, 21 are coefficients that multiply
the predictor variables. 0β is a constant.
Since linear regression is restricted to fitting linear (straight
line/plane) functions to data, it rarely works as well on real-
world data as more general techniques such as neural
networks which can model non-linear functions. However,
linear regression has many practical uses and a number of
strengths. For example, linear regression analysis can be
applied to quantify the strength of the relationship between Y
and the xj, to assess which xj may have no relationship with Y
at all, and to identify which subsets of the xj contain redundant
information about Y, also linear regression models are simple
and require minimum memory to implement, so they work
well on embedded controllers that have limited memory space
[24].
For the prediction of the construction time we shall use
Bromilow’s “time cost“model given in Eq. (1).
B
T K C= ⋅ (1)
Where: T - contracted time; C - contracted price;
K - Model parameter that is a specific way to measure
productivity because it shows the average time needed for the
construction of a monetary value;
B - Model parameters that show time dependence of costs
change.
For the requirements of linear regression model, we shall write
this model in linear form, using logarithmic transformation
[4], as shown in Eq. (2):
lnT = lnK + BlnC
(2)
The linear form of the equation allows usage of the simple
statistical procedure, i.e., a single linear regression. We shall
determine the values of parameters K and B in this model.
For creating the linear regression model for predicting of the
construction time for the 75 objects, DTREG software
package was used [25].
The results of the DTREG analysis of the model are presented
in Table 1 to Table 3 bellow.
Considering Eq. (2), variable ln(real time) is used as target
variable, and ln(real price) as predicted variable.
From the Table 1 we can read the coefficients of the linear
regression model, and they are: B= 0.550208 (which is
multiplied with variable ln(real price), and the constant lnK= -
2.37546 and from here K = e-2. 37546
.
The model will be: T= e-2.37546
C0.550208
Part of the data are used for training of the model (training
data, Table 2), and part of the data are used for validation of
the model (Table 3).
We shall estimate the accuracy of the model from the statistics
of validation data (Table 3):
Most often used estimators of a model are R2
and MAPE. In
statistics, the coefficient of determination denoted R2
indicates
how well data points fit a line or curve; it is a measure of
global fit of the model. In linear regression R2
equals the
square of Pearson correlation coefficient between observed
and modeled (predicted) data values of the dependant variable.
R2
is an element of [0,1] and is often interpreted as the
proportion of the response variation “explained” by the
regressors in the model. So, the value R2
= 0.73341 from our
model may be interpreted: around 73% of the variation in the
response can be explained by the explanatory variables. The
remaining 27% can be attributed to unknown, lurking
variables or inherent variability [36].
MAPE (mean absolute percentage error) is a measure of
accuracy of a method for constructing fitted times series](https://image.slidesharecdn.com/predictingconstructionprojectdurationwithsupport-140807010759-phpapp01/75/Predicting-construction-project-duration-with-support-2-2048.jpg)
![IJRET: International Journal of Research in Engineering and Technology eISSN: 2319-1163 | pISSN: 2321-7308
__________________________________________________________________________________________
Volume: 02 Issue: 11 | Nov-2013, Available @ http://www.ijret.org 14
values in statistics. It usually expresses accuracy as a
percentage [37]. For this model MAPE= 10.355481, which
means that the error of the model is around 10%.
Table – 1: Linear regression model for predicting real time of construction
which depends on real price of construction
============ Summary of Variables ============
Number Variable Class Type Missing rows Categories
------ --------------------------- --------- ----------- ------------ ----------
1 Number of project Unused Continuous 0
2 use of the object Unused Categorical 0
3 year of construction Unused Continuous 0
4 contracted time (days) Unused Continuous 0
5 real time of constr. (days) Unused Continuous 0
6 difference (days) Unused Continuous 0
7 price contracted [KM] Unused Continuous 0
8 real price Unused Continuous 0
9 difference of prices Unused Continuous 0
10 ln(real time) Target Continuous 0
11 ln(real price) Predictor Continuous 0 75
============ Linear Regression Parameters ============
-------------- Computed Coefficient (Beta) Values --------------
Variable Coefficient Std. Error t Prob(t) 95% Confidence Interval
-------------- ------------- ------------ --------- --------- ------------ ------------
ln(real price) 0.550208 0.0509 10.82 < 0.00001 0.4484 0.652
Constant -2.37546 0.6581 -3.61 0.00064 -3.693 -1.058](https://image.slidesharecdn.com/predictingconstructionprojectdurationwithsupport-140807010759-phpapp01/75/Predicting-construction-project-duration-with-support-3-2048.jpg)
![IJRET: International Journal of Research in Engineering and Technology eISSN: 2319-1163 | pISSN: 2321-7308
__________________________________________________________________________________________
Volume: 02 Issue: 11 | Nov-2013, Available @ http://www.ijret.org 15
Table-2: Statistics for training data for the linear regression
model
Table-3: Statistics for validation data used for estimation of
the accuracy of the model
3. PREDICTING WITH SUPPORT VECTOR
MACHINES (SVM) MODEL
3.1. Support Vector Machines
In recent years, machine learning has become a focal point in
artificial intelligence. Support vector machines are a relatively
new, rapidly developing field of research - general formulation
for learning machines. SVMs perform exceptionally well on
pattern classification, function approximation, and regression
problems.
SVM is a class of learning algorithms which has been proved
in recent years to be superior to the conventional Neural
Network method for both classification and regression tasks.
Support vector machine (SVM) has been first introduced by
Vapnik. There are two main categories for support vector
machines: support vector classification (SVC) and support
vector regression (SVR). SVM is a learning system using a
high dimensional feature space. It yields prediction functions
that are expanded on a subset of support vectors. A version of
a SVM for regression has been proposed in 1997 by Vapnik,
Steven Golowich, and Alex Smola [33]. This method is called
support vector regression (SVR).
The SV algorithm is a nonlinear generalization of the
Generalized Portrait algorithm developed in Russia in the
sixties [28], [29]. As such, it is firmly grounded in the
framework of statistical learning theory, or VC theory, which
has been developed over the last three decades by Vapnik and
Chervonenkis [30], Vapnik [31],[32]. In a nutshell, VC theory
characterizes properties of learning machines which enable
them to generalize well to unseen data.
In its present form, the SV machine was largely developed at
AT&T Bell Laboratories by Vapnik and co-workers [2], [11],
[9],[20], [21], [33]. Due to this industrial context, SV research
has up to date had a sound orientation towards real-world
applications.
In regression and time series prediction applications, excellent
performances were obtained [18], [10],[27],[17]. A snapshot
of the state of the art in SV learning was recently taken at the
annual Neural Information Processing Systems conference
[22]. SV learning has now evolved into an active area of
research. Moreover, it is in the process of entering the
standard methods toolbox of machine learning [12],[7], [14].
[23] by Sch¨olkopf and Smola contains a more in-depth
overview of SVM regression.
SVM’s are new training method which is developed in the
frame of structural risk minimization (SRM). SVM belongs to
the group of supervised learning methods. They also belong to
the group of nonparametric models, i.e. models for which
parameters are not defined in advance, but their number
depends on data for training, so that the ability of the model to
interpolate data depends on the complexity of data.
--- Training Data ---
Mean target value for input data = 4.7038902
Mean target value for predicted values = 4.7038902
Variance in input data = 0.8306976
Residual (unexplained) variance after model fit =
0.2753121
Proportion of variance explained by model (R^2) =
0.66858 (66.858%)
Coefficient of variation (CV) = 0.111546
Normalized mean square error (NMSE) = 0.331423
Correlation between actual and predicted = 0.817666
Maximum error = 1.7033044
RMSE (Root Mean Squared Error) = 0.5247019
MSE (Mean Squared Error) = 0.2753121
MAE (Mean Absolute Error) = 0.4108599
MAPE (Mean Absolute Percentage Error) = 9.2084657
Validation Data ---
Mean target value for input data = 4.6575062
Mean target value for predicted values = 4.6797136
Variance in input data = 1.0179999
Residual (unexplained) variance after model fit =
0.2713927
Proportion of variance explained by model (R^2) =
0.73341 (73.341%)
Coefficient of variation (CV) = 0.111852
Normalized mean square error (NMSE) = 0.266594
Correlation between actual and predicted = 0.858757
Maximum error = 0.8396821
RMSE (Root Mean Squared Error) = 0.5209536
MSE (Mean Squared Error) = 0.2713927
MAE (Mean Absolute Error) = 0.462848
MAPE (Mean Absolute Percentage Error) = 10.355481](https://image.slidesharecdn.com/predictingconstructionprojectdurationwithsupport-140807010759-phpapp01/75/Predicting-construction-project-duration-with-support-4-2048.jpg)
![IJRET: International Journal of Research in Engineering and Technology eISSN: 2319-1163 | pISSN: 2321-7308
__________________________________________________________________________________________
Volume: 02 Issue: 11 | Nov-2013, Available @ http://www.ijret.org 16
Figure 1 shows general model of SVM which is identical to
the general model of multilayer preceptron neural network
(MLP NN). The difference is in the way of training.
Connections in the output layer are the weights wi and their
meaning is identical as at NN after the training [16].
For all feed-forward NNs there is an ability of using support
vector learning (SVL) algorithms in the process of learning.
So, while the back-propagation algorithm is for training
multilayer perceptron, SVL algorithm has more generic
nature, and because of that has broad applicability [13]. Data
for training consist of two sets of variables: 1) input
(predictor) variables xi, which are being chosen arbitrary from
the input set X, and 2) response from the system yi (target
variable) which belongs to the output set of data Y. In the
parlance of SVM literature, a predictor variable is called an
attribute, and a transformed attribute that is used to define the
hyperplane is called a feature.
The task of choosing the most suitable representation is known
as feature selection. A set of features that describes one case
(i.e., a row of predictor values) is called a vector.
SVM belongs to kernel methods, i.e. methods with which non-
linear learning problem is transformed in linear using kernel
functions. This is accomplished by mapping of the input space
into output multidimensional space. The solving of the
problem, whether it is a problem of classification or
regression, will be accomplished in the new multidimensio-nal
space.
Figure 2 shows the problem of classification of data which in
input space is nonlinear problem. By mapping in the new
multidimensional space, the ability of linear separation is
given.
An SVM analysis finds the line (or, in general, hyperplane)
that is oriented so that the margin between the support vectors
is maximized. In the figure bellow (Fig.3), the line in the right
panel is superior to the line in the left panel.
If all analyses consisted of two-category target variables with
two predictor variables, and the cluster of points could be
divided by a straight line, solving the problem would be easy.
Unfortunately, this is not generally the case, so SVM must
deal with (a) more than two predictor variables, (b) separating
the points with non-linear curves, (c) handling the cases where
clusters cannot be completely separated, and (d) handling
classifications with more than two categories
Fig-1: General model of SVM (Kecman, 2001)](https://image.slidesharecdn.com/predictingconstructionprojectdurationwithsupport-140807010759-phpapp01/75/Predicting-construction-project-duration-with-support-5-2048.jpg)
![IJRET: International Journal of Research in Engineering and Technology eISSN: 2319-1163 | pISSN: 2321-7308
__________________________________________________________________________________________
Volume: 02 Issue: 11 | Nov-2013, Available @ http://www.ijret.org 17
Fig-2: Mapping in multidimensional space
Fig -3: Margins and support vectors
As we add additional predictor variables (attributes), the data
points can be represented in N-dimensional space, and a (N-1)-
dimensional hyperplane can separate them.
The goal of SVM modeling is to find the optimal hyperplane
that separates clusters of vectors in such a way that cases with
one category of the target variable are on one side of the plane
and cases with the other category are on the other size of the
plane. The vectors near the hyperplane are the support vectors.
The concept of a kernel mapping function is very powerful. It
allows SVM models to perform separations even with very
complex boundaries such as shown on Fig.4 [24] .
Fig – 4: Separation with kernel mapping
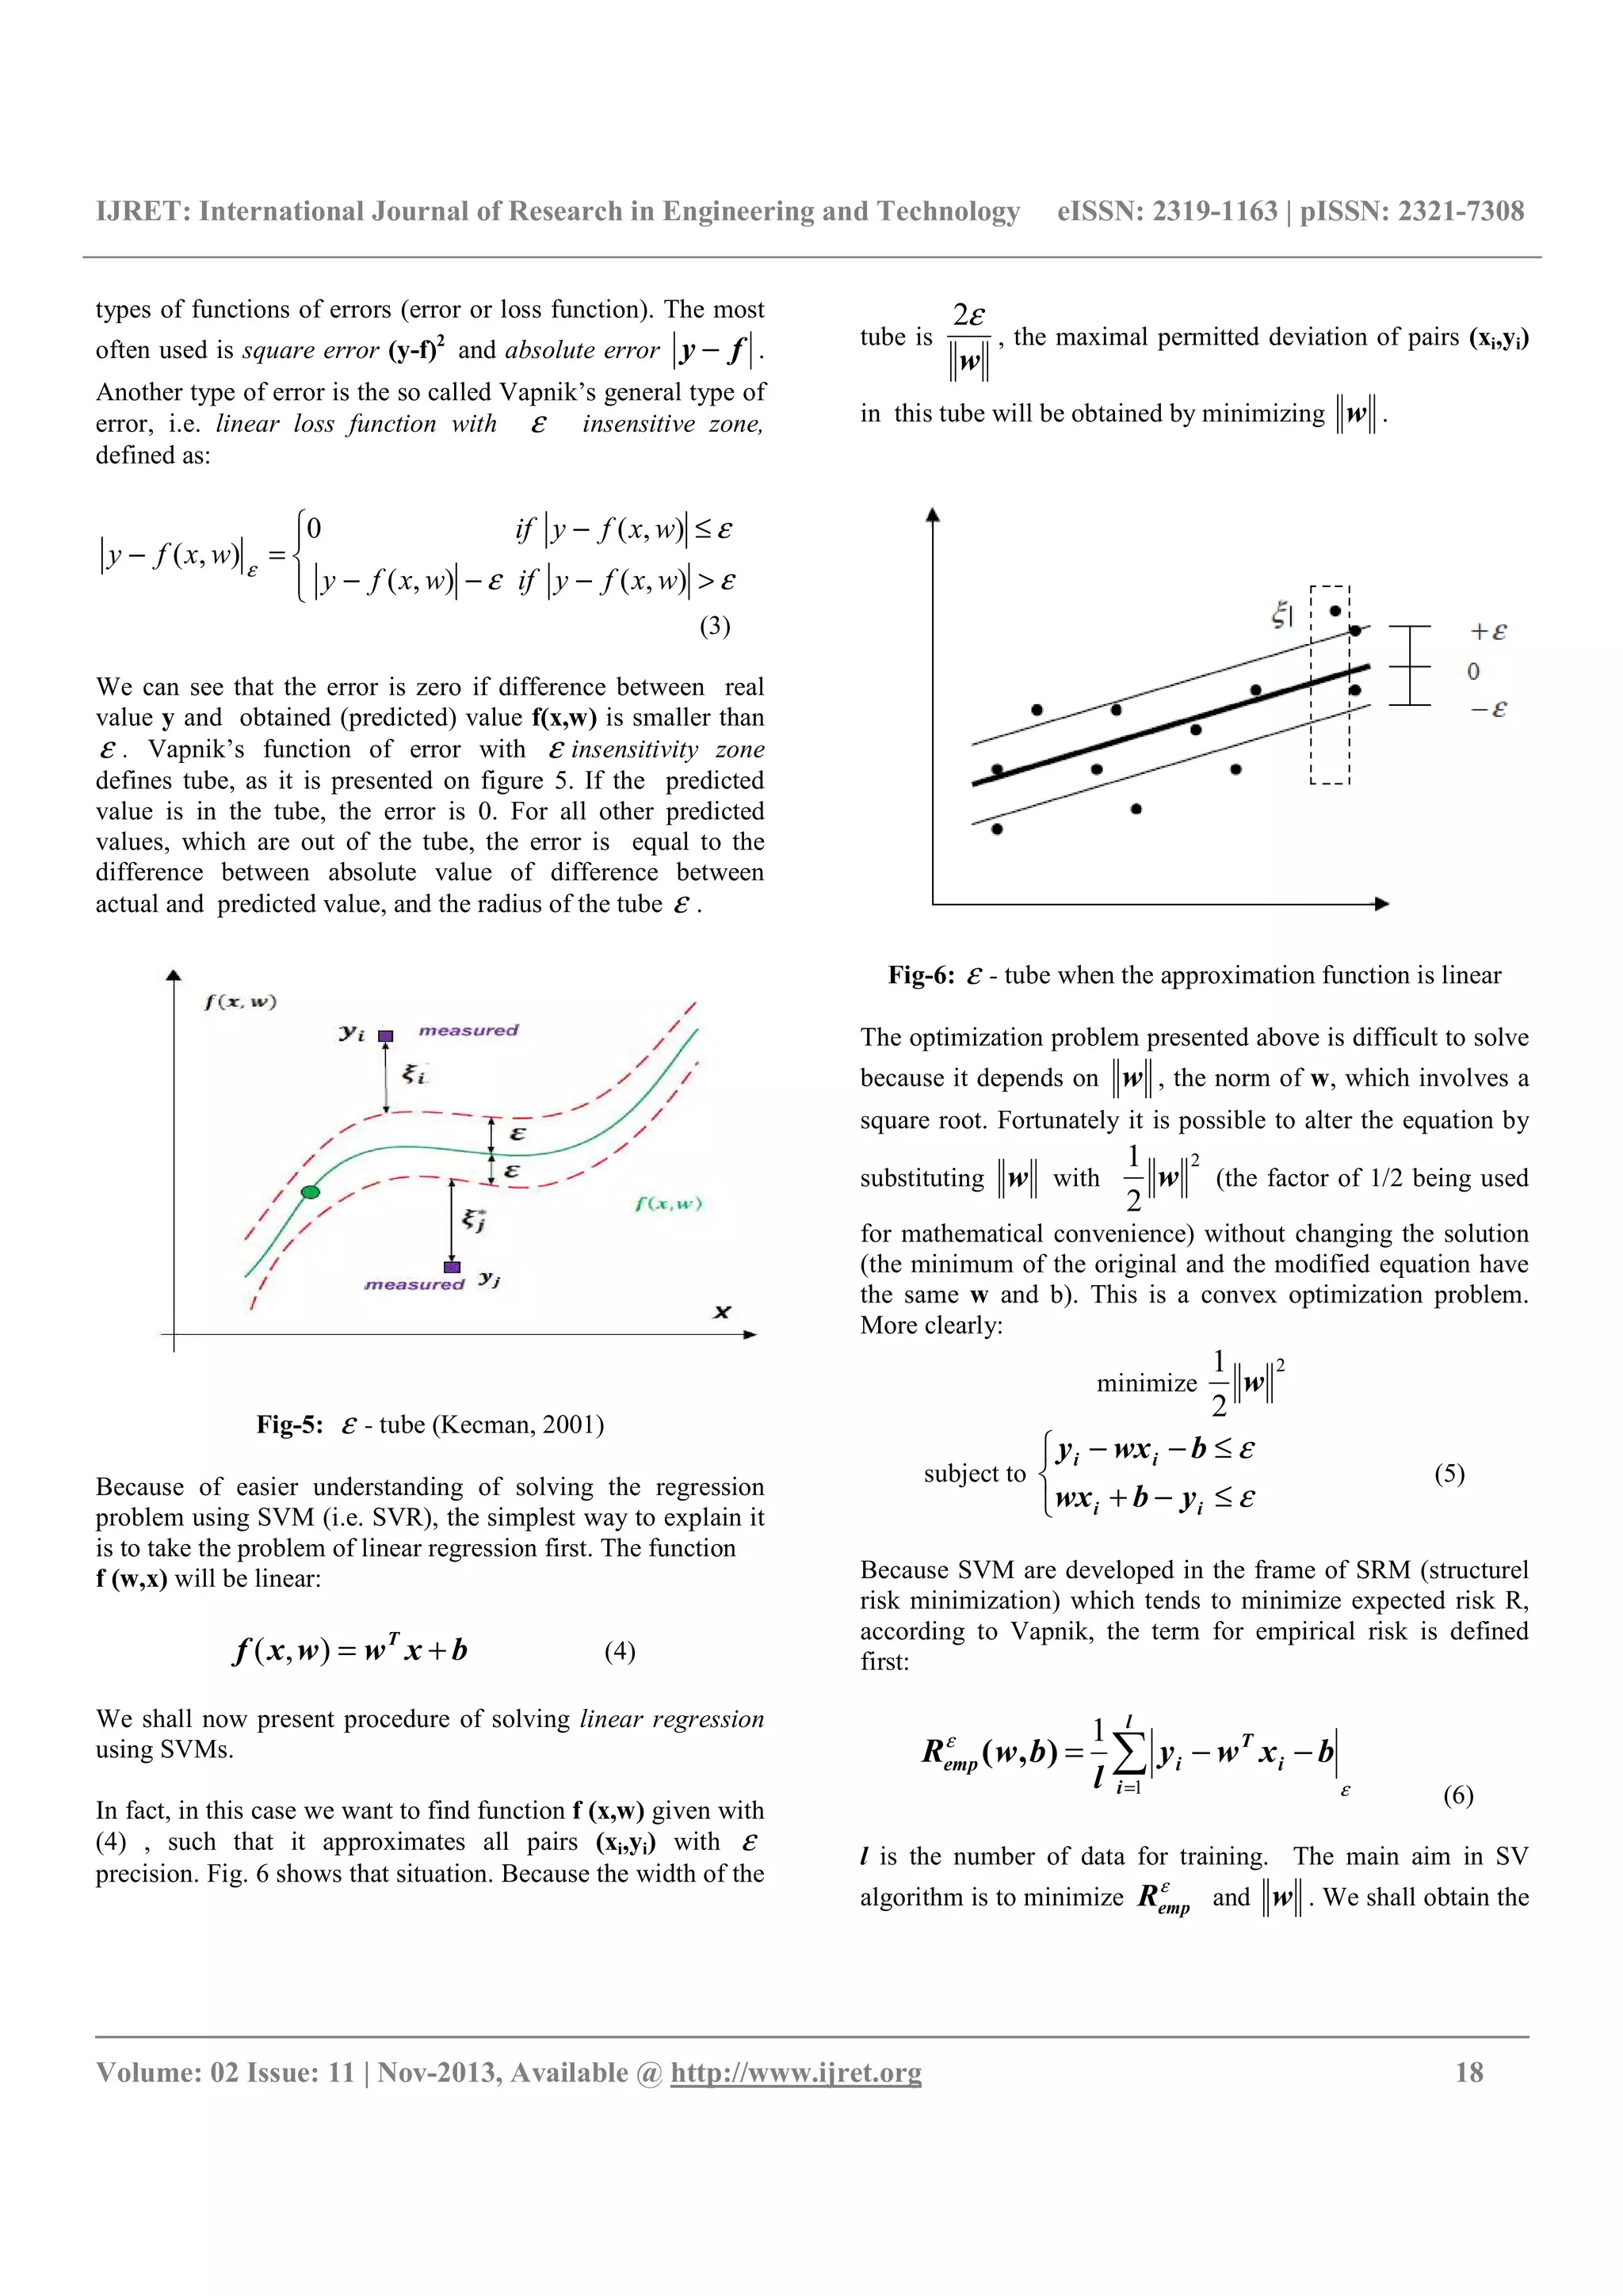
3.2. Regression using SVM
Now we shall define the basic problem of training for
regression problems.
The model of machine learning has l data for training with
which it tries to establish (“learn”) relationship between input
and output, expressed by some function. The set of data for
training D is given by
},....,,),{( lixRRyxD n
ii 21=∈= .
This set consists of the pairs (x1, y1), (x2 , y2),…, (xl, yl),
where inputs x are n – dimensional vectors
n
i Rx ∈ , and the
responses of the model (outputs) Ryi ∈ has continual
values. SVM as approximation function uses some function
f(x,w), where w are the subject of training In ε − SV
regression, the goal is to find a function f that has at most ε
deviation from the actually obtained targets yi for all the
training data and at the same time as flat as possible [19].
This function presents model of non-linear regression, because
the resulting hiperplane is non-linear function over the n-
dimensional x- space.
Estimation of the regression model with SVM is based on
estimation of the error of the approximation. There are several](https://image.slidesharecdn.com/predictingconstructionprojectdurationwithsupport-140807010759-phpapp01/75/Predicting-construction-project-duration-with-support-6-2048.jpg)

With the following constraints:
yi - wT
xi –b lii ,....,1=+≤ ξε
wT
xi +b -yi lii ,....,
*
1=+≤ ξε
lii ,....,10 =≥ξ
lii ,....,
*
10 =≥ξ (10)
This optimization problem can be solved using formulation of
Lagrange [19]:
+= wwbwL T
iiiiii
2
1
),,,,,,,( ***
ββααξξ
−++−−−++ ∑∑∑ ===
][)( *
1
*
1
*
1
ii
T
i
l
i
i
l
i
i
l
i
i bxwyC ξεαξξ
−++−+− ∑=
][ iii
T
l
i
i ybxw ξεα
1
)(
**
1
ii
l
i
ii ξβξβ∑=
+−
(11)
After solving the dual regression problem, the following
parameters which defined optimal regression hyper plane
f(x,w) is obtained: optimal weigh vector 0w :
i
l
i
ii xw )(
*
∑=
−=
1
0 αα
And optimal b0 :
)( 0
1
0
1
wxy
l
b
T
i
l
i
i∑=
−= .
The best regression hyper plane is defined by the term:
z = f(x,w) = w0
T
x + b0.
But, the most of the regression problems does not have linear
nature. Solving the problem with non-linear regression using
SVMs is accomplished by considering the linear regression
hyper plane in the new feature space.
The basic idea of forming SVMs for creating a function of
nonlinear regression is to map the input vectors
n
Rx ∈ from
the input space to vectors z from multi dimensional future
space F (z= Ф(х) ), where Ф is mapping function from
n
R
to
f
R and to solve the linear regression problem in the new
feature space. The function Ф(х) is fixed and given in advance
and is called kernel function. The input, x- space is defined by
the input vectors xi , while the future space F (z space) is
defined by the components of the z vector. Applying the SVM
formulation, this way of mapping allows obtaining linear
regression hyper plain using training algorithm in z- space. It
is expected that using this approach will lead to solving the
problem of quadratic optimization with limitations given by
inequalities in z – space.
Many kernel mapping functions can be used – probably an
infinite number. But a few kernel functions have been found to
work well for a wide variety of applications, for example:
linear function, polynomial function, radial basis function and
sigmoid function. The default and recommended kernel
function is the radial basis function (RBF).
There are few parameters which can be used for training
during the modeling of SVM for solving regression problems.
The most significant are insensitivity zone ε and penalty
parameter C. The both parameters are chosen by the user.
3.3. Predicting Real Time of Construction with SVM
Model
In this paper, for prediction of the real time of construction
time using SVM model is used the software package DTREG](https://image.slidesharecdn.com/predictingconstructionprojectdurationwithsupport-140807010759-phpapp01/75/Predicting-construction-project-duration-with-support-8-2048.jpg)
![IJRET: International Journal of Research in Engineering and Technology eISSN: 2319-1163 | pISSN: 2321-7308
__________________________________________________________________________________________
Volume: 02 Issue: 11 | Nov-2013, Available @ http://www.ijret.org 20
[25]. DTREG offers several types of SVM models, for
classification and for regression tasks.
DTREG provides four kernel functions, linear, polynomial,
radial basis function (RBF) and sigmoid (S-shaped). There is
no way in advance to know which kernel function will be best
for an application, but the RBF function (Ф( xi ,xj) =
= exp ( - gamma*
2
ji x-x ) has been found to do best job
in the majority of cases. RBF is the default and recommended
kernel function. The RBF kernel non-linearly maps samples
into a higher dimensional space, so it can handle nonlinear
relationships between target categories and predictor
attributes; a linear basis function cannot do this. Furthermore,
the linear kernel is a special case of the RBF.
There is a tolerance factor that controls when DTREG stops
the iterative optimization process. The default value usually
works well, but the tolerance can be reduced to generate a
more accurate model or increase the value to reduce the
computation time. This parameter is called the Epsilon value
in some implementations of SVM.
DTREG can generate SVM model giving also a report on the
relative significance of predictor variables.
For validating a SVM model in this paper, DTREG uses V-
fold cross validation method. This means that V SVM models
will be constructed with (V-1)/V proportion of the rows being
used in each model. The remaining rows are then used to
measure the accuracy of the model. The final model is built
using all data rows. This method has the advantage of using all
data rows in the final model, but the validation is performed in
separately constructed models.
The accuracy of an SVM model is largely dependent on the
selection of the model parameters such as C, Gamma, etc.
DTREG provides two methods for finding optimal parameter
values.
When DTREG uses SVM for regression problems, criterion
for minimizing total error is used to find optimal parameters
for determining optimal function value.
The SVM implementation used by DTREG is partially based
on the outstanding LIBSVM project by Chih-Chung Chang
and Chih-Jen Lin [6]. They have made both theoretical and
practical contributions to the development of support vector
machines.
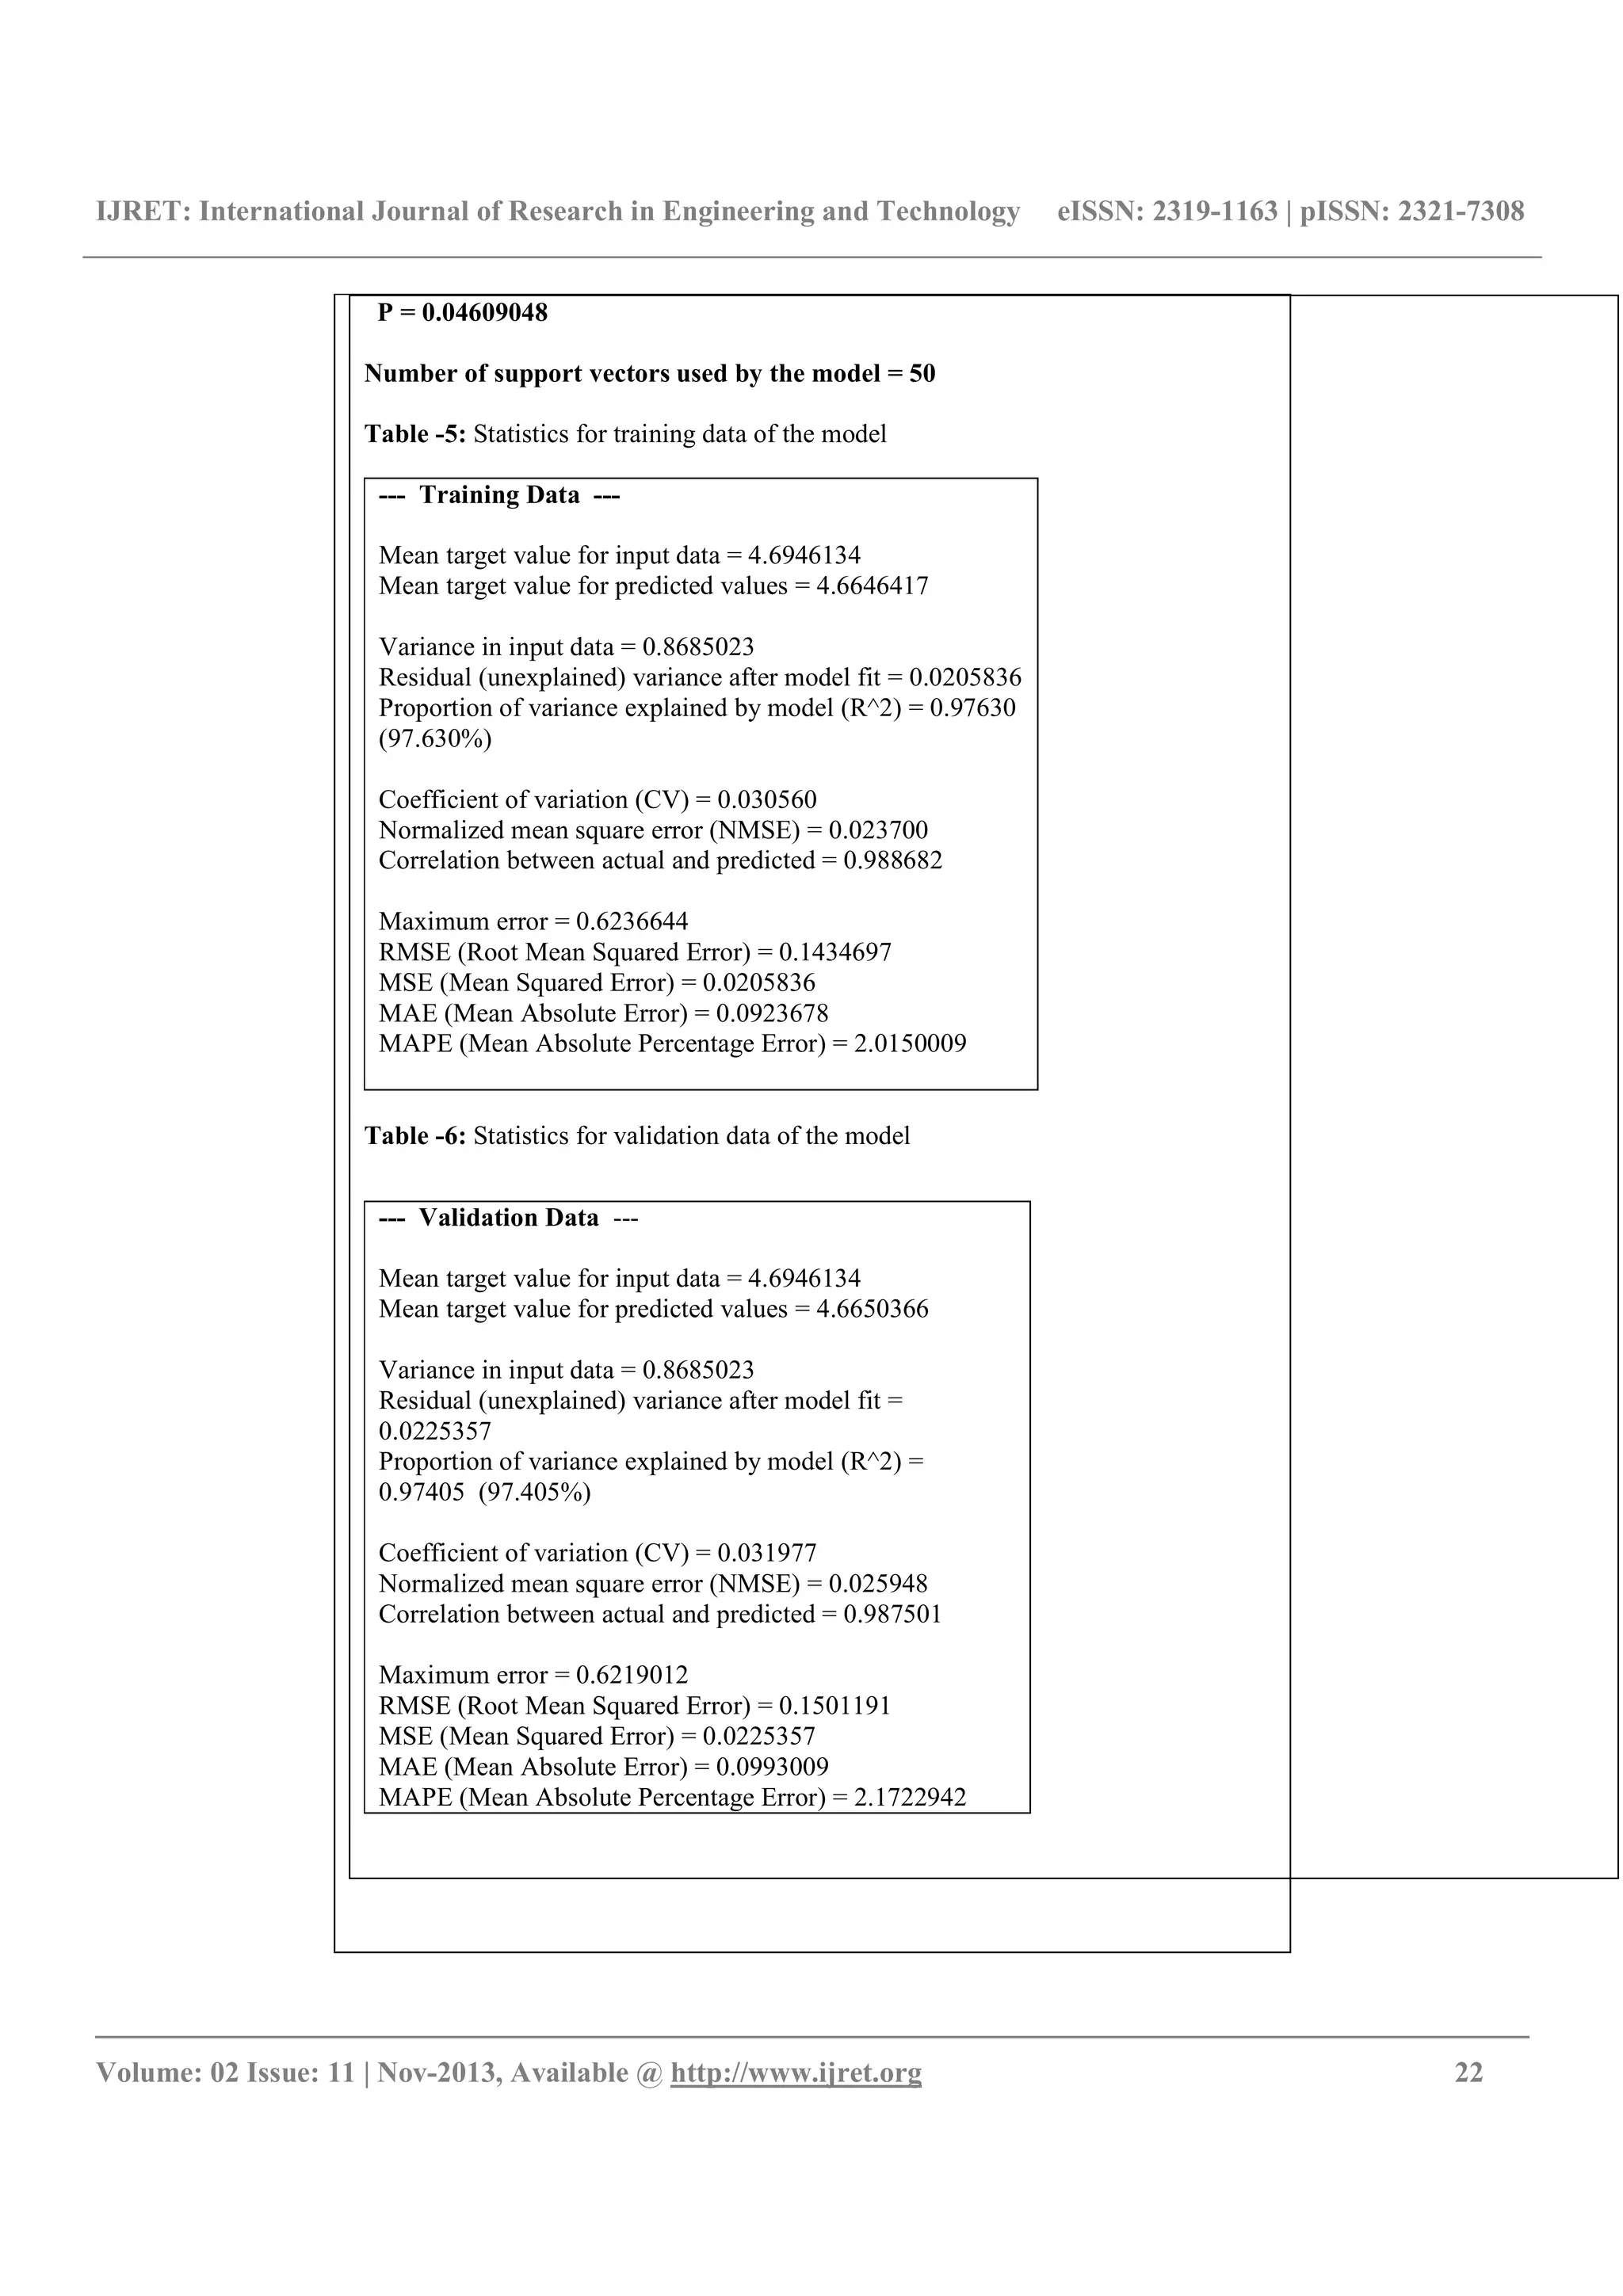
The results of the implementation of SVM model using
package DTREG for predicting the real time of construction
is given bellow on Table 4 to Table 6. For the accuracy of the
model it is very important how we choose the target and
predictor variables. Considering the Eq. (2), for this model, as
target variable is chosen ln(real time) and for predicted
variables are chosen: ln(contracted time), ln(real price) and
ln(contracted price).](https://image.slidesharecdn.com/predictingconstructionprojectdurationwithsupport-140807010759-phpapp01/75/Predicting-construction-project-duration-with-support-9-2048.jpg)
![IJRET: International Journal of Research in Engineering and Technology eISSN: 2319-1163 | pISSN: 2321-7308
__________________________________________________________________________________________
Volume: 02 Issue: 11 | Nov-2013, Available @ http://www.ijret.org 21
Table-4: SVM model for predicting real time of construction
Target variable: ln(treal time)
Number of predictor variables: 3
Type of model: Support Vector Machine (SVM)
Type of SVM model: Epsilon-SVR
SVM kernel function: Radial Basis Function (RBF)
Type of analysis: Regression
Validation method: Cross validation
Number of cross-validation folds: 10
============ Input Data ============
Number of variables (data columns): 13
Data subsetting: Use all data rows
Number of data rows: 75
Total weight for all rows: 75
Rows with missing target or weight values: 0
Rows with missing predictor values: 0
--- Statistics for target variable: ln(treal time) ---
Mean value = 4.6946134
Standard deviation = 0.9319347
Minimum value = 2.7080502
Maximum value = 6.4922398
============ Summary of Variables ============
Number Variable Class Type Missing rows Categories
------ --------------------------- --------- ----------- ------------ ----------
1 Number of project Unused Continuous 0
2 use of the object Unused Categorical 0
3 year of construction Unused Continuous 0
4 contracted time (days) Unused Continuous 0
5 real time of constr. (days) Unused Continuous 0
6 difference (days) Unused Continuous 0
7 price contracted [KM] Unused Continuous 0
8 real price Unused Continuous 0
9 difference of prices Unused Continuous 0
10 ln(treal time) Target Continuous 0
11 ln(real price) Predictor Continuous 0 75
12 ln(contracted time) Predictor Continuous 0 31
13 ln(contracted price) Predictor Continuous 0 75
============ SVM Parameters ============
Type of SVM model: Epsilon-SVR
SVM kernel function: Radial Basis Function (RBF)
SVM grid and pattern searches found optimal values for parameters:
Search criterion: Minimize total error
Number of points evaluated during search = 1100
Minimum error found by search = 0.021429
Parameter values:
Epsilon = 0.001
C = 127825.267
Gamma = 0.00806235](https://image.slidesharecdn.com/predictingconstructionprojectdurationwithsupport-140807010759-phpapp01/75/Predicting-construction-project-duration-with-support-10-2048.jpg)
![IJRET: International Journal of Research in Engineering and Technology eISSN: 2319-1163 | pISSN: 2321-7308
__________________________________________________________________________________________
Volume: 02 Issue: 11 | Nov-2013, Available @ http://www.ijret.org 23
As we can see from the statistic for the validation data which
are used for estimation of the accuracy of the model, R2
=
0.97405 (97.405%), and MAPE = 2.1722942, which is a
significant improvement over the linear model.
CONCLUSIONS
Prediction of construction time using SVM (Support Vector
Machine) model is presented in this paper. The analysis
covered 75 objects structured in the period of 1999 to 2011 in
the federation of Bosnia and Herzegovina. First, conventional
linear regression model has been applied to the data using the
well known “time cost” model, and after that, the predictive
model with SVM was build and applied to the same data. The
results show that the predicting with SVM was significantly
more accurate.
A Support Vector Machine is a relatively new modeling
method that has shown great promise at generating accurate
models for a variety of problems.
The authors hope that the presented model encourages serious
discussions about the topic presented here and that they will
prove as useful for improving planning in the construction
industry in general.
REFERENCES
[1] D. Basak, S. Pal and D. C. Patranabis: Support Vector
Regression, Neural Information Processing, Vol. 11, No.10,
oct. 2007
[2] B. E. Boser, I. M. Guyon, and V. N. Vapnik. A training
algorithm for optimal margin classifiers. In D. Haussler,
editor, Proceedings of the Annual Conference on
Computational Learning Theory, pages 144–152, Pittsburgh,
PA, July 1992. ACM Press.
[3] Bromilow F. J.: Contract time performance expectations
and the reality. Building Forum, 1969, Vol.1(3): pp. 70-80.
[4] Car – Pušić D.. Methodology of anticipating sustainable
construction time,(in croatian) PhD thesis, 2004, Faculty of
Civil Engineering, University of Zagreb.
[5] D.W.M. Chan. and M.M.A. Kumaraswamy.: Study of the
factors affecting construction duration in Hong Kong,
Construction management and economics, 13(4): pp. 319-
333, 1995
[6]Chang, Chih-Chung and Chih-Jen Lin. LIBSVM – A
Library for Support Vector Machines. April, 2005.
http://www.csie.ntu.edu.tw/~cjlin/libsvm/
[7] V. Cherkassky and F. Mulier. Learning from Data. John
Wiley and Sons, New York, 1998.
[8] Choudhry I. and Rajan S.S.. Time – cost relationiship for
residential construction in Texas. College Station, 2003, Texas
A&M University.
[9] C. Cortes and V. Vapnik. Support vector networks.
Machine Learning, 20:273–297, 1995.
[10] H. Drucker, C. J. C. Burges, L. Kaufman, A. Smola, and
V. Vapnik. Support vector regression machines. In M. C.
Mozer, M. I. Jordan, and T. Petsche, editors, Advances in
Neural Information Processing Systems 9, pages 155–161,
Cambridge, MA, 1997. MIT Press.
[11] Guyon, B. Boser, and V. Vapnik. Automatic capacity
tuning of very large VC-dimension classifiers. In S. J. Hanson,
J. D. Cowan, and C. L. Giles, editors, Advances in Neural
Information Processing Systems 5, pages 147–155. Morgan
Kaufmann Publishers, 1993.
[12] S. Haykin. Neural Networks : A Comprehensive
Foundation. Macmillan, New York, 1998. 2nd edition.
[13] S. Haykin,: Neural Networks: A Comprehesive
Foundation, 2nd ed., Pearson Education Inc., Canada, 2005
[ 14] M. A. Hearst, B. Sch¨olkopf, S. Dumais, E. Osuna, and J.
Platt. Trends and controversies—support vector machines.
IEEE Intelligent Systems, 13:18–28, 1998.
[15] Kaka A. and Price A.D.F.: Realitionship between value
and duration of contruction projects, Construction
Management and Economics, 1991, Vol. 9: pp. 383-400.
[16] V. Kecman,, Learning and Soft Computing, Support
Vector Machines, Neural Networks and Fuzzy Logic Models,
Massachusetts Institute of Technology (MIT), USA, 2001
[17] D. Mattera and S. Haykin. Support vector machines for
dynamic reconstruction of a chaotic system. In B. Sch¨olkopf,
C. J. C. Burges, and A. J. Smola, editors, Advances in Kernel
Methods—Support Vector Learning, pages 211–242,
Cambridge, MA, 1999. MIT Press.
[18] K.-R. M¨ uller, A. Smola, G. R¨atsch, B. Sch¨olkopf, J.
Kohlmorgen, and V. Vapnik. Predicting time series with
support vector machines. In W. Gerstner, A. Germond, M.
Hasler, and J.-D. Nicoud, editors, Artificial Neural Net-
works ICANN’97, pages 999–1004, Berlin, 1997. Springer
Lecture Notes in Computer Science, Vol. 1327.
[19] I. Pesko: Model for estimation of costs and time of
construction for urban traffic arteries, PhD Thesis (in
serbian), Novi Sad, 2013
[20] B. Sch¨olkopf, C. Burges, and V. Vapnik. Extracting
support data for a given task. In U. M. Fayyad and R.
Uthurusamy, editors, Proceedings, First International
Conference on Knowledge Discovery & Data Mining, Menlo
Park, 1995. AAAI Press
[21] B. Sch¨olkopf, C. Burges, and V. Vapnik. Incorporating
invariances in support vector learning machines. In C. von der
Malsburg,W. von Seelen, J. C. Vorbr ¨ uggen, and B.
Sendhoff, editors, Artificial Neural Networks ICANN’96,
pages 47–52, Berlin, 1996. Springer Lecture Notes in
Computer Science, Vol. 1112.
[22] B. Sch¨olkopf, C. J. C. Burges, and A. J. Smola, editors.
Advances in Kernel Methods—Support Vector Learning. MIT
Press, Cambridge, MA, 1999a.
[23] B. Sch¨olkopf and A. J. Smola. Learning with Kernels.
MIT Press, 2002.
[24] P. Sherrod: DTREG Predictive Modeling Software -
tutorial, 2013, www.dtreg.com](https://image.slidesharecdn.com/predictingconstructionprojectdurationwithsupport-140807010759-phpapp01/75/Predicting-construction-project-duration-with-support-12-2048.jpg)
![IJRET: International Journal of Research in Engineering and Technology eISSN: 2319-1163 | pISSN: 2321-7308
__________________________________________________________________________________________
Volume: 02 Issue: 11 | Nov-2013, Available @ http://www.ijret.org 24
[25] P. Sherrod: DTREG Predictive Modeling Software, 2013,
www.dtreg.com
[26] A.J. Smola, B. Sch¨olkopf: A tutorial on Support Vector
Regression, sept, 2003
[27] M. Stitson, A. Gammerman, V. Vapnik, V. Vovk, C.
Watkins, and J.Weston. Support vector regression with
ANOVA decomposition kernels. In B. Sch¨olkopf, C. J. C.
Burges, and A. J. Smola, editors, Advances in Kernel
Methods—Support Vector Learning, pages 285–292,
Cambridge, MA, 1999. MIT Press.
[28] V. Vapnik and A. Lerner: Pattern recognition using
generalized portrait method. Automation and Remote Control,
24: 774–780, 1963.
[ 29] V. Vapnik and A. Chervonenkis. A note on one class of
perceptrons. Automation and Remote Control, 25, 1964.
[30] V. Vapnik and A. Chervonenkis. Theory of Pattern
Recognition [in Russian]. Nauka, Moscow, 1974. (German
Translation:W. Wapnik & A. Tscherwonenkis, Theorie der
Zeichenerkennung,Akademie-Verlag, Berlin, 1979).
[31] V. N. Vapnik. Estimation of Dependences Based on
Empirical Data. Springer, Berlin, 1982.
[32] V. Vapnik. The Nature of Statistical Learning Theory.
Springer, New York, 1995.
[33] V. Vapnik, S. Golowich, and A. Smola. Support vector
method for function approximation, regression estimation, and
signal processing. In M. C. Mozer,M. I. Jordan, and T.
Petsche, editors, Advances in Neural Information Processing
Systems 9, pages 281–287, Cambridge, MA, 1997. MIT Press.
[34] www.http://en.wikipedia.org/wiki/Regression_analysis
[35] www.http://en.wikipedia.org/wiki/Linear_regression
[36]www.http://en.wikipedia.org/wiki/Coefficient
_of_determination
[37]www.http://en.wikipedia.org/wiki/Mean_absolute
_percentage_error
[38] V. Zujo: Contribution of Construction Time Planning to
Construction Project Management (in bosnian). PhD thessis,
2008, Faculty of Civil Engineering, University „Džemal
Bijedić“ of Mostar.
[39] V. Zujo, V. Zileska-Pancovska, M.Chechez; Prediction
model for sustainable construction project duration, 15th
International Symposium (of MASE) , Struga, Macedonia, 18-
21 Sept., 2013
BIOGRAPHIES
Silvana Petruseva, Phd (informatics, Msc
(mathematics , application in arti-ficial
intelligence), Bsc ( mathematics-
informatics). Assist. prof. on Faculty of
Civil Engineering (Department of mat-
hematics), at the University “Ss. Cyril and
Methodius“ in Skopje, FYR Mace-donia. Phd thesis was from
the area of artificial intelligence (neural networks, agent
learning), Area of interest and investigation is development
and application of neural networks. She has published in the
country and abroad.
Valentina Zileska-Pancovska, PhD, Msc
and Bsc (in Civil Engineering), Full
professor at the Faculty of Civil
Engineering (department of technology
and management of construction,
currently head of the department), at
University ”Ss. Cyril and Methodius” in
Skopje, FYR of Macedonia. Before becoming an academic,
she worked for a construction company. She has published in
the Macedonia and abroad. Area of research is organization,
technology and menagement in construction, especially
construction project management.
Vahida Zujo, PhD, Msc and Bsc (Civil Engineering),
Professor at the Faculty of Civil Engineering,, currently Vice
rector of the University “Dzemal Bjedic” in Mostar, Bosnia
and Herzegovina. Before becoming an academic, she worked
for a construction company. She has published in the country
and abroad. Area of research is organization, technology and
menagement in construction](https://image.slidesharecdn.com/predictingconstructionprojectdurationwithsupport-140807010759-phpapp01/75/Predicting-construction-project-duration-with-support-13-2048.jpg)

This document presents a comparison of linear regression and support vector machine (SVM) models for predicting construction project duration. A linear regression model was applied to data from 75 construction projects, using the Bromilow time-cost model. This achieved 73% accuracy based on R-squared and 10% error based on MAPE. An SVM model was then applied to the same data, achieving significantly improved prediction accuracy. The document provides background on linear regression, SVM, and the data and variables used to build and evaluate the two models.