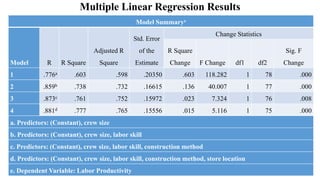
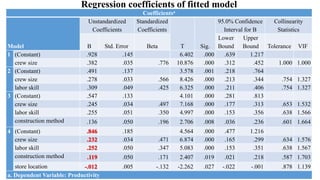
This document presents a study on developing a model for estimating construction labor productivity of public building projects in Bahir Dar City, Ethiopia. It outlines the background, problem statement, objectives, methodology, results and conclusions of the study. The methodology included identifying factors affecting productivity through surveys, analyzing their relationships using regression analysis, and developing a model with the most significant factors as independent variables and labor productivity as the dependent variable. The results showed labor skill, material shortage, labor experience and crew size as the most significant factors. A multiple linear regression model was developed with an R-squared value of 0.777.
![Cont’d
Multivariate regressions are a flexible method of data Analysis to examine the relationship
between dependent variable y and independent variables 𝑥𝑖 [3, 28].
The selected independent variables that affect construction labor productivity of building
construction will be regressed against the labor productivity of the projects.
For this analysis a software applications statistical package for social sciences (SPSS) were
adopted.
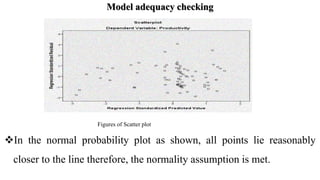
Finally, the developed forecast model will be checked for validation in order to make sure
that models will be accepted and can be used for decision-making.](https://image.slidesharecdn.com/pptfinalfinal-220815072949-10a3c1ac/85/ppt-final-final-pptx-13-320.jpg)