SlideShare a Scribd company logo
1 of 21
2. Relationships
Relationshipshave alreadybeenintroducedabove,
for example the relationshipbetweenx and2x
showninthe picture
The graph showsthe relationshipbetween2x
andx,
where the valuesof 2x
are measuredonthe North-Southaxis
(calledthe ordinate)
and the valuesof x are measuredonthe East-Westaxis
(calledthe abscis).
One typicallyusesthe symbol ‘y’torepresentthe valuesof the function,
inthiscase: y = 2x
and one alsousuallycallsthe ordinate ‘the y-axis’.
Likewise,the abscisismore oftenreferredtoas‘the x-axis’.
The relationshipy=2x
betweenyandx
isa complex relationshipalready.
The picture showsthat itis curved,ratherthan a simple straightline.
Let ustherefore startwiththe more simple straight-line relationships
4.1 Simple linearrelationship
An importantphenomenonforus,humanbeings,isthatof ‘relationship’;
we all understandthe word‘relationship’:
some systematicassociationbetweentwoormore separate entities;
for example the relationshipbetweentwoormore people,
or the relationshipbetweenpopulationdensityandairpollution,
or the relationshipbetweendrivingspeedandgasolineconsumption,etc.
If we understandarelationship,
we can use that knowledge topredictormanage that phenomenon,
e.g.the future incidence orrespiratorydiseasesfromanincrease inurbanization,
the gasoline consumptionof aregionif a maximumspeedisimposed,etc.
The study of relationships,therefore,isanimportantpartof mathematics
for those whoare interestedindoingandapplyingscientificresearch.
Let usfirstexplainthe concept
of a relationshipbetweentwovariables(‘bivariate’).
We use an example frombusinesseconomics,
namelya‘breakevenanalysis’.
Remember:thisis just an example,todemonstrate mathematics in a concrete case;
this is not about the economics!
The goal of a breakevenanalysisistodetermine
the minimumsalesvolumethatacompanyneeds
before itstartsmakinga profit.
Take a companythat makesPanamaHats
(Ecuadorians,Iknow: thisis nota hat fromPanama,
but a ‘sombrerode pajatoquilla’fromyourcountry!).
Let ussay that the companysellsitshatsfor 50$ apiece.
The revenue (‘TR’) of thatcompanythenequalsthe numberof hatsit sells,
representedbythe symbol N,
multipliedbythe price itreceivesforeachhat(50$):
Total Revenue =TR = 50$*N
Thisis a ‘relationship’;we caneasilyrepresentitasinthe graphbelow.
A more general expressionforarelationshipof the kind TR = 50*N is
y = ax
here y standsfor Total Revenue,x fornumberof hats, ‘a’ forthe revenue perhat(50$);
y and x are variables.
Since Total Revenue dependsonthe numberof hatssold,
TR (or, more generallyy) isthe dependentvariable,
and N (ormore generallyx) isthe independentvariable.
a is a ‘parameter’
The parametera is alsocalledthe ‘slope’of the relationship;
it expressesbyhow muchy increasesif x increasesbyone unit
(here,TRincreasesby50$ for each increase of salesbyone hat)
if the price changesto 60$ perhat, then‘a’ isnot 50 anymore,but60.
0
1000
2000
3000
4000
5000
6000
7000
0 25 50 75 100 125 150
TR
N
We can easilycompute the total revenueforagivennumbersof hatssold,
irrespectiveof the price perhat;
we justneedto change 50 into60 (or any othernumber) inthe formula.
Excel is handy forsuch computations,asdemonstrated already in sheet3.
Nowletus lookat the costs of thisfirm.
Its costsare of twokinds:
on the one hand fixedcost(F) foroperatingabusiness,
these costsremainthe same,irrespective of the numberof hatssold,
evenif youdo notsell a single hat
(e.g.the salaryof the manager,the salaryof the salesclerk,the rental of the premises);
on the otherhand variable costsperhat (v)
these are costs fore.g.raw materialsandlaborthat increase withthe numberof hats.
If the numberof hats doubles,the variable costsdouble;
youneeddouble the materialsanddoublethe numberof hoursworked.
Let ussay that the fixedcostof the firmare 1000$ and the cost perhat (‘variable’cost) 30$.
The total cost (‘TC’) forproducingN hats thenis,as showninthe graph
Total Costs= TC = 1000$ + 30$*N
or more generally
Total Costs= F + v*N
or still more generally
z = c + d*x,
where c isthe parameterthat standsfor the fixedcosts,
d isthe parameterthatstandsfor the variable costperunit(perhat),
z is the variable representingthe total costs
and x is the variable representingthe numberof hatssold;
z is the dependentvariable,x isthe independentvariable:
We can nowrepresentbothrelationships,
Total Revenue andTotal Costinone graph,as below:
In thisgraph (called‘break-evenanalysis’),
we see that our hat makerneedstosell acertainnumberof hats
before histotal revenuesare highenoughtocoverhistotal costs,
i.e.before he startsmakinga profit.
That number,N°,of hats (we write N°to designate one specificvalue of N)
where the total revenuesexactlyequalthe total costs
iscalledthe ‘break-evenpoint’.
As we can see inthe graph,
that isthe pointwhere bothlines intersect,the pointwhere
50N = 1000 + 30N
whichcan be rearrangedinto(usingthe rulesof algebramentionedabove)
50N - 30N = (50-30)N = 20N = 1000
fromwhichwe can compute N°= 1000/20 = 50 hats
N° isthe solutiontothe ‘breakevenproblem’.
Withthisexample,we have introducedthe conceptof aline or a ‘linearrelationship’:
boththe relationshipbetweennumberof hatsand total revenue and
that betweennumberof hatsand total costsare linearrelationships.
Both are picturedas straightlines.
We are not aware of it,
but we are usinglinearrelationshipsall the time
to explain orpicture thingstoourselvesorto others.
Like forexample the answertothe question
“Whenwill yoube here”?
“Well,let’ssee,Icome bybicycle;
howfar is itto your place?”
“It isabout 50 kilometers”
“Well,Ican leave at three o’clock,andI ride some 20 kmper hour,
so I shouldarrive around5:30.”
The reasoningor relationshiphere is:
time of arrival = 3 + (1/20)*distance,i.e.3+ (1/20)*50 = 5:30
or if you want,y = 3 +(1/20)x
where yis arrival time,x isthe distance.
That is actuallyalinearrelationship,
if you make a picture of it,it wouldbe a line,
showingtime of arrival ‘infunction’of the distance tobe traveled;
if the distance is80 km, thentime = 3 + (1/20)*80 = 7.
You will thinkthatthisisa stupidlysimpleexample,
but that isexactlythe point:
the mathematicsyoureadbeloware in fact verysimple.
The general expressionforalinearrelationshipis
y = a + bx,
where yis the dependentvariable,x isthe independentvariable or‘running’variable;
and a and b are parameters (tobe givenspecificvalues),
‘a’ iscalledthe ‘intercept’;
that isthe value of ywhenx = 0, as showngraphicallybelow.
‘b’is calledthe slope orinclinationof the line;
it expressesbyhowmuchy increaseswhenx increasesbyone unit.
If,for example,b=0.5,
theny increasesby0.5 each time x increasesbyone unit(showninthe graph).
Dependingonthe value of the parametersaand b,
youget differentrelationshipsbetweenx andy,
but alwayslinearones.
To familiarizeyourself withlinearrelationships,
we showexamplesy= a + bx
for positive (+2),zero(0) ornegative (-3) valuesof the parametera
and forpositive (+4),zeroor negative (-0,5) valuesof the parameterb
a =-3 and b = -0,5
a =-3 and b = 0
a =-3 and b = 4
a =0 and b = -0,5
a=0 and b=0
a=0 and b=4
a=2 and b=-0,5
a=2 and b=0
a=2 and b=4
If y = a + bx,theny dependsonx:
if we knowthe value of the parametersaand b for a specificrelationship,
we can compute exactlythe value of ythat correspondswitheachvalue of x;
likewise,since x canbe expressedas(y-a)/borx = -a/b + y/b,
x can alsobe computedexactlyforanygivenvalue of y.
In the case of a linearrelationshipy= a + bx
x andy are saidto be ‘linearlydependent’:
if you knowthe value of one,youknowthe value of the other.
In a sense,youmightsaythat if youknow one of them(x or y)
the knowledge of the otherissuperfluous;
youcan compute one outof the other.
Linear dependence will be mentionedagain below,
whenwe doresearchwithseveral variables
and itmay be that the informationcontainedinone variable issuperfluous,
because itis‘contained’inone ormore other variables.
For example:
if we thinkthat the incidence of cancerinpeople
isdrivenbytheirextentof smoking
as well asby theirintake of saturatedfats,
but people whosmoke alsotendtoeata lotof saturatedfats,
it will be difficulttofindouthowmuchof the incidence of cancer
isdue to smokingandhow muchto unhealthyeating
Smokingandunhealthyeatingthentendtogo‘handinhand’,
tendto be linearlyrelatedto each other.
It thenbecomesdifficulttoseparate outthe effectoncancer
of smokingonthe one handand unhealthyeatingonthe other.
But that isfor laterdiscussion…
Now,back to linearrelationships.
As we all know,if youtake a page of paperand plottwo pointsonit,
youcan drawexactlyone,andonlyone,straightline throughthese twopoints.
Anytwo points(x,y) suffice todefine aline orlinearrelationship.
If we knowthata line runsthroughthe points(x = 2, y = 0) and (x =5, y = 6),
since the line (the linearrelationship) isof the general formy= a +bx,
thenthe followingmusthold
0 = a + 2b (y = 0 whenx = 2)
6 = a + 5b (y = 6 whenx = 5)
Subtractingthe firstfromthe secondrelationship,
we obtain 6-0 = a-a + 5b-2b
or 6 = 3b, and hence b= 2
substitutingb= 2 in the firstexpression,(0= a + 2b)
we findthat 0 = a +2*2 and hence a = -4.
The expressionof the relationshipy= a +bx through(x = 2, y = 0) and(x =5, y = 6)
therefore isy= -4 +2x
We can verifythat(x = 2, y = 0) and(x =5, y = 6) meet the condition:
indeed: 0 = a + 2b or 0 = -4 + 2*2 (forthe point2,0)
and 6 = a + 5b or 6 = -4 + 5*2 (forthe point5,6)
Once you knowthe parametersaand b for a relationshipof the formy= a + bx,
youcan use itto compute any value of ywithinthe original range of valuesof x,
i.e.between2and 5, for example x =3; that iscalled‘interpolation’;
e.g. if x = 3, theny = -4 +2*3 = 2
You can alsouse it to compute a value of y
for a value of x outside of itsoriginal interval,
i.e.outside the range from2 to 5,
e.g.if x = 1000, theny = -4 +2*1000 or 1996.
The latteris called ‘extrapolation’.
Wheninterpolating,youare ‘inknownterritory’;
whenextrapolating,youare ‘innewterritory’.
Scientistswilloftendevelopamodel basedonobservationsof pastconditions
(i.e.interpolation)
and use that model topredictwhatwill happenundernew conditions
(i.e.extrapolation)
If two linesy= a+bx and z = c+dx intersect
(i.e.yand z have the same value),
like thatwasthe case above inthe break-evenanalysis
withthe Total Revenuesline andthe Total Costs,
that will,bydefinition,be foraspecificvalue of x,call itx°,such that y = z,
i.e. a+bx°= c+dx°
or, usingthe rulesof algebrabx° - dx°= c – a or (b-d)x°=(c-a)
and hence x°= (c-a)/(b-d)
For example,inthe examplewithhats,where y=50x and z = 1000 + 30x
i.e.witha = 0, b = 50, c = 1000 and d = 30
that iswhenx°= 1000/(50 – 30) = 50 hats, as alreadyshownabove.
The expressionx°=(c-a)/(b-d) illustratesthe usesandadvantagesof mathematics:
it isa general solutiontoaproblem(‘where dotwolinesintersect?’),
whichcan thenbe tailoredtoany specificsituation
(‘whendothe Total Revenuesof ahat manufacturerequal the Total Costs?)
i.e.,to specificvaluesof the parametersa,b,c, d;
thisavoidshavingtocompute a specificsolution
everytime youhave a problemof the same structure
but withdifferentparameters
(e.g.the intersectionof twolines)
If the price perhat dropsto 40*, forexample,
the break-evenvolume becomes1000/(40-30) = 100.
If a =10, b = 100, c = 2000 and d = 20,
thenx° can be computedwiththe same rule as (c-a)/(b-d) =(2000-10)/(100-20)
x° = (c-a)/(b-d),again,isa rule to remember.
You do not have to prove it again, the proof has beengiven;
you can now use it for any problemwhere two linearrelationshipsintersect.
As we sawin the graph above,the relationships
TR = 50*N andTC = 1000 + 30*N
are lines,orlinearrelationships.
Thismeansthat if we sell one more hat,
the total revenue increasesbyafixed50$
(irrespective of whetherwe alreadysell few ormanyhats),
or if we manufacture one more hat, the costsincrease by30$
(again,irrespective of howmanyhatswe are alreadymanufacturingatthatpoint).
These relationshipscanbe visualizedonasheetof paper,
i.e.ona flatmap,a plane,
withan axisforTR or TC (the up-downaxis,orNorth-Southaxis,usuallyidentifiedasy)
and an axisforN (the left-to-rightaxis,orEast-Westaxis,usuallyidentifiedasx).
Each pointof that plane hasa coordinate forN and forTR (orTC)
or, more generally,forx andfory.
A line,then,isthe collectionof points(x,y) inamapor plane
that satisfythe conditiony= a + bx for some specificvaluesof aand b.
For example,the line TC= 1000 +30N
isthe collectionof pointswithcoordinates(N,TC)
such that TC = 1000 + 30N
Evidently,1030 liesonthat line (itisthe value of TC forN =1)
and so does1300 (the value of TC for n = 10);
but the point(N,TC) = (10, 2000) obviouslydoesnotlie onthe line.
Similarly,the line y= 2 + 3x
isthe collectionof all points(x°,y°) inthe plane withaxesx andy
whichmeetthe requirementthat
y° = 2 + 3x°
The point(2,8) issuch a point,since 8 = 2+3*2; so isthe point(5,17);
and so are also the points(0,2) and (-1,-1);
on the otherhand,the point(3, 5) doesnot lie onthisline,
since itis nottrue that 5 = 2 + 3*3.
Thisis illustratedgraphicallybelow.
Why didwe needtomentionthis?
Below,we will see thatinreality,
the observations(points) thatwe canmake of a relationship
do notalwayslie neatlyona straightline, butalmost.
We will thensee howwe cannevertheless‘guess’
whatthe linearrelationshipisbelow
inthe sectiononestimatingthe parametersof alinearrelationship.
4.2 Multivariate linearrelationships.
In our example,total revenue dependsonlyon the numberof hatssold;
the relationshipisbetweentwovariables,TRandN (ory and x);
it isbivariate.
Linearrelationshipscaninvolvemore thantwophenomenaorvariables.
Let usillustrate thatbyexpandingthe Panamahatexample.
If the firmalsomakesties,andsellsthemat20$ apiece,
thenitstotal revenue dependsnotonlyonthe numberof hats sold(N),
but alsoon the numbertiessold(T):
Total Revenue = 50*N + 20*T
or in general terms:
y = a + bx + cz
(withparametersa,b andc; inthe example a= 0, b = 50 and c = 20).
If we wantto representthisgraphically,
we are not lookingatlinesona map(i.e.ina flat‘plane’) anymore,
but ratherat a plane ina space withaxesTR, N andT;
(we are ‘movingup’one dimensioninourreasoning:
the unidimensional lineof the previousexample
nowbecomesa two-dimensionalplane
and the 2-dimensional planeinwhichwe drew te line
nowbecomesa 3-dimensional space,i.e.‘space’aswe are usedtothinkof it,
witha right-left,front-backandup-downdimensionoraxis).
Each pointof that plane meetsthe conditionthatTR = 50*N + 20*T.
That plane goesthroughthe origin
(TR = 0 whenN = 0 and T = 0; i.e. throughthe point0,0, 0),
thisexpressesthatthe revenuesare zero
whenthe firmdoesnotsell anyhat or tie.
The plane slopesupwardswithN andwithT,
more steeply(50per unit) withN thanwithT (30 per unit).
The relationshipbetweenTotal revenue y),hatssold(x) andtiessold(z)
isillustratedin the picture below(agraphical model…).
While TR = 50$*N or y = a + bx isa bivariate linearrelationship,
TR + 50*N + 20*T or y = a + bx + cz is a multivariate linearrelationship
(inthiscase it is trivariate,betweenthree variables:y,x andz).
Such a trivariate relationshipsmaybe useful todescribe,andbuild,
a slopingflatsurface,e.g.inarchitecture orindesign.
But it isalsouseful torepresentormodel phenomena
where one dependentvariable iscaused
by more than one independentvariable,
such as whenthe revenuesof afirmdependonN and T,
or whenthe incidence of cancerdepends
on the extentof smokingandonthe intake of saturatedfats.
If the firmalsosells Sshirts,at 80$ per shirt,
thenthe linearrelationshipwouldbecomeTR= 50N + 20T + 80S,
and so on…
A final note on linearrelationships:lineartransformation.
To illustrate whatwe meanbya lineartransformation,
letus returnto the example of measuringtemperature.
Temperature remainsthe same,
irrespectiveof whetherwe measure itin°Cor in °F.
It musttherefore be possible to‘translate’or‘transform’ °Cinto°Fand vice versa.
Since we knowthat waterfreezesat32°F, or at 0°C
and since a 1° difference in°Fisa 5/9° difference in°C,
the transformationisgivenby°C= (°F-32)*(5/9)
0
1
2
3
4
5
6
7
8910
0
100
200
300
400
500
600
700
0 1 2 3 4 5 6 7 8 9 10
Z
Y
X
or °C = – 32*(5/9) + (5/9)*°F, thisisa linearrelationshipof the form°C= a * b*°F
for example,65°Fcorrespondsto(65-32)*(5/9) °C = 18,33°C
Usingthe rulesof algebra,we can alsosay that
°C*(9/5) = °F – 32, or °F = 32 + °C*(9/5),
againa linearrelationship,of the form°F= c + d*°C
Anotherexampleof alineartransformationisgiven
by the operationof standardizingameasurement
The standardizedvalue zof a measurementx isobtainedas
z = (x-m)/s
with‘m’the meanor average of the measurementsand‘s’theirstandarddeviation.
Usingthe rulesof algebra,thiscan be writtenasz = -(m/s) +x/s
if we substitute the symbol ‘a’for–(m/s) and‘b’for (1/s)
thenwe can write z = a + bx,a relationshipwithlinearform.
4.3 Estimating the parametersof a linearrelationship
Typically,inscientificresearch,we donotknow exactlythe formor model
takenon bya specificphenomenon,e.g.the relationshipbetweentwovariables,
such as the incidence of lungcancerandair pollution;
we may assume thatit islinear,e.g.of the formy = a + bx,
but we usuallydonotknowthe value of the parametersa and b.
We mayhave to guessthe value of these parametersourselves,
or try to infertheirvalue fromthe pasthistoryof the phenomenon.
To use a simple andfamiliarexample,
letus reverttothe hat manufacturer.
Whenthe managerof the hat companysays
that hisTotal Revenue is50$*N.
that may actuallyonlybe hisassumptionorguess.
Is thisreallytrue?Dothe salesfiguresconfirmthis?
Sometimes,hatsmaybe soldata lowerprice,
e.g.whenthe customerbuysmore thanone,
or sometimesrichcustomersmaybe chargeda higherprice…
Then,whatreallyisthe relationshipbetweenrevenue andnumberof hats?
Can we inferthe parameterof the relationshipTR= a*N
frompast observationsonnumberof hatsandrevenues?
Andwhat isthe relationshipbetweenTotal Costsandnumberof hats;
isit really1000$ + 30$*N as the managersays?
Can we inferthe parametersof the cost functionTC= F + v*N
frominspectingpastresultsof hatmanufacturers,
fromthe numberof hatsproducedlastyear andtotal costsin that year?
Assume thatthe Hat makers’associationprovidesuswiththe Total Costs
and the numberof manufacturedhatsfor13 firms,asin the table below.
Firm HATS(N) Total Costs(TC)
1 1100 45200
2 400 15400
3 980 29800
4 1100 44300
5 600 18040
6 1200 55000
7 1050 40300
8 500 16500
9 400 13500
10 1250 42900
11 800 31250
12 900 29800
13 300 15060
If we make a graph,as below,thenwe see thatthe observations,the data
do notall lie neatly onone straightline TC=c + dN;
it isnot the case thatTC isexactlyequal to1000 + 30*N for each firm.
Thenwhat isthe (linear) relationshipbetweentotal costandnumberof hats
TC = c + d*N
whichbestreflectsthe reality(the data)?;
whatis the ‘best’ line TC = c + d*N.
That is to say:what isthe bestvalue forthe parameters,c°and d°,
so that the relationshipTC = c° + d°*N closelyapproximatesthe observationsinthe graph?
If I knewthese ‘best’valuesof ‘c’and‘d’(call these c° andd°),
thenfor Firm1, the relationshipwouldpredictTotal Costsof c° + d°*1100;
since the real costs forthat firmare 45200;
the difference betweenrealityandthe predictionis(45200- c° – d°*1100);
for Firm2 the difference wouldbe (15400 -c° - d°*400), etc.
We lookforvaluesforc° and d° that make these differencessmall.
But we do notknowc° and d°;
the bestwe can dois estimate themonthe basisof the available data.
To find,or ‘estimate’c°andd°,we apply
the ‘leastsum of squared differences’or‘leastsquares’principle
that wasintroducedabove:
lookforthe value of ‘c’and ‘d’ whichmake the sumof the 13 squareddifferences
(45200- c – d*1100)² + (15400 -c - d*400)² + … + (15600 – c – d*300)²
as small as possible.
For these valuesof ‘c’and‘d’ the resulting‘fitted’orpredictedTotal Costs
will lie ‘asclose aspossible’tothe real Total Cost figures;
the squareddifference betweenrealityandthe predictionwill thenbe the smallest
Since there are 13 squareddifferences (oneforeachmonth),
we sum them,addthemup andlook(we ask the computerto lookforthis…)
for the value of ‘c’ and‘d’ that make that ‘sumof squares’minimal.
That is an operationeasilyperformedinExcel;
e.g.by the functionLINESTinExcel underFormulas>more functions>statistics>linest
or evenas a facilityofferedtogetherwiththe scatterplotof the data..
The estimatedrelationshipy= a + bx,inthiscase TC = c + d*N
isseento be
y = 2634 + 31,45*N
It iscalledthe ‘simple linearregressionofy on x’,
here itis the regressionof TCon N.
We say‘linear’because the relationshipisof the form‘y = a + bx’
and we say ‘simple’because thisinvolvesonlytwovariables,Xandy.
Simple linearregressionsare usedveryofteninempirical researchtomodel
relationshipsbetweenone dependentvariable (y) andone independentvariable (x)
and where there isnoreasonto thinkthatthe relationshipisnotlinear(seebelow).
If y is assumedtodependonmore than one variable,forexample
y = a + bx + cz
thenthe bestfittinglinearrelationshipwill be a‘multiple linearregression’.

More Related Content

What's hot

1.2 the graphs of quadratic equations
1.2 the graphs of quadratic equations1.2 the graphs of quadratic equations
1.2 the graphs of quadratic equationsmath123c
 
C2 differentiation jan 22
C2 differentiation jan 22C2 differentiation jan 22
C2 differentiation jan 22Mohammed Ahmed
 
1 2 2nd-degree equation and word problems-x
1 2 2nd-degree equation and word problems-x1 2 2nd-degree equation and word problems-x
1 2 2nd-degree equation and word problems-xmath123b
 
Pair of linear equation in two variable
Pair of linear equation in two variable Pair of linear equation in two variable
Pair of linear equation in two variable Vineet Mathur
 
46polynomial expressions
46polynomial expressions46polynomial expressions
46polynomial expressionsalg1testreview
 
5 2 solving 2nd degree equations
5 2 solving 2nd degree equations5 2 solving 2nd degree equations
5 2 solving 2nd degree equationsmath123b
 
2 2linear equations i
2 2linear equations i2 2linear equations i
2 2linear equations imath123a
 
Linear equations in two variables
Linear equations in two variablesLinear equations in two variables
Linear equations in two variablesjulienorman80065
 
3 2 linear equations and lines
3 2 linear equations and lines3 2 linear equations and lines
3 2 linear equations and linesmath123a
 
1 4 cancellation
1 4 cancellation1 4 cancellation
1 4 cancellationmath123b
 
PPTs FOR LINEAR EQUATIONS IN TWO VARIABLES BY RAMBABU SIRIPURAPU
PPTs FOR LINEAR EQUATIONS IN TWO VARIABLES BY RAMBABU SIRIPURAPUPPTs FOR LINEAR EQUATIONS IN TWO VARIABLES BY RAMBABU SIRIPURAPU
PPTs FOR LINEAR EQUATIONS IN TWO VARIABLES BY RAMBABU SIRIPURAPURAMBABU SIRIPURAPU
 
5 2factoring trinomial i
5 2factoring trinomial i5 2factoring trinomial i
5 2factoring trinomial imath123a
 
class-X Maths Book | Chapter-2 | Slides By MANAV |
class-X Maths Book | Chapter-2 | Slides By MANAV |class-X Maths Book | Chapter-2 | Slides By MANAV |
class-X Maths Book | Chapter-2 | Slides By MANAV |Slides With MANAV
 
2 4linear word problems
2 4linear word problems2 4linear word problems
2 4linear word problemsmath123a
 
ISI MSQE Entrance Question Paper (2011)
ISI MSQE Entrance Question Paper (2011)ISI MSQE Entrance Question Paper (2011)
ISI MSQE Entrance Question Paper (2011)CrackDSE
 

What's hot (20)

1.2 the graphs of quadratic equations
1.2 the graphs of quadratic equations1.2 the graphs of quadratic equations
1.2 the graphs of quadratic equations
 
C2 differentiation jan 22
C2 differentiation jan 22C2 differentiation jan 22
C2 differentiation jan 22
 
1 2 2nd-degree equation and word problems-x
1 2 2nd-degree equation and word problems-x1 2 2nd-degree equation and word problems-x
1 2 2nd-degree equation and word problems-x
 
Pair of linear equation in two variable
Pair of linear equation in two variable Pair of linear equation in two variable
Pair of linear equation in two variable
 
46polynomial expressions
46polynomial expressions46polynomial expressions
46polynomial expressions
 
Pertemuan 2
Pertemuan 2Pertemuan 2
Pertemuan 2
 
5 2 solving 2nd degree equations
5 2 solving 2nd degree equations5 2 solving 2nd degree equations
5 2 solving 2nd degree equations
 
2 2linear equations i
2 2linear equations i2 2linear equations i
2 2linear equations i
 
42 linear equations
42 linear equations42 linear equations
42 linear equations
 
Linear equations in two variables
Linear equations in two variablesLinear equations in two variables
Linear equations in two variables
 
Stochastic Processes Homework Help
Stochastic Processes Homework Help Stochastic Processes Homework Help
Stochastic Processes Homework Help
 
3 2 linear equations and lines
3 2 linear equations and lines3 2 linear equations and lines
3 2 linear equations and lines
 
1 4 cancellation
1 4 cancellation1 4 cancellation
1 4 cancellation
 
PPTs FOR LINEAR EQUATIONS IN TWO VARIABLES BY RAMBABU SIRIPURAPU
PPTs FOR LINEAR EQUATIONS IN TWO VARIABLES BY RAMBABU SIRIPURAPUPPTs FOR LINEAR EQUATIONS IN TWO VARIABLES BY RAMBABU SIRIPURAPU
PPTs FOR LINEAR EQUATIONS IN TWO VARIABLES BY RAMBABU SIRIPURAPU
 
1543 integration in mathematics b
1543 integration in mathematics b1543 integration in mathematics b
1543 integration in mathematics b
 
Elimination
EliminationElimination
Elimination
 
5 2factoring trinomial i
5 2factoring trinomial i5 2factoring trinomial i
5 2factoring trinomial i
 
class-X Maths Book | Chapter-2 | Slides By MANAV |
class-X Maths Book | Chapter-2 | Slides By MANAV |class-X Maths Book | Chapter-2 | Slides By MANAV |
class-X Maths Book | Chapter-2 | Slides By MANAV |
 
2 4linear word problems
2 4linear word problems2 4linear word problems
2 4linear word problems
 
ISI MSQE Entrance Question Paper (2011)
ISI MSQE Entrance Question Paper (2011)ISI MSQE Entrance Question Paper (2011)
ISI MSQE Entrance Question Paper (2011)
 

Similar to Pragmathematics 2014 lecture 3 (2)

Corr-and-Regress (1).ppt
Corr-and-Regress (1).pptCorr-and-Regress (1).ppt
Corr-and-Regress (1).pptMuhammadAftab89
 
Cr-and-Regress.ppt
Cr-and-Regress.pptCr-and-Regress.ppt
Cr-and-Regress.pptRidaIrfan10
 
Corr-and-Regress.ppt
Corr-and-Regress.pptCorr-and-Regress.ppt
Corr-and-Regress.pptkrunal soni
 
Corr-and-Regress.ppt
Corr-and-Regress.pptCorr-and-Regress.ppt
Corr-and-Regress.pptMoinPasha12
 
Correlation & Regression for Statistics Social Science
Correlation & Regression for Statistics Social ScienceCorrelation & Regression for Statistics Social Science
Correlation & Regression for Statistics Social Sciencessuser71ac73
 
Relations among variables
Relations among variablesRelations among variables
Relations among variablesJulio Huato
 
College Algebra 2.1
College Algebra 2.1College Algebra 2.1
College Algebra 2.1Jeneva Clark
 
Class 10 Maths Ch Polynomial PPT
Class 10 Maths Ch Polynomial PPTClass 10 Maths Ch Polynomial PPT
Class 10 Maths Ch Polynomial PPTSanjayraj Balasara
 
Lecture 1.5 graphs of quadratic equations
Lecture 1.5 graphs of quadratic equationsLecture 1.5 graphs of quadratic equations
Lecture 1.5 graphs of quadratic equationsnarayana dash
 
5 absolute value inequalities
5 absolute value inequalities5 absolute value inequalities
5 absolute value inequalitiesTzenma
 
DerivativesXP.ppt
DerivativesXP.pptDerivativesXP.ppt
DerivativesXP.pptSnehSinha6
 

Similar to Pragmathematics 2014 lecture 3 (2) (20)

Corr-and-Regress (1).ppt
Corr-and-Regress (1).pptCorr-and-Regress (1).ppt
Corr-and-Regress (1).ppt
 
Corr-and-Regress.ppt
Corr-and-Regress.pptCorr-and-Regress.ppt
Corr-and-Regress.ppt
 
Cr-and-Regress.ppt
Cr-and-Regress.pptCr-and-Regress.ppt
Cr-and-Regress.ppt
 
Corr-and-Regress.ppt
Corr-and-Regress.pptCorr-and-Regress.ppt
Corr-and-Regress.ppt
 
Corr-and-Regress.ppt
Corr-and-Regress.pptCorr-and-Regress.ppt
Corr-and-Regress.ppt
 
Corr-and-Regress.ppt
Corr-and-Regress.pptCorr-and-Regress.ppt
Corr-and-Regress.ppt
 
Correlation & Regression for Statistics Social Science
Correlation & Regression for Statistics Social ScienceCorrelation & Regression for Statistics Social Science
Correlation & Regression for Statistics Social Science
 
Corr And Regress
Corr And RegressCorr And Regress
Corr And Regress
 
Relations among variables
Relations among variablesRelations among variables
Relations among variables
 
Straight lines
Straight linesStraight lines
Straight lines
 
College Algebra 2.1
College Algebra 2.1College Algebra 2.1
College Algebra 2.1
 
Powerpoint2.reg
Powerpoint2.regPowerpoint2.reg
Powerpoint2.reg
 
Class 10 Maths Ch Polynomial PPT
Class 10 Maths Ch Polynomial PPTClass 10 Maths Ch Polynomial PPT
Class 10 Maths Ch Polynomial PPT
 
Pragmathematics 2014 lecture 4 (2)
Pragmathematics 2014 lecture 4 (2)Pragmathematics 2014 lecture 4 (2)
Pragmathematics 2014 lecture 4 (2)
 
Lecture 1.5 graphs of quadratic equations
Lecture 1.5 graphs of quadratic equationsLecture 1.5 graphs of quadratic equations
Lecture 1.5 graphs of quadratic equations
 
1525 equations of lines in space
1525 equations of lines in space1525 equations of lines in space
1525 equations of lines in space
 
5 absolute value inequalities
5 absolute value inequalities5 absolute value inequalities
5 absolute value inequalities
 
Regression Analysis.pdf
Regression Analysis.pdfRegression Analysis.pdf
Regression Analysis.pdf
 
Calculus Homework Help
Calculus Homework HelpCalculus Homework Help
Calculus Homework Help
 
DerivativesXP.ppt
DerivativesXP.pptDerivativesXP.ppt
DerivativesXP.ppt
 

More from Universidad de Cuenca

Diapositivas GESTOR DE BASE DE DATOS UC::BD
Diapositivas GESTOR DE BASE DE DATOS UC::BDDiapositivas GESTOR DE BASE DE DATOS UC::BD
Diapositivas GESTOR DE BASE DE DATOS UC::BDUniversidad de Cuenca
 
Documentacion del Proyecto "Sistema de Monitoreo del Transito Vehicular en ev...
Documentacion del Proyecto "Sistema de Monitoreo del Transito Vehicular en ev...Documentacion del Proyecto "Sistema de Monitoreo del Transito Vehicular en ev...
Documentacion del Proyecto "Sistema de Monitoreo del Transito Vehicular en ev...Universidad de Cuenca
 
Colecciones Parametrizadas, Mapas, Diccionarios
Colecciones Parametrizadas, Mapas, DiccionariosColecciones Parametrizadas, Mapas, Diccionarios
Colecciones Parametrizadas, Mapas, DiccionariosUniversidad de Cuenca
 
Colecciones Parametrizadas, Mapas, Diccionarios
Colecciones Parametrizadas, Mapas, DiccionariosColecciones Parametrizadas, Mapas, Diccionarios
Colecciones Parametrizadas, Mapas, DiccionariosUniversidad de Cuenca
 

More from Universidad de Cuenca (17)

Web educativa
Web educativaWeb educativa
Web educativa
 
Practica 1 Electrizacion
Practica 1 Electrizacion Practica 1 Electrizacion
Practica 1 Electrizacion
 
PIM DM
PIM DMPIM DM
PIM DM
 
Diapositivas GESTOR DE BASE DE DATOS UC::BD
Diapositivas GESTOR DE BASE DE DATOS UC::BDDiapositivas GESTOR DE BASE DE DATOS UC::BD
Diapositivas GESTOR DE BASE DE DATOS UC::BD
 
Gestor de Base de Datos UC::BD
Gestor de Base de Datos UC::BDGestor de Base de Datos UC::BD
Gestor de Base de Datos UC::BD
 
Encriptacion HMAC
Encriptacion HMAC Encriptacion HMAC
Encriptacion HMAC
 
Algoritmos de Ordenamiento externo
Algoritmos de Ordenamiento externoAlgoritmos de Ordenamiento externo
Algoritmos de Ordenamiento externo
 
Algoritmos de Ordenamiento Externo.
Algoritmos de Ordenamiento Externo.Algoritmos de Ordenamiento Externo.
Algoritmos de Ordenamiento Externo.
 
Documentacion del Proyecto "Sistema de Monitoreo del Transito Vehicular en ev...
Documentacion del Proyecto "Sistema de Monitoreo del Transito Vehicular en ev...Documentacion del Proyecto "Sistema de Monitoreo del Transito Vehicular en ev...
Documentacion del Proyecto "Sistema de Monitoreo del Transito Vehicular en ev...
 
Documentacion del Proyecto "Sistema de Monitoreo del Transito Vehicular en ev...
Documentacion del Proyecto "Sistema de Monitoreo del Transito Vehicular en ev...Documentacion del Proyecto "Sistema de Monitoreo del Transito Vehicular en ev...
Documentacion del Proyecto "Sistema de Monitoreo del Transito Vehicular en ev...
 
Colecciones Parametrizadas, Mapas, Diccionarios
Colecciones Parametrizadas, Mapas, DiccionariosColecciones Parametrizadas, Mapas, Diccionarios
Colecciones Parametrizadas, Mapas, Diccionarios
 
Colecciones Parametrizadas, Mapas, Diccionarios
Colecciones Parametrizadas, Mapas, DiccionariosColecciones Parametrizadas, Mapas, Diccionarios
Colecciones Parametrizadas, Mapas, Diccionarios
 
Presentacion Resumen TETRAD V
Presentacion Resumen TETRAD VPresentacion Resumen TETRAD V
Presentacion Resumen TETRAD V
 
Presentacion Resumen TETRAD V
Presentacion Resumen TETRAD VPresentacion Resumen TETRAD V
Presentacion Resumen TETRAD V
 
Analisis Proyecto TETRAD V
 Analisis Proyecto TETRAD V Analisis Proyecto TETRAD V
Analisis Proyecto TETRAD V
 
Analisis Proyecto TETRAD V
 Analisis Proyecto TETRAD V Analisis Proyecto TETRAD V
Analisis Proyecto TETRAD V
 
Pragmatehmatics bank-of-descriptors
Pragmatehmatics bank-of-descriptorsPragmatehmatics bank-of-descriptors
Pragmatehmatics bank-of-descriptors
 

Recently uploaded

SOCIAL AND HISTORICAL CONTEXT - LFTVD.pptx
SOCIAL AND HISTORICAL CONTEXT - LFTVD.pptxSOCIAL AND HISTORICAL CONTEXT - LFTVD.pptx
SOCIAL AND HISTORICAL CONTEXT - LFTVD.pptxiammrhaywood
 
A Critique of the Proposed National Education Policy Reform
A Critique of the Proposed National Education Policy ReformA Critique of the Proposed National Education Policy Reform
A Critique of the Proposed National Education Policy ReformChameera Dedduwage
 
ECONOMIC CONTEXT - LONG FORM TV DRAMA - PPT
ECONOMIC CONTEXT - LONG FORM TV DRAMA - PPTECONOMIC CONTEXT - LONG FORM TV DRAMA - PPT
ECONOMIC CONTEXT - LONG FORM TV DRAMA - PPTiammrhaywood
 
Presiding Officer Training module 2024 lok sabha elections
Presiding Officer Training module 2024 lok sabha electionsPresiding Officer Training module 2024 lok sabha elections
Presiding Officer Training module 2024 lok sabha electionsanshu789521
 
The Most Excellent Way | 1 Corinthians 13
The Most Excellent Way | 1 Corinthians 13The Most Excellent Way | 1 Corinthians 13
The Most Excellent Way | 1 Corinthians 13Steve Thomason
 
KSHARA STURA .pptx---KSHARA KARMA THERAPY (CAUSTIC THERAPY)————IMP.OF KSHARA ...
KSHARA STURA .pptx---KSHARA KARMA THERAPY (CAUSTIC THERAPY)————IMP.OF KSHARA ...KSHARA STURA .pptx---KSHARA KARMA THERAPY (CAUSTIC THERAPY)————IMP.OF KSHARA ...
KSHARA STURA .pptx---KSHARA KARMA THERAPY (CAUSTIC THERAPY)————IMP.OF KSHARA ...M56BOOKSTORE PRODUCT/SERVICE
 
Contemporary philippine arts from the regions_PPT_Module_12 [Autosaved] (1).pptx
Contemporary philippine arts from the regions_PPT_Module_12 [Autosaved] (1).pptxContemporary philippine arts from the regions_PPT_Module_12 [Autosaved] (1).pptx
Contemporary philippine arts from the regions_PPT_Module_12 [Autosaved] (1).pptxRoyAbrique
 
Mastering the Unannounced Regulatory Inspection
Mastering the Unannounced Regulatory InspectionMastering the Unannounced Regulatory Inspection
Mastering the Unannounced Regulatory InspectionSafetyChain Software
 
call girls in Kamla Market (DELHI) 🔝 >༒9953330565🔝 genuine Escort Service 🔝✔️✔️
call girls in Kamla Market (DELHI) 🔝 >༒9953330565🔝 genuine Escort Service 🔝✔️✔️call girls in Kamla Market (DELHI) 🔝 >༒9953330565🔝 genuine Escort Service 🔝✔️✔️
call girls in Kamla Market (DELHI) 🔝 >༒9953330565🔝 genuine Escort Service 🔝✔️✔️9953056974 Low Rate Call Girls In Saket, Delhi NCR
 
18-04-UA_REPORT_MEDIALITERAСY_INDEX-DM_23-1-final-eng.pdf
18-04-UA_REPORT_MEDIALITERAСY_INDEX-DM_23-1-final-eng.pdf18-04-UA_REPORT_MEDIALITERAСY_INDEX-DM_23-1-final-eng.pdf
18-04-UA_REPORT_MEDIALITERAСY_INDEX-DM_23-1-final-eng.pdfssuser54595a
 
Paris 2024 Olympic Geographies - an activity
Paris 2024 Olympic Geographies - an activityParis 2024 Olympic Geographies - an activity
Paris 2024 Olympic Geographies - an activityGeoBlogs
 
MENTAL STATUS EXAMINATION format.docx
MENTAL     STATUS EXAMINATION format.docxMENTAL     STATUS EXAMINATION format.docx
MENTAL STATUS EXAMINATION format.docxPoojaSen20
 
CARE OF CHILD IN INCUBATOR..........pptx
CARE OF CHILD IN INCUBATOR..........pptxCARE OF CHILD IN INCUBATOR..........pptx
CARE OF CHILD IN INCUBATOR..........pptxGaneshChakor2
 
Presentation by Andreas Schleicher Tackling the School Absenteeism Crisis 30 ...
Presentation by Andreas Schleicher Tackling the School Absenteeism Crisis 30 ...Presentation by Andreas Schleicher Tackling the School Absenteeism Crisis 30 ...
Presentation by Andreas Schleicher Tackling the School Absenteeism Crisis 30 ...EduSkills OECD
 
Introduction to AI in Higher Education_draft.pptx
Introduction to AI in Higher Education_draft.pptxIntroduction to AI in Higher Education_draft.pptx
Introduction to AI in Higher Education_draft.pptxpboyjonauth
 
Accessible design: Minimum effort, maximum impact
Accessible design: Minimum effort, maximum impactAccessible design: Minimum effort, maximum impact
Accessible design: Minimum effort, maximum impactdawncurless
 
Alper Gobel In Media Res Media Component
Alper Gobel In Media Res Media ComponentAlper Gobel In Media Res Media Component
Alper Gobel In Media Res Media ComponentInMediaRes1
 
“Oh GOSH! Reflecting on Hackteria's Collaborative Practices in a Global Do-It...
“Oh GOSH! Reflecting on Hackteria's Collaborative Practices in a Global Do-It...“Oh GOSH! Reflecting on Hackteria's Collaborative Practices in a Global Do-It...
“Oh GOSH! Reflecting on Hackteria's Collaborative Practices in a Global Do-It...Marc Dusseiller Dusjagr
 
Class 11 Legal Studies Ch-1 Concept of State .pdf
Class 11 Legal Studies Ch-1 Concept of State .pdfClass 11 Legal Studies Ch-1 Concept of State .pdf
Class 11 Legal Studies Ch-1 Concept of State .pdfakmcokerachita
 

Recently uploaded (20)

SOCIAL AND HISTORICAL CONTEXT - LFTVD.pptx
SOCIAL AND HISTORICAL CONTEXT - LFTVD.pptxSOCIAL AND HISTORICAL CONTEXT - LFTVD.pptx
SOCIAL AND HISTORICAL CONTEXT - LFTVD.pptx
 
A Critique of the Proposed National Education Policy Reform
A Critique of the Proposed National Education Policy ReformA Critique of the Proposed National Education Policy Reform
A Critique of the Proposed National Education Policy Reform
 
ECONOMIC CONTEXT - LONG FORM TV DRAMA - PPT
ECONOMIC CONTEXT - LONG FORM TV DRAMA - PPTECONOMIC CONTEXT - LONG FORM TV DRAMA - PPT
ECONOMIC CONTEXT - LONG FORM TV DRAMA - PPT
 
Presiding Officer Training module 2024 lok sabha elections
Presiding Officer Training module 2024 lok sabha electionsPresiding Officer Training module 2024 lok sabha elections
Presiding Officer Training module 2024 lok sabha elections
 
The Most Excellent Way | 1 Corinthians 13
The Most Excellent Way | 1 Corinthians 13The Most Excellent Way | 1 Corinthians 13
The Most Excellent Way | 1 Corinthians 13
 
KSHARA STURA .pptx---KSHARA KARMA THERAPY (CAUSTIC THERAPY)————IMP.OF KSHARA ...
KSHARA STURA .pptx---KSHARA KARMA THERAPY (CAUSTIC THERAPY)————IMP.OF KSHARA ...KSHARA STURA .pptx---KSHARA KARMA THERAPY (CAUSTIC THERAPY)————IMP.OF KSHARA ...
KSHARA STURA .pptx---KSHARA KARMA THERAPY (CAUSTIC THERAPY)————IMP.OF KSHARA ...
 
Contemporary philippine arts from the regions_PPT_Module_12 [Autosaved] (1).pptx
Contemporary philippine arts from the regions_PPT_Module_12 [Autosaved] (1).pptxContemporary philippine arts from the regions_PPT_Module_12 [Autosaved] (1).pptx
Contemporary philippine arts from the regions_PPT_Module_12 [Autosaved] (1).pptx
 
Mastering the Unannounced Regulatory Inspection
Mastering the Unannounced Regulatory InspectionMastering the Unannounced Regulatory Inspection
Mastering the Unannounced Regulatory Inspection
 
call girls in Kamla Market (DELHI) 🔝 >༒9953330565🔝 genuine Escort Service 🔝✔️✔️
call girls in Kamla Market (DELHI) 🔝 >༒9953330565🔝 genuine Escort Service 🔝✔️✔️call girls in Kamla Market (DELHI) 🔝 >༒9953330565🔝 genuine Escort Service 🔝✔️✔️
call girls in Kamla Market (DELHI) 🔝 >༒9953330565🔝 genuine Escort Service 🔝✔️✔️
 
18-04-UA_REPORT_MEDIALITERAСY_INDEX-DM_23-1-final-eng.pdf
18-04-UA_REPORT_MEDIALITERAСY_INDEX-DM_23-1-final-eng.pdf18-04-UA_REPORT_MEDIALITERAСY_INDEX-DM_23-1-final-eng.pdf
18-04-UA_REPORT_MEDIALITERAСY_INDEX-DM_23-1-final-eng.pdf
 
Paris 2024 Olympic Geographies - an activity
Paris 2024 Olympic Geographies - an activityParis 2024 Olympic Geographies - an activity
Paris 2024 Olympic Geographies - an activity
 
MENTAL STATUS EXAMINATION format.docx
MENTAL     STATUS EXAMINATION format.docxMENTAL     STATUS EXAMINATION format.docx
MENTAL STATUS EXAMINATION format.docx
 
CARE OF CHILD IN INCUBATOR..........pptx
CARE OF CHILD IN INCUBATOR..........pptxCARE OF CHILD IN INCUBATOR..........pptx
CARE OF CHILD IN INCUBATOR..........pptx
 
Model Call Girl in Bikash Puri Delhi reach out to us at 🔝9953056974🔝
Model Call Girl in Bikash Puri  Delhi reach out to us at 🔝9953056974🔝Model Call Girl in Bikash Puri  Delhi reach out to us at 🔝9953056974🔝
Model Call Girl in Bikash Puri Delhi reach out to us at 🔝9953056974🔝
 
Presentation by Andreas Schleicher Tackling the School Absenteeism Crisis 30 ...
Presentation by Andreas Schleicher Tackling the School Absenteeism Crisis 30 ...Presentation by Andreas Schleicher Tackling the School Absenteeism Crisis 30 ...
Presentation by Andreas Schleicher Tackling the School Absenteeism Crisis 30 ...
 
Introduction to AI in Higher Education_draft.pptx
Introduction to AI in Higher Education_draft.pptxIntroduction to AI in Higher Education_draft.pptx
Introduction to AI in Higher Education_draft.pptx
 
Accessible design: Minimum effort, maximum impact
Accessible design: Minimum effort, maximum impactAccessible design: Minimum effort, maximum impact
Accessible design: Minimum effort, maximum impact
 
Alper Gobel In Media Res Media Component
Alper Gobel In Media Res Media ComponentAlper Gobel In Media Res Media Component
Alper Gobel In Media Res Media Component
 
“Oh GOSH! Reflecting on Hackteria's Collaborative Practices in a Global Do-It...
“Oh GOSH! Reflecting on Hackteria's Collaborative Practices in a Global Do-It...“Oh GOSH! Reflecting on Hackteria's Collaborative Practices in a Global Do-It...
“Oh GOSH! Reflecting on Hackteria's Collaborative Practices in a Global Do-It...
 
Class 11 Legal Studies Ch-1 Concept of State .pdf
Class 11 Legal Studies Ch-1 Concept of State .pdfClass 11 Legal Studies Ch-1 Concept of State .pdf
Class 11 Legal Studies Ch-1 Concept of State .pdf
 

Pragmathematics 2014 lecture 3 (2)

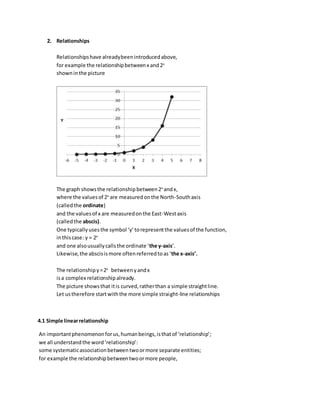
  • 1. 2. Relationships Relationshipshave alreadybeenintroducedabove, for example the relationshipbetweenx and2x showninthe picture The graph showsthe relationshipbetween2x andx, where the valuesof 2x are measuredonthe North-Southaxis (calledthe ordinate) and the valuesof x are measuredonthe East-Westaxis (calledthe abscis). One typicallyusesthe symbol ‘y’torepresentthe valuesof the function, inthiscase: y = 2x and one alsousuallycallsthe ordinate ‘the y-axis’. Likewise,the abscisismore oftenreferredtoas‘the x-axis’. The relationshipy=2x betweenyandx isa complex relationshipalready. The picture showsthat itis curved,ratherthan a simple straightline. Let ustherefore startwiththe more simple straight-line relationships 4.1 Simple linearrelationship An importantphenomenonforus,humanbeings,isthatof ‘relationship’; we all understandthe word‘relationship’: some systematicassociationbetweentwoormore separate entities; for example the relationshipbetweentwoormore people,
  • 2. or the relationshipbetweenpopulationdensityandairpollution, or the relationshipbetweendrivingspeedandgasolineconsumption,etc. If we understandarelationship, we can use that knowledge topredictormanage that phenomenon, e.g.the future incidence orrespiratorydiseasesfromanincrease inurbanization, the gasoline consumptionof aregionif a maximumspeedisimposed,etc. The study of relationships,therefore,isanimportantpartof mathematics for those whoare interestedindoingandapplyingscientificresearch. Let usfirstexplainthe concept of a relationshipbetweentwovariables(‘bivariate’). We use an example frombusinesseconomics, namelya‘breakevenanalysis’. Remember:thisis just an example,todemonstrate mathematics in a concrete case; this is not about the economics! The goal of a breakevenanalysisistodetermine the minimumsalesvolumethatacompanyneeds before itstartsmakinga profit. Take a companythat makesPanamaHats (Ecuadorians,Iknow: thisis nota hat fromPanama, but a ‘sombrerode pajatoquilla’fromyourcountry!). Let ussay that the companysellsitshatsfor 50$ apiece. The revenue (‘TR’) of thatcompanythenequalsthe numberof hatsit sells, representedbythe symbol N, multipliedbythe price itreceivesforeachhat(50$): Total Revenue =TR = 50$*N Thisis a ‘relationship’;we caneasilyrepresentitasinthe graphbelow.
  • 3. A more general expressionforarelationshipof the kind TR = 50*N is y = ax here y standsfor Total Revenue,x fornumberof hats, ‘a’ forthe revenue perhat(50$); y and x are variables. Since Total Revenue dependsonthe numberof hatssold, TR (or, more generallyy) isthe dependentvariable, and N (ormore generallyx) isthe independentvariable. a is a ‘parameter’ The parametera is alsocalledthe ‘slope’of the relationship; it expressesbyhow muchy increasesif x increasesbyone unit (here,TRincreasesby50$ for each increase of salesbyone hat) if the price changesto 60$ perhat, then‘a’ isnot 50 anymore,but60. 0 1000 2000 3000 4000 5000 6000 7000 0 25 50 75 100 125 150 TR N
  • 4. We can easilycompute the total revenueforagivennumbersof hatssold, irrespectiveof the price perhat; we justneedto change 50 into60 (or any othernumber) inthe formula. Excel is handy forsuch computations,asdemonstrated already in sheet3. Nowletus lookat the costs of thisfirm. Its costsare of twokinds: on the one hand fixedcost(F) foroperatingabusiness, these costsremainthe same,irrespective of the numberof hatssold, evenif youdo notsell a single hat (e.g.the salaryof the manager,the salaryof the salesclerk,the rental of the premises); on the otherhand variable costsperhat (v) these are costs fore.g.raw materialsandlaborthat increase withthe numberof hats. If the numberof hats doubles,the variable costsdouble; youneeddouble the materialsanddoublethe numberof hoursworked. Let ussay that the fixedcostof the firmare 1000$ and the cost perhat (‘variable’cost) 30$. The total cost (‘TC’) forproducingN hats thenis,as showninthe graph Total Costs= TC = 1000$ + 30$*N or more generally Total Costs= F + v*N or still more generally z = c + d*x,
  • 5. where c isthe parameterthat standsfor the fixedcosts, d isthe parameterthatstandsfor the variable costperunit(perhat), z is the variable representingthe total costs and x is the variable representingthe numberof hatssold; z is the dependentvariable,x isthe independentvariable: We can nowrepresentbothrelationships, Total Revenue andTotal Costinone graph,as below: In thisgraph (called‘break-evenanalysis’), we see that our hat makerneedstosell acertainnumberof hats before histotal revenuesare highenoughtocoverhistotal costs, i.e.before he startsmakinga profit. That number,N°,of hats (we write N°to designate one specificvalue of N) where the total revenuesexactlyequalthe total costs iscalledthe ‘break-evenpoint’. As we can see inthe graph, that isthe pointwhere bothlines intersect,the pointwhere 50N = 1000 + 30N whichcan be rearrangedinto(usingthe rulesof algebramentionedabove) 50N - 30N = (50-30)N = 20N = 1000
  • 6. fromwhichwe can compute N°= 1000/20 = 50 hats N° isthe solutiontothe ‘breakevenproblem’. Withthisexample,we have introducedthe conceptof aline or a ‘linearrelationship’: boththe relationshipbetweennumberof hatsand total revenue and that betweennumberof hatsand total costsare linearrelationships. Both are picturedas straightlines. We are not aware of it, but we are usinglinearrelationshipsall the time to explain orpicture thingstoourselvesorto others. Like forexample the answertothe question “Whenwill yoube here”? “Well,let’ssee,Icome bybicycle; howfar is itto your place?” “It isabout 50 kilometers” “Well,Ican leave at three o’clock,andI ride some 20 kmper hour, so I shouldarrive around5:30.” The reasoningor relationshiphere is: time of arrival = 3 + (1/20)*distance,i.e.3+ (1/20)*50 = 5:30 or if you want,y = 3 +(1/20)x where yis arrival time,x isthe distance. That is actuallyalinearrelationship, if you make a picture of it,it wouldbe a line, showingtime of arrival ‘infunction’of the distance tobe traveled; if the distance is80 km, thentime = 3 + (1/20)*80 = 7. You will thinkthatthisisa stupidlysimpleexample, but that isexactlythe point: the mathematicsyoureadbeloware in fact verysimple. The general expressionforalinearrelationshipis y = a + bx, where yis the dependentvariable,x isthe independentvariable or‘running’variable; and a and b are parameters (tobe givenspecificvalues), ‘a’ iscalledthe ‘intercept’; that isthe value of ywhenx = 0, as showngraphicallybelow. ‘b’is calledthe slope orinclinationof the line;
  • 7. it expressesbyhowmuchy increaseswhenx increasesbyone unit. If,for example,b=0.5, theny increasesby0.5 each time x increasesbyone unit(showninthe graph). Dependingonthe value of the parametersaand b, youget differentrelationshipsbetweenx andy, but alwayslinearones. To familiarizeyourself withlinearrelationships, we showexamplesy= a + bx for positive (+2),zero(0) ornegative (-3) valuesof the parametera and forpositive (+4),zeroor negative (-0,5) valuesof the parameterb a =-3 and b = -0,5 a =-3 and b = 0
  • 8. a =-3 and b = 4 a =0 and b = -0,5 a=0 and b=0
  • 9. a=0 and b=4 a=2 and b=-0,5 a=2 and b=0
  • 10. a=2 and b=4 If y = a + bx,theny dependsonx: if we knowthe value of the parametersaand b for a specificrelationship, we can compute exactlythe value of ythat correspondswitheachvalue of x; likewise,since x canbe expressedas(y-a)/borx = -a/b + y/b, x can alsobe computedexactlyforanygivenvalue of y. In the case of a linearrelationshipy= a + bx x andy are saidto be ‘linearlydependent’: if you knowthe value of one,youknowthe value of the other. In a sense,youmightsaythat if youknow one of them(x or y) the knowledge of the otherissuperfluous; youcan compute one outof the other. Linear dependence will be mentionedagain below, whenwe doresearchwithseveral variables and itmay be that the informationcontainedinone variable issuperfluous, because itis‘contained’inone ormore other variables. For example:
  • 11. if we thinkthat the incidence of cancerinpeople isdrivenbytheirextentof smoking as well asby theirintake of saturatedfats, but people whosmoke alsotendtoeata lotof saturatedfats, it will be difficulttofindouthowmuchof the incidence of cancer isdue to smokingandhow muchto unhealthyeating Smokingandunhealthyeatingthentendtogo‘handinhand’, tendto be linearlyrelatedto each other. It thenbecomesdifficulttoseparate outthe effectoncancer of smokingonthe one handand unhealthyeatingonthe other. But that isfor laterdiscussion… Now,back to linearrelationships. As we all know,if youtake a page of paperand plottwo pointsonit, youcan drawexactlyone,andonlyone,straightline throughthese twopoints. Anytwo points(x,y) suffice todefine aline orlinearrelationship. If we knowthata line runsthroughthe points(x = 2, y = 0) and (x =5, y = 6), since the line (the linearrelationship) isof the general formy= a +bx, thenthe followingmusthold 0 = a + 2b (y = 0 whenx = 2) 6 = a + 5b (y = 6 whenx = 5) Subtractingthe firstfromthe secondrelationship, we obtain 6-0 = a-a + 5b-2b or 6 = 3b, and hence b= 2 substitutingb= 2 in the firstexpression,(0= a + 2b) we findthat 0 = a +2*2 and hence a = -4. The expressionof the relationshipy= a +bx through(x = 2, y = 0) and(x =5, y = 6) therefore isy= -4 +2x We can verifythat(x = 2, y = 0) and(x =5, y = 6) meet the condition: indeed: 0 = a + 2b or 0 = -4 + 2*2 (forthe point2,0) and 6 = a + 5b or 6 = -4 + 5*2 (forthe point5,6) Once you knowthe parametersaand b for a relationshipof the formy= a + bx, youcan use itto compute any value of ywithinthe original range of valuesof x, i.e.between2and 5, for example x =3; that iscalled‘interpolation’; e.g. if x = 3, theny = -4 +2*3 = 2
  • 12. You can alsouse it to compute a value of y for a value of x outside of itsoriginal interval, i.e.outside the range from2 to 5, e.g.if x = 1000, theny = -4 +2*1000 or 1996. The latteris called ‘extrapolation’. Wheninterpolating,youare ‘inknownterritory’; whenextrapolating,youare ‘innewterritory’. Scientistswilloftendevelopamodel basedonobservationsof pastconditions (i.e.interpolation) and use that model topredictwhatwill happenundernew conditions (i.e.extrapolation) If two linesy= a+bx and z = c+dx intersect (i.e.yand z have the same value), like thatwasthe case above inthe break-evenanalysis withthe Total Revenuesline andthe Total Costs, that will,bydefinition,be foraspecificvalue of x,call itx°,such that y = z, i.e. a+bx°= c+dx° or, usingthe rulesof algebrabx° - dx°= c – a or (b-d)x°=(c-a) and hence x°= (c-a)/(b-d) For example,inthe examplewithhats,where y=50x and z = 1000 + 30x i.e.witha = 0, b = 50, c = 1000 and d = 30 that iswhenx°= 1000/(50 – 30) = 50 hats, as alreadyshownabove. The expressionx°=(c-a)/(b-d) illustratesthe usesandadvantagesof mathematics: it isa general solutiontoaproblem(‘where dotwolinesintersect?’), whichcan thenbe tailoredtoany specificsituation (‘whendothe Total Revenuesof ahat manufacturerequal the Total Costs?) i.e.,to specificvaluesof the parametersa,b,c, d; thisavoidshavingtocompute a specificsolution everytime youhave a problemof the same structure but withdifferentparameters (e.g.the intersectionof twolines) If the price perhat dropsto 40*, forexample, the break-evenvolume becomes1000/(40-30) = 100.
  • 13. If a =10, b = 100, c = 2000 and d = 20, thenx° can be computedwiththe same rule as (c-a)/(b-d) =(2000-10)/(100-20) x° = (c-a)/(b-d),again,isa rule to remember. You do not have to prove it again, the proof has beengiven; you can now use it for any problemwhere two linearrelationshipsintersect. As we sawin the graph above,the relationships TR = 50*N andTC = 1000 + 30*N are lines,orlinearrelationships. Thismeansthat if we sell one more hat, the total revenue increasesbyafixed50$ (irrespective of whetherwe alreadysell few ormanyhats), or if we manufacture one more hat, the costsincrease by30$ (again,irrespective of howmanyhatswe are alreadymanufacturingatthatpoint). These relationshipscanbe visualizedonasheetof paper, i.e.ona flatmap,a plane, withan axisforTR or TC (the up-downaxis,orNorth-Southaxis,usuallyidentifiedasy) and an axisforN (the left-to-rightaxis,orEast-Westaxis,usuallyidentifiedasx). Each pointof that plane hasa coordinate forN and forTR (orTC) or, more generally,forx andfory. A line,then,isthe collectionof points(x,y) inamapor plane that satisfythe conditiony= a + bx for some specificvaluesof aand b. For example,the line TC= 1000 +30N isthe collectionof pointswithcoordinates(N,TC) such that TC = 1000 + 30N Evidently,1030 liesonthat line (itisthe value of TC forN =1) and so does1300 (the value of TC for n = 10); but the point(N,TC) = (10, 2000) obviouslydoesnotlie onthe line. Similarly,the line y= 2 + 3x isthe collectionof all points(x°,y°) inthe plane withaxesx andy whichmeetthe requirementthat y° = 2 + 3x°
  • 14. The point(2,8) issuch a point,since 8 = 2+3*2; so isthe point(5,17); and so are also the points(0,2) and (-1,-1); on the otherhand,the point(3, 5) doesnot lie onthisline, since itis nottrue that 5 = 2 + 3*3. Thisis illustratedgraphicallybelow. Why didwe needtomentionthis? Below,we will see thatinreality, the observations(points) thatwe canmake of a relationship do notalwayslie neatlyona straightline, butalmost. We will thensee howwe cannevertheless‘guess’ whatthe linearrelationshipisbelow inthe sectiononestimatingthe parametersof alinearrelationship.
  • 15. 4.2 Multivariate linearrelationships. In our example,total revenue dependsonlyon the numberof hatssold; the relationshipisbetweentwovariables,TRandN (ory and x); it isbivariate. Linearrelationshipscaninvolvemore thantwophenomenaorvariables. Let usillustrate thatbyexpandingthe Panamahatexample. If the firmalsomakesties,andsellsthemat20$ apiece, thenitstotal revenue dependsnotonlyonthe numberof hats sold(N), but alsoon the numbertiessold(T): Total Revenue = 50*N + 20*T or in general terms: y = a + bx + cz (withparametersa,b andc; inthe example a= 0, b = 50 and c = 20). If we wantto representthisgraphically, we are not lookingatlinesona map(i.e.ina flat‘plane’) anymore, but ratherat a plane ina space withaxesTR, N andT; (we are ‘movingup’one dimensioninourreasoning: the unidimensional lineof the previousexample nowbecomesa two-dimensionalplane and the 2-dimensional planeinwhichwe drew te line nowbecomesa 3-dimensional space,i.e.‘space’aswe are usedtothinkof it, witha right-left,front-backandup-downdimensionoraxis). Each pointof that plane meetsthe conditionthatTR = 50*N + 20*T. That plane goesthroughthe origin (TR = 0 whenN = 0 and T = 0; i.e. throughthe point0,0, 0), thisexpressesthatthe revenuesare zero whenthe firmdoesnotsell anyhat or tie. The plane slopesupwardswithN andwithT, more steeply(50per unit) withN thanwithT (30 per unit). The relationshipbetweenTotal revenue y),hatssold(x) andtiessold(z) isillustratedin the picture below(agraphical model…).
  • 16. While TR = 50$*N or y = a + bx isa bivariate linearrelationship, TR + 50*N + 20*T or y = a + bx + cz is a multivariate linearrelationship (inthiscase it is trivariate,betweenthree variables:y,x andz). Such a trivariate relationshipsmaybe useful todescribe,andbuild, a slopingflatsurface,e.g.inarchitecture orindesign. But it isalsouseful torepresentormodel phenomena where one dependentvariable iscaused by more than one independentvariable, such as whenthe revenuesof afirmdependonN and T, or whenthe incidence of cancerdepends on the extentof smokingandonthe intake of saturatedfats. If the firmalsosells Sshirts,at 80$ per shirt, thenthe linearrelationshipwouldbecomeTR= 50N + 20T + 80S, and so on… A final note on linearrelationships:lineartransformation. To illustrate whatwe meanbya lineartransformation, letus returnto the example of measuringtemperature. Temperature remainsthe same, irrespectiveof whetherwe measure itin°Cor in °F. It musttherefore be possible to‘translate’or‘transform’ °Cinto°Fand vice versa. Since we knowthat waterfreezesat32°F, or at 0°C and since a 1° difference in°Fisa 5/9° difference in°C, the transformationisgivenby°C= (°F-32)*(5/9) 0 1 2 3 4 5 6 7 8910 0 100 200 300 400 500 600 700 0 1 2 3 4 5 6 7 8 9 10 Z Y X
  • 17. or °C = – 32*(5/9) + (5/9)*°F, thisisa linearrelationshipof the form°C= a * b*°F for example,65°Fcorrespondsto(65-32)*(5/9) °C = 18,33°C Usingthe rulesof algebra,we can alsosay that °C*(9/5) = °F – 32, or °F = 32 + °C*(9/5), againa linearrelationship,of the form°F= c + d*°C Anotherexampleof alineartransformationisgiven by the operationof standardizingameasurement The standardizedvalue zof a measurementx isobtainedas z = (x-m)/s with‘m’the meanor average of the measurementsand‘s’theirstandarddeviation. Usingthe rulesof algebra,thiscan be writtenasz = -(m/s) +x/s if we substitute the symbol ‘a’for–(m/s) and‘b’for (1/s) thenwe can write z = a + bx,a relationshipwithlinearform.
  • 18. 4.3 Estimating the parametersof a linearrelationship Typically,inscientificresearch,we donotknow exactlythe formor model takenon bya specificphenomenon,e.g.the relationshipbetweentwovariables, such as the incidence of lungcancerandair pollution; we may assume thatit islinear,e.g.of the formy = a + bx, but we usuallydonotknowthe value of the parametersa and b. We mayhave to guessthe value of these parametersourselves, or try to infertheirvalue fromthe pasthistoryof the phenomenon. To use a simple andfamiliarexample, letus reverttothe hat manufacturer. Whenthe managerof the hat companysays that hisTotal Revenue is50$*N. that may actuallyonlybe hisassumptionorguess. Is thisreallytrue?Dothe salesfiguresconfirmthis? Sometimes,hatsmaybe soldata lowerprice, e.g.whenthe customerbuysmore thanone, or sometimesrichcustomersmaybe chargeda higherprice… Then,whatreallyisthe relationshipbetweenrevenue andnumberof hats? Can we inferthe parameterof the relationshipTR= a*N frompast observationsonnumberof hatsandrevenues? Andwhat isthe relationshipbetweenTotal Costsandnumberof hats; isit really1000$ + 30$*N as the managersays? Can we inferthe parametersof the cost functionTC= F + v*N frominspectingpastresultsof hatmanufacturers, fromthe numberof hatsproducedlastyear andtotal costsin that year? Assume thatthe Hat makers’associationprovidesuswiththe Total Costs and the numberof manufacturedhatsfor13 firms,asin the table below.
  • 19. Firm HATS(N) Total Costs(TC) 1 1100 45200 2 400 15400 3 980 29800 4 1100 44300 5 600 18040 6 1200 55000 7 1050 40300 8 500 16500 9 400 13500 10 1250 42900 11 800 31250 12 900 29800 13 300 15060 If we make a graph,as below,thenwe see thatthe observations,the data do notall lie neatly onone straightline TC=c + dN; it isnot the case thatTC isexactlyequal to1000 + 30*N for each firm. Thenwhat isthe (linear) relationshipbetweentotal costandnumberof hats TC = c + d*N whichbestreflectsthe reality(the data)?; whatis the ‘best’ line TC = c + d*N. That is to say:what isthe bestvalue forthe parameters,c°and d°, so that the relationshipTC = c° + d°*N closelyapproximatesthe observationsinthe graph?
  • 20. If I knewthese ‘best’valuesof ‘c’and‘d’(call these c° andd°), thenfor Firm1, the relationshipwouldpredictTotal Costsof c° + d°*1100; since the real costs forthat firmare 45200; the difference betweenrealityandthe predictionis(45200- c° – d°*1100); for Firm2 the difference wouldbe (15400 -c° - d°*400), etc. We lookforvaluesforc° and d° that make these differencessmall. But we do notknowc° and d°; the bestwe can dois estimate themonthe basisof the available data. To find,or ‘estimate’c°andd°,we apply the ‘leastsum of squared differences’or‘leastsquares’principle that wasintroducedabove: lookforthe value of ‘c’and ‘d’ whichmake the sumof the 13 squareddifferences (45200- c – d*1100)² + (15400 -c - d*400)² + … + (15600 – c – d*300)² as small as possible. For these valuesof ‘c’and‘d’ the resulting‘fitted’orpredictedTotal Costs will lie ‘asclose aspossible’tothe real Total Cost figures; the squareddifference betweenrealityandthe predictionwill thenbe the smallest Since there are 13 squareddifferences (oneforeachmonth), we sum them,addthemup andlook(we ask the computerto lookforthis…) for the value of ‘c’ and‘d’ that make that ‘sumof squares’minimal.
  • 21. That is an operationeasilyperformedinExcel; e.g.by the functionLINESTinExcel underFormulas>more functions>statistics>linest or evenas a facilityofferedtogetherwiththe scatterplotof the data.. The estimatedrelationshipy= a + bx,inthiscase TC = c + d*N isseento be y = 2634 + 31,45*N It iscalledthe ‘simple linearregressionofy on x’, here itis the regressionof TCon N. We say‘linear’because the relationshipisof the form‘y = a + bx’ and we say ‘simple’because thisinvolvesonlytwovariables,Xandy. Simple linearregressionsare usedveryofteninempirical researchtomodel relationshipsbetweenone dependentvariable (y) andone independentvariable (x) and where there isnoreasonto thinkthatthe relationshipisnotlinear(seebelow). If y is assumedtodependonmore than one variable,forexample y = a + bx + cz thenthe bestfittinglinearrelationshipwill be a‘multiple linearregression’.