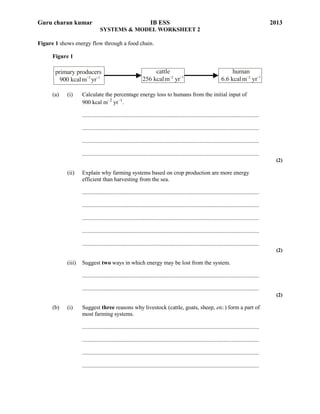
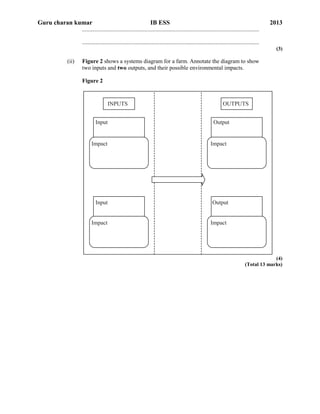
Guru charan kumar

IB ESS

2013

SYSTEMS & MODEL WORKSHEET 2
Figure 1 shows energy flow through a food chain.
Figure 1

primary producers
–
900 kcal m 2 yr–1
(a)

(i)

cattle
256 kcal m–2 yr–1

human
6.6 kcal m–2 yr–1

Calculate the percentage energy loss to humans from the initial input of
900 kcal m–2 yr–1.
...........................................................................................................................
...........................................................................................................................
...........................................................................................................................
...........................................................................................................................
(2)

(ii)

Explain why farming systems based on crop production are more energy
efficient than harvesting from the sea.
...........................................................................................................................
...........................................................................................................................
...........................................................................................................................
...........................................................................................................................
...........................................................................................................................
(2)

(iii)

Suggest two ways in which energy may be lost from the system.
...........................................................................................................................
...........................................................................................................................
(2)

(b)

(i)

Suggest three reasons why livestock (cattle, goats, sheep, etc.) form a part of
most farming systems.
...........................................................................................................................
...........................................................................................................................
...........................................................................................................................
...........................................................................................................................
Guru charan kumar

IB ESS

2013

...........................................................................................................................
...........................................................................................................................
(3)

(ii)

Figure 2 shows a systems diagram for a farm. Annotate the diagram to show
two inputs and two outputs, and their possible environmental impacts.
Figure 2

INPUTS
Input

Impact

Input

Impact

OUTPUTS
Output

Impact

Output

Impact

(4)
(Total 13 marks)

Practice sheet system & models 2

  • 1.
    Guru charan kumar IBESS 2013 SYSTEMS & MODEL WORKSHEET 2 Figure 1 shows energy flow through a food chain. Figure 1 primary producers – 900 kcal m 2 yr–1 (a) (i) cattle 256 kcal m–2 yr–1 human 6.6 kcal m–2 yr–1 Calculate the percentage energy loss to humans from the initial input of 900 kcal m–2 yr–1. ........................................................................................................................... ........................................................................................................................... ........................................................................................................................... ........................................................................................................................... (2) (ii) Explain why farming systems based on crop production are more energy efficient than harvesting from the sea. ........................................................................................................................... ........................................................................................................................... ........................................................................................................................... ........................................................................................................................... ........................................................................................................................... (2) (iii) Suggest two ways in which energy may be lost from the system. ........................................................................................................................... ........................................................................................................................... (2) (b) (i) Suggest three reasons why livestock (cattle, goats, sheep, etc.) form a part of most farming systems. ........................................................................................................................... ........................................................................................................................... ........................................................................................................................... ...........................................................................................................................
  • 2.
    Guru charan kumar IBESS 2013 ........................................................................................................................... ........................................................................................................................... (3) (ii) Figure 2 shows a systems diagram for a farm. Annotate the diagram to show two inputs and two outputs, and their possible environmental impacts. Figure 2 INPUTS Input Impact Input Impact OUTPUTS Output Impact Output Impact (4) (Total 13 marks)