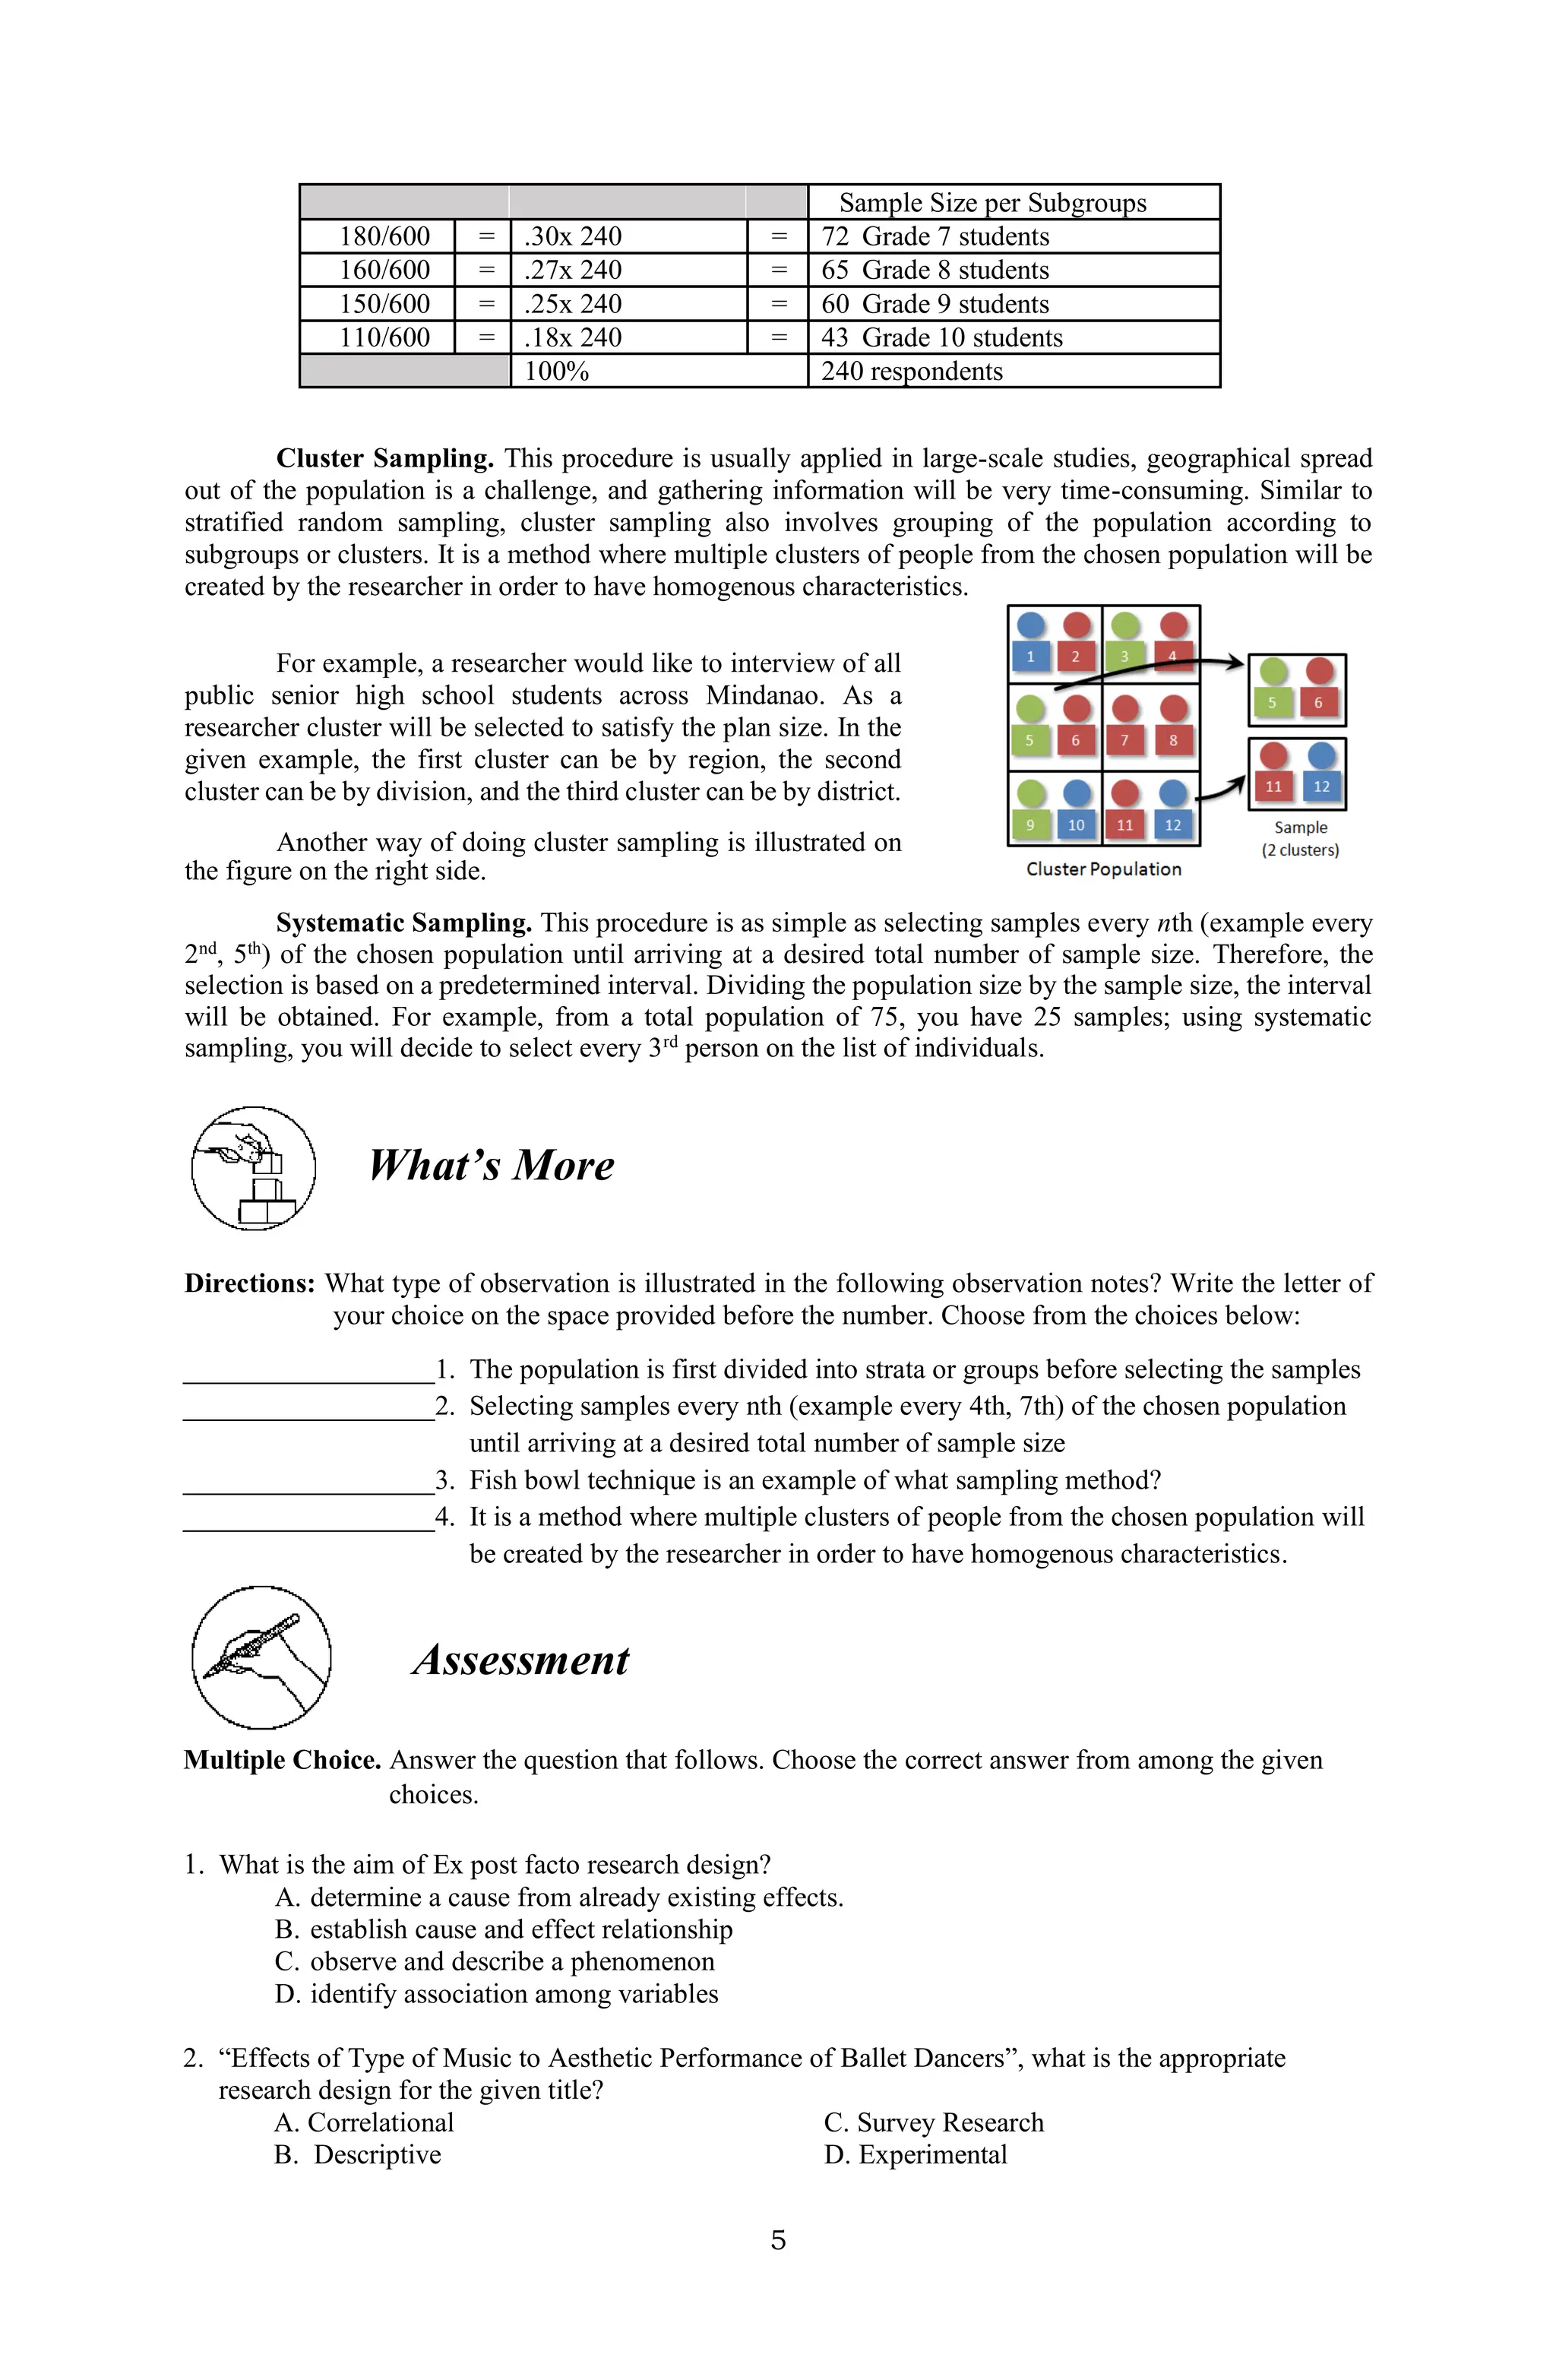
SlideShare a Scribd company logo
12
Practical Research 2
Quarter 2 – Module 1
Research Design and Sampling
Procedure
ii
Practical Research 2 – Grade 12
Alternative Delivery Mode
Quarter 2 – Module 1 Research Design and Sampling Procedure
First Edition, 2020
Republic Act 8293, Section 176 states that: No copyright shall subsist in any work of the Government of
the Philippines. However, prior approval of the government agency or office wherein the work is created
shall be necessary for exploitation of such work for profit. Such agency or office may, among other things,
impose as a condition the payment of royalties.
Borrowed materials (i.e., songs, stories, poems, pictures, photos, brand names, trademarks, etc.) included
in this book are owned by their respective copyright holders. Every effort has been exerted to locate and
seek permission to use these materials from their respective copyright owners. The publisher and authors
do not represent nor claim ownership over them.
Published by the Department of Education
Secretary: Leonor Magtolis Briones
Undersecretary: Diosdado M. San Antonio
Development Team of the Module
Writers: Stalin S. Baja
Cecille P. Buco
Editors: Arcadio J. Malmis PhD
Principal III
Cristina N. Apale PhD
Principal II
Elvira I. Jabonillo PhD
Principal I
Management Team: Bianito A. Dagatan EdD, CESO V
Schools Division Superintendent
Casiana P. Caberte PhD
Assistant Schools Division Superintendent
Felix C. Galacio Jr. PhD
EPS, Mathematics
Josephine D. Eronico PhD
EPS, LRMDS
Printed in the Philippines by Schools Division of Bohol
Department of Education – Region VII, Central Visayas
Office Address: 0050 Lino Chatto Drive Barangay Cogon, Tagbilaran City,
Bohol
Telefax: (038) 501 – 7550
Tel Nos. (038) 412 – 4938; (038) 411-2544; (038) 501 – 7550
E-mail Address: depedbohol@deped.gov.ph
Learning Competencies:
1. choose appropriate quantitative research design (CS_RS12-IIa-c-1)
2. describe sampling procedure and the sample (CS_RS12-IIa-c-1)
At the end of the lesson, you are expected to:
 define quantitative research design
 choose appropriate quantitative research design
 define what is population and sample
 describe the different approaches in identifying the sample size
 choose appropriate sampling method
What is it
Meaning of Quantitative Research Designs
When a man decides to build a house, he draw first the blue print before he will start to do the
work. Same with the conduct of research, the blueprint for the collection, measurement, and data analysis
is drawn as a pattern to follow. Furthermore, research designs enable the researcher to obtain a more valid,
objective, reliable, and accurate answers to the research questions.
Research design is defined as the logical and coherent overall strategy that the researcher uses to
integrate all the components of the research study (Barrot, 2017, p 102). In order to find meaning in the
overall process of doing your research study, a step-by-step process will be helpful to you.
In quantitative research, you are going to have a great deal of abstraction and numerical analysis.
According to Fraenkel and Wallen (2007, p 15), the research designs in quantitative research are mostly
pre-established. Hence having an appropriate research design in quantitative research, the researcher will
have a clearer comprehension of what he is trying to analyze and interpret.
Types of Quantitative Research Design
Quantitative Research Designs have five general classifications: descriptive, correlational, ex post
facto, quasi-experimental, and experimental.
Descriptive Research. When little is known about the research problem, then it is appropriate to
use descriptive research design. It is a design that is exploratory in nature. The purpose of descriptive
research is basically to answer questions such as who, what, where, when, and how much. So this design is
best used when the main objective of the study is just to observe and report a certain phenomenon as it is
happening.
Correlational Research. The main goal of this design is to determine if variable increases or
decreases as another variable increases or decreases. This design seeks to establish an association between
variables. It does not seek cause and effect relationship like descriptive research; it measures variables as
it occurs. It has two major purposes: (a) to clarify the relationship between variables and (b) predict the
magnitude of the association. However, the extent of the purpose of correlational research depends on the
scope and delimitation of the study.
Ex Post Facto. If the objective of the study is to measure a cause from a pre-existing effects, then
Ex Post Facto research design is more appropriate to use. In this design, the researcher has no control over
the variables in the research study. Thus, one cannot conclude that the changes measured happen during
the actual conduct of the study.
The last two types of quantitative research designs are identifiable for the existence of treatment or
intervention applied to the current research study. Intervention or treatment pertains to controlling or
Lesson 1: Quantitative Research Design
2
manipulating the independent variable in an experiment. It is assumed that the changes in dependent
variables were caused by the independent variable.
There are also two groups of subjects, participants, or respondents in quasi-experimental and
experimental research. The treatment group refers to the group subjected to treatment or intervention. The
group not subject to treatment or intervention is called the control group.
Quasi-Experimental. The term means partly, partially, or almost – pronounced as kwahz-eye. This
research design aims to measure the causal relationship between variables. The effect measured is
considered to have occurred during the conduct of the current study. The partiality of quasi-experimental
design comes from assigning subjects, participants, or respondents into their groups. The groups are known
to be already established before the study, such as age educational background and nationality. Since the
assignment of subjects, participants, or respondents are not randomly assigned into an experimental or
control groups, the conclusion of results is limited.
Experimental Research. This research design is based on the scientific method called experiment
with a procedure of gathering data under a controlled or manipulated environment. It is also known as true
experimental design since it applies treatment and manipulation more extensively compared to quasi-
experimental design. Random assignment of subjects or participants into treatment and control group is
done increasing the validity of the study. Experimental research, therefore, attempts to affect a certain
variable by directly manipulating the independent variable.
What’s More
Direction: Write your answers on the space provided.
________________________1. This design seeks to establish an association between variables.
________________________2. It is also known as true experimental design since it applies treatment and
manipulation more extensively compared to quasi-experimental design.
________________________3. It pertains to controlling or manipulating the independent variable in an
experiment
________________________4. It is defined as the logical and coherent overall strategy that the researcher
uses to integrate all the components of the research study
What is it
Population and Sample
The first step in determining the sample size is identifying the population of the topic of interest.
The population is the totality of all the objects, elements, persons, and characteristics under consideration.
It is understood that this population possesses common characteristics about which the research aims to
explore.
There are two types of population: target population and accessible population. The actual
population is the target population, for example, all Senior High School Students enrolled in Science,
Technology, Engineering, and Mathematics (STEM) in the Division of Cagayan de Oro City. While the
accessible population is the portion of the population in which the researcher has reasonable access, for
example all Senior High School enrolled, STEM strand at Marayon Science High School – X.
When the whole population is too costly or time-consuming or impractical to consider, then, a
sample representative is identified. Sampling pertains to the systematic process of selecting the group to
Lesson 2: Sampling Procedure and the Sample
3
be analyzed in the research study. The goal is to get information from a group that represents the target
population. Once a good sample is obtained, the generalizability and applicability of findings increases.
The representative subset of the population refers to the sample. All the 240 Senior High School
Students enrolled in Science, Technology, Engineering, and Mathematics (STEM) Strand in a school, for
example, constitute the population; 60 of those students constitute the sample. A good sample should have
characteristics of the represented population – characteristics that are within the scope of the study with
fair accuracy. Generally, the larger the sample, the more reliable the sample be, but still, it will depend on
the scope and delimitation and research design of the study.
Approaches in Identifying the Sample Size
Heuristics. This approach refers to the rule of the thumb for sample size. The early established
approach by Gay (1976) stated by Cristobal and Dela Cruz-Cristobal (2017, p 172), sample sizes for
different research designs are the following:
Research Design Number of Subjects/Participants
Descriptive Research 10% to 20% maybe required
Comparative Research 15 subjects or groups
Lunenberg and Irby (2008), as cited by Barrot (2017, p 107), also suggested different sample sizes
for each quantitative research design.
Research Design Number of Subjects/Participants
Survey 800
Correlational 100 to 200
Ex post facto 30+
Experimental 30 or more
Literature Review. Another approach is by reading similar or related literature and studies to your
current research study. Since you are done writing your review of related literature and studies, you might
want to recall how these studies determine sample size. Using this approach increases the validity of your
sampling procedure.
Formula. Formula are also being established for the computation of an acceptable sample size.
The common formula is Slovin’s Formula.
Slovin’s Formula:
𝒏 =
𝑵
(𝟏 + 𝑵𝒆𝟐)
where:
n = sample size
N = total population size
e = desired margin of error (should be in a decimal form)
𝒏 =
𝟏𝟔𝟖
(𝟏 + 𝟏𝟔𝟖 ∗ 𝟎. 𝟎𝟓𝟐)
𝒏 =
𝟏𝟔𝟖
(𝟏 + 𝟏𝟔𝟖 ∗ 𝟎. 𝟎𝟎𝟐𝟓)
𝒏 =
𝟏𝟔𝟖
(𝟏 + 𝟎. 𝟒𝟐)
𝒏 =
𝟏𝟔𝟖
𝟏. 𝟒𝟐
𝒏 = 𝟏𝟏𝟖
Power Analysis. This approach is founded on the principle of power analysis. There are two
principles you need to consider if you are going to use this approach: these are statistical power and effect
size.
4
The probability of rejecting the null hypothesis is called statistical power. It suggests that
indeed there is a relationship between the independent and dependent variables of the research study.
The ideal statistical power of a research study is 80%. With the statistical power, it will be used to
identify the sufficient sample size for measuring the effect size of a certain treatment. The level of
difference between the experimental group and the control group refers to effect size.
If the statistical power tells that relationship between independent and dependent variables,
the effect size suggests the extent of the relationship between these two variables. Henceforth, the
higher the effect size, means the greater the level difference between the experimental and control
groups. For example, your research study reveals that there is a difference in the pretest and posttest
scores of the students in the given anxiety test after implementing a psychosocial intervention. With
the effect size, you will have an idea of how small or large the difference is.
What’s More
Direction: Write your answers on the space provided.
________________________1. This formula is being used for the computation of an acceptable sample
size.
________________________2. This approach uses studies or related literatures to your present student
which increases the validity of your sampling procedure
________________________3. What will be the computed sample size given these following data:
N=200, and margin of error = 10%? Show your solution.
________________________4. This approach in identifying the sample size refers to the rule of the
thumb.
What is it
Simple Random Sampling. It is a way of choosing individuals in which all members of the
accessible population are given an equal chance to be selected. There are various ways of obtaining samples
through simple random sampling. These are fish bowl technique, roulette wheel, or use of the table of
random numbers. This technique is also readily available online. Visit this link
https://www.randomizer.org/ to practice.
Stratified Random Sampling. The same with simple random sampling, stratified random
sampling also gives an equal chance to all members of the population to be chosen.
However, the population is first divided into strata or groups before selecting the samples. The
samples are chosen from these subgroups and not directly from the entire population. This procedure is best
used when the variables of the study are also grouped into classes such as gender and grade level.
You can simply follow the steps from this given example:
A population of 600 Junior High School students include 180 Grade 7, 160 Grade
8, 150 Grade 9, and 110 Grade 10. If the computed sample size is 240, the following
proportionate sampling will be as follows.
The number of members per subgroup is divided by the total accessible sample size. The percentage
result of members per subgroup will be multiplied from the computed total sample size. After obtaining the
sample size per strata, then simple random sampling will be done for the selection of samples from each
group.
Lesson 3: Probability Sampling in
Quantitative Research
5
Sample Size per Subgroups
180/600 = .30x 240 = 72 Grade 7 students
160/600 = .27x 240 = 65 Grade 8 students
150/600 = .25x 240 = 60 Grade 9 students
110/600 = .18x 240 = 43 Grade 10 students
100% 240 respondents
Cluster Sampling. This procedure is usually applied in large-scale studies, geographical spread
out of the population is a challenge, and gathering information will be very time-consuming. Similar to
stratified random sampling, cluster sampling also involves grouping of the population according to
subgroups or clusters. It is a method where multiple clusters of people from the chosen population will be
created by the researcher in order to have homogenous characteristics.
For example, a researcher would like to interview of all
public senior high school students across Mindanao. As a
researcher cluster will be selected to satisfy the plan size. In the
given example, the first cluster can be by region, the second
cluster can be by division, and the third cluster can be by district.
Another way of doing cluster sampling is illustrated on
the figure on the right side.
Systematic Sampling. This procedure is as simple as selecting samples every nth (example every
2nd
, 5th
) of the chosen population until arriving at a desired total number of sample size. Therefore, the
selection is based on a predetermined interval. Dividing the population size by the sample size, the interval
will be obtained. For example, from a total population of 75, you have 25 samples; using systematic
sampling, you will decide to select every 3rd
person on the list of individuals.
What’s More
Directions: What type of observation is illustrated in the following observation notes? Write the letter of
your choice on the space provided before the number. Choose from the choices below:
__________________1. The population is first divided into strata or groups before selecting the samples
__________________2. Selecting samples every nth (example every 4th, 7th) of the chosen population
until arriving at a desired total number of sample size
__________________3. Fish bowl technique is an example of what sampling method?
__________________4. It is a method where multiple clusters of people from the chosen population will
be created by the researcher in order to have homogenous characteristics.
Assessment
Multiple Choice. Answer the question that follows. Choose the correct answer from among the given
choices.
1. What is the aim of Ex post facto research design?
A. determine a cause from already existing effects.
B. establish cause and effect relationship
C. observe and describe a phenomenon
D. identify association among variables
2. “Effects of Type of Music to Aesthetic Performance of Ballet Dancers”, what is the appropriate
research design for the given title?
A. Correlational C. Survey Research
B. Descriptive D. Experimental
6
3. Mr. Canuc would like to know further the type of social media used between the male and female
SHS students of East Pagat National High School. What is the appropriate research design to be used
in his study?
A. Quasi-Experimental C. Correlational
B. Experimental D. Descriptive
4. Which of the following statements is true about the conduct of experimental research?
A. There is no random assignment of individuals.
B. Individual subjects are randomly assigned.
C. Groups are exposed to presumed cause.
D. Intact groups are used.
5. What is the difference between quasi-experimental research and experimental research?
A. Only one dependent variable is used in quasi-experimental research, while multiple
dependent variables can be used in quasi-experimental research.
B. Intact groups are used in experimental, while quasi-experimental randomly assigned
individuals into groups.
C. Participants for groups are randomly selected in experimental, but not quasi-experimental
research.
D. The researcher controls the intervention in the experimental group, but not quasi-
experimental research.
6. Why would a researcher choose to use Simple Random Sampling as a sampling technique?
A. To consider giving equal chance to the member of accessible population being selected as
part of the study.
B. To make sure that all subcategories of the population are represented in the selection of
sample.
C. To group the entire population into clusters since the location of the samples are widely
spread.
D. To systematically choose samples from a given list of individuals.
7. When can we consider a research sample as "best?"
A. representative of population C. conveniently represented
B. systematically chosen D. purposively selected
8. Given that your study will use stratified random sampling, wherein population of your scope is 250
with a computed sample size of 152, how many samples for each strata will you have if group 1 has
92, group 2 has 86, and group 3 has 72 population?
A. Group 1 = 52, Group 2 = 54, Group 3 = 46
B. Group 1 = 56, Group 2 = 45, Group 3 = 51
C. Group 1 = 52, Group 2 = 52, Group 3 = 44
D. Group 1 = 54, Group 2 = 56, Group 3 = 41
9. What sampling technique is used when the researcher would like to consider giving an equal chance to
the member of the accessible population being selected as part of the study?
A. Simple Random Sampling C. Systematic Sampling
B. Stratified Sampling D. Cluster Sampling
10.What is the main objective of using stratified random sampling?
A. sample was chosen proportionately drawn from the different categories of the population
B. sample is taken from an accessible population than the target population
C. every individual will be given an equal chance to be selected
D. those who will possibly respond to treatment are chosen
7
Answer Sheet
Name: ____________________________________________________________________
Grade & Section: ________________ Score: ______________
PRACTICAL RESEARCH 2
Quarter 2 – Module 1
Lesson 1: What’s More
1)
2)
3)
4)
Lesson 2: What’s More
1)
2)
3)
4)
Lesson 3: What’s More
1)
2)
3)
4)
Assessment
1) 2)
3) 4)
5) 6)
7) 8)
9) 10)
But he said to me,
“My grace is sufficient for you, for my power is made perfect in weakness.” Therefore, I will boast all the more gladly about my
weaknesses, so that Christ’s power may rest on me.
2 Corinthians 12:9
Congratulations! You made it! 😊 Keep it up!
8
Key Answer
References
Baraceros, E. L. (2016). Practical Research 2. Sampaloc, Manila: Rex Bookstore, Inc.
Barrot, J. S. (2017). Practical Research 2 for Senior High School. Quezon City, Philippines: C & E
Publishing, Inc.
Center for Quality Research. (2015). "Overview of Quantitative Research Methods." YouTube. Accessed
June 3, 2020. https://bit.ly/36A5idj
Creswell, J. W. (2009). Research Design: Qualitative, Quantitative, and Mixed Methods Approaches. 3rd
ed., SAGE Publications, Inc. https://bit.ly/2X3Bra3
Cristobal, A. and De La Cruz-Cristobal, M. (2017). Practical Research 1. Quezon City, Philippines: C &
E Publishing, Inc.
Fraenkel, J. R. and Wallen, N. E. (2006). How to Design and Evaluate Research in Education. Asia: Mc-
Graw Hill Companies, Inc.
Fraenkel, J. R. and Wallen, N. E. (2020). How to Design and Evaluate Research in Education. 6th
ed.,
McGraw-Hill Global Education Holdings, LLC. Accessed June 3, 2020. https://bit.ly/3eBIVrs
I Hope. (2020). "Kinds of Quantitative Research Designs." YouTube. Accessed June 3, 2020.
https://bit.ly/2LZVLCS
Keyton, J. (2020). "Chapter 7: Multiple Choice Quiz." McGraw-Hill Global Education Holdings, LLC.
Accessed June 3, 2020. https://bit.ly/3eojlWk
Quarter
2
-
Module
1
Lesson
1
What’s
More
1.
Correlational
2.
Experimental
3.
Intervention
4.
Research
Design
Lesson
2
What’s
More
1.
Slovin’s
Formula
2.
Literature
Review
3.
66.666
or
67
4.
Heuristics
Lesson
3
Assessment
What’s
More
1.
A
6.
C
1.
Stratified
Random
Sampling
2.
D
7.
A
2.
Systematics
Sampling
3.
C
8.
A
3.
Simple
Random
Sampling
4.
B
9.
A
4.
Cluster
Sampling
5.
C
10.
A

More Related Content

Similar to PR2-Q2-Module-1 (1).pdf

Week 1-2 -INTRODUCTION TO QUANTITATIVE RESEARCH.pptx
Week 1-2 -INTRODUCTION TO QUANTITATIVE RESEARCH.pptxWeek 1-2 -INTRODUCTION TO QUANTITATIVE RESEARCH.pptx
Week 1-2 -INTRODUCTION TO QUANTITATIVE RESEARCH.pptx
ChristineTorrepenida1
 
Presentation research design
Presentation research designPresentation research design
Presentation research design
Shagufta Moghal
 
Presentation Understanding Research MethodologyIn conducting s.docx
Presentation Understanding Research MethodologyIn conducting s.docxPresentation Understanding Research MethodologyIn conducting s.docx
Presentation Understanding Research MethodologyIn conducting s.docx
ChantellPantoja184
 
Research Design _komal-1.docx
Research Design _komal-1.docxResearch Design _komal-1.docx
Research Design _komal-1.docx
PREETICHOUDHARY100
 
research approach and design
research approach and designresearch approach and design
research approach and design
Saima Habeeb
 
The gist of Research in Business Research
The gist of Research in Business ResearchThe gist of Research in Business Research
The gist of Research in Business Research
Kuria3
 
Top of FormPresentation Understanding Research MethodologyIn.docx
Top of FormPresentation Understanding Research MethodologyIn.docxTop of FormPresentation Understanding Research MethodologyIn.docx
Top of FormPresentation Understanding Research MethodologyIn.docx
edwardmarivel
 
Language and Literature Research (7 of 16)
Language and Literature Research (7 of 16)Language and Literature Research (7 of 16)
Language and Literature Research (7 of 16)
Nheru Veraflor
 
Chapter-4-Research-Methods.pptx
Chapter-4-Research-Methods.pptxChapter-4-Research-Methods.pptx
Chapter-4-Research-Methods.pptx
DulnuanCrizamae
 
Prac Res 2_Q1M1.pdf
Prac Res 2_Q1M1.pdfPrac Res 2_Q1M1.pdf
Prac Res 2_Q1M1.pdf
JAKEFRANCISLUMBRES
 
Net coaching & remedial classes p 1 part 2 research
Net coaching & remedial classes p 1 part 2 researchNet coaching & remedial classes p 1 part 2 research
Net coaching & remedial classes p 1 part 2 research
Bhumi Dangi
 
Sir Tariq M. Research.2 (1)
Sir Tariq M. Research.2 (1)Sir Tariq M. Research.2 (1)
Sir Tariq M. Research.2 (1)
Ashar Azam
 
Marketing Research
Marketing ResearchMarketing Research
Marketing Research
Rubayet Hassan
 
Solving research problem_3539ce35db1215c11a780b1712d47e46
Solving research problem_3539ce35db1215c11a780b1712d47e46Solving research problem_3539ce35db1215c11a780b1712d47e46
Solving research problem_3539ce35db1215c11a780b1712d47e46
Kæsy Chaudhari
 
Research Methodology 2 sem.pdf
Research Methodology 2 sem.pdfResearch Methodology 2 sem.pdf
Research Methodology 2 sem.pdf
Jagadish Hudagi
 
Research Methodology Basics - I
Research Methodology Basics - IResearch Methodology Basics - I
Research Methodology Basics - I
vigneswaran81
 
Research Projec & Research Designt.pptx
Research Projec & Research Designt.pptxResearch Projec & Research Designt.pptx
Research Projec & Research Designt.pptx
SaiPrasad247616
 
Research design
Research designResearch design
Research design
DeeptiGupta154
 
Workshop on graduation attachment_085511.pptx
Workshop on graduation attachment_085511.pptxWorkshop on graduation attachment_085511.pptx
Workshop on graduation attachment_085511.pptx
abdulrasheedafeez202
 
Ms 66 marketing research
Ms 66 marketing researchMs 66 marketing research
Ms 66 marketing researchsmumbahelp
 

Similar to PR2-Q2-Module-1 (1).pdf (20)

Week 1-2 -INTRODUCTION TO QUANTITATIVE RESEARCH.pptx
Week 1-2 -INTRODUCTION TO QUANTITATIVE RESEARCH.pptxWeek 1-2 -INTRODUCTION TO QUANTITATIVE RESEARCH.pptx
Week 1-2 -INTRODUCTION TO QUANTITATIVE RESEARCH.pptx
 
Presentation research design
Presentation research designPresentation research design
Presentation research design
 
Presentation Understanding Research MethodologyIn conducting s.docx
Presentation Understanding Research MethodologyIn conducting s.docxPresentation Understanding Research MethodologyIn conducting s.docx
Presentation Understanding Research MethodologyIn conducting s.docx
 
Research Design _komal-1.docx
Research Design _komal-1.docxResearch Design _komal-1.docx
Research Design _komal-1.docx
 
research approach and design
research approach and designresearch approach and design
research approach and design
 
The gist of Research in Business Research
The gist of Research in Business ResearchThe gist of Research in Business Research
The gist of Research in Business Research
 
Top of FormPresentation Understanding Research MethodologyIn.docx
Top of FormPresentation Understanding Research MethodologyIn.docxTop of FormPresentation Understanding Research MethodologyIn.docx
Top of FormPresentation Understanding Research MethodologyIn.docx
 
Language and Literature Research (7 of 16)
Language and Literature Research (7 of 16)Language and Literature Research (7 of 16)
Language and Literature Research (7 of 16)
 
Chapter-4-Research-Methods.pptx
Chapter-4-Research-Methods.pptxChapter-4-Research-Methods.pptx
Chapter-4-Research-Methods.pptx
 
Prac Res 2_Q1M1.pdf
Prac Res 2_Q1M1.pdfPrac Res 2_Q1M1.pdf
Prac Res 2_Q1M1.pdf
 
Net coaching & remedial classes p 1 part 2 research
Net coaching & remedial classes p 1 part 2 researchNet coaching & remedial classes p 1 part 2 research
Net coaching & remedial classes p 1 part 2 research
 
Sir Tariq M. Research.2 (1)
Sir Tariq M. Research.2 (1)Sir Tariq M. Research.2 (1)
Sir Tariq M. Research.2 (1)
 
Marketing Research
Marketing ResearchMarketing Research
Marketing Research
 
Solving research problem_3539ce35db1215c11a780b1712d47e46
Solving research problem_3539ce35db1215c11a780b1712d47e46Solving research problem_3539ce35db1215c11a780b1712d47e46
Solving research problem_3539ce35db1215c11a780b1712d47e46
 
Research Methodology 2 sem.pdf
Research Methodology 2 sem.pdfResearch Methodology 2 sem.pdf
Research Methodology 2 sem.pdf
 
Research Methodology Basics - I
Research Methodology Basics - IResearch Methodology Basics - I
Research Methodology Basics - I
 
Research Projec & Research Designt.pptx
Research Projec & Research Designt.pptxResearch Projec & Research Designt.pptx
Research Projec & Research Designt.pptx
 
Research design
Research designResearch design
Research design
 
Workshop on graduation attachment_085511.pptx
Workshop on graduation attachment_085511.pptxWorkshop on graduation attachment_085511.pptx
Workshop on graduation attachment_085511.pptx
 
Ms 66 marketing research
Ms 66 marketing researchMs 66 marketing research
Ms 66 marketing research
 

Recently uploaded

Introduction to Quality Improvement Essentials
Introduction to Quality Improvement EssentialsIntroduction to Quality Improvement Essentials
Introduction to Quality Improvement Essentials
Excellence Foundation for South Sudan
 
1.4 modern child centered education - mahatma gandhi-2.pptx
1.4 modern child centered education - mahatma gandhi-2.pptx1.4 modern child centered education - mahatma gandhi-2.pptx
1.4 modern child centered education - mahatma gandhi-2.pptx
JosvitaDsouza2
 
The geography of Taylor Swift - some ideas
The geography of Taylor Swift - some ideasThe geography of Taylor Swift - some ideas
The geography of Taylor Swift - some ideas
GeoBlogs
 
How to Make a Field invisible in Odoo 17
How to Make a Field invisible in Odoo 17How to Make a Field invisible in Odoo 17
How to Make a Field invisible in Odoo 17
Celine George
 
Sectors of the Indian Economy - Class 10 Study Notes pdf
Sectors of the Indian Economy - Class 10 Study Notes pdfSectors of the Indian Economy - Class 10 Study Notes pdf
Sectors of the Indian Economy - Class 10 Study Notes pdf
Vivekanand Anglo Vedic Academy
 
Unit 2- Research Aptitude (UGC NET Paper I).pdf
Unit 2- Research Aptitude (UGC NET Paper I).pdfUnit 2- Research Aptitude (UGC NET Paper I).pdf
Unit 2- Research Aptitude (UGC NET Paper I).pdf
Thiyagu K
 
How to Create Map Views in the Odoo 17 ERP
How to Create Map Views in the Odoo 17 ERPHow to Create Map Views in the Odoo 17 ERP
How to Create Map Views in the Odoo 17 ERP
Celine George
 
The Art Pastor's Guide to Sabbath | Steve Thomason
The Art Pastor's Guide to Sabbath | Steve ThomasonThe Art Pastor's Guide to Sabbath | Steve Thomason
The Art Pastor's Guide to Sabbath | Steve Thomason
Steve Thomason
 
Palestine last event orientationfvgnh .pptx
Palestine last event orientationfvgnh .pptxPalestine last event orientationfvgnh .pptx
Palestine last event orientationfvgnh .pptx
RaedMohamed3
 
The Roman Empire A Historical Colossus.pdf
The Roman Empire A Historical Colossus.pdfThe Roman Empire A Historical Colossus.pdf
The Roman Empire A Historical Colossus.pdf
kaushalkr1407
 
Synthetic Fiber Construction in lab .pptx
Synthetic Fiber Construction in lab .pptxSynthetic Fiber Construction in lab .pptx
Synthetic Fiber Construction in lab .pptx
Pavel ( NSTU)
 
2024.06.01 Introducing a competency framework for languag learning materials ...
2024.06.01 Introducing a competency framework for languag learning materials ...2024.06.01 Introducing a competency framework for languag learning materials ...
2024.06.01 Introducing a competency framework for languag learning materials ...
Sandy Millin
 
Supporting (UKRI) OA monographs at Salford.pptx
Supporting (UKRI) OA monographs at Salford.pptxSupporting (UKRI) OA monographs at Salford.pptx
Supporting (UKRI) OA monographs at Salford.pptx
Jisc
 
How to Break the cycle of negative Thoughts
How to Break the cycle of negative ThoughtsHow to Break the cycle of negative Thoughts
How to Break the cycle of negative Thoughts
Col Mukteshwar Prasad
 
MARUTI SUZUKI- A Successful Joint Venture in India.pptx
MARUTI SUZUKI- A Successful Joint Venture in India.pptxMARUTI SUZUKI- A Successful Joint Venture in India.pptx
MARUTI SUZUKI- A Successful Joint Venture in India.pptx
bennyroshan06
 
Template Jadual Bertugas Kelas (Boleh Edit)
Template Jadual Bertugas Kelas (Boleh Edit)Template Jadual Bertugas Kelas (Boleh Edit)
Template Jadual Bertugas Kelas (Boleh Edit)
rosedainty
 
Language Across the Curriculm LAC B.Ed.
Language Across the  Curriculm LAC B.Ed.Language Across the  Curriculm LAC B.Ed.
Language Across the Curriculm LAC B.Ed.
Atul Kumar Singh
 
Mule 4.6 & Java 17 Upgrade | MuleSoft Mysore Meetup #46
Mule 4.6 & Java 17 Upgrade | MuleSoft Mysore Meetup #46Mule 4.6 & Java 17 Upgrade | MuleSoft Mysore Meetup #46
Mule 4.6 & Java 17 Upgrade | MuleSoft Mysore Meetup #46
MysoreMuleSoftMeetup
 
The approach at University of Liverpool.pptx
The approach at University of Liverpool.pptxThe approach at University of Liverpool.pptx
The approach at University of Liverpool.pptx
Jisc
 
Thesis Statement for students diagnonsed withADHD.ppt
Thesis Statement for students diagnonsed withADHD.pptThesis Statement for students diagnonsed withADHD.ppt
Thesis Statement for students diagnonsed withADHD.ppt
EverAndrsGuerraGuerr
 

Recently uploaded (20)

Introduction to Quality Improvement Essentials
Introduction to Quality Improvement EssentialsIntroduction to Quality Improvement Essentials
Introduction to Quality Improvement Essentials
 
1.4 modern child centered education - mahatma gandhi-2.pptx
1.4 modern child centered education - mahatma gandhi-2.pptx1.4 modern child centered education - mahatma gandhi-2.pptx
1.4 modern child centered education - mahatma gandhi-2.pptx
 
The geography of Taylor Swift - some ideas
The geography of Taylor Swift - some ideasThe geography of Taylor Swift - some ideas
The geography of Taylor Swift - some ideas
 
How to Make a Field invisible in Odoo 17
How to Make a Field invisible in Odoo 17How to Make a Field invisible in Odoo 17
How to Make a Field invisible in Odoo 17
 
Sectors of the Indian Economy - Class 10 Study Notes pdf
Sectors of the Indian Economy - Class 10 Study Notes pdfSectors of the Indian Economy - Class 10 Study Notes pdf
Sectors of the Indian Economy - Class 10 Study Notes pdf
 
Unit 2- Research Aptitude (UGC NET Paper I).pdf
Unit 2- Research Aptitude (UGC NET Paper I).pdfUnit 2- Research Aptitude (UGC NET Paper I).pdf
Unit 2- Research Aptitude (UGC NET Paper I).pdf
 
How to Create Map Views in the Odoo 17 ERP
How to Create Map Views in the Odoo 17 ERPHow to Create Map Views in the Odoo 17 ERP
How to Create Map Views in the Odoo 17 ERP
 
The Art Pastor's Guide to Sabbath | Steve Thomason
The Art Pastor's Guide to Sabbath | Steve ThomasonThe Art Pastor's Guide to Sabbath | Steve Thomason
The Art Pastor's Guide to Sabbath | Steve Thomason
 
Palestine last event orientationfvgnh .pptx
Palestine last event orientationfvgnh .pptxPalestine last event orientationfvgnh .pptx
Palestine last event orientationfvgnh .pptx
 
The Roman Empire A Historical Colossus.pdf
The Roman Empire A Historical Colossus.pdfThe Roman Empire A Historical Colossus.pdf
The Roman Empire A Historical Colossus.pdf
 
Synthetic Fiber Construction in lab .pptx
Synthetic Fiber Construction in lab .pptxSynthetic Fiber Construction in lab .pptx
Synthetic Fiber Construction in lab .pptx
 
2024.06.01 Introducing a competency framework for languag learning materials ...
2024.06.01 Introducing a competency framework for languag learning materials ...2024.06.01 Introducing a competency framework for languag learning materials ...
2024.06.01 Introducing a competency framework for languag learning materials ...
 
Supporting (UKRI) OA monographs at Salford.pptx
Supporting (UKRI) OA monographs at Salford.pptxSupporting (UKRI) OA monographs at Salford.pptx
Supporting (UKRI) OA monographs at Salford.pptx
 
How to Break the cycle of negative Thoughts
How to Break the cycle of negative ThoughtsHow to Break the cycle of negative Thoughts
How to Break the cycle of negative Thoughts
 
MARUTI SUZUKI- A Successful Joint Venture in India.pptx
MARUTI SUZUKI- A Successful Joint Venture in India.pptxMARUTI SUZUKI- A Successful Joint Venture in India.pptx
MARUTI SUZUKI- A Successful Joint Venture in India.pptx
 
Template Jadual Bertugas Kelas (Boleh Edit)
Template Jadual Bertugas Kelas (Boleh Edit)Template Jadual Bertugas Kelas (Boleh Edit)
Template Jadual Bertugas Kelas (Boleh Edit)
 
Language Across the Curriculm LAC B.Ed.
Language Across the  Curriculm LAC B.Ed.Language Across the  Curriculm LAC B.Ed.
Language Across the Curriculm LAC B.Ed.
 
Mule 4.6 & Java 17 Upgrade | MuleSoft Mysore Meetup #46
Mule 4.6 & Java 17 Upgrade | MuleSoft Mysore Meetup #46Mule 4.6 & Java 17 Upgrade | MuleSoft Mysore Meetup #46
Mule 4.6 & Java 17 Upgrade | MuleSoft Mysore Meetup #46
 
The approach at University of Liverpool.pptx
The approach at University of Liverpool.pptxThe approach at University of Liverpool.pptx
The approach at University of Liverpool.pptx
 
Thesis Statement for students diagnonsed withADHD.ppt
Thesis Statement for students diagnonsed withADHD.pptThesis Statement for students diagnonsed withADHD.ppt
Thesis Statement for students diagnonsed withADHD.ppt
 

PR2-Q2-Module-1 (1).pdf

  • 1. 12 Practical Research 2 Quarter 2 – Module 1 Research Design and Sampling Procedure
  • 2. ii Practical Research 2 – Grade 12 Alternative Delivery Mode Quarter 2 – Module 1 Research Design and Sampling Procedure First Edition, 2020 Republic Act 8293, Section 176 states that: No copyright shall subsist in any work of the Government of the Philippines. However, prior approval of the government agency or office wherein the work is created shall be necessary for exploitation of such work for profit. Such agency or office may, among other things, impose as a condition the payment of royalties. Borrowed materials (i.e., songs, stories, poems, pictures, photos, brand names, trademarks, etc.) included in this book are owned by their respective copyright holders. Every effort has been exerted to locate and seek permission to use these materials from their respective copyright owners. The publisher and authors do not represent nor claim ownership over them. Published by the Department of Education Secretary: Leonor Magtolis Briones Undersecretary: Diosdado M. San Antonio Development Team of the Module Writers: Stalin S. Baja Cecille P. Buco Editors: Arcadio J. Malmis PhD Principal III Cristina N. Apale PhD Principal II Elvira I. Jabonillo PhD Principal I Management Team: Bianito A. Dagatan EdD, CESO V Schools Division Superintendent Casiana P. Caberte PhD Assistant Schools Division Superintendent Felix C. Galacio Jr. PhD EPS, Mathematics Josephine D. Eronico PhD EPS, LRMDS Printed in the Philippines by Schools Division of Bohol Department of Education – Region VII, Central Visayas Office Address: 0050 Lino Chatto Drive Barangay Cogon, Tagbilaran City, Bohol Telefax: (038) 501 – 7550 Tel Nos. (038) 412 – 4938; (038) 411-2544; (038) 501 – 7550 E-mail Address: depedbohol@deped.gov.ph
  • 3. Learning Competencies: 1. choose appropriate quantitative research design (CS_RS12-IIa-c-1) 2. describe sampling procedure and the sample (CS_RS12-IIa-c-1) At the end of the lesson, you are expected to:  define quantitative research design  choose appropriate quantitative research design  define what is population and sample  describe the different approaches in identifying the sample size  choose appropriate sampling method What is it Meaning of Quantitative Research Designs When a man decides to build a house, he draw first the blue print before he will start to do the work. Same with the conduct of research, the blueprint for the collection, measurement, and data analysis is drawn as a pattern to follow. Furthermore, research designs enable the researcher to obtain a more valid, objective, reliable, and accurate answers to the research questions. Research design is defined as the logical and coherent overall strategy that the researcher uses to integrate all the components of the research study (Barrot, 2017, p 102). In order to find meaning in the overall process of doing your research study, a step-by-step process will be helpful to you. In quantitative research, you are going to have a great deal of abstraction and numerical analysis. According to Fraenkel and Wallen (2007, p 15), the research designs in quantitative research are mostly pre-established. Hence having an appropriate research design in quantitative research, the researcher will have a clearer comprehension of what he is trying to analyze and interpret. Types of Quantitative Research Design Quantitative Research Designs have five general classifications: descriptive, correlational, ex post facto, quasi-experimental, and experimental. Descriptive Research. When little is known about the research problem, then it is appropriate to use descriptive research design. It is a design that is exploratory in nature. The purpose of descriptive research is basically to answer questions such as who, what, where, when, and how much. So this design is best used when the main objective of the study is just to observe and report a certain phenomenon as it is happening. Correlational Research. The main goal of this design is to determine if variable increases or decreases as another variable increases or decreases. This design seeks to establish an association between variables. It does not seek cause and effect relationship like descriptive research; it measures variables as it occurs. It has two major purposes: (a) to clarify the relationship between variables and (b) predict the magnitude of the association. However, the extent of the purpose of correlational research depends on the scope and delimitation of the study. Ex Post Facto. If the objective of the study is to measure a cause from a pre-existing effects, then Ex Post Facto research design is more appropriate to use. In this design, the researcher has no control over the variables in the research study. Thus, one cannot conclude that the changes measured happen during the actual conduct of the study. The last two types of quantitative research designs are identifiable for the existence of treatment or intervention applied to the current research study. Intervention or treatment pertains to controlling or Lesson 1: Quantitative Research Design
  • 4. 2 manipulating the independent variable in an experiment. It is assumed that the changes in dependent variables were caused by the independent variable. There are also two groups of subjects, participants, or respondents in quasi-experimental and experimental research. The treatment group refers to the group subjected to treatment or intervention. The group not subject to treatment or intervention is called the control group. Quasi-Experimental. The term means partly, partially, or almost – pronounced as kwahz-eye. This research design aims to measure the causal relationship between variables. The effect measured is considered to have occurred during the conduct of the current study. The partiality of quasi-experimental design comes from assigning subjects, participants, or respondents into their groups. The groups are known to be already established before the study, such as age educational background and nationality. Since the assignment of subjects, participants, or respondents are not randomly assigned into an experimental or control groups, the conclusion of results is limited. Experimental Research. This research design is based on the scientific method called experiment with a procedure of gathering data under a controlled or manipulated environment. It is also known as true experimental design since it applies treatment and manipulation more extensively compared to quasi- experimental design. Random assignment of subjects or participants into treatment and control group is done increasing the validity of the study. Experimental research, therefore, attempts to affect a certain variable by directly manipulating the independent variable. What’s More Direction: Write your answers on the space provided. ________________________1. This design seeks to establish an association between variables. ________________________2. It is also known as true experimental design since it applies treatment and manipulation more extensively compared to quasi-experimental design. ________________________3. It pertains to controlling or manipulating the independent variable in an experiment ________________________4. It is defined as the logical and coherent overall strategy that the researcher uses to integrate all the components of the research study What is it Population and Sample The first step in determining the sample size is identifying the population of the topic of interest. The population is the totality of all the objects, elements, persons, and characteristics under consideration. It is understood that this population possesses common characteristics about which the research aims to explore. There are two types of population: target population and accessible population. The actual population is the target population, for example, all Senior High School Students enrolled in Science, Technology, Engineering, and Mathematics (STEM) in the Division of Cagayan de Oro City. While the accessible population is the portion of the population in which the researcher has reasonable access, for example all Senior High School enrolled, STEM strand at Marayon Science High School – X. When the whole population is too costly or time-consuming or impractical to consider, then, a sample representative is identified. Sampling pertains to the systematic process of selecting the group to Lesson 2: Sampling Procedure and the Sample
  • 5. 3 be analyzed in the research study. The goal is to get information from a group that represents the target population. Once a good sample is obtained, the generalizability and applicability of findings increases. The representative subset of the population refers to the sample. All the 240 Senior High School Students enrolled in Science, Technology, Engineering, and Mathematics (STEM) Strand in a school, for example, constitute the population; 60 of those students constitute the sample. A good sample should have characteristics of the represented population – characteristics that are within the scope of the study with fair accuracy. Generally, the larger the sample, the more reliable the sample be, but still, it will depend on the scope and delimitation and research design of the study. Approaches in Identifying the Sample Size Heuristics. This approach refers to the rule of the thumb for sample size. The early established approach by Gay (1976) stated by Cristobal and Dela Cruz-Cristobal (2017, p 172), sample sizes for different research designs are the following: Research Design Number of Subjects/Participants Descriptive Research 10% to 20% maybe required Comparative Research 15 subjects or groups Lunenberg and Irby (2008), as cited by Barrot (2017, p 107), also suggested different sample sizes for each quantitative research design. Research Design Number of Subjects/Participants Survey 800 Correlational 100 to 200 Ex post facto 30+ Experimental 30 or more Literature Review. Another approach is by reading similar or related literature and studies to your current research study. Since you are done writing your review of related literature and studies, you might want to recall how these studies determine sample size. Using this approach increases the validity of your sampling procedure. Formula. Formula are also being established for the computation of an acceptable sample size. The common formula is Slovin’s Formula. Slovin’s Formula: 𝒏 = 𝑵 (𝟏 + 𝑵𝒆𝟐) where: n = sample size N = total population size e = desired margin of error (should be in a decimal form) 𝒏 = 𝟏𝟔𝟖 (𝟏 + 𝟏𝟔𝟖 ∗ 𝟎. 𝟎𝟓𝟐) 𝒏 = 𝟏𝟔𝟖 (𝟏 + 𝟏𝟔𝟖 ∗ 𝟎. 𝟎𝟎𝟐𝟓) 𝒏 = 𝟏𝟔𝟖 (𝟏 + 𝟎. 𝟒𝟐) 𝒏 = 𝟏𝟔𝟖 𝟏. 𝟒𝟐 𝒏 = 𝟏𝟏𝟖 Power Analysis. This approach is founded on the principle of power analysis. There are two principles you need to consider if you are going to use this approach: these are statistical power and effect size.
  • 6. 4 The probability of rejecting the null hypothesis is called statistical power. It suggests that indeed there is a relationship between the independent and dependent variables of the research study. The ideal statistical power of a research study is 80%. With the statistical power, it will be used to identify the sufficient sample size for measuring the effect size of a certain treatment. The level of difference between the experimental group and the control group refers to effect size. If the statistical power tells that relationship between independent and dependent variables, the effect size suggests the extent of the relationship between these two variables. Henceforth, the higher the effect size, means the greater the level difference between the experimental and control groups. For example, your research study reveals that there is a difference in the pretest and posttest scores of the students in the given anxiety test after implementing a psychosocial intervention. With the effect size, you will have an idea of how small or large the difference is. What’s More Direction: Write your answers on the space provided. ________________________1. This formula is being used for the computation of an acceptable sample size. ________________________2. This approach uses studies or related literatures to your present student which increases the validity of your sampling procedure ________________________3. What will be the computed sample size given these following data: N=200, and margin of error = 10%? Show your solution. ________________________4. This approach in identifying the sample size refers to the rule of the thumb. What is it Simple Random Sampling. It is a way of choosing individuals in which all members of the accessible population are given an equal chance to be selected. There are various ways of obtaining samples through simple random sampling. These are fish bowl technique, roulette wheel, or use of the table of random numbers. This technique is also readily available online. Visit this link https://www.randomizer.org/ to practice. Stratified Random Sampling. The same with simple random sampling, stratified random sampling also gives an equal chance to all members of the population to be chosen. However, the population is first divided into strata or groups before selecting the samples. The samples are chosen from these subgroups and not directly from the entire population. This procedure is best used when the variables of the study are also grouped into classes such as gender and grade level. You can simply follow the steps from this given example: A population of 600 Junior High School students include 180 Grade 7, 160 Grade 8, 150 Grade 9, and 110 Grade 10. If the computed sample size is 240, the following proportionate sampling will be as follows. The number of members per subgroup is divided by the total accessible sample size. The percentage result of members per subgroup will be multiplied from the computed total sample size. After obtaining the sample size per strata, then simple random sampling will be done for the selection of samples from each group. Lesson 3: Probability Sampling in Quantitative Research
  • 7. 5 Sample Size per Subgroups 180/600 = .30x 240 = 72 Grade 7 students 160/600 = .27x 240 = 65 Grade 8 students 150/600 = .25x 240 = 60 Grade 9 students 110/600 = .18x 240 = 43 Grade 10 students 100% 240 respondents Cluster Sampling. This procedure is usually applied in large-scale studies, geographical spread out of the population is a challenge, and gathering information will be very time-consuming. Similar to stratified random sampling, cluster sampling also involves grouping of the population according to subgroups or clusters. It is a method where multiple clusters of people from the chosen population will be created by the researcher in order to have homogenous characteristics. For example, a researcher would like to interview of all public senior high school students across Mindanao. As a researcher cluster will be selected to satisfy the plan size. In the given example, the first cluster can be by region, the second cluster can be by division, and the third cluster can be by district. Another way of doing cluster sampling is illustrated on the figure on the right side. Systematic Sampling. This procedure is as simple as selecting samples every nth (example every 2nd , 5th ) of the chosen population until arriving at a desired total number of sample size. Therefore, the selection is based on a predetermined interval. Dividing the population size by the sample size, the interval will be obtained. For example, from a total population of 75, you have 25 samples; using systematic sampling, you will decide to select every 3rd person on the list of individuals. What’s More Directions: What type of observation is illustrated in the following observation notes? Write the letter of your choice on the space provided before the number. Choose from the choices below: __________________1. The population is first divided into strata or groups before selecting the samples __________________2. Selecting samples every nth (example every 4th, 7th) of the chosen population until arriving at a desired total number of sample size __________________3. Fish bowl technique is an example of what sampling method? __________________4. It is a method where multiple clusters of people from the chosen population will be created by the researcher in order to have homogenous characteristics. Assessment Multiple Choice. Answer the question that follows. Choose the correct answer from among the given choices. 1. What is the aim of Ex post facto research design? A. determine a cause from already existing effects. B. establish cause and effect relationship C. observe and describe a phenomenon D. identify association among variables 2. “Effects of Type of Music to Aesthetic Performance of Ballet Dancers”, what is the appropriate research design for the given title? A. Correlational C. Survey Research B. Descriptive D. Experimental
  • 8. 6 3. Mr. Canuc would like to know further the type of social media used between the male and female SHS students of East Pagat National High School. What is the appropriate research design to be used in his study? A. Quasi-Experimental C. Correlational B. Experimental D. Descriptive 4. Which of the following statements is true about the conduct of experimental research? A. There is no random assignment of individuals. B. Individual subjects are randomly assigned. C. Groups are exposed to presumed cause. D. Intact groups are used. 5. What is the difference between quasi-experimental research and experimental research? A. Only one dependent variable is used in quasi-experimental research, while multiple dependent variables can be used in quasi-experimental research. B. Intact groups are used in experimental, while quasi-experimental randomly assigned individuals into groups. C. Participants for groups are randomly selected in experimental, but not quasi-experimental research. D. The researcher controls the intervention in the experimental group, but not quasi- experimental research. 6. Why would a researcher choose to use Simple Random Sampling as a sampling technique? A. To consider giving equal chance to the member of accessible population being selected as part of the study. B. To make sure that all subcategories of the population are represented in the selection of sample. C. To group the entire population into clusters since the location of the samples are widely spread. D. To systematically choose samples from a given list of individuals. 7. When can we consider a research sample as "best?" A. representative of population C. conveniently represented B. systematically chosen D. purposively selected 8. Given that your study will use stratified random sampling, wherein population of your scope is 250 with a computed sample size of 152, how many samples for each strata will you have if group 1 has 92, group 2 has 86, and group 3 has 72 population? A. Group 1 = 52, Group 2 = 54, Group 3 = 46 B. Group 1 = 56, Group 2 = 45, Group 3 = 51 C. Group 1 = 52, Group 2 = 52, Group 3 = 44 D. Group 1 = 54, Group 2 = 56, Group 3 = 41 9. What sampling technique is used when the researcher would like to consider giving an equal chance to the member of the accessible population being selected as part of the study? A. Simple Random Sampling C. Systematic Sampling B. Stratified Sampling D. Cluster Sampling 10.What is the main objective of using stratified random sampling? A. sample was chosen proportionately drawn from the different categories of the population B. sample is taken from an accessible population than the target population C. every individual will be given an equal chance to be selected D. those who will possibly respond to treatment are chosen
  • 9. 7 Answer Sheet Name: ____________________________________________________________________ Grade & Section: ________________ Score: ______________ PRACTICAL RESEARCH 2 Quarter 2 – Module 1 Lesson 1: What’s More 1) 2) 3) 4) Lesson 2: What’s More 1) 2) 3) 4) Lesson 3: What’s More 1) 2) 3) 4) Assessment 1) 2) 3) 4) 5) 6) 7) 8) 9) 10) But he said to me, “My grace is sufficient for you, for my power is made perfect in weakness.” Therefore, I will boast all the more gladly about my weaknesses, so that Christ’s power may rest on me. 2 Corinthians 12:9 Congratulations! You made it! 😊 Keep it up!
  • 10. 8 Key Answer References Baraceros, E. L. (2016). Practical Research 2. Sampaloc, Manila: Rex Bookstore, Inc. Barrot, J. S. (2017). Practical Research 2 for Senior High School. Quezon City, Philippines: C & E Publishing, Inc. Center for Quality Research. (2015). "Overview of Quantitative Research Methods." YouTube. Accessed June 3, 2020. https://bit.ly/36A5idj Creswell, J. W. (2009). Research Design: Qualitative, Quantitative, and Mixed Methods Approaches. 3rd ed., SAGE Publications, Inc. https://bit.ly/2X3Bra3 Cristobal, A. and De La Cruz-Cristobal, M. (2017). Practical Research 1. Quezon City, Philippines: C & E Publishing, Inc. Fraenkel, J. R. and Wallen, N. E. (2006). How to Design and Evaluate Research in Education. Asia: Mc- Graw Hill Companies, Inc. Fraenkel, J. R. and Wallen, N. E. (2020). How to Design and Evaluate Research in Education. 6th ed., McGraw-Hill Global Education Holdings, LLC. Accessed June 3, 2020. https://bit.ly/3eBIVrs I Hope. (2020). "Kinds of Quantitative Research Designs." YouTube. Accessed June 3, 2020. https://bit.ly/2LZVLCS Keyton, J. (2020). "Chapter 7: Multiple Choice Quiz." McGraw-Hill Global Education Holdings, LLC. Accessed June 3, 2020. https://bit.ly/3eojlWk Quarter 2 - Module 1 Lesson 1 What’s More 1. Correlational 2. Experimental 3. Intervention 4. Research Design Lesson 2 What’s More 1. Slovin’s Formula 2. Literature Review 3. 66.666 or 67 4. Heuristics Lesson 3 Assessment What’s More 1. A 6. C 1. Stratified Random Sampling 2. D 7. A 2. Systematics Sampling 3. C 8. A 3. Simple Random Sampling 4. B 9. A 4. Cluster Sampling 5. C 10. A