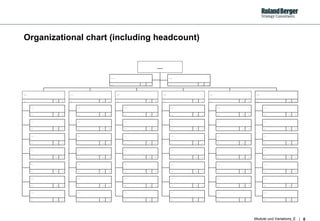
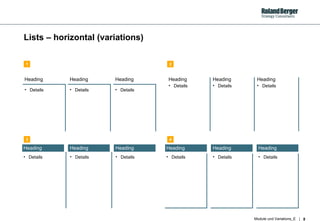
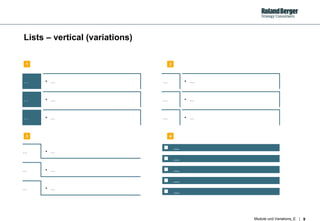
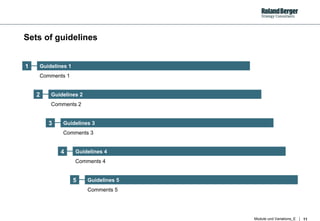
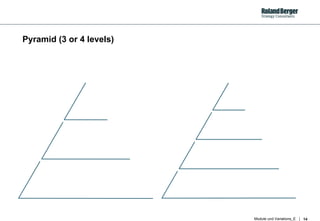
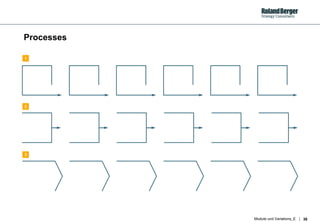
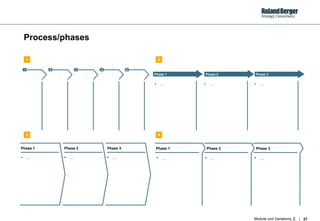
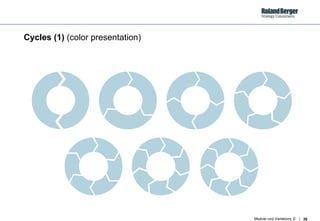
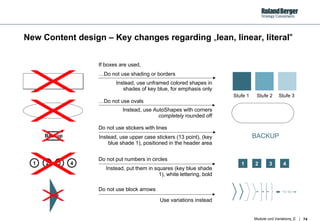
Modules and variations  New graphics guidelines Design proposals Roland Berger  Hamburg, November 2001
Contents Page A. Standard slides 3 B. Lists (1)  – Factors, no specific number 7 C. Lists (2)  – Factors, specific number 13 D. Matrix  – Factors, comparisons 24 E. Process (1)  – Factors, steps 35 F. Process (2)  – Factors, impact 49 G. Process (3)  – Factors, interlinked 67 Annex:  Nine key changes compared to the  old  standards 73
A.  Standard slides
Methodological competence Key projects Industry competence Professional experience Languages Education Consultant profile: [first name, last name] xxxx-xxxx xxxxxxxxxxxxxxxxxxxxxxxxxxx Position: xxxxxxxxxxxxxxxxxxxxxxxx German xxxxxxxxxxxxxxxxxxxxxxxxxxxxxxxxxxxx xxxx-xxxx xxxxxxxxxxxxxxxxxxxxxxxxxxx Born: xxxx xxxxxxxxxxxxxxxxxxxxxxxxxxxxxxxxxxxx xxxxxxxxxxxxxxxxxxxxxxxxxxxxxxxxxxxxx xxxxxxxxxxxxxxxxxxxxxxxxxxxxxxxxxxxxx Nationality: xxxxxxxxxxxxxxxxxxxxx Updated: mm/year
Organizational chart
Organizational chart (including headcount) ... ... ... ... ... ... ... … ... ... ... … ... ... ... … ... ... ... … ... ... ... … ... ... ... … ... ... ... … ... ... ... ... ... ... ... … ... ... ... … ... ... ... … ... ... ... … ... ... ... … ... ... ... … ... ... ... … ... ... ... ... ... ... ... … ... ... ... … ... ... ... … ... ... ... … ... ... ... … ... ... ... … ... ... ... … ... ... ... ... ... ... ... … ... ... ... … ... ... ... … ... ... ... … ... ... ... … ... ... ... … ... ... ... … ... ... ... ... ... ... ... … ... ... ... … ... ... ... … ... ... ... … ... ... ... … ... ... ... … ... ... ... … ... ... ... ... ... ... ... … ... ... ... … ... ... ... … ... ... ... … ... ... ... … ... ... ... … ... ... ... … ... ... ... ... ... ... ... ... ....
B.  Lists (1) – Factors, no specific number
Lists – horizontal (variations) Heading Details Heading Details Heading Details Heading Details Heading Details Heading Details Heading Details Heading Details Heading Details Heading Details Heading Details Heading Details 1 2 3 4
Lists – vertical (variations) … … … … … … … … … … … … … … … … … … .... .... .... .... .... 1 2 3 4
Schedule 1 2 3 4 5 6 7 8 9 10 11 12 Month 1 Month 2 Month 3 Activities A. B. C. 1 2 3 4 5 6 7 8 9 10 11 12 Month 1 Month 2 Month 3 Activities A. B. C. 1 2
Sets of guidelines 2 3 4 5 Guidelines 1 Guidelines 2 Guidelines 3 Guidelines 4 Guidelines 5 Comments 1 Comments 2 Comments 3 Comments 4 Comments 5 1
 
C. Lists (2) – Factors, specific number
Pyramid (3 or 4 levels)
Pyramid (5 levels/centered)
3 factors (interwoven) .... .... .... 1 2 3
Common ground
4 factors (1)
4 factors (2)
4 factors (3) 1 2 3 4 Factor 1 Factor 2 Factor 3 Factor 4
4 factors (3a –  weighted ) 2 3 4 Factor 1 Factor 2 Factor 3 Factor 4
4 factors (3b – dynamic) 1 2 3 4 Factor 1 Factor 2 Factor 3 Factor 4 Four  dynamic factors
6 factors (variation)
D. Matrix –  Factors, comparisons
Matrix/table  (Horizontal/vertical comparison of data – variations) 1 2 3 4
Special types of matrix – opportunities/threats …  Opportunities …  Threats …  Opportunities …  Threats …  Opportunities …  Threats Opportunities Threats …  …  1 2 3 4
Special types of matrix – pros and cons …  …  …  …  …  …  1 2 3
Special types of matrix – controversy 1 2 3 4
Special types of matrix – conflict/tension (1)
Special types of matrix – conflict/tension (2)
Special types of matrix – bottom up/top down (1) BOTTOM UP TOP DOWN ... ...
Special types of matrix – bottom up/top down (2) ... ... BOTTOM UP TOP DOWN 1 2
Special types of matrix – equilibrium …  …
Special types of matrix – imbalance …  …
E. Process (1) – Factors ,  steps
Processes 1 2 3
Process/phases 1 2 3 4 5 … … … … … Phase 1 Phase 2 Phase 3 …  …  …  Phase 1 Phase 2 Phase 3 …  …  …  Phase 1 Phase 2 Phase 3 …  …  …  1 2 3 4
Cycles (1)  (color presentation)
Cycles (2)
Spirals (orthogonal) 1 2
Hurdles
Resistance/obstacles 1 2 5 7 3 4 6
Filters 1 2 4 5 3 6
Change of mindset/direction 1 2 3 4
Node s /interfaces 1 4 3 7 5 6 8 9 2
Pressure 1 2
Increase/decrease 1 2 3 4 5 6 7 8
Various types of brackets (to be use d  instead of block arrows) 1 2 3 4 5 6 7 8 9 10 11
F. Process 2 – Factors ,  impact
Consequences (1) ... …  ... …  ... …  ... …  ... …  ... …
Consequences (1a) ... …  ... …  ... …  ... …  ... …  ... …
Consequences (2) … … … … … … … … … …
Consequences (3) ... … ... ... … ...
Consequences (4) ... … ... … ... … ... … 1 2
Impact (3 factors) QUALITY TIME COST
Impact (4 and 6 factors)
Impact (4 factors) Factor 3 Factor 2 Factor 4 Factor 1 Generic description of the 4 factors
Impact (5 factors) Factor 3 Factor 2 Factor 4 Factor 5 Generic description of the 5 factors Factor 1
Impact (6 factors) Factor 2 Generic description of the 6 factors Factor 3 Factor 1 Factor 5 Factor 4 Factor 6
Impact (7 factors) Factor 3 Generic description of the 7 factors Factor 2 Factor 6 Factor 4 Factor 5 Factor 7 Factor 1
Impact (8 factors) Factor 3 Generic description of the 8 factors Factor 2 Factor 6 Factor 7 Factor 4 Factor 5 Factor 1 Factor 8
Impact and result (1) 6 success factors …
Impact and result (2) 5 success factors …
Vision Vision
Action/reaction … … … … … … …
Value chain Customer Supplier Development Production Sales Distribution Company
G. Process 3 – Factors, interlinked
Action/reaction (1)
Action/reaction (2)  (transparent – color presentation)
Interaction 1 2 3
Jigsaw puzzle
Spiral
Annex:  Nine key changes compared to the  old  standards
New Content design – Key changes regarding  „ lean,  linear, literal " Do not use block arrows Use variations instead 1 2 3 4 1 2 3 4 BACKUP … Do not use shading or borders Instead, use unframed colored shapes in shades of key blue, for emphasis only … Do not use ovals Instead, use AutoShapes with corners  completely  rounded off Do not use stickers with lines Instead, use upper case stickers (13 point), (key blue shade 1), positioned in the header area Do not put numbers in circles Instead, put them in squares (key blue shade 1), white lettering, bold If boxes are used, Backup Stufe 1 Stufe 2 Stufe 3
New Content design – Key changes regarding  „ lean,  linear, literal " Do not position text behind graphics Position text to the side of graphics instead Arrow function can be switched on and off/ positioned to  the side  Text is easy to read if not positioned  behind graphics Do not use speech bubbles Instead, use AutoShapes/callouts/third row (you can use the arrow function!) Do not use big multicolored cartoons/ Clip Art Instead, use pictograms (if not available: convert Clip Art to linear monochrome versions) Do not use miniature charts as navigators Instead, use mathematical navigators (key blue shade 1), white lettering, bold, 13 point  1 2 3 4 There are obvious disadvantages to positioning text behind graphics 4

如何制作ppt——(罗兰贝格ppt图表汇总)

  • 1.
    Modules and variations New graphics guidelines Design proposals Roland Berger Hamburg, November 2001
  • 2.
    Contents Page A.Standard slides 3 B. Lists (1) – Factors, no specific number 7 C. Lists (2) – Factors, specific number 13 D. Matrix – Factors, comparisons 24 E. Process (1) – Factors, steps 35 F. Process (2) – Factors, impact 49 G. Process (3) – Factors, interlinked 67 Annex: Nine key changes compared to the old standards 73
  • 3.
  • 4.
    Methodological competence Keyprojects Industry competence Professional experience Languages Education Consultant profile: [first name, last name] xxxx-xxxx xxxxxxxxxxxxxxxxxxxxxxxxxxx Position: xxxxxxxxxxxxxxxxxxxxxxxx German xxxxxxxxxxxxxxxxxxxxxxxxxxxxxxxxxxxx xxxx-xxxx xxxxxxxxxxxxxxxxxxxxxxxxxxx Born: xxxx xxxxxxxxxxxxxxxxxxxxxxxxxxxxxxxxxxxx xxxxxxxxxxxxxxxxxxxxxxxxxxxxxxxxxxxxx xxxxxxxxxxxxxxxxxxxxxxxxxxxxxxxxxxxxx Nationality: xxxxxxxxxxxxxxxxxxxxx Updated: mm/year
  • 5.
  • 6.
    Organizational chart (includingheadcount) ... ... ... ... ... ... ... … ... ... ... … ... ... ... … ... ... ... … ... ... ... … ... ... ... … ... ... ... … ... ... ... ... ... ... ... … ... ... ... … ... ... ... … ... ... ... … ... ... ... … ... ... ... … ... ... ... … ... ... ... ... ... ... ... … ... ... ... … ... ... ... … ... ... ... … ... ... ... … ... ... ... … ... ... ... … ... ... ... ... ... ... ... … ... ... ... … ... ... ... … ... ... ... … ... ... ... … ... ... ... … ... ... ... … ... ... ... ... ... ... ... … ... ... ... … ... ... ... … ... ... ... … ... ... ... … ... ... ... … ... ... ... … ... ... ... ... ... ... ... … ... ... ... … ... ... ... … ... ... ... … ... ... ... … ... ... ... … ... ... ... … ... ... ... ... ... ... ... ... ....
  • 7.
    B. Lists(1) – Factors, no specific number
  • 8.
    Lists – horizontal(variations) Heading Details Heading Details Heading Details Heading Details Heading Details Heading Details Heading Details Heading Details Heading Details Heading Details Heading Details Heading Details 1 2 3 4
  • 9.
    Lists – vertical(variations) … … … … … … … … … … … … … … … … … … .... .... .... .... .... 1 2 3 4
  • 10.
    Schedule 1 23 4 5 6 7 8 9 10 11 12 Month 1 Month 2 Month 3 Activities A. B. C. 1 2 3 4 5 6 7 8 9 10 11 12 Month 1 Month 2 Month 3 Activities A. B. C. 1 2
  • 11.
    Sets of guidelines2 3 4 5 Guidelines 1 Guidelines 2 Guidelines 3 Guidelines 4 Guidelines 5 Comments 1 Comments 2 Comments 3 Comments 4 Comments 5 1
  • 12.
  • 13.
    C. Lists (2)– Factors, specific number
  • 14.
    Pyramid (3 or4 levels)
  • 15.
  • 16.
    3 factors (interwoven).... .... .... 1 2 3
  • 17.
  • 18.
  • 19.
  • 20.
    4 factors (3)1 2 3 4 Factor 1 Factor 2 Factor 3 Factor 4
  • 21.
    4 factors (3a– weighted ) 2 3 4 Factor 1 Factor 2 Factor 3 Factor 4
  • 22.
    4 factors (3b– dynamic) 1 2 3 4 Factor 1 Factor 2 Factor 3 Factor 4 Four dynamic factors
  • 23.
  • 24.
    D. Matrix – Factors, comparisons
  • 25.
    Matrix/table (Horizontal/verticalcomparison of data – variations) 1 2 3 4
  • 26.
    Special types ofmatrix – opportunities/threats … Opportunities … Threats … Opportunities … Threats … Opportunities … Threats Opportunities Threats … … 1 2 3 4
  • 27.
    Special types ofmatrix – pros and cons … … … … … … 1 2 3
  • 28.
    Special types ofmatrix – controversy 1 2 3 4
  • 29.
    Special types ofmatrix – conflict/tension (1)
  • 30.
    Special types ofmatrix – conflict/tension (2)
  • 31.
    Special types ofmatrix – bottom up/top down (1) BOTTOM UP TOP DOWN ... ...
  • 32.
    Special types ofmatrix – bottom up/top down (2) ... ... BOTTOM UP TOP DOWN 1 2
  • 33.
    Special types ofmatrix – equilibrium … …
  • 34.
    Special types ofmatrix – imbalance … …
  • 35.
    E. Process (1)– Factors , steps
  • 36.
  • 37.
    Process/phases 1 23 4 5 … … … … … Phase 1 Phase 2 Phase 3 … … … Phase 1 Phase 2 Phase 3 … … … Phase 1 Phase 2 Phase 3 … … … 1 2 3 4
  • 38.
    Cycles (1) (color presentation)
  • 39.
  • 40.
  • 41.
  • 42.
  • 43.
    Filters 1 24 5 3 6
  • 44.
  • 45.
    Node s /interfaces1 4 3 7 5 6 8 9 2
  • 46.
  • 47.
  • 48.
    Various types ofbrackets (to be use d instead of block arrows) 1 2 3 4 5 6 7 8 9 10 11
  • 49.
    F. Process 2– Factors , impact
  • 50.
    Consequences (1) ...… ... … ... … ... … ... … ... …
  • 51.
    Consequences (1a) ...… ... … ... … ... … ... … ... …
  • 52.
    Consequences (2) …… … … … … … … … …
  • 53.
    Consequences (3) ...… ... ... … ...
  • 54.
    Consequences (4) ...… ... … ... … ... … 1 2
  • 55.
    Impact (3 factors)QUALITY TIME COST
  • 56.
    Impact (4 and6 factors)
  • 57.
    Impact (4 factors)Factor 3 Factor 2 Factor 4 Factor 1 Generic description of the 4 factors
  • 58.
    Impact (5 factors)Factor 3 Factor 2 Factor 4 Factor 5 Generic description of the 5 factors Factor 1
  • 59.
    Impact (6 factors)Factor 2 Generic description of the 6 factors Factor 3 Factor 1 Factor 5 Factor 4 Factor 6
  • 60.
    Impact (7 factors)Factor 3 Generic description of the 7 factors Factor 2 Factor 6 Factor 4 Factor 5 Factor 7 Factor 1
  • 61.
    Impact (8 factors)Factor 3 Generic description of the 8 factors Factor 2 Factor 6 Factor 7 Factor 4 Factor 5 Factor 1 Factor 8
  • 62.
    Impact and result(1) 6 success factors …
  • 63.
    Impact and result(2) 5 success factors …
  • 64.
  • 65.
    Action/reaction … …… … … … …
  • 66.
    Value chain CustomerSupplier Development Production Sales Distribution Company
  • 67.
    G. Process 3– Factors, interlinked
  • 68.
  • 69.
    Action/reaction (2) (transparent – color presentation)
  • 70.
  • 71.
  • 72.
  • 73.
    Annex: Ninekey changes compared to the old standards
  • 74.
    New Content design– Key changes regarding „ lean, linear, literal " Do not use block arrows Use variations instead 1 2 3 4 1 2 3 4 BACKUP … Do not use shading or borders Instead, use unframed colored shapes in shades of key blue, for emphasis only … Do not use ovals Instead, use AutoShapes with corners completely rounded off Do not use stickers with lines Instead, use upper case stickers (13 point), (key blue shade 1), positioned in the header area Do not put numbers in circles Instead, put them in squares (key blue shade 1), white lettering, bold If boxes are used, Backup Stufe 1 Stufe 2 Stufe 3
  • 75.
    New Content design– Key changes regarding „ lean, linear, literal " Do not position text behind graphics Position text to the side of graphics instead Arrow function can be switched on and off/ positioned to the side Text is easy to read if not positioned behind graphics Do not use speech bubbles Instead, use AutoShapes/callouts/third row (you can use the arrow function!) Do not use big multicolored cartoons/ Clip Art Instead, use pictograms (if not available: convert Clip Art to linear monochrome versions) Do not use miniature charts as navigators Instead, use mathematical navigators (key blue shade 1), white lettering, bold, 13 point 1 2 3 4 There are obvious disadvantages to positioning text behind graphics 4