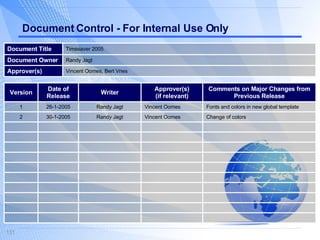
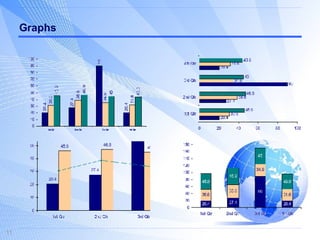
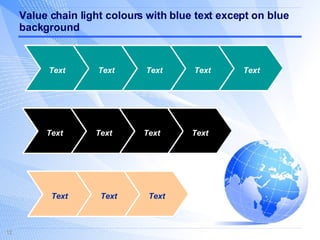
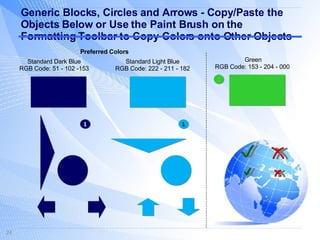
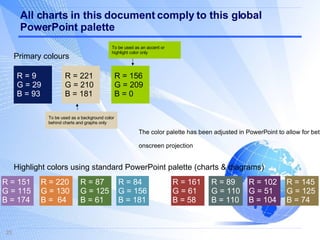
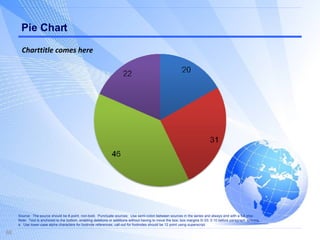
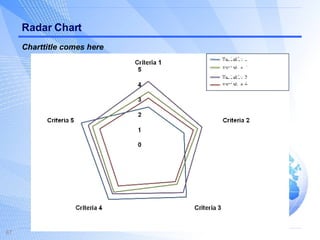
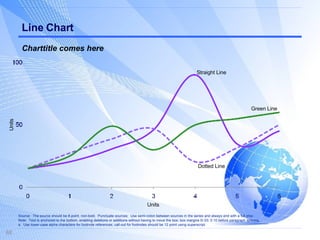
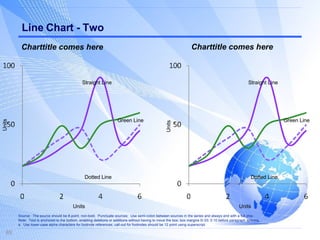
The document provides formatting guidelines and templates for various types of charts, graphs, text blocks, and tables that can be used in presentations. It includes templates for bar charts, column charts, line charts and other visual elements with specific formatting instructions for font sizes, colors, spacing, etc. It also includes templates for different types of text blocks formatted as lists, matrices, cause-and-effect diagrams, and more. The templates are intended to help standardize formatting across presentations.
Consulting diagrams and design templates sampleSTRATICX
A large collection of over 170 slides of commonly used consulting diagrams and design templates. The PPT collection includes:
Charts
Tables
Organisation Charts
Timelines and Gantt Charts
Text Based
Process Flows
Other Information, shapes and conceptual charts
All are fully functional and ready to be used for your presentations
Excel Portion of the ProjectSteps 1-4Use this ClassSection .docxcravennichole326
Excel Portion of the Project
Steps 1-4: Use this Class/Section – date format – columns popped open:
Steps 5-6: Follow instructions. Change “Revenue” to Currency and “NumCars” to Number. Use thousandth’s separator.
Steps 7-8: First three rows of table after it is sorted. Make sure titles are not chopped off.
Step 9a-b: Copy the data only to Slide 2 & 3. For Filter Analysis, use Paste | Values. There are no banded rows. Step 9(d): Reformat the table to the same style as the Data table formatting. Adjust column widths so no titles are chopped off.
Step 10: Both pivot tables have the same Grand Total: One Pivot Table is for “CarClass”. The second Pivot Table is for “Location”. Make sure titles are not chopped off.
Step 11: Follow the instructions. All charts must be formatted with the same colors. The first chart will be grouped by “CarClass”. The second chart will be grouped by “Location”.
Step 12: Both pivot tables have the same Grand Total:One Pivot “CarClass”. The second Pivot table is for “Location”. Make sure titles are not chopped off.
Step 13: Follow the instructions. All charts must be formatted with the colors in Step 11. One chart is grouped by “CarClass”. The second chart is grouped by “Location”.
Step 14: If the table is formatted like the other tables, that is OK. If the table is not formatted like the other tables, make sure Revenue is Currency and NumCars is Number with thousandth’s separator. Neither of these two columns have decimal places.
Turn on the filters.
Step 15a: Uncheck and then re-check only the titles indicated. in the. Leave the filter on. You have three rows showing.
Step 15b: In Row 34, use a simple formula to calculate the two totals. Do not turn the filters off. There should only be four rows visible in the work sheet. Here are your check figures:
PowerPoint Portion of the Project
Step 16-17:Slide 1: The title of the presentation. Use some title other than Excel Project #3. Do not use identifiers from Step 17d, but only the information as shown below.
The theme is your choice.
Step 18: Slide 2: Follow instructions. Use the Speaker Notes section to “talk” to the audience about what you want to say about this slide. Be sure to introduce yourself.
Speaker Notes
Step 19: Slide 3: Follow instructions. Your Speaker Notes are what you “say” to the audience about what is presented in the charts. Do not type what you say onto the slide!
Speaker Notes
Steps 20-21: Slide 4: Follow the instructions.
Speaker Notes
Step 22: Follow the instructions. There should be no footer nor Slide # on the Title Slide. The first slide
with a Slide Number and a footer is Slide #2, and the number should be a “2”.
Step 23: Add a transition to all slides. Mix it up. Don’t add the same transition to every slide.
Step 24: Animate some words or the graphic. Do not add an animation to every slide as that detracts from the presentation.
In.
YearQuarterLocationCarClass Revenue NumCars 2017Q1DowntownEconomy $976,803 6,137 2017Q1AirportEconomy $1,047,031 5,773 2015Q3DowntownEconomy $804,931 5,564 2016Q4AirportEconomy $958,989 5,370 2016Q1DowntownEconomy $750,562 5,048 2015Q3AirportEconomy $733,215 4,917 2016Q4DowntownEconomy $735,993 4,751 2016Q3DowntownEconomy $712,136 4,703 2016Q2DowntownEconomy $670,068 4,459 2015Q4AirportEconomy $639,838 4,256 2015Q4AirportPremium $663,293 4,137 2016Q3AirportPremium $688,190 4,081 2015Q4DowntownPremium $623,279 4,072 2017Q1AirportPremium $709,705 4,024 2017Q2AirportPremium $721,899 4,008 2016Q2AirportPremium $626,117 3,773 2017Q2DowntownEconomy $600,403 3,748 2016Q3AirportEconomy $620,543 3,665 2016Q1AirportPremium $590,987 3,621 2015Q3DowntownPremium $540,136 3,584 2015Q4DowntownEconomy $531,619 3,582 2015Q2AirportEconomy $501,606 3,470 2016Q1AirportEconomy $521,223 3,406 2015Q1AirportEconomy $469,217 3,387 2016Q2DowntownPremium $522,789 3,283 2017Q2AirportEconomy $621,746 3,282 2015Q2DowntownPremium $487,304 3,274 2016Q4AirportPremium $564,853 3,260 2015Q3AirportPremium $504,843 3,194 2016Q3DowntownPremium $517,084 3,185 2016Q1DowntownPremium $444,067 2,840 2015Q2DowntownEconomy $396,037 2,839 2015Q1DowntownEconomy $374,342 2,817 2016Q4DowntownPremium $450,598 2,748 2017Q1DowntownPremium $451,848 2,695 2015Q1DowntownPremium $370,169 2,537 2015Q1AirportPremium $375,634 2,507 2016Q2AirportEconomy $384,966 2,277 2015Q2AirportPremium $316,848 2,057 2017Q2DowntownPremium $344,292 2,008
Excel Project 2 – MS Excel
Summer 2018
Use the project description HERE to complete this activity. For a review of the complete rubric used in grading
this exercise, click on the Assignments tab, then on the title Excel Project #2. Click on Show Rubrics if the
rubric is not already displayed.
Summary
Create a Microsoft Excel workbook with four worksheets that provides extensive use of Excel capabilities
including creating a pivot table, charting, and written analysis and recommendations in support of a business
enterprise.
A large rental car company has two metropolitan locations, one at the airport and another centrally located in
downtown. It has been operating since 2015 and each location summarizes its car rental revenue
quarterly. Both locations rent two classes of cars: economy and premium. Rental revenue is maintained
separately for the two classes of rental vehicles.
The data for this case resides in the file summer2018rentalcars.txt and can be downloaded by clicking on the
Assignments tab, then on the data file name. It is a text file with the file type .txt.
Do not create your own data. You must use the data provided, and only the data provided.
Default Formatting: All labels, text, and numbers will be Arial 10, There will be $ and comma and
decimal point variations for numeric data, but Arial 10 will be the default font and font size.
Tutorials
Note: Tutorials that ad.
Excel Project 2 – MS Excel Summer 2018 Use the project.docxelbanglis
Excel Project 2 – MS Excel
Summer 2018
Use the project description HERE to complete this activity. For a review of the complete rubric used in grading
this exercise, click on the Assignments tab, then on the title Excel Project #2. Click on Show Rubrics if the
rubric is not already displayed.
Summary
Create a Microsoft Excel workbook with four worksheets that provides extensive use of Excel capabilities
including creating a pivot table, charting, and written analysis and recommendations in support of a business
enterprise.
A large rental car company has two metropolitan locations, one at the airport and another centrally located in
downtown. It has been operating since 2015 and each location summarizes its car rental revenue
quarterly. Both locations rent two classes of cars: economy and premium. Rental revenue is maintained
separately for the two classes of rental vehicles.
The data for this case resides in the file summer2018rentalcars.txt and can be downloaded by clicking on the
Assignments tab, then on the data file name. It is a text file with the file type .txt.
Do not create your own data. You must use the data provided, and only the data provided.
Default Formatting: All labels, text, and numbers will be Arial 10, There will be $ and comma and
decimal point variations for numeric data, but Arial 10 will be the default font and font size.
Tutorials
Note: Tutorials that address activities used in this project have been assigned in Week 1 – 5.
Step Requirement
Points
Allocated
Comments
1
Open Excel and save a blank workbook with the following
name:
a. “Student’s First InitialLast Name Excel Project 2”
Example: JSmith Excel Project 2.
b. Set Page Layout Orientation to Landscape.
0.2
Use Print Preview to review
how the first worksheet
would print.
2 Change the name of the worksheet to Analysis by. 0.1
3
In the Analysis by worksheet:
a. Beginning in Row 1, enter the four labels in column
A (one label per row) in the following order:
Name:, Class/Section:, Project:, Date Due:
b. Place a blank row between each label. Please note
the colon : after each label.
c. Align the labels to the right side in the cells
It may be necessary to adjust the column width so the four
labels are clearly visible.
0.3
Format for text in column
A:
• Arial 10 point
• Normal font
• Right-align all four
labels in the cells
4
In the Analysis by worksheet with all entries in column C:
a. Enter the appropriate values for your Name, Class
and Section, Project, Date Due across from the
appropriate label in column A.
0.2
Format for text in column
C:
• Arial 10 point
• Bold
Step Requirement
Points
Allocated
Comments
b. Use the formatting in the Comments column (to the
right).
It may be necessary to adjust the column width so the four
labels are clearly visible.
• Left-align all four
values in the cells
5
a. Create new workshe ...
ASSESSMENT CASE PAPER ANALYSIS / TUTORIALOUTLET DOT COMjorge0048
A report broken down into the following sections:
Summary results and recommendations—up front, concise, and to the point.
Answers to the 6 questions asked—devote a paragraph to each, with individual headings
Download Complete Material - https://www.instamojo.com/prashanth_ns/
This Advanced Excel - Office 2010 contains 12 Units and each unit contains 40 to 60 slides in it.
Contents…
• Manage cell and range names
• Calculate data across worksheets
• Use specialized functions
• Analyze data with logical and lookup functions
• Create and modify tables and Format tables
• Sort or filter worksheet or table data
• Calculate data in a table or worksheet
• Create, Modify and Format chart
• Create a PivotTable report
• Analyze data using PivotCharts
• Insert and modify pictures and ClipArt
• Draw and modify shapes
• Illustrate workflow using SmartArt graphics
• Layer and group graphic objects
• Customize the Excel environment
• Customize workbooks
• Manage themes and Create and use templates
• Apply conditional formatting
• Add data validation criteria
• Update a workbook’s properties
• Modify Excel’s default settings
• Share a workbook
• Set revision tracking and Review tracked revisions
• Merge workbooks
• Administer digital signatures
• Restrict document access
• Trace precedents and dependents of a cell
• Troubleshoot errors in formulas and invalid data and formulas
• Watch and evaluate formulas
• Create a data list outline, a trend line and scenarios
• Perform what-if analysis and statistical analysis
• Create a workspace and Consolidate data
• Link cells in different workbooks
• Edit links and Export Excel data
• Import a delimited text file
• Publish a worksheet to the web
• Import data from the web
• Create a web query
• Develop XML maps and Import and export XML data
Free Download - http://sapdocs.info/sap/abap/abap-training-course-for-beginners/
A must document for those don't have any experience about ABAP, never seen code..
BIS 155 Inspiring Innovation -- bis155.comkopiko101
For more course tutorials visit
www.bis155.com
BIS 155 Course Project Excel Project
BIS 155 Lab 1 of 7: Saddle River Marching Band
BIS 155 iLab 1 Upper Saddle River Marching Band (New)
BIS 155 Lessons in Excellence / bis155.comkopiko33
For more course tutorials visit
www.bis155.com
BIS 155 Course Project Excel Project
BIS 155 Lab 1 of 7: Saddle River Marching Band
BIS 155 iLab 1 Upper Saddle River Marching Band (New)
BIS 155 Lab 2 of 7: Excel's Advanced Formulas & Functions
Week 1 Assignment InstructionsGOAL Create the initial element o.docxjessiehampson
Week 1 Assignment Instructions
GOAL: Create the initial element of your Business Model Generation—your business Model Canvas.
Introduction: Using the Osterwalder and Pigneur Business Model Canvas as a resource (coupled with the other resources of the course), create a business model canvas of the business organization where you work. Since every organization has unique features, do your best to work at the application of the various components of the building blocks of the canvas. Show as much detail as you can so that it is evident that you comprehend the general business model of your organization. There must be a demonstration of synthesis of the procedure on your part. You may need to interview some of the management team to verify the business model details of your organization. You may also benefit from conducting an Internet search of the Business Model Canvas to become comfortable with how it works. There are many other YouTube-type videos on the web that demonstrate the use of the canvas. You will also find several good sources in the Lessons area of the course under the Reading and Resources tab of weeks 1 and 2.
Instructions: Your submittal this week will be considered as a “draft” that should consist of:
1. A Cover page that provides a general description of your organization/business:
Name of the organization (preferably your present organization/business)
Date of origination (or incorporation)
Location (as appropriate; some entities require discretion)
Brief overview of the purpose of the organization/business
Description of your relationship and role in the organization/business
Other details that enable fuller explanation (if applicable)
2. Business Model Canvas with Post-It notes (as seen in the examples). You have three options for the submission of your canvas:
· You may download and use the blank PowerPoint canvas with electronic Post-Its to create your canvas (click here), or
· You may create a Word.doc that lists the nine building blocks (clearly identify each one) and uses bulleted points in the same manner as Post-Its.
· Creation of your post-its via the following web-help site, and then submission of the resulting URL for the finished canvas. See (click on link) https://canvanizer.com/new/business-model-canvas
3. Create a memo (no particular format, but neatly presented) that describes what you learned about your organization/business as a result of creating the business model canvas.
UPLOAD your finished assignment into the Assignment page. You may consolidate the cover page and memo into one document if you use the PowerPoint method of the canvas. If you do all of the assignment as a Word.doc, then you may consolidate the entire assignment into one document; it is your call. However, Each file OF YOUR WORK should be named in the following manner: Last name–truncated Week Number-Assignment name (abbreviated if necessary)
For example: Smith-Wk ...
Project Title
Final Project Report
Submitted as partial fulfillment of the requirements for
ENGT 4050
Senior Technology Capstone
Professor Richard Springman
Project Team A-00
Rocky Rocket, Team Lead
Allis Chalmers
John Deere
Cyrus McCormick
Faculty Advisor
Dr. Myron Noodleman
Sponsor
Mr. Anton Hulman
Indianapolis Motor Speedway
July 4, 1776
The University of Toledo
College of Engineering
Engineering Technology Department
This page intentionally left blank
An Abstract of
Project Title
by
Team A-00
Rocky Rocket, Team Lead
Allis Chalmers
John Deere
Cyrus McCormick
for
ENGT 4050
Senior Technology Capstone
Fall Semester 2013
The University of Toledo
The title material above is single-spaced and centered at the top of the Abstract page, with equal
spacing between each component (i.e., one blank line). This information must agree with that
which is presented on the title page. Use two spaces between the title material and the text of the
abstract. Abstract page material must be printed in the same font as is used for all other textual
material (i.e., do not use bold, italics, underline, etc. here).
The abstract text must be a concise statement of the problem, procedure or methods utilized,
results obtained, and a brief conclusion. There is no prescribed length for the abstract, but in no
case should it exceed 350 words.
Acknowledgments
This section is included for the purpose of identifying and/or recognizing those who have helped,
assisted or provided support to the design team in the execution of the senior capstone project.
Table of Contents
Abstract . . . . . . . . . . . . . . . . . . . . . . . . . . . . . . . . . . . . . . . . . . . . . . . . . . . . . . . . . . . . . . . . . . . . .iii
Acknowledgments . . . . . . . . . . . . . . . . . . . . . . . . . . . . . . . . . . . . . . . . . . . . . . . . . . . . . . . . . . . . iv
Table of Contents . . . . . . . . . . . . . . . . . . . . . . . . . . . . . . . . . . . . . . . . . . . . . . . . . . . . . . . . . . . . . v
List of Tables
List of Figures
List of Abbreviations
List of Symbols
Introduction . . . . . . . . . . . . . . . . . . . . . . . . . . . . . . . . . . . . . . . . . . . . . . . . . . . . . . . . . . . . . . . . . . 1
Project Objectives
Project Team
Design and Analysis
Results
Discussion and Conclusions
References
Appendices
Team Resumes
Gantt Chart
Budget
.
Project Title
General Formatting
Your report must be in suitable condition for binding and printed on one side only (i.e., no
double-sided printing). Textual material may be formatted “ragged-right” or “flush” with the
right margin. This choice may be influenced by the typesetting capabilities of the software used
to prepare your report. Hyphenations are permitted, except when the hyphenated word is split
over two page.
Excel Project 3 – MS Excel Use the project description H.docxSANSKAR20
Excel Project 3 – MS Excel
Use the project description HERE to complete this activity. For a review of the complete
rubric used in grading this exercise, click on the Assignments tab, then on the title Excel
Project 3. Click on Show Rubrics if the rubric is not already displayed.
Summary
Create a Microsoft Excel file with four worksheets that provides extensive use of Excel
capabilities for graphing. The graphs will be copied into a Microsoft PowerPoint file and
the student will develop appropriate findings and recommendations based on analysis
of the data.
A large rental car company has two metropolitan locations, one at the airport and
another centrally located in downtown. It has been operating since 2015 and each
location summarizes its car rental revenue quarterly. Both locations rent two classes of
cars: economy and premium. Rental revenue is maintained separately for the two
classes of rental vehicles.
The data for this case resides in the file Excel Project 3-data.txt and can be downloaded
by clicking on the Assignments tab, then on the data tile name. It is a text file (with the
file type .txt).
Do not create your own data, you must use the data provided and only the data
provided.
Element
Requirement
Points
Allocated
Comments
#
1
1 - Open Excel and save a blank worksheet with
the following name:
0.2
Use Print Preview
to review how
spreadsheet
would print.
a.“Student’s First InitialLast Name Excel Project 1”
Example: JSmith Excel Project 1
b. Set Page Layout to Landscape
2
Change the name of the worksheet to Analysis
by.
0.1
3
a. In the Analysis by worksheet, enter the four
labels vertically in column A in the following order:
Name:, Class/Section:, Project:, Date Due:
0.3
Use the following
text format:
b. with a row between each label, please note the
colon, (:) , after each label.
Arial 10 point
Bold
It may be necessary to adjust the column width so
the four labels are clearly visible.
Align values
Right in the cell
4
a. In the Analysis by worksheet, with all entries in
column C, enter the appropriate values for Name,
Class and Section, Project, Date Due.
0.3
Use the following
text format:
It may be necessary to adjust the column width so
the four labels are clearly visible.
Arial 10 point
Bold
b. formatting
Align values left
in the cells
5
a. Create three new worksheets: Data, Slide 2,
Slide 3. Upon completion, there should be
Analysis by as well as the three newly created
worksheets.
0.4
b. Delete any other worksheets.
6
If necessary, reorder the four worksheets so they
are in the following order: Analysis by, Data,
Slide 2, Slide 3.
0.1
7
a. In the Data worksheet, import the text file Excel
Project 3.txt.
0.5
The field names
should be in the
top row of the
worksheet with
the data directly
under it in rows.
This action may
not be necessary
as this is part of
th ...
1. I am using software that can also accommodate html 5, quizzes etc. in html the user can advance the slides etc. and access resource material. The nice thing is that you can export to Video to enable upload to for example YouTube.
2. Note the following:
2.1 The file is around 25 MB and it is 4 minutes to watch;
2.2 This is Beta, so no copyright restrictions. Repay me by subscribing and providing feedback.
Purpose:
This infographic provides a framework to facilitate the following with the consultant team. It is one of the first actions to ensure coordination and a common focus:
Understanding of the business context
Understanding the need/ opportunity
Understanding what was sold
Identify client pressure points, risks, and first level delivery expectations
Obtain a perspective of OCM needs/strategy
Obtain a perspective of resource requirements.
LA HUG - Video Testimonials with Chynna Morgan - June 2024Lital Barkan
Have you ever heard that user-generated content or video testimonials can take your brand to the next level? We will explore how you can effectively use video testimonials to leverage and boost your sales, content strategy, and increase your CRM data.🤯
We will dig deeper into:
1. How to capture video testimonials that convert from your audience 🎥
2. How to leverage your testimonials to boost your sales 💲
3. How you can capture more CRM data to understand your audience better through video testimonials. 📊
Recruiting in the Digital Age: A Social Media MasterclassLuanWise
In this masterclass, presented at the Global HR Summit on 5th June 2024, Luan Wise explored the essential features of social media platforms that support talent acquisition, including LinkedIn, Facebook, Instagram, X (formerly Twitter) and TikTok.
In the Adani-Hindenburg case, what is SEBI investigating.pptxAdani case
Adani SEBI investigation revealed that the latter had sought information from five foreign jurisdictions concerning the holdings of the firm’s foreign portfolio investors (FPIs) in relation to the alleged violations of the MPS Regulations. Nevertheless, the economic interest of the twelve FPIs based in tax haven jurisdictions still needs to be determined. The Adani Group firms classed these FPIs as public shareholders. According to Hindenburg, FPIs were used to get around regulatory standards.
Personal Brand Statement:
As an Army veteran dedicated to lifelong learning, I bring a disciplined, strategic mindset to my pursuits. I am constantly expanding my knowledge to innovate and lead effectively. My journey is driven by a commitment to excellence, and to make a meaningful impact in the world.
Company Valuation webinar series - Tuesday, 4 June 2024FelixPerez547899
This session provided an update as to the latest valuation data in the UK and then delved into a discussion on the upcoming election and the impacts on valuation. We finished, as always with a Q&A
Improving profitability for small businessBen Wann
In this comprehensive presentation, we will explore strategies and practical tips for enhancing profitability in small businesses. Tailored to meet the unique challenges faced by small enterprises, this session covers various aspects that directly impact the bottom line. Attendees will learn how to optimize operational efficiency, manage expenses, and increase revenue through innovative marketing and customer engagement techniques.
Business Valuation Principles for EntrepreneursBen Wann
This insightful presentation is designed to equip entrepreneurs with the essential knowledge and tools needed to accurately value their businesses. Understanding business valuation is crucial for making informed decisions, whether you're seeking investment, planning to sell, or simply want to gauge your company's worth.
Enterprise Excellence is Inclusive Excellence.pdfKaiNexus
Enterprise excellence and inclusive excellence are closely linked, and real-world challenges have shown that both are essential to the success of any organization. To achieve enterprise excellence, organizations must focus on improving their operations and processes while creating an inclusive environment that engages everyone. In this interactive session, the facilitator will highlight commonly established business practices and how they limit our ability to engage everyone every day. More importantly, though, participants will likely gain increased awareness of what we can do differently to maximize enterprise excellence through deliberate inclusion.
What is Enterprise Excellence?
Enterprise Excellence is a holistic approach that's aimed at achieving world-class performance across all aspects of the organization.
What might I learn?
A way to engage all in creating Inclusive Excellence. Lessons from the US military and their parallels to the story of Harry Potter. How belt systems and CI teams can destroy inclusive practices. How leadership language invites people to the party. There are three things leaders can do to engage everyone every day: maximizing psychological safety to create environments where folks learn, contribute, and challenge the status quo.
Who might benefit? Anyone and everyone leading folks from the shop floor to top floor.
Dr. William Harvey is a seasoned Operations Leader with extensive experience in chemical processing, manufacturing, and operations management. At Michelman, he currently oversees multiple sites, leading teams in strategic planning and coaching/practicing continuous improvement. William is set to start his eighth year of teaching at the University of Cincinnati where he teaches marketing, finance, and management. William holds various certifications in change management, quality, leadership, operational excellence, team building, and DiSC, among others.
Premium MEAN Stack Development Solutions for Modern BusinessesSynapseIndia
Stay ahead of the curve with our premium MEAN Stack Development Solutions. Our expert developers utilize MongoDB, Express.js, AngularJS, and Node.js to create modern and responsive web applications. Trust us for cutting-edge solutions that drive your business growth and success.
Know more: https://www.synapseindia.com/technology/mean-stack-development-company.html
[Note: This is a partial preview. To download this presentation, visit:
https://www.oeconsulting.com.sg/training-presentations]
Sustainability has become an increasingly critical topic as the world recognizes the need to protect our planet and its resources for future generations. Sustainability means meeting our current needs without compromising the ability of future generations to meet theirs. It involves long-term planning and consideration of the consequences of our actions. The goal is to create strategies that ensure the long-term viability of People, Planet, and Profit.
Leading companies such as Nike, Toyota, and Siemens are prioritizing sustainable innovation in their business models, setting an example for others to follow. In this Sustainability training presentation, you will learn key concepts, principles, and practices of sustainability applicable across industries. This training aims to create awareness and educate employees, senior executives, consultants, and other key stakeholders, including investors, policymakers, and supply chain partners, on the importance and implementation of sustainability.
LEARNING OBJECTIVES
1. Develop a comprehensive understanding of the fundamental principles and concepts that form the foundation of sustainability within corporate environments.
2. Explore the sustainability implementation model, focusing on effective measures and reporting strategies to track and communicate sustainability efforts.
3. Identify and define best practices and critical success factors essential for achieving sustainability goals within organizations.
CONTENTS
1. Introduction and Key Concepts of Sustainability
2. Principles and Practices of Sustainability
3. Measures and Reporting in Sustainability
4. Sustainability Implementation & Best Practices
To download the complete presentation, visit: https://www.oeconsulting.com.sg/training-presentations
Putting the SPARK into Virtual Training.pptxCynthia Clay
This 60-minute webinar, sponsored by Adobe, was delivered for the Training Mag Network. It explored the five elements of SPARK: Storytelling, Purpose, Action, Relationships, and Kudos. Knowing how to tell a well-structured story is key to building long-term memory. Stating a clear purpose that doesn't take away from the discovery learning process is critical. Ensuring that people move from theory to practical application is imperative. Creating strong social learning is the key to commitment and engagement. Validating and affirming participants' comments is the way to create a positive learning environment.
Affordable Stationery Printing Services in Jaipur | Navpack n PrintNavpack & Print
Looking for professional printing services in Jaipur? Navpack n Print offers high-quality and affordable stationery printing for all your business needs. Stand out with custom stationery designs and fast turnaround times. Contact us today for a quote!
An introduction to the cryptocurrency investment platform Binance Savings.Any kyc Account
Learn how to use Binance Savings to expand your bitcoin holdings. Discover how to maximize your earnings on one of the most reliable cryptocurrency exchange platforms, as well as how to earn interest on your cryptocurrency holdings and the various savings choices available.
The effects of customers service quality and online reviews on customer loyal...
Template
1. The Title Is Set in 26-Point Arial Bold (three lines max., reduce font size if more) Sub-title, 20-Point Arial Bold This Could Go to Two Lines Client/Capacity2000 Date—14 point bold
2.
3.
4.
5.
6.
7.
8. Useful icons in blue Strategy Dimensions of Growth Planning for Growth Implementation text text text text
14. Agenda Date : 13 May 2000 Time : 08h00 Venue : MAC Consulting Training Room Item 1 AB 00h00 Item 2 CD 00h00 Item 3 EF 00h00 Item 4 GH 00h00 Item 5 IJ 00h00 Item 6 KL 00h00 Item 7 MN 00h00 Item 8 OP 00h00 Item 9 QR 00h00
18. RACI Activities CEO Vulamehlo Gas Production Gas Circuit Utilities Water & Ash Monomers & Chemicals Fuels Production Integration Business Development Engineering Support Community Affairs / SDB Material Supply Contracts SHER Financial Services Information Mngement & Logistics Human Resources Rosebank / Other 1. Engineering Support
19.
20. Timeline F d W T S N B R & D M J R S H J M G F v T 2/8 9/8 16/8 23/8 30/8 6/9 13/9 20/9 27/9 4/10 11/10 18/10 25/10 1/11 8/11 Timeline Assemble team A R R Choose architecture A Data format R R A R R Data collection R A/R R R R Analyse data R R A/R Develop algorithms R R A/R Test algarithms in plant A/R R R R R Test algorithms in gasloop model A/R R R R I R Quantify constrains R A/R R R R R VPC A R R R R R Initial model development R R A/R R R R C Initial model testing R R A/R R R C Refine model A/R R R C Handover A R R C
21.
22.
23.
24. Generic Blocks, Circles and Arrows - Copy/Paste the Objects Below or Use the Paint Brush on the Formatting Toolbar to Copy Colors onto Other Objects 1 1 Standard Dark Blue RGB Code: 51 - 102 -153 Standard Light Blue RGB Code: 222 - 211 - 182 Green RGB Code: 153 - 204 - 000 Preferred Colors 1
25. All charts in this document comply to this global PowerPoint palette R = 9 G = 29 B = 93 R = 156 G = 209 B = 0 R = 221 G = 210 B = 181 Primary colours Highlight colors using standard PowerPoint palette (charts & diagrams) To be used as an accent or highlight color only To be used as a background color behind charts and graphs only The color palette has been adjusted in PowerPoint to allow for better onscreen projection R = 161 G = 61 B = 58 R = 89 G = 110 B = 110 R = 102 G = 51 B = 104 R = 145 G = 125 B = 74 R = 151 G = 115 B = 174 R = 220 G = 130 B = 64 R = 87 G = 125 B = 61 R = 84 G = 156 B = 181
26.
27. Text Blocks - Unrelated List ..... ..... ..... ..... ..... ..... ..... ..... ..... .....
28. Text Blocks - Causes and Effects ..... ..... ..... ..... ..... ..... ..... ..... ..... ..... Subtitle comes here
29. Text Blocks - Matrix ..... ..... ..... ..... ..... ..... ..... ..... ..... ..... ..... ..... ..... ..... ..... ..... ..... ..... ..... Subtitle comes here
30. Text Blocks - Cause and Effect ..... ..... ..... ..... Subtitle comes here
31. Text Blocks - Sequence of Causes and Effects ..... ..... ..... ..... ..... ..... Subtitle comes here
32.
33.
34. Text - Bullits ..... ..... ..... ..... ..... Subtitle comes here
35. Text Blocks - Influencing ..... Subtitle comes here … … … … … …
36. Text Blocks - Leading to ..... ..... ..... ..... ..... Subtitle comes here
37. Text - Enveloping Elements ...... ..... ..... ..... ..... ..... ..... ..... Subtitle comes here
38. Text Blocks - Elements Leading To ..... ..... ..... ..... ..... ..... ..... ..... ..... ..... Subtitle comes here …
39. Text Blocks - Resulting From ..... Subtitle comes here … … … … … … …
44. Logic Tree - Two Levels ..... ..... ..... ..... ..... ..... ..... Subtitle comes here
45. Logic Tree - Vertical ..... ..... ..... ..... ..... ..... ..... ..... ..... ..... ..... ..... ..... Subtitle comes here
46. Driver Tree - Arrows Showing Trend ..... ..... ..... ..... ..... ..... ..... ..... ..... ..... ..... ..... ..... ..... ..... ..... ..... ..... ..... ..... Subtitle comes here
47. Driver Tree - Arrows Showing Base Trends ..... ..... ..... ..... ..... ..... ..... ..... ..... ..... ..... ...... ..... Subtitle comes here
48. Driver Tree - Moons Showing Base Trends ..... ..... ..... ..... ..... ..... ..... ..... ..... ..... ..... strong weak Subtitle comes here
49. Driver Tree - Text with General Trends ..... ..... ..... ..... ..... ..... ..... ..... ..... ..... ..... ..... Subtitle comes here
50.
51. Range of possible outcomes Uncertainties ..... ..... ..... ..... ..... ..... ..... Range of Outcomes ..... ..... ..... ..... ..... ..... ..... ..... ..... ..... Subtitle comes here
52.
53. Standard Table Layout Subtitle comes here Column heading Column heading Column heading Column heading
54.
55. Bar Chart - Stacked Units Charttitle comes here Source: The source should be 8-point, non-bold. Punctuate sources: Use semi-colon between sources in the series and always end with a full stop. Note: Text is anchored to the bottom, enabling deletions or additions without having to move the box; box margins 0/.03; 0.10 before paragraph spacing. a. Use lower-case alpha characters for footnote references; call-out for footnotes should be 12 point using superscript.
56. Bar Chart - Two Stacked Units Charttitle comes here Units Charttitle comes here Source: The source should be 8-point, non-bold. Punctuate sources: Use semi-colon between sources in the series and always end with a full stop. Note: Text is anchored to the bottom, enabling deletions or additions without having to move the box; box margins 0/.03; 0.10 before paragraph spacing. a. Use lower-case alpha characters for footnote references; call-out for footnotes should be 12 point using superscript.
57. Bar Chart - Three Stacked Units Charttitle comes here Units Charttitle comes here Units Charttitle comes here Source: The source should be 8-point, non-bold. Punctuate sources: Use semi-colon between sources in the series and always end with a full stop. Note: Text is anchored to the bottom, enabling deletions or additions without having to move the box; box margins 0/.03; 0.10 before paragraph spacing. a. Use lower-case alpha characters for footnote references; call-out for footnotes should be 12 point using superscript.
58. Bar Chart - Four Parallel Units Charttitle comes here Units Charttitle comes here Units Charttitle comes here Units Charttitle comes here Source: The source should be 8-point, non-bold. Punctuate sources: Use semi-colon between sources in the series and always end with a full stop. Note: Text is anchored to the bottom, enabling deletions or additions without having to move the box; box margins 0/.03; 0.10 before paragraph spacing. a. Use lower-case alpha characters for footnote references; call-out for footnotes should be 12 point using superscript.
59. Bar Chart - Paired Source: The source should be 8-point, non-bold. Punctuate sources: Use semi-colon between sources in the series and always end with a full stop. Note: Text is anchored to the bottom, enabling deletions or additions without having to move the box; box margins 0/.03; 0.10 before paragraph spacing. a. Use lower-case alpha characters for footnote references; call-out for footnotes should be 12 point using superscript. Units Charttitle comes here
60. Bar Chart - Two Paired Source: The source should be 8-point, non-bold. Punctuate sources: Use semi-colon between sources in the series and always end with a full stop. Note: Text is anchored to the bottom, enabling deletions or additions without having to move the box; box margins 0/.03; 0.10 before paragraph spacing. a. Use lower-case alpha characters for footnote references; call-out for footnotes should be 12 point using superscript. Units Charttitle comes here Units Charttitle comes here
61. Column Chart - Stacked Source: The source should be 8-point, non-bold. Punctuate sources: Use semi-colon between sources in the series and always end with a full stop. Note: Text is anchored to the bottom, enabling deletions or additions without having to move the box; box margins 0/.03; 0.10 before paragraph spacing. a. Use lower-case alpha characters for footnote references; call-out for footnotes should be 12 point using superscript. Units Charttitle comes here
62. Column Chart - Two Stacked Source: The source should be 8-point, non-bold. Punctuate sources: Use semi-colon between sources in the series and always end with a full stop. Note: Text is anchored to the bottom, enabling deletions or additions without having to move the box; box margins 0/.03; 0.10 before paragraph spacing. a. Use lower-case alpha characters for footnote references; call-out for footnotes should be 12 point using superscript. Units Charttitle comes here Units Charttitle comes here
63. Column Chart - Paired Source: The source should be 8-point, non-bold. Punctuate sources: Use semi-colon between sources in the series and always end with a full stop. Note: Text is anchored to the bottom, enabling deletions or additions without having to move the box; box margins 0/.03; 0.10 before paragraph spacing. a. Use lower-case alpha characters for footnote references; call-out for footnotes should be 12 point using superscript. Units Charttitle comes here
64. Column Chart - Two Paired Source: The source should be 8-point, non-bold. Punctuate sources: Use semi-colon between sources in the series and always end with a full stop. Note: Text is anchored to the bottom, enabling deletions or additions without having to move the box; box margins 0/.03; 0.10 before paragraph spacing. a. Use lower-case alpha characters for footnote references; call-out for footnotes should be 12 point using superscript. Units Charttitle comes here Units Charttitle comes here
65. Column Chart - Multiple Country Units Country Country Country Country Charttitle comes here
66. Pie Chart Charttitle comes here Source: The source should be 8-point, non-bold. Punctuate sources: Use semi-colon between sources in the series and always end with a full stop. Note: Text is anchored to the bottom, enabling deletions or additions without having to move the box; box margins 0/.03; 0.10 before paragraph spacing. a. Use lower-case alpha characters for footnote references; call-out for footnotes should be 12 point using superscript.
68. Line Chart Source: The source should be 8-point, non-bold. Punctuate sources: Use semi-colon between sources in the series and always end with a full stop. Note: Text is anchored to the bottom, enabling deletions or additions without having to move the box; box margins 0/.03; 0.10 before paragraph spacing. a. Use lower-case alpha characters for footnote references; call-out for footnotes should be 12 point using superscript. Units Units Straight Line Dotted Line Green Line Charttitle comes here
69. Line Chart - Two Source: The source should be 8-point, non-bold. Punctuate sources: Use semi-colon between sources in the series and always end with a full stop. Note: Text is anchored to the bottom, enabling deletions or additions without having to move the box; box margins 0/.03; 0.10 before paragraph spacing. a. Use lower-case alpha characters for footnote references; call-out for footnotes should be 12 point using superscript. Units Units Straight Line Dotted Line Green Line Charttitle comes here Units Units Straight Line Dotted Line Green Line Charttitle comes here
70. Waterfall Chart Units Charttitle comes here Source: The source should be 8-point, non-bold. Punctuate sources: Use semi-colon between sources in the series and always end with a full stop. Note: Text is anchored to the bottom, enabling deletions or additions without having to move the box; box margins 0/.03; 0.10 before paragraph spacing. a. Use lower-case alpha characters for footnote references; call-out for footnotes should be 12 point using superscript.
71. Wave Chart Ease of Implementation Benefits Wave 1 Wave 2 Wave 3 High High Low Low Initiative Initiative Initiative Initiative Initiative Initiative Charttitle comes here Source: The source should be 8-point, non-bold. Punctuate sources: Use semi-colon between sources in the series and always end with a full stop. Note: Text is anchored to the bottom, enabling deletions or additions without having to move the box; box margins 0/.03; 0.10 before paragraph spacing. a. Use lower-case alpha characters for footnote references; call-out for footnotes should be 12 point using superscript.
72. Driver Tree Chart / Dupont Chart Source: The source should be 8-point, non-bold. Punctuate sources: Use semi-colon between sources in the series and always end with a full stop. Note: Text is anchored to the bottom, enabling deletions or additions without having to move the box; box margins 0/.03; 0.10 before paragraph spacing. a. Use lower-case alpha characters for footnote references; call-out for footnotes should be 12 point using superscript. .... ..... ..... ..... ..... ..... X -/- -/- Subtitle comes here
77. Donuts strong weak Subtitle comes here Company A 00 01 02 03 Company B 00 01 02 03 Company C 00 01 02 03 Company D 00 01 02 03 Criterium .. Criterium .. Criterium .. Criterium .. Criterium .. Criterium .. Criterium ..
78.
79. Value Chains - Loose Arrows ..... ..... ..... ..... ..... ..... ..... ..... ..... ..... ..... ..... Subtitle comes here
113. Trackers - Place in Top Right Corner of Slide Subtitle comes here
114.
115. Generic Strategy Development Framework - English Environmental Analysis Business Imperatives Business Definition Business Constraints Business Imperatives External Analysis Internal Analysis Key Insights Strategic Options Analysis Strategy Implementation Implement Action Plans Monitor Action Plans Actie-plannen Strategic Options Risk and Reward Strategic Direction Reassess the Business Imperatives Desk Research and Interviews Interviews and Workshops Workshops and Analyses Business Plan Writing Crea-tivity Subtitle comes here Future Industry Scenarios Future Industry Scenarios
116.
117. Strategy Development - The Fish Chosen Strategy Projects & Resources Monitoring Financial Position Strategic Position Capital Market Economic Profitability Growth Commercial Market Market Attractiveness Competitive Position Insight CSFs & KPIs Strategic Issues Scope & Context Creativity Scenarios & Options Subtitle comes here
118. Strategy Development - The Loop CAPITAL MARKET MANAGED PERFORMANCE Strategy Execution Strategy Formulation Dynamic Strategy COMMERCIAL MARKET STRUCTURE & RESOURCES Strategic Position Strategic Position Competitive Position Market Attractiveness Scope & Context Strategic Issues Insight Value Creation Financial Position Growth Economic Profitability Critical Success Factors & Key Performance Indicators Performance Monitoring & Incentive Compensation Organizational Architecture Projects & Resources Chosen Strategy Scenarios & Options Creativity Subtitle comes here
119. Backward Strategic Planning Framework TIME GOAL Actions driven by strategy Where are we now? Mission: Why are we in business? Values: What are our enduring principles and beliefs? Vision: Where do we want to be in 2010? Strategy: How do we get there? Subtitle comes here
120. Incremental versus Dynamic Strategic Planning Framework Versus Incremental Planning Process Dynamic Strategic Planning Process Incrementalism [One reason why companies stagnate] TIME GOAL Where we are now? Actions taken in response to circumstances Where can we be next year? Focus [One reason why companies grow] TIME GOAL Actions driven by strategy Where are we now? Vision of where we need to be five years from now
123. Activity Map - Very Detailed Geographic markets Distribution channel Customer End use Industry System design /Application engineering Installation Service Customised Standard Sub-systems Food packaging Canning Bottling System Sales force OEM Direct Independent Agent MNC Regional National N.America L.America W.Europe E.Europe Middle East & Africa Asia Japan Australasia Liquid Hybrid Dry Processed Pumps Valves Homogenisers Tubular heat exchangers Food Processing Evaporators Tanks Other Ohmic heaters Freezers & Refrigerators Plate heat exchangers Separators Air treatment Automation Wrapping Dryers Cartoning Systems Subcontractor management 3rd party maintenance Upgrades/ modifications Contract Time/material Own maintenance Conveyer systems Aseptic processing systems Blow moulding equipment Filtration equipment Thermal & energy technology Control systems Sealing Labelling Global Standard Dairy Brewing Soft drinks Juices Cheese Ice Cream Baked Snacks/ Confectionery Cereals Soups/sauces Baby Food Oil/fats/margarines Project management Filling lines New business strengths Installed base strengths Canning Bottling Pumps Valves Homogenisers Tubular heat exchangers Evaporators Tanks Ohmic heaters Plate heat exchangers Separators Wrapping Dryers Cartoning Sealing Labelling Filling lines Convenience food Customer DIY Spare parts Freezers & Refrigerators Automation Conveyer systems Aseptic processing systems Blow moulding equipment Filtration equipment Control systems Strong position Average Weak position No position
126. Activity Map - Synergy Summary A B NewCo + = ..... ..... ..... ..... ..... ..... ..... ..... ..... Subtitle comes here Advantaged Disadvantaged NM Average
127.
128.
129. Portfolio Matrix Competitive Position (Returns compared to Industry Average) Market Attractiveness (Industry Average Returns above Cost of Capital) ROCE > CoC ROCE < CoC ROCE = CoC high low low high Charttitle comes here
130. Five Forces Competitors Customers Suppliers Substitutes New Entrants Strong Moderate Weak Subtitle comes here
131. Document Control - For Internal Use Only Version Date of Release Writer Approver(s) (if relevant) Comments on Major Changes from Previous Release 1 26-1-2005 Randy Jagt Vincent Oomes Fonts and colors in new global template 2 30-1-2005 Randy Jagt Vincent Oomes Change of colors Document Title Timesaver 2005 Document Owner Randy Jagt Approver(s) Vincent Oomes, Bert Vries