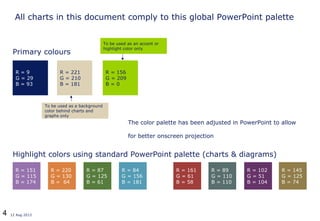
PowerPoint Timesaver.
2 12 Aug 2013
Introduction
• This file ‘PowerPoint Timesaver’ contains a large number of preformatted dummy
slides that are ready to be copied and pasted onto your own presentation for further
processing, thereby
– dramatically reducing lay-outing and formatting time
– ensuring consistency of lay-out throughout your presentation
• The structure of the slides is conform:
– Headings: 20 points Bold Verdana
– Sub-headings 16 points Verdana
– Bullet slides according to template (automatic), jump-in with Tab, jump-back with Shift-Tab
– Text 14, 12 or 10 points Verdana
– Footnotes 8 points Verdana
* Excluding special charts (Bubble, Merrimekko, Skyline, Brickyard etc.); these are available to licensed practitioners
through the StratBridge ‘Strategic Surveyor’ tool
3 12 Aug 2013
Generic Blocks, Circles and Arrows - Copy/Paste the Objects Below or
Use the Paint Brush on the Formatting Toolbar to Copy Colors onto
Other Objects
11 11
Standard Dark Blue
RGB Code: 51 - 102 -153
Standard Light Blue
RGB Code: 222 - 211 - 182
Green
RGB Code: 153 - 204 - 000
Preferred Colors
11
4 12 Aug 2013
All charts in this document comply to this global PowerPoint palette
R = 9
G = 29
B = 93
R = 156
G = 209
B = 0
R = 221
G = 210
B = 181
Primary colours
Highlight colors using standard PowerPoint palette (charts & diagrams)
To be used as an accent or
highlight color only
To be used as a background
color behind charts and
graphs only
The color palette has been adjusted in PowerPoint to allow
for better onscreen projection
R = 161
G = 61
B = 58
R = 89
G = 110
B = 110
R = 102
G = 51
B = 104
R = 145
G = 125
B = 74
R = 151
G = 115
B = 174
R = 220
G = 130
B = 64
R = 87
G = 125
B = 61
R = 84
G = 156
B = 181
5 12 Aug 2013
Agenda
1. Structured text
2. Graphs
3. Pictures
4. Service Line Charts
6 12 Aug 2013
Text Blocks - Unrelated List
....................
....................
....................
....................
....................
7 12 Aug 2013
Text Blocks - Causes and Effects
..........
..........
..........
..........
..........
..........
..........
..........
..........
..........
Subtitle comes here
8 12 Aug 2013
Text Blocks - Matrix
.......... .......... ..........
.......... .......... ....................
.......... .......... ....................
.......... .......... ....................
.......... .......... ....................
Subtitle comes here
9 12 Aug 2013
Text Blocks - Cause and Effect
..........
..........
..........
..........
Subtitle comes here
1012 Aug 2013
Text Blocks - Sequence of Causes and Effects
.......... .......... ..........
..............................
Subtitle comes here
1112 Aug 2013
Text - Sequential Vertical
• .....
• .....
• .....
• .....
• .....
• .....
• .....
• .....
.....
.....
.....
.....
Subtitle comes here
1212 Aug 2013
Text - Making Points
.....
.....
.....
• .....
• .....
• .....
• .....
• .....
• .....
Subtitle comes here
1312 Aug 2013
Text - Bullits
.....
.....
.....
.....
.....
.....
.....
.....
..........
Subtitle comes here
1412 Aug 2013
Text Blocks - Influencing
..........
Subtitle comes here
……
……
…… ……
……
……
1512 Aug 2013
Text Blocks - Leading to
..........
..........
..........
..........
..........
Subtitle comes here
1612 Aug 2013
......
Text - Enveloping Elements
.....
.....
.....
.....
.....
.....
..........
Subtitle comes here
1712 Aug 2013
Text Blocks - Elements Leading To
.......... .......... ..........
.......... .......... ..........
.......... .......... ..........
..........
Subtitle comes here
…
1812 Aug 2013
Text Blocks - Resulting From
..........
Subtitle comes here
……
……
……
……
……
……
……
1912 Aug 2013
Text - Interrelations
..........…… ……
.......... ..........
.......... ..........
Subtitle comes here
2012 Aug 2013
Multiple Boxes
......
......
......
......
......
......
..........
......
......
......
......
......
......
..........
......
......
......
......
......
......
..........
......
......
......
......
......
......
..........
......
......
......
......
......
......
..........
......
......
......
......
......
......
..........
2112 Aug 2013
Org Chart
..........
..........
..........
..........
..........
..........
....................
..........
..........
..........
..........
..........
..........
..........
..........
..........
..........
..........
..........
..........
..........
..........
Subtitle comes here
2212 Aug 2013
Logic Tree - One Level Plus Text
..........
........
..........
..........
..........
• ......
• ......
• ......
• ......
• ......
• ......
• ......
• ......
• ......
• ......
• ......
• ......
Subtitle comes here
2312 Aug 2013
Logic Tree - Two Levels
..........
..........
..........
..........
..........
..........
..........
Subtitle comes here
2412 Aug 2013
Logic Tree - Vertical
..........
.......... .......... .......... .......... .......... .......... .......... .......... ..........
.......... .......... ..........
Subtitle comes here
2512 Aug 2013
Driver Tree - Arrows Showing Trend
..........
..........
..........
..........
..........
..........
..........
..........
..........
...............
.....
.....
.....
.....
.....
.....
.....
.....
.....
Subtitle comes here
2612 Aug 2013
Driver Tree - Arrows Showing Base Trends
..........
..........
..........
..........
..........
..........
..........
..........
..... ..... .....
......
..........
Subtitle comes here
2712 Aug 2013
Driver Tree - Moons Showing Base Trends
..........
..........
..........
..........
..........
..........
..... ..... ..... ..... .....
strong weak
Subtitle comes here
2812 Aug 2013
Driver Tree - Text with General Trends
.....
.....
.....
.....
.....
.....
..........
..........
..........
..........
..........
..........
..........
..........
..........
Subtitle comes here
2912 Aug 2013
Driver Tree - Expanded Text
..........
..........
.......... ..........
..........
..........
..........
..........
..........
..........
..........
..........
..... ..........
• .....
• ...
.....
• .....
.....
3012 Aug 2013
Range of possible outcomes
Uncertainties
.....
.....
.....
.......... .................... ..........
Range of Outcomes
.......... .......... ..........
.......... .................... ..........
..... .......... ..........
Subtitle comes here
3112 Aug 2013
Standard Table - bulleted cells
Subtitle comes here
Column
heading
Column heading Column heading Column heading
•Enter text •Enter text •Enter text
3212 Aug 2013
Standard Table Layout
Subtitle comes here
Column heading Column heading Column heading Column heading
3312 Aug 2013
Agenda
1. Structured text
2. Graphs
3. Pictures
4. Service Line Charts
3412 Aug 2013
Bar Chart - Stacked
0 50 100 150 200
East
West
North
Source: ....
Units
Charttitle comes here
3512 Aug 2013
Bar Chart - Two Stacked
0 50 100 150 200
East
West
North
Source: ....
Units
Charttitle comes here
0 50 100 150 200
East
West
North
Units
Charttitle comes here
3612 Aug 2013
Bar Chart - Three Stacked
0 50 100 150 200
East
West
North
Source: ....
Units
Charttitle comes here
0 50 100 150 200
East
West
North
Units
Charttitle comes here
0 50 100 150 200
East
West
North
Units
Charttitle comes here
3712 Aug 2013
0 10 20 30
A
B
C
D
E
Bar Chart - Four Parallel
Source: ....
Units
Charttitle comes here
0 10 20 30
A
B
C
D
E
Units
Charttitle comes here
0 10 20 30
A
B
C
D
E
Units
Charttitle comes here
0 10 20 30
A
B
C
D
E
Units
Charttitle comes here
3812 Aug 2013
Bar Chart - Paired
0 20 40 60
East
West
North
Source: ....
Units
Charttitle comes here
3912 Aug 2013
Bar Chart - Two Paired
0 20 40 60
East
West
North
Source: ....
Units
Charttitle comes here
0 20 40 60
East
West
North
Units
Charttitle comes here
4012 Aug 2013
Column Chart - Stacked
0
50
100
150
200
East West North
Source: ....
Units
Charttitle comes here
4112 Aug 2013
Column Chart - Two Stacked
0
50
100
150
200
East West North
Source: ....
Units
Charttitle comes here
0
50
100
150
200
East West North
Units
Charttitle comes here
4212 Aug 2013
Column Chart - Paired
0
20
40
60
East West North
Source: ....
Units
Charttitle comes here
4312 Aug 2013
Column Chart - Two Paired
Source: ....
0
20
40
60
East West North
Units
Charttitle comes here
0
20
40
60
East West North
Units
Charttitle comes here
4412 Aug 2013
Column Chart - Multiple
37
45
31 34 32 33
23 21
14
6 5
10
4 7 6
32
31
32
1 3
5
18
17
17
0
1
2 1
4
10
11
1
3 1
1
0
2000 2001 2002 2000 2001 2002 2000 2001 2002 2000 2001 2002 2000 2001 2002
E
D
C
B
A
Country
Units
Country Country Country Country
Charttitle comes here
4512 Aug 2013
Pie Chart
20
31
46
22
Source: ....
Charttitle comes here
4612 Aug 2013
Radar Chart
0
1
2
3
4
5
Criteria 1
Criteria 2
Criteria 3Criteria 4
Criteria 5
Variable 1
Variable 2
Variable 3
Variable 4
Charttitle comes here
4712 Aug 2013
Line Chart
0
50
100
0 1 2 3 4 5 6
Source: ....
Units
Units
Straight Line
Dotted Line
Green Line
Charttitle comes here
4812 Aug 2013
Line Chart - Two
0
50
100
0 2 4 6
Source: ....
Units
Units
Straight Line
Dotted Line
Green Line
Charttitle comes here
0
50
100
0 2 4 6
Units
Units
Straight Line
Dotted Line
Green Line
Charttitle comes here
4912 Aug 2013
Waterfall Chart
10
15
10 35 5
10
5
15
0
10
20
30
40
A + B + C = Subtotal - E - F - G = Total
Units
Source: ....
Charttitle comes here
5012 Aug 2013
Wave Chart
Ease of Implementation
Benefits
Wave 1
Wave 2
Wave 3
Source: ....
High
HighLow
Low
Initiative
Initiative
Initiative
Initiative
Initiative
Initiative
Charttitle comes here
5112 Aug 2013
Driver Tree Chart / Dupont Chart
24%
129%
53% 36%
-
140%
1999 2000 2001 2002 2003
6,7
25
8,2 5,3 8,5
1999 2000 2001 2002 2003
.....
.....
.....
.....
.....
.....
X
27% 31% 30% 26%
15%
1999 2000 2001 2002 2003
2% 2% 2% 2%3%
1999 2000 2001 2002 2003
22% 24% 21% 17%
29%
1999 2000 2001 2002 2003
4% 5% 6% 7%
-16%
1999 2000 2001 2002 2003
Source: ....
-/-
-/-
Subtitle comes here
5212 Aug 2013
Agenda
1. Structured text
2. Graphs
3. Pictures
4. Service Line Charts
5312 Aug 2013
Moons
strong weakSubtitle comes here
5412 Aug 2013
Traffic Lights
Negative
Neutral
Positive
Subtitle comes here
5512 Aug 2013
Arrows
Positive Neutral NegativeSubtitle comes here
5612 Aug 2013
Donuts
Company A
00 01 02 03
Company B
00 01 02 03
Company C
00 01 02 03
Company D
00 01 02 03
Criterium ..
Criterium ..
Criterium ..
Criterium ..
Criterium ..
Criterium ..
Criterium ..
strong weakSubtitle comes here
5712 Aug 2013
Timeline
Week number
Starts on
Milestone Milestone Milestone Milestone
Subtitle comes here
5812 Aug 2013
Value Chains - Loose Arrows
....................
.......... .................... ..........
..............................
.................... ..........
Subtitle comes here
5912 Aug 2013
Value Chains - Touching Arrows
Subtitle comes here
6012 Aug 2013
Interrelated Stages
.....
..........
..........
..........
..........
.....
.....
.....
.....
.....
.....
Subtitle comes here
6112 Aug 2013
Movements
.......... .......... .......... .......... ..........
Subtitle comes here
6212 Aug 2013
Circle - Overlapping Arrows
......
.....
......
......
.....
......
Virtuous Vicious
Subtitle comes here
6312 Aug 2013
Circle - Integrated Arrows
.....
....
....
....
....
....
....
.....
....
....
....
....
....
....
Virtuous Vicious
Subtitle comes here
6412 Aug 2013
Closed Loop
........
........
........
........
........
Subtitle comes here
6512 Aug 2013
Process Ending in a Closed Loop
Subtitle comes here
6612 Aug 2013
Wheel of Fortune
Subtitle comes here
6712 Aug 2013
Puzzle - Four Pieces Fitting Together
Subtitle comes here
6812 Aug 2013
Puzzle - Five Pieces Fitting Together
Subtitle comes here
6912 Aug 2013
Puzzle - Pieces Not Fitting Together
Subtitle comes here
7012 Aug 2013
Puzzle - Pieces Might Fit Together
Subtitle comes here
7112 Aug 2013
Quotes
Subtitle comes here
7212 Aug 2013
Circles of Influence
Subtitle comes here
7312 Aug 2013
Eggs
.....
.....
.....
..........
.....
.....
.....
Subtitle comes here
7412 Aug 2013
Circles - Interrelated
..... .....
.....
Subtitle comes here
7512 Aug 2013
Circles - Overlapping
Subtitle comes here
7612 Aug 2013
Expansion
....
....
....
....
• ....
• .....
• ....
• .....
• ....
• .....
• ....
• .....
Subtitle comes here
7712 Aug 2013
Cube
Subtitle comes here
7812 Aug 2013
Maps - Netherlands
Subtitle comes here
7912 Aug 2013
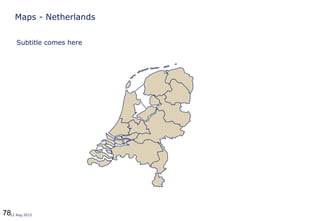
Maps - Western Europe, The World
[ ungroup to select countries ]
Subtitle comes here
8012 Aug 2013
Life Cycle - Generic
Units sold
Time since launch
Product A
Product B
Product C
Product D
Subtitle comes here
8112 Aug 2013
Life Cycle - Countries
Emerging Mature
Development
Stage
Netherlands
Sweden
U.K.
France
Italy
Germany
Subtitle comes here
8212 Aug 2013
Cost Curve
Cost/unit
Cumulative Volume
.....
.....
..... .....
Subtitle comes here
8312 Aug 2013
Downward and upward slopes
11
22
33
Time
33
22
11
Time
Subtitle comes here
8412 Aug 2013
Recognition
For Teaching
Recognition
OfResearch
8512 Aug 2013
Funnels
Subtitle comes here
8612 Aug 2013
Building blocks
Subtitle comes here
8712 Aug 2013
Spectrum
..... .....
.....
.....
..... ..... .....
Low High
Subtitle comes here
8812 Aug 2013
Balance
..... .....
Subtitle comes here
8912 Aug 2013
Cross
.....
.....
.....
.....
Subtitle comes here
9012 Aug 2013
Pyramid
.......
.....
.....
Subtitle comes here
9112 Aug 2013
History
x x x x x 2005x x x x x 2005
Subtitle comes here
9212 Aug 2013
Trackers - Place in Top Right Corner of Slide
Subtitle comes here
9312 Aug 2013
Agenda
1. Structured text
2. Graphs
3. Pictures
4. Service Line Charts
9412 Aug 2013
Generic Strategy Development Framework - English
Environmental
Analysis
Environmental
Analysis
Business
Imperatives
Business
Imperatives
Business
Definition
Business
Constraints
Business
Imperatives
Business
Imperatives
External
Analysis
Internal
Analysis
Key
Insights
Key
Insights
Future
Industry
Scenarios
Future
Industry
Scenarios
Future
Industry
Scenarios
Future
Industry
Scenarios
Strategic Options
Analysis
Strategic Options
Analysis
Strategy
Implementation
Strategy
Implementation
Implement
Action
Plans
Monitor
Action
Plans
Actie-
plannen
Actie-
plannen
Strategic
Options
Risk and
Reward
Strategic
Direction
Strategic
Direction
Reassess the Business Imperatives
Desk Research
and Interviews
Desk Research
and Interviews
Interviews and
Workshops
Interviews and
Workshops
Workshops and AnalysesWorkshops and Analyses
Business Plan
Writing
Business Plan
Writing
Cre
a-
tivit
y
Cre
a-
tivit
y
Subtitle comes here
9512 Aug 2013
Generic Strategy Development Framework - Dutch
Externe en interne
analyse
Externe en interne
analyse
Bepaling
uitgangspunten
Bepaling
uitgangspunten
Missie en
Visie
Rand-
voorwaar-
den
Uitgangs-
punten
Uitgangs-
punten
Externe
Analyse
Interne
Analyse
InzichtInzicht
Future
Industry
Scenarios
Future
Industry
Scenarios
ScenariosScenarios
Strategische keuzeStrategische keuze ImplementatieImplementatie
Plannen
Meet-
punten
Actie-
plannen
Actie-
plannen
Strategi-
sche
opties
Rende-
ment en
risico’s
StrategieStrategie
Heroverweeg de uitgangspunten
Desk research en
interviews
Desk research en
interviews
Interviews en
workshops
Interviews en
workshops
Workshops en analysesWorkshops en analyses
Uitwerking
plannen
Uitwerking
plannen
Creat
i-
viteit
Creat
i-
viteit
Subtitle comes here
9612 Aug 2013
Strategy Development - The Fish
Chosen
Strategy
Chosen
Strategy
Projects &
Resources
Projects &
Resources
MonitoringMonitoring
Financial PositionFinancial Position
Strategic PositionStrategic Position
Capital MarketCapital Market
Economic
Profitability
Economic
Profitability
GrowthGrowth
Commercial MarketCommercial Market
Market
Attractiveness
Market
Attractiveness
Competitive
Position
Competitive
Position
InsightInsight
CSFs
& KPIs
CSFs
& KPIs
Strategic
Issues
Strategic
Issues
Scope
& Context
Scope
& Context
CreativityCreativity
Scenarios
& Options
Scenarios
& Options
Subtitle comes here
9712 Aug 2013
Strategy Development - The Loop
CAPITAL MARKETCAPITAL MARKET
MANAGED
PERFORMANCE
MANAGED
PERFORMANCE
Strategy ExecutionStrategy Formulation
Dynamic Strategy
COMMERCIAL
MARKET
COMMERCIAL
MARKET
STRUCTURE &
RESOURCES
STRUCTURE &
RESOURCES
Strategic PositionStrategic PositionStrategic Position
Competitive PositionCompetitive PositionMarket AttractivenessMarket Attractiveness
Scope & ContextScope & Context
Strategic IssuesStrategic Issues
Insight
Value
Creation
Financial PositionFinancial Position
GrowthGrowthEconomic ProfitabilityEconomic Profitability
Critical Success Factors & Key Performance IndicatorsCritical Success Factors & Key Performance Indicators
Performance Monitoring & Incentive CompensationPerformance Monitoring & Incentive Compensation
Organizational ArchitectureOrganizational Architecture
Projects & ResourcesProjects & Resources
Chosen
Strategy
Scenarios & OptionsScenarios & Options
CreativityCreativity
Subtitle comes here
9812 Aug 2013
Backward Strategic Planning Framework
TIME
GOAL
Actions driven
by strategy
Where are
we now?
Mission: Why are we
in business?
Mission: Why are we
in business?
Values: What are
our enduring
principles and
beliefs?
Values: What are
our enduring
principles and
beliefs?
Vision: Where do we
want to be in
2010?
Vision: Where do we
want to be in
2010?
Strategy: How do
we get there?
Strategy: How do
we get there?
Subtitle comes here
9912 Aug 2013
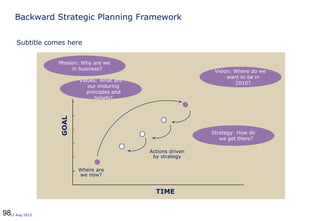
Incremental versus Dynamic Strategic Planning Framework
Versus
Incremental Planning Process Dynamic Strategic Planning Process
Incrementalism
[One reason why companies
stagnate]
Incrementalism
[One reason why companies
stagnate]
TIME
GOAL
Where we
are now?
Actions taken in
response to
circumstances
Where can we be
next year?
Focus
[One reason why companies grow]
Focus
[One reason why companies grow]
TIME
GOAL
Actions driven by strategy
Where are
we now?
Vision of where we
need to be five years
from now
10012 Aug 2013
Strategic Disciplines
.......... ..........
..........
…
Subtitle comes here
…
10112 Aug 2013
Activity Map - Generic
.....
.....
.....
.....
.....
.....
.....
Advantaged
Neutral
Disadvantaged
.....
.....
.....
.....
.....
.....
.....
.....
.....
.....
.....
.....
.....
.....
.....
.....
.....
.....
.....
.....
.....
.....
.....
.....
.....
.....
.....
.....
.....
.....
.....
.....
.....
.....
.....
.....
.....
.....
.....
.....
.....
.....
Subtitle comes here
10212 Aug 2013
Activity Map - Very Detailed
Geographic
markets
Distribution
channel
Customer
End use
Industry
System design
/Application
engineering
Installation
Service
Customised Standard
Sub-systems
Food packaging
Canning Bottling
System Sales force OEM Direct Independen
t
Agent
MNC Regional National
N.America L.America W.Europe E.Europe Middle East
& Africa
Asia Japan Australasia
Liquid Hybrid Dry Processed
Pumps Valves HomogenisersTubular
heat
exchangers
Food Processing
Evaporator
s
Tanks
Other
Ohmic
heaters
Freezers &
Refrigerators
Plate heat
exchangers
Separators Air
treatment
Automation
Wrapping
Dryers Cartoning
Systems
Subcontractor
management
3rd party
maintenance
Upgrades/
modifications
Contract Time/mater
ial
Own
maintenance
Conveyer
systems
Aseptic
processing
systems
Blow
moulding
equipment
Filtration
equipment
Thermal &
energy
technology
Control
systems
Sealing
Labelling
Global
Standard
Dairy Brewing Soft drinks Juices Cheese Ice Cream Baked Snacks/
Confectionery
CerealsSoups/sauces Baby Food Oil/fats/mar
garines
Project
management
Filling
lines
New
business
strengths
Installed
base
strengths
Canning BottlingPumps Valves HomogenisersTubular
heat
exchangers
Evaporator
s
TanksOhmic
heaters
Plate heat
exchangers
Separators
Wrapping
Dryers Cartoning
Sealing
Labelling
Filling
lines
Convenience
food
Customer
DIY
Spare
parts
Freezers &
Refrigerators
AutomationConveyer
systems
Aseptic
processing
systems
Blow
moulding
equipment
Filtration
equipment
Control
systems
Strong position
Average
Weak position
No position
10312 Aug 2013
Activity Map - Competitor Overview
..... ..........
.....
.....
Advantaged Neutral
.....
.....
.....
.....
.....
.....
.....
.....
.....
Disadvantaged
Subtitle comes here
10412 Aug 2013
Activity Map - Synergy Analysis
.....
.....
.....
..... .....
..........
..... .....
..... .....
..... .....
.....
..... ..... ..... .....
..... ..... .....
..... ..... .......... ..... .....
Advantaged
Disadvantaged
NM
A
Average
..... .....
.....
.....
.....
.....
.....
.....
.....
.....
BSubtitle comes here
10512 Aug 2013
Activity Map - Synergy Summary
A B NewCo
+ =
Advantaged
Disadvantaged
NM
Average
.....
.....
.....
.....
.....
.....
.....
.....
.....
Subtitle comes here
10612 Aug 2013
Activity Map - Ranges of Activities Across Value Chain
.......... .......... .......... ..........
.......... .......... ..........
........................................
........................................ ..........
.......... ..........
Stage ..
.......... .......... .......... ..........
..........Stage ..
Stage ..
Stage ..
Stage ..
Stage ..
.......... ..........
Subtitle comes here
10712 Aug 2013
Activity Map - Competitive Groups
Activity
Competitive Group
(sample companies)
• ...
• ...
Competitive advantage
Activity
Activity
Activity
Activity
Activity
Competitive Group
(sample companies)
• ...
• ...
Activity
Activity
Activity
Activity
Activity
Competitive Group
(sample companies)
• ...
• ...
Competitive advantage
Activity
Activity
Activity
Activity
Activity
Competitive Group
(sample companies)
• ...
• ...
Activity
Activity
Activity
Activity
Subtitle comes here
10812 Aug 2013
Portfolio Matrix
Competitive Position
(Returns compared to Industry Average)
MarketAttractiveness
(IndustryAverageReturnsabove
CostofCapital)
ROCE > CoC
ROCE < CoC
RO
CE
=
C
oC
high
low
low high
Charttitle comes here
10912 Aug 2013
Five Forces
Competitors
CustomersSuppliers
Substitutes
New Entrants
Strong
Moderate
Weak
Subtitle comes here
11012 Aug 2013
Document Control - For Internal Use Only
Version
Date of
Release
Writer
Approver(s)
(if relevant)
Comments on Major Changes from Previous
Release
1 26-1-2005 Randy Jagt Vincent Oomes Fonts and colors in new global template
2 30-1-2005 Randy Jagt Vincent Oomes Change of colors
Document Title Timesaver 2005
Document Owner Randy Jagt
Approver(s) Vincent Oomes, Bert Vries

MBA

  • 1.
  • 2.
    2 12 Aug2013 Introduction • This file ‘PowerPoint Timesaver’ contains a large number of preformatted dummy slides that are ready to be copied and pasted onto your own presentation for further processing, thereby – dramatically reducing lay-outing and formatting time – ensuring consistency of lay-out throughout your presentation • The structure of the slides is conform: – Headings: 20 points Bold Verdana – Sub-headings 16 points Verdana – Bullet slides according to template (automatic), jump-in with Tab, jump-back with Shift-Tab – Text 14, 12 or 10 points Verdana – Footnotes 8 points Verdana * Excluding special charts (Bubble, Merrimekko, Skyline, Brickyard etc.); these are available to licensed practitioners through the StratBridge ‘Strategic Surveyor’ tool
  • 3.
    3 12 Aug2013 Generic Blocks, Circles and Arrows - Copy/Paste the Objects Below or Use the Paint Brush on the Formatting Toolbar to Copy Colors onto Other Objects 11 11 Standard Dark Blue RGB Code: 51 - 102 -153 Standard Light Blue RGB Code: 222 - 211 - 182 Green RGB Code: 153 - 204 - 000 Preferred Colors 11
  • 4.
    4 12 Aug2013 All charts in this document comply to this global PowerPoint palette R = 9 G = 29 B = 93 R = 156 G = 209 B = 0 R = 221 G = 210 B = 181 Primary colours Highlight colors using standard PowerPoint palette (charts & diagrams) To be used as an accent or highlight color only To be used as a background color behind charts and graphs only The color palette has been adjusted in PowerPoint to allow for better onscreen projection R = 161 G = 61 B = 58 R = 89 G = 110 B = 110 R = 102 G = 51 B = 104 R = 145 G = 125 B = 74 R = 151 G = 115 B = 174 R = 220 G = 130 B = 64 R = 87 G = 125 B = 61 R = 84 G = 156 B = 181
  • 5.
    5 12 Aug2013 Agenda 1. Structured text 2. Graphs 3. Pictures 4. Service Line Charts
  • 6.
    6 12 Aug2013 Text Blocks - Unrelated List .................... .................... .................... .................... ....................
  • 7.
    7 12 Aug2013 Text Blocks - Causes and Effects .......... .......... .......... .......... .......... .......... .......... .......... .......... .......... Subtitle comes here
  • 8.
    8 12 Aug2013 Text Blocks - Matrix .......... .......... .......... .......... .......... .................... .......... .......... .................... .......... .......... .................... .......... .......... .................... Subtitle comes here
  • 9.
    9 12 Aug2013 Text Blocks - Cause and Effect .......... .......... .......... .......... Subtitle comes here
  • 10.
    1012 Aug 2013 TextBlocks - Sequence of Causes and Effects .......... .......... .......... .............................. Subtitle comes here
  • 11.
    1112 Aug 2013 Text- Sequential Vertical • ..... • ..... • ..... • ..... • ..... • ..... • ..... • ..... ..... ..... ..... ..... Subtitle comes here
  • 12.
    1212 Aug 2013 Text- Making Points ..... ..... ..... • ..... • ..... • ..... • ..... • ..... • ..... Subtitle comes here
  • 13.
    1312 Aug 2013 Text- Bullits ..... ..... ..... ..... ..... ..... ..... ..... .......... Subtitle comes here
  • 14.
    1412 Aug 2013 TextBlocks - Influencing .......... Subtitle comes here …… …… …… …… …… ……
  • 15.
    1512 Aug 2013 TextBlocks - Leading to .......... .......... .......... .......... .......... Subtitle comes here
  • 16.
    1612 Aug 2013 ...... Text- Enveloping Elements ..... ..... ..... ..... ..... ..... .......... Subtitle comes here
  • 17.
    1712 Aug 2013 TextBlocks - Elements Leading To .......... .......... .......... .......... .......... .......... .......... .......... .......... .......... Subtitle comes here …
  • 18.
    1812 Aug 2013 TextBlocks - Resulting From .......... Subtitle comes here …… …… …… …… …… …… ……
  • 19.
    1912 Aug 2013 Text- Interrelations ..........…… …… .......... .......... .......... .......... Subtitle comes here
  • 20.
    2012 Aug 2013 MultipleBoxes ...... ...... ...... ...... ...... ...... .......... ...... ...... ...... ...... ...... ...... .......... ...... ...... ...... ...... ...... ...... .......... ...... ...... ...... ...... ...... ...... .......... ...... ...... ...... ...... ...... ...... .......... ...... ...... ...... ...... ...... ...... ..........
  • 21.
    2112 Aug 2013 OrgChart .......... .......... .......... .......... .......... .......... .................... .......... .......... .......... .......... .......... .......... .......... .......... .......... .......... .......... .......... .......... .......... .......... Subtitle comes here
  • 22.
    2212 Aug 2013 LogicTree - One Level Plus Text .......... ........ .......... .......... .......... • ...... • ...... • ...... • ...... • ...... • ...... • ...... • ...... • ...... • ...... • ...... • ...... Subtitle comes here
  • 23.
    2312 Aug 2013 LogicTree - Two Levels .......... .......... .......... .......... .......... .......... .......... Subtitle comes here
  • 24.
    2412 Aug 2013 LogicTree - Vertical .......... .......... .......... .......... .......... .......... .......... .......... .......... .......... .......... .......... .......... Subtitle comes here
  • 25.
    2512 Aug 2013 DriverTree - Arrows Showing Trend .......... .......... .......... .......... .......... .......... .......... .......... .......... ............... ..... ..... ..... ..... ..... ..... ..... ..... ..... Subtitle comes here
  • 26.
    2612 Aug 2013 DriverTree - Arrows Showing Base Trends .......... .......... .......... .......... .......... .......... .......... .......... ..... ..... ..... ...... .......... Subtitle comes here
  • 27.
    2712 Aug 2013 DriverTree - Moons Showing Base Trends .......... .......... .......... .......... .......... .......... ..... ..... ..... ..... ..... strong weak Subtitle comes here
  • 28.
    2812 Aug 2013 DriverTree - Text with General Trends ..... ..... ..... ..... ..... ..... .......... .......... .......... .......... .......... .......... .......... .......... .......... Subtitle comes here
  • 29.
    2912 Aug 2013 DriverTree - Expanded Text .......... .......... .......... .......... .......... .......... .......... .......... .......... .......... .......... .......... ..... .......... • ..... • ... ..... • ..... .....
  • 30.
    3012 Aug 2013 Rangeof possible outcomes Uncertainties ..... ..... ..... .......... .................... .......... Range of Outcomes .......... .......... .......... .......... .................... .......... ..... .......... .......... Subtitle comes here
  • 31.
    3112 Aug 2013 StandardTable - bulleted cells Subtitle comes here Column heading Column heading Column heading Column heading •Enter text •Enter text •Enter text •Enter text •Enter text •Enter text •Enter text •Enter text •Enter text •Enter text •Enter text •Enter text •Enter text •Enter text •Enter text •Enter text •Enter text •Enter text •Enter text •Enter text •Enter text •Enter text •Enter text •Enter text
  • 32.
    3212 Aug 2013 StandardTable Layout Subtitle comes here Column heading Column heading Column heading Column heading
  • 33.
    3312 Aug 2013 Agenda 1.Structured text 2. Graphs 3. Pictures 4. Service Line Charts
  • 34.
    3412 Aug 2013 BarChart - Stacked 0 50 100 150 200 East West North Source: .... Units Charttitle comes here
  • 35.
    3512 Aug 2013 BarChart - Two Stacked 0 50 100 150 200 East West North Source: .... Units Charttitle comes here 0 50 100 150 200 East West North Units Charttitle comes here
  • 36.
    3612 Aug 2013 BarChart - Three Stacked 0 50 100 150 200 East West North Source: .... Units Charttitle comes here 0 50 100 150 200 East West North Units Charttitle comes here 0 50 100 150 200 East West North Units Charttitle comes here
  • 37.
    3712 Aug 2013 010 20 30 A B C D E Bar Chart - Four Parallel Source: .... Units Charttitle comes here 0 10 20 30 A B C D E Units Charttitle comes here 0 10 20 30 A B C D E Units Charttitle comes here 0 10 20 30 A B C D E Units Charttitle comes here
  • 38.
    3812 Aug 2013 BarChart - Paired 0 20 40 60 East West North Source: .... Units Charttitle comes here
  • 39.
    3912 Aug 2013 BarChart - Two Paired 0 20 40 60 East West North Source: .... Units Charttitle comes here 0 20 40 60 East West North Units Charttitle comes here
  • 40.
    4012 Aug 2013 ColumnChart - Stacked 0 50 100 150 200 East West North Source: .... Units Charttitle comes here
  • 41.
    4112 Aug 2013 ColumnChart - Two Stacked 0 50 100 150 200 East West North Source: .... Units Charttitle comes here 0 50 100 150 200 East West North Units Charttitle comes here
  • 42.
    4212 Aug 2013 ColumnChart - Paired 0 20 40 60 East West North Source: .... Units Charttitle comes here
  • 43.
    4312 Aug 2013 ColumnChart - Two Paired Source: .... 0 20 40 60 East West North Units Charttitle comes here 0 20 40 60 East West North Units Charttitle comes here
  • 44.
    4412 Aug 2013 ColumnChart - Multiple 37 45 31 34 32 33 23 21 14 6 5 10 4 7 6 32 31 32 1 3 5 18 17 17 0 1 2 1 4 10 11 1 3 1 1 0 2000 2001 2002 2000 2001 2002 2000 2001 2002 2000 2001 2002 2000 2001 2002 E D C B A Country Units Country Country Country Country Charttitle comes here
  • 45.
    4512 Aug 2013 PieChart 20 31 46 22 Source: .... Charttitle comes here
  • 46.
    4612 Aug 2013 RadarChart 0 1 2 3 4 5 Criteria 1 Criteria 2 Criteria 3Criteria 4 Criteria 5 Variable 1 Variable 2 Variable 3 Variable 4 Charttitle comes here
  • 47.
    4712 Aug 2013 LineChart 0 50 100 0 1 2 3 4 5 6 Source: .... Units Units Straight Line Dotted Line Green Line Charttitle comes here
  • 48.
    4812 Aug 2013 LineChart - Two 0 50 100 0 2 4 6 Source: .... Units Units Straight Line Dotted Line Green Line Charttitle comes here 0 50 100 0 2 4 6 Units Units Straight Line Dotted Line Green Line Charttitle comes here
  • 49.
    4912 Aug 2013 WaterfallChart 10 15 10 35 5 10 5 15 0 10 20 30 40 A + B + C = Subtotal - E - F - G = Total Units Source: .... Charttitle comes here
  • 50.
    5012 Aug 2013 WaveChart Ease of Implementation Benefits Wave 1 Wave 2 Wave 3 Source: .... High HighLow Low Initiative Initiative Initiative Initiative Initiative Initiative Charttitle comes here
  • 51.
    5112 Aug 2013 DriverTree Chart / Dupont Chart 24% 129% 53% 36% - 140% 1999 2000 2001 2002 2003 6,7 25 8,2 5,3 8,5 1999 2000 2001 2002 2003 ..... ..... ..... ..... ..... ..... X 27% 31% 30% 26% 15% 1999 2000 2001 2002 2003 2% 2% 2% 2%3% 1999 2000 2001 2002 2003 22% 24% 21% 17% 29% 1999 2000 2001 2002 2003 4% 5% 6% 7% -16% 1999 2000 2001 2002 2003 Source: .... -/- -/- Subtitle comes here
  • 52.
    5212 Aug 2013 Agenda 1.Structured text 2. Graphs 3. Pictures 4. Service Line Charts
  • 53.
    5312 Aug 2013 Moons strongweakSubtitle comes here
  • 54.
    5412 Aug 2013 TrafficLights Negative Neutral Positive Subtitle comes here
  • 55.
    5512 Aug 2013 Arrows PositiveNeutral NegativeSubtitle comes here
  • 56.
    5612 Aug 2013 Donuts CompanyA 00 01 02 03 Company B 00 01 02 03 Company C 00 01 02 03 Company D 00 01 02 03 Criterium .. Criterium .. Criterium .. Criterium .. Criterium .. Criterium .. Criterium .. strong weakSubtitle comes here
  • 57.
    5712 Aug 2013 Timeline Weeknumber Starts on Milestone Milestone Milestone Milestone Subtitle comes here
  • 58.
    5812 Aug 2013 ValueChains - Loose Arrows .................... .......... .................... .......... .............................. .................... .......... Subtitle comes here
  • 59.
    5912 Aug 2013 ValueChains - Touching Arrows Subtitle comes here
  • 60.
    6012 Aug 2013 InterrelatedStages ..... .......... .......... .......... .......... ..... ..... ..... ..... ..... ..... Subtitle comes here
  • 61.
    6112 Aug 2013 Movements .................... .......... .......... .......... Subtitle comes here
  • 62.
    6212 Aug 2013 Circle- Overlapping Arrows ...... ..... ...... ...... ..... ...... Virtuous Vicious Subtitle comes here
  • 63.
    6312 Aug 2013 Circle- Integrated Arrows ..... .... .... .... .... .... .... ..... .... .... .... .... .... .... Virtuous Vicious Subtitle comes here
  • 64.
    6412 Aug 2013 ClosedLoop ........ ........ ........ ........ ........ Subtitle comes here
  • 65.
    6512 Aug 2013 ProcessEnding in a Closed Loop Subtitle comes here
  • 66.
    6612 Aug 2013 Wheelof Fortune Subtitle comes here
  • 67.
    6712 Aug 2013 Puzzle- Four Pieces Fitting Together Subtitle comes here
  • 68.
    6812 Aug 2013 Puzzle- Five Pieces Fitting Together Subtitle comes here
  • 69.
    6912 Aug 2013 Puzzle- Pieces Not Fitting Together Subtitle comes here
  • 70.
    7012 Aug 2013 Puzzle- Pieces Might Fit Together Subtitle comes here
  • 71.
  • 72.
    7212 Aug 2013 Circlesof Influence Subtitle comes here
  • 73.
  • 74.
    7412 Aug 2013 Circles- Interrelated ..... ..... ..... Subtitle comes here
  • 75.
    7512 Aug 2013 Circles- Overlapping Subtitle comes here
  • 76.
    7612 Aug 2013 Expansion .... .... .... .... •.... • ..... • .... • ..... • .... • ..... • .... • ..... Subtitle comes here
  • 77.
  • 78.
    7812 Aug 2013 Maps- Netherlands Subtitle comes here
  • 79.
    7912 Aug 2013 Maps- Western Europe, The World [ ungroup to select countries ] Subtitle comes here
  • 80.
    8012 Aug 2013 LifeCycle - Generic Units sold Time since launch Product A Product B Product C Product D Subtitle comes here
  • 81.
    8112 Aug 2013 LifeCycle - Countries Emerging Mature Development Stage Netherlands Sweden U.K. France Italy Germany Subtitle comes here
  • 82.
    8212 Aug 2013 CostCurve Cost/unit Cumulative Volume ..... ..... ..... ..... Subtitle comes here
  • 83.
    8312 Aug 2013 Downwardand upward slopes 11 22 33 Time 33 22 11 Time Subtitle comes here
  • 84.
    8412 Aug 2013 Recognition ForTeaching Recognition OfResearch
  • 85.
  • 86.
    8612 Aug 2013 Buildingblocks Subtitle comes here
  • 87.
    8712 Aug 2013 Spectrum .......... ..... ..... ..... ..... ..... Low High Subtitle comes here
  • 88.
    8812 Aug 2013 Balance .......... Subtitle comes here
  • 89.
  • 90.
  • 91.
    9112 Aug 2013 History xx x x x 2005x x x x x 2005 Subtitle comes here
  • 92.
    9212 Aug 2013 Trackers- Place in Top Right Corner of Slide Subtitle comes here
  • 93.
    9312 Aug 2013 Agenda 1.Structured text 2. Graphs 3. Pictures 4. Service Line Charts
  • 94.
    9412 Aug 2013 GenericStrategy Development Framework - English Environmental Analysis Environmental Analysis Business Imperatives Business Imperatives Business Definition Business Constraints Business Imperatives Business Imperatives External Analysis Internal Analysis Key Insights Key Insights Future Industry Scenarios Future Industry Scenarios Future Industry Scenarios Future Industry Scenarios Strategic Options Analysis Strategic Options Analysis Strategy Implementation Strategy Implementation Implement Action Plans Monitor Action Plans Actie- plannen Actie- plannen Strategic Options Risk and Reward Strategic Direction Strategic Direction Reassess the Business Imperatives Desk Research and Interviews Desk Research and Interviews Interviews and Workshops Interviews and Workshops Workshops and AnalysesWorkshops and Analyses Business Plan Writing Business Plan Writing Cre a- tivit y Cre a- tivit y Subtitle comes here
  • 95.
    9512 Aug 2013 GenericStrategy Development Framework - Dutch Externe en interne analyse Externe en interne analyse Bepaling uitgangspunten Bepaling uitgangspunten Missie en Visie Rand- voorwaar- den Uitgangs- punten Uitgangs- punten Externe Analyse Interne Analyse InzichtInzicht Future Industry Scenarios Future Industry Scenarios ScenariosScenarios Strategische keuzeStrategische keuze ImplementatieImplementatie Plannen Meet- punten Actie- plannen Actie- plannen Strategi- sche opties Rende- ment en risico’s StrategieStrategie Heroverweeg de uitgangspunten Desk research en interviews Desk research en interviews Interviews en workshops Interviews en workshops Workshops en analysesWorkshops en analyses Uitwerking plannen Uitwerking plannen Creat i- viteit Creat i- viteit Subtitle comes here
  • 96.
    9612 Aug 2013 StrategyDevelopment - The Fish Chosen Strategy Chosen Strategy Projects & Resources Projects & Resources MonitoringMonitoring Financial PositionFinancial Position Strategic PositionStrategic Position Capital MarketCapital Market Economic Profitability Economic Profitability GrowthGrowth Commercial MarketCommercial Market Market Attractiveness Market Attractiveness Competitive Position Competitive Position InsightInsight CSFs & KPIs CSFs & KPIs Strategic Issues Strategic Issues Scope & Context Scope & Context CreativityCreativity Scenarios & Options Scenarios & Options Subtitle comes here
  • 97.
    9712 Aug 2013 StrategyDevelopment - The Loop CAPITAL MARKETCAPITAL MARKET MANAGED PERFORMANCE MANAGED PERFORMANCE Strategy ExecutionStrategy Formulation Dynamic Strategy COMMERCIAL MARKET COMMERCIAL MARKET STRUCTURE & RESOURCES STRUCTURE & RESOURCES Strategic PositionStrategic PositionStrategic Position Competitive PositionCompetitive PositionMarket AttractivenessMarket Attractiveness Scope & ContextScope & Context Strategic IssuesStrategic Issues Insight Value Creation Financial PositionFinancial Position GrowthGrowthEconomic ProfitabilityEconomic Profitability Critical Success Factors & Key Performance IndicatorsCritical Success Factors & Key Performance Indicators Performance Monitoring & Incentive CompensationPerformance Monitoring & Incentive Compensation Organizational ArchitectureOrganizational Architecture Projects & ResourcesProjects & Resources Chosen Strategy Scenarios & OptionsScenarios & Options CreativityCreativity Subtitle comes here
  • 98.
    9812 Aug 2013 BackwardStrategic Planning Framework TIME GOAL Actions driven by strategy Where are we now? Mission: Why are we in business? Mission: Why are we in business? Values: What are our enduring principles and beliefs? Values: What are our enduring principles and beliefs? Vision: Where do we want to be in 2010? Vision: Where do we want to be in 2010? Strategy: How do we get there? Strategy: How do we get there? Subtitle comes here
  • 99.
    9912 Aug 2013 Incrementalversus Dynamic Strategic Planning Framework Versus Incremental Planning Process Dynamic Strategic Planning Process Incrementalism [One reason why companies stagnate] Incrementalism [One reason why companies stagnate] TIME GOAL Where we are now? Actions taken in response to circumstances Where can we be next year? Focus [One reason why companies grow] Focus [One reason why companies grow] TIME GOAL Actions driven by strategy Where are we now? Vision of where we need to be five years from now
  • 100.
    10012 Aug 2013 StrategicDisciplines .......... .......... .......... … Subtitle comes here …
  • 101.
    10112 Aug 2013 ActivityMap - Generic ..... ..... ..... ..... ..... ..... ..... Advantaged Neutral Disadvantaged ..... ..... ..... ..... ..... ..... ..... ..... ..... ..... ..... ..... ..... ..... ..... ..... ..... ..... ..... ..... ..... ..... ..... ..... ..... ..... ..... ..... ..... ..... ..... ..... ..... ..... ..... ..... ..... ..... ..... ..... ..... ..... Subtitle comes here
  • 102.
    10212 Aug 2013 ActivityMap - Very Detailed Geographic markets Distribution channel Customer End use Industry System design /Application engineering Installation Service Customised Standard Sub-systems Food packaging Canning Bottling System Sales force OEM Direct Independen t Agent MNC Regional National N.America L.America W.Europe E.Europe Middle East & Africa Asia Japan Australasia Liquid Hybrid Dry Processed Pumps Valves HomogenisersTubular heat exchangers Food Processing Evaporator s Tanks Other Ohmic heaters Freezers & Refrigerators Plate heat exchangers Separators Air treatment Automation Wrapping Dryers Cartoning Systems Subcontractor management 3rd party maintenance Upgrades/ modifications Contract Time/mater ial Own maintenance Conveyer systems Aseptic processing systems Blow moulding equipment Filtration equipment Thermal & energy technology Control systems Sealing Labelling Global Standard Dairy Brewing Soft drinks Juices Cheese Ice Cream Baked Snacks/ Confectionery CerealsSoups/sauces Baby Food Oil/fats/mar garines Project management Filling lines New business strengths Installed base strengths Canning BottlingPumps Valves HomogenisersTubular heat exchangers Evaporator s TanksOhmic heaters Plate heat exchangers Separators Wrapping Dryers Cartoning Sealing Labelling Filling lines Convenience food Customer DIY Spare parts Freezers & Refrigerators AutomationConveyer systems Aseptic processing systems Blow moulding equipment Filtration equipment Control systems Strong position Average Weak position No position
  • 103.
    10312 Aug 2013 ActivityMap - Competitor Overview ..... .......... ..... ..... Advantaged Neutral ..... ..... ..... ..... ..... ..... ..... ..... ..... Disadvantaged Subtitle comes here
  • 104.
    10412 Aug 2013 ActivityMap - Synergy Analysis ..... ..... ..... ..... ..... .......... ..... ..... ..... ..... ..... ..... ..... ..... ..... ..... ..... ..... ..... ..... ..... ..... .......... ..... ..... Advantaged Disadvantaged NM A Average ..... ..... ..... ..... ..... ..... ..... ..... ..... ..... BSubtitle comes here
  • 105.
    10512 Aug 2013 ActivityMap - Synergy Summary A B NewCo + = Advantaged Disadvantaged NM Average ..... ..... ..... ..... ..... ..... ..... ..... ..... Subtitle comes here
  • 106.
    10612 Aug 2013 ActivityMap - Ranges of Activities Across Value Chain .......... .......... .......... .......... .......... .......... .......... ........................................ ........................................ .......... .......... .......... Stage .. .......... .......... .......... .......... ..........Stage .. Stage .. Stage .. Stage .. Stage .. .......... .......... Subtitle comes here
  • 107.
    10712 Aug 2013 ActivityMap - Competitive Groups Activity Competitive Group (sample companies) • ... • ... Competitive advantage Activity Activity Activity Activity Activity Competitive Group (sample companies) • ... • ... Activity Activity Activity Activity Activity Competitive Group (sample companies) • ... • ... Competitive advantage Activity Activity Activity Activity Activity Competitive Group (sample companies) • ... • ... Activity Activity Activity Activity Subtitle comes here
  • 108.
    10812 Aug 2013 PortfolioMatrix Competitive Position (Returns compared to Industry Average) MarketAttractiveness (IndustryAverageReturnsabove CostofCapital) ROCE > CoC ROCE < CoC RO CE = C oC high low low high Charttitle comes here
  • 109.
    10912 Aug 2013 FiveForces Competitors CustomersSuppliers Substitutes New Entrants Strong Moderate Weak Subtitle comes here
  • 110.
    11012 Aug 2013 DocumentControl - For Internal Use Only Version Date of Release Writer Approver(s) (if relevant) Comments on Major Changes from Previous Release 1 26-1-2005 Randy Jagt Vincent Oomes Fonts and colors in new global template 2 30-1-2005 Randy Jagt Vincent Oomes Change of colors Document Title Timesaver 2005 Document Owner Randy Jagt Approver(s) Vincent Oomes, Bert Vries

Editor's Notes

  • #5 This color palette is reflected in the templates recently deployed in the U.S. The colors have been adjusted --from the previous templates posted on Brand Space – to allow for better onscreen and projection quality.