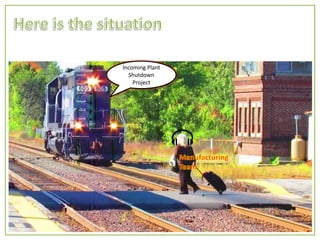
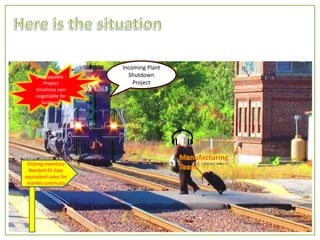
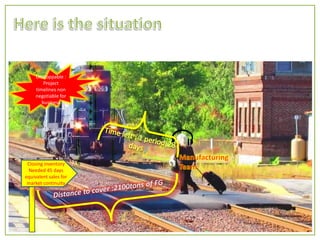
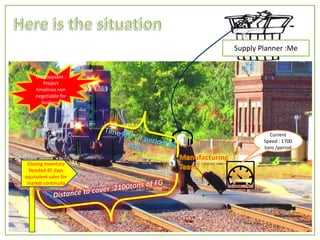
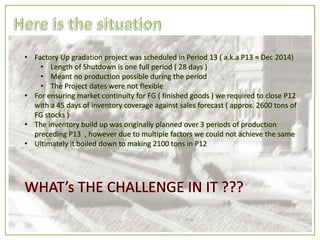
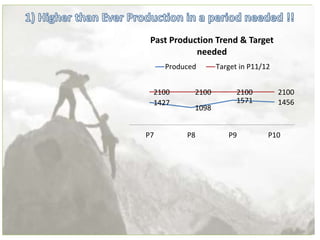
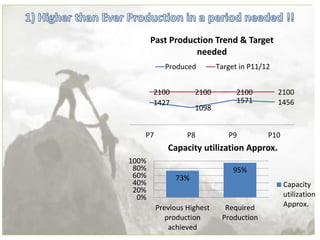
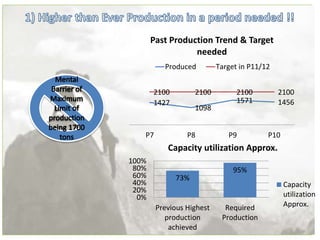
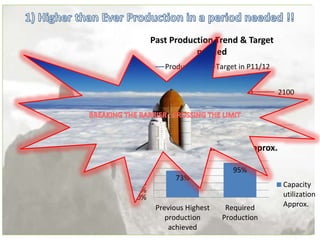
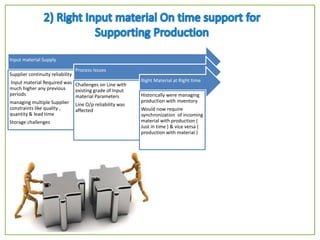
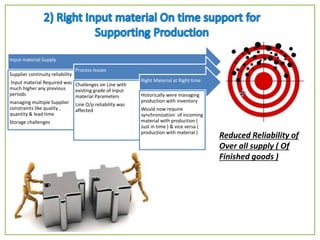
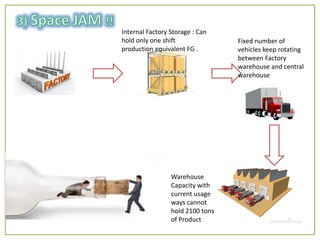
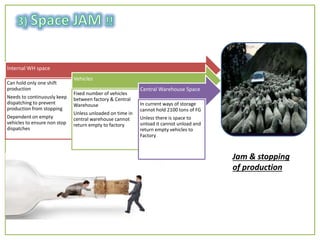
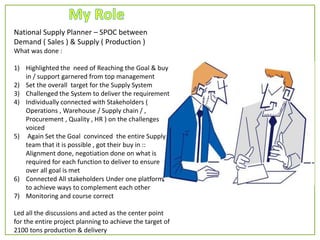
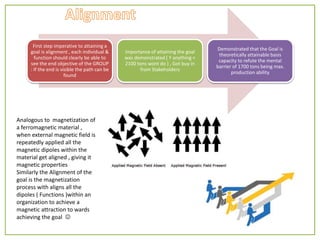
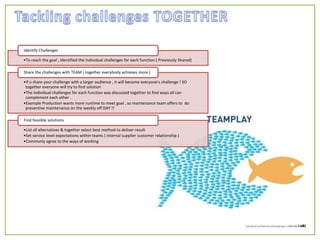
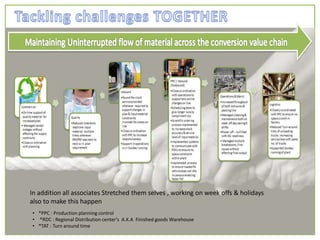
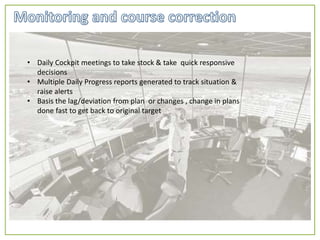
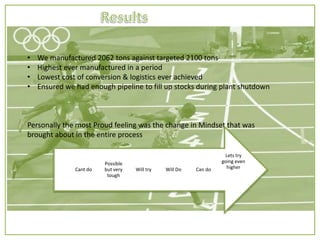
Incoming Plant
Shutdown
Project
Incoming Plant
Shutdown
Project
Unstoppable :
Project
timelines non
negotiable for
business
Closing inventory
Needed 45 days
equivalent sales for
market continuity
Unstoppable :
Project
timelines non
negotiable for
business
Closing inventory
Needed 45 days
equivalent sales for
market continuity
Closing inventory
Needed 45 days
equivalent sales for
market continuity
Unstoppable :
Project
timelines non
negotiable for
business
Current
Speed : 1700
tons /period
Supply Planner :Me
• Factory Up gradation project was scheduled in Period 13 ( a.k.a P13 ≈ Dec 2014)
• Length of Shutdown is one full period ( 28 days )
• Meant no production possible during the period
• The Project dates were not flexible
• For ensuring market continuity for FG ( finished goods ) we required to close P12
with a 45 days of inventory coverage against sales forecast ( approx. 2600 tons of
FG stocks )
• The inventory build up was originally planned over 3 periods of production
preceding P13 , however due to multiple factors we could not achieve the same
• Ultimately it boiled down to making 2100 tons in P12
1427
1098
1571 1456
2100 2100 2100 2100
P7 P8 P9 P10
Past Production Trend & Target
needed
Produced Target in P11/12
1427
1098
1571 1456
2100 2100 2100 2100
P7 P8 P9 P10
Past Production Trend & Target
needed
Produced Target in P11/12
73%
95%
0%
20%
40%
60%
80%
100%
Previous Highest
production
achieved
Required
Production
Capacity utilization Approx.
Capacity
utilization
Approx.
1427
1098
1571 1456
2100 2100 2100 2100
P7 P8 P9 P10
Past Production Trend & Target
needed
Produced Target in P11/12
73%
95%
0%
20%
40%
60%
80%
100%
Previous Highest
production
achieved
Required
Production
Capacity utilization Approx.
Capacity
utilization
Approx.
1427
1098
1571 1456
2100 2100 2100 2100
P7 P8 P9 P10
Past Production Trend & Target
needed
Produced Target in P11/12
73%
95%
0%
20%
40%
60%
80%
100%
Previous Highest
production
achieved
Required
Production
Capacity utilization Approx.
Capacity
utilization
Approx.
Input material Supply
Supplier continuity reliability
Input material Required was
much higher any previous
periods
managing multiple Supplier
constraints like quality ,
quantity & lead time
Storage challenges
Process Issues
Challenges on Line with
existing grade of Input
material Parameters
Line O/p reliability was
affected
Right Material at Right time
Historically were managing
production with inventory
Would now require
synchronization of incoming
material with production (
Just in time ) & vice versa (
production with material )
Reduced Reliability of
Over all supply ( Of
Finished goods )
Internal Factory Storage : Can
hold only one shift
production equivalent FG .
Fixed number of
vehicles keep rotating
between Factory
warehouse and central
warehouse
Warehouse
Capacity with
current usage
ways cannot
hold 2100 tons
of Product
Internal WH space
Can hold only one shift
production
Needs to continuously keep
dispatching to prevent
production from stopping
Dependent on empty
vehicles to ensure non stop
dispatches
Vehicles
Fixed number of vehicles
between factory & Central
Warehouse
Unless unloaded on time in
central warehouse cannot
return empty to factory
Central Warehouse Space
In current ways of storage
cannot hold 2100 tons of FG
Unless there is space to
unload it cannot unload and
return empty vehicles to
Factory
Jam & stopping
of production
How to
Achieve
Such High
production
Input
Material
Space
JAM
Maintain
Quality
Of
Products
Manpower
Availability
National Supply Planner – SPOC between
Demand ( Sales ) & Supply ( Production )
What was done :
1) Highlighted the need of Reaching the Goal & buy
in / support garnered from top management
2) Set the overall target for the Supply System
3) Challenged the System to deliver the requirement
4) Individually connected with Stakeholders (
Operations , Warehouse / Supply chain / ,
Procurement , Quality , HR ) on the challenges
voiced
5) Again Set the Goal convinced the entire Supply
team that it is possible , got their buy in ::
Alignment done, negotiation done on what is
required for each function to deliver to ensure
over all goal is met
6) Connected All stakeholders Under one platform
to achieve ways to complement each other
7) Monitoring and course correct
Led all the discussions and acted as the center point
for the entire project planning to achieve the target of
2100 tons production & delivery
First step imperative to attaining a
goal is alignment , each individual &
function should clearly be able to
see the end objective of the GROUP
: If the end is visible the path can be
found
importance of attaining the goal
was demonstrated ( Y anything <
2100 tons wont do ) , Got buy in
from Stakeholders
Demonstrated that the Goal is
theoretically attainable basis
capacity to refute the mental
barrier of 1700 tons being max.
production ability
Analogous to magnetization of
a ferromagnetic material ,
when external magnetic field is
repeatedly applied all the
magnetic dipoles within the
material get aligned , giving it
magnetic properties
Similarly the Alignment of the
goal is the magnetization
process with aligns all the
dipoles ( Functions )within an
organization to achieve a
magnetic attraction to wards
achieving the goal 
•To reach the goal , identified the individual challenges for each function ( Previously Shared)
Identify Challenges
•If u share your challenge with a larger audience , it will become everyone's challenge ! SO
together everyone will try to find solution
•The individual challenges for each function was discussed together to find ways all can
complement each other .
•Example Production wants more runtime to meet goal , so maintenance team offers to do
preventive maintenance on the weekly off DAY !!
Share the challenges with TEAM ( together everybody achieves more )
•List all alternatives & together select best method to deliver result
•Set service level expectations within teams ( internal supplier customer relationship )
•Commonly agree to the ways of working
Find feasible solutions
In addition all associates Stretched them selves , working on week offs & holidays
also to make this happen
• *PPC : Production planning control
• *RDC : Regional Distribution center's A.K.A Finished goods Warehouse
• *TAT : Turn around time
Common plan
•Ensured we all had the same operating plan & alignment
•Individual functional plan ( e.g. Incoming material , maintenance
schedule etc. ) were also shared with each stakeholders to
enable decision making for individual action
•Defined Success criteria & milestones in each individual
operation basis which would trigger the next course of action
• Daily Cockpit meetings to take stock & take quick responsive
decisions
• Multiple Daily Progress reports generated to track situation &
raise alerts
• Basis the lag/deviation from plan or changes , change in plans
done fast to get back to original target
• We manufactured 2062 tons against targeted 2100 tons
• Highest ever manufactured in a period
• Lowest cost of conversion & logistics ever achieved
• Ensured we had enough pipeline to fill up stocks during plant shutdown
Personally the most Proud feeling was the change in Mindset that was
brought about in the entire process
Lets try
going even
higherCan doWill DoWill try
Possible
but very
tough
Cant do
PPT on performance collaboration

PPT on performance collaboration

  • 2.
  • 3.
    Incoming Plant Shutdown Project Unstoppable : Project timelinesnon negotiable for business Closing inventory Needed 45 days equivalent sales for market continuity
  • 4.
    Unstoppable : Project timelines non negotiablefor business Closing inventory Needed 45 days equivalent sales for market continuity
  • 5.
    Closing inventory Needed 45days equivalent sales for market continuity Unstoppable : Project timelines non negotiable for business Current Speed : 1700 tons /period Supply Planner :Me
  • 6.
    • Factory Upgradation project was scheduled in Period 13 ( a.k.a P13 ≈ Dec 2014) • Length of Shutdown is one full period ( 28 days ) • Meant no production possible during the period • The Project dates were not flexible • For ensuring market continuity for FG ( finished goods ) we required to close P12 with a 45 days of inventory coverage against sales forecast ( approx. 2600 tons of FG stocks ) • The inventory build up was originally planned over 3 periods of production preceding P13 , however due to multiple factors we could not achieve the same • Ultimately it boiled down to making 2100 tons in P12
  • 7.
    1427 1098 1571 1456 2100 21002100 2100 P7 P8 P9 P10 Past Production Trend & Target needed Produced Target in P11/12
  • 8.
    1427 1098 1571 1456 2100 21002100 2100 P7 P8 P9 P10 Past Production Trend & Target needed Produced Target in P11/12 73% 95% 0% 20% 40% 60% 80% 100% Previous Highest production achieved Required Production Capacity utilization Approx. Capacity utilization Approx.
  • 9.
    1427 1098 1571 1456 2100 21002100 2100 P7 P8 P9 P10 Past Production Trend & Target needed Produced Target in P11/12 73% 95% 0% 20% 40% 60% 80% 100% Previous Highest production achieved Required Production Capacity utilization Approx. Capacity utilization Approx.
  • 10.
    1427 1098 1571 1456 2100 21002100 2100 P7 P8 P9 P10 Past Production Trend & Target needed Produced Target in P11/12 73% 95% 0% 20% 40% 60% 80% 100% Previous Highest production achieved Required Production Capacity utilization Approx. Capacity utilization Approx.
  • 11.
    Input material Supply Suppliercontinuity reliability Input material Required was much higher any previous periods managing multiple Supplier constraints like quality , quantity & lead time Storage challenges Process Issues Challenges on Line with existing grade of Input material Parameters Line O/p reliability was affected Right Material at Right time Historically were managing production with inventory Would now require synchronization of incoming material with production ( Just in time ) & vice versa ( production with material )
  • 12.
    Input material Supply Suppliercontinuity reliability Input material Required was much higher any previous periods managing multiple Supplier constraints like quality , quantity & lead time Storage challenges Process Issues Challenges on Line with existing grade of Input material Parameters Line O/p reliability was affected Right Material at Right time Historically were managing production with inventory Would now require synchronization of incoming material with production ( Just in time ) & vice versa ( production with material ) Reduced Reliability of Over all supply ( Of Finished goods )
  • 13.
    Input material Supply Suppliercontinuity reliability Input material Required was much higher any previous periods managing multiple Supplier constraints like quality , quantity & lead time Storage challenges Process Issues Challenges on Line with existing grade of Input material Parameters Line O/p reliability was affected Right Material at Right time Historically were managing production with inventory Would now require synchronization of incoming material with production ( Just in time ) & vice versa ( production with material ) Reduced Reliability of Over all supply ( Of Finished goods )
  • 14.
    Internal Factory Storage: Can hold only one shift production equivalent FG . Fixed number of vehicles keep rotating between Factory warehouse and central warehouse Warehouse Capacity with current usage ways cannot hold 2100 tons of Product
  • 15.
    Internal WH space Canhold only one shift production Needs to continuously keep dispatching to prevent production from stopping Dependent on empty vehicles to ensure non stop dispatches Vehicles Fixed number of vehicles between factory & Central Warehouse Unless unloaded on time in central warehouse cannot return empty to factory Central Warehouse Space In current ways of storage cannot hold 2100 tons of FG Unless there is space to unload it cannot unload and return empty vehicles to Factory Jam & stopping of production
  • 16.
    Internal WH space Canhold only one shift production Needs to continuously keep dispatching to prevent production from stopping Dependent on empty vehicles to ensure non stop dispatches Vehicles Fixed number of vehicles between factory & Central Warehouse Unless unloaded on time in central warehouse cannot return empty to factory Central Warehouse Space In current ways of storage cannot hold 2100 tons of FG Unless there is space to unload it cannot unload and return empty vehicles to Factory Jam & stopping of production
  • 19.
  • 20.
    National Supply Planner– SPOC between Demand ( Sales ) & Supply ( Production ) What was done : 1) Highlighted the need of Reaching the Goal & buy in / support garnered from top management 2) Set the overall target for the Supply System 3) Challenged the System to deliver the requirement 4) Individually connected with Stakeholders ( Operations , Warehouse / Supply chain / , Procurement , Quality , HR ) on the challenges voiced 5) Again Set the Goal convinced the entire Supply team that it is possible , got their buy in :: Alignment done, negotiation done on what is required for each function to deliver to ensure over all goal is met 6) Connected All stakeholders Under one platform to achieve ways to complement each other 7) Monitoring and course correct Led all the discussions and acted as the center point for the entire project planning to achieve the target of 2100 tons production & delivery
  • 22.
    First step imperativeto attaining a goal is alignment , each individual & function should clearly be able to see the end objective of the GROUP : If the end is visible the path can be found importance of attaining the goal was demonstrated ( Y anything < 2100 tons wont do ) , Got buy in from Stakeholders Demonstrated that the Goal is theoretically attainable basis capacity to refute the mental barrier of 1700 tons being max. production ability Analogous to magnetization of a ferromagnetic material , when external magnetic field is repeatedly applied all the magnetic dipoles within the material get aligned , giving it magnetic properties Similarly the Alignment of the goal is the magnetization process with aligns all the dipoles ( Functions )within an organization to achieve a magnetic attraction to wards achieving the goal 
  • 23.
    •To reach thegoal , identified the individual challenges for each function ( Previously Shared) Identify Challenges •If u share your challenge with a larger audience , it will become everyone's challenge ! SO together everyone will try to find solution •The individual challenges for each function was discussed together to find ways all can complement each other . •Example Production wants more runtime to meet goal , so maintenance team offers to do preventive maintenance on the weekly off DAY !! Share the challenges with TEAM ( together everybody achieves more ) •List all alternatives & together select best method to deliver result •Set service level expectations within teams ( internal supplier customer relationship ) •Commonly agree to the ways of working Find feasible solutions
  • 24.
    In addition allassociates Stretched them selves , working on week offs & holidays also to make this happen • *PPC : Production planning control • *RDC : Regional Distribution center's A.K.A Finished goods Warehouse • *TAT : Turn around time
  • 25.
    Common plan •Ensured weall had the same operating plan & alignment •Individual functional plan ( e.g. Incoming material , maintenance schedule etc. ) were also shared with each stakeholders to enable decision making for individual action •Defined Success criteria & milestones in each individual operation basis which would trigger the next course of action
  • 26.
    • Daily Cockpitmeetings to take stock & take quick responsive decisions • Multiple Daily Progress reports generated to track situation & raise alerts • Basis the lag/deviation from plan or changes , change in plans done fast to get back to original target
  • 27.
    • We manufactured2062 tons against targeted 2100 tons • Highest ever manufactured in a period • Lowest cost of conversion & logistics ever achieved • Ensured we had enough pipeline to fill up stocks during plant shutdown Personally the most Proud feeling was the change in Mindset that was brought about in the entire process Lets try going even higherCan doWill DoWill try Possible but very tough Cant do

Editor's Notes

  • #2 Faded background picture (Basic) To reproduce the background effects on this slide, do the following: On the Home tab, in the Slides group, click Layout and then click Blank. Right-click the slide and click Format Background. In the Format Background dialog box, click Fill in the left pane. In the Fill pane, select Picture or texture fill, and then under Insert from, click File. In the Insert Picture dialog box, select a picture, and then click Insert. Also in the Format Background dialog box, in the Fill pane, in the Transparency box, enter 85%.
  • #3 Faded background picture (Basic) To reproduce the background effects on this slide, do the following: On the Home tab, in the Slides group, click Layout and then click Blank. Right-click the slide and click Format Background. In the Format Background dialog box, click Fill in the left pane. In the Fill pane, select Picture or texture fill, and then under Insert from, click File. In the Insert Picture dialog box, select a picture, and then click Insert. Also in the Format Background dialog box, in the Fill pane, in the Transparency box, enter 85%.
  • #4 Faded background picture (Basic) To reproduce the background effects on this slide, do the following: On the Home tab, in the Slides group, click Layout and then click Blank. Right-click the slide and click Format Background. In the Format Background dialog box, click Fill in the left pane. In the Fill pane, select Picture or texture fill, and then under Insert from, click File. In the Insert Picture dialog box, select a picture, and then click Insert. Also in the Format Background dialog box, in the Fill pane, in the Transparency box, enter 85%.
  • #5 Faded background picture (Basic) To reproduce the background effects on this slide, do the following: On the Home tab, in the Slides group, click Layout and then click Blank. Right-click the slide and click Format Background. In the Format Background dialog box, click Fill in the left pane. In the Fill pane, select Picture or texture fill, and then under Insert from, click File. In the Insert Picture dialog box, select a picture, and then click Insert. Also in the Format Background dialog box, in the Fill pane, in the Transparency box, enter 85%.
  • #6 Faded background picture (Basic) To reproduce the background effects on this slide, do the following: On the Home tab, in the Slides group, click Layout and then click Blank. Right-click the slide and click Format Background. In the Format Background dialog box, click Fill in the left pane. In the Fill pane, select Picture or texture fill, and then under Insert from, click File. In the Insert Picture dialog box, select a picture, and then click Insert. Also in the Format Background dialog box, in the Fill pane, in the Transparency box, enter 85%.
  • #7 Faded background picture (Basic) To reproduce the background effects on this slide, do the following: On the Home tab, in the Slides group, click Layout and then click Blank. Right-click the slide and click Format Background. In the Format Background dialog box, click Fill in the left pane. In the Fill pane, select Picture or texture fill, and then under Insert from, click File. In the Insert Picture dialog box, select a picture, and then click Insert. Also in the Format Background dialog box, in the Fill pane, in the Transparency box, enter 85%.
  • #8 Faded background picture (Basic) To reproduce the background effects on this slide, do the following: On the Home tab, in the Slides group, click Layout and then click Blank. Right-click the slide and click Format Background. In the Format Background dialog box, click Fill in the left pane. In the Fill pane, select Picture or texture fill, and then under Insert from, click File. In the Insert Picture dialog box, select a picture, and then click Insert. Also in the Format Background dialog box, in the Fill pane, in the Transparency box, enter 85%.
  • #9 Faded background picture (Basic) To reproduce the background effects on this slide, do the following: On the Home tab, in the Slides group, click Layout and then click Blank. Right-click the slide and click Format Background. In the Format Background dialog box, click Fill in the left pane. In the Fill pane, select Picture or texture fill, and then under Insert from, click File. In the Insert Picture dialog box, select a picture, and then click Insert. Also in the Format Background dialog box, in the Fill pane, in the Transparency box, enter 85%.
  • #10 Faded background picture (Basic) To reproduce the background effects on this slide, do the following: On the Home tab, in the Slides group, click Layout and then click Blank. Right-click the slide and click Format Background. In the Format Background dialog box, click Fill in the left pane. In the Fill pane, select Picture or texture fill, and then under Insert from, click File. In the Insert Picture dialog box, select a picture, and then click Insert. Also in the Format Background dialog box, in the Fill pane, in the Transparency box, enter 85%.
  • #11 Faded background picture (Basic) To reproduce the background effects on this slide, do the following: On the Home tab, in the Slides group, click Layout and then click Blank. Right-click the slide and click Format Background. In the Format Background dialog box, click Fill in the left pane. In the Fill pane, select Picture or texture fill, and then under Insert from, click File. In the Insert Picture dialog box, select a picture, and then click Insert. Also in the Format Background dialog box, in the Fill pane, in the Transparency box, enter 85%.
  • #12 Faded background picture (Basic) To reproduce the background effects on this slide, do the following: On the Home tab, in the Slides group, click Layout and then click Blank. Right-click the slide and click Format Background. In the Format Background dialog box, click Fill in the left pane. In the Fill pane, select Picture or texture fill, and then under Insert from, click File. In the Insert Picture dialog box, select a picture, and then click Insert. Also in the Format Background dialog box, in the Fill pane, in the Transparency box, enter 85%.
  • #13 Faded background picture (Basic) To reproduce the background effects on this slide, do the following: On the Home tab, in the Slides group, click Layout and then click Blank. Right-click the slide and click Format Background. In the Format Background dialog box, click Fill in the left pane. In the Fill pane, select Picture or texture fill, and then under Insert from, click File. In the Insert Picture dialog box, select a picture, and then click Insert. Also in the Format Background dialog box, in the Fill pane, in the Transparency box, enter 85%.
  • #14 Faded background picture (Basic) To reproduce the background effects on this slide, do the following: On the Home tab, in the Slides group, click Layout and then click Blank. Right-click the slide and click Format Background. In the Format Background dialog box, click Fill in the left pane. In the Fill pane, select Picture or texture fill, and then under Insert from, click File. In the Insert Picture dialog box, select a picture, and then click Insert. Also in the Format Background dialog box, in the Fill pane, in the Transparency box, enter 85%.
  • #15 Faded background picture (Basic) To reproduce the background effects on this slide, do the following: On the Home tab, in the Slides group, click Layout and then click Blank. Right-click the slide and click Format Background. In the Format Background dialog box, click Fill in the left pane. In the Fill pane, select Picture or texture fill, and then under Insert from, click File. In the Insert Picture dialog box, select a picture, and then click Insert. Also in the Format Background dialog box, in the Fill pane, in the Transparency box, enter 85%.
  • #16 Faded background picture (Basic) To reproduce the background effects on this slide, do the following: On the Home tab, in the Slides group, click Layout and then click Blank. Right-click the slide and click Format Background. In the Format Background dialog box, click Fill in the left pane. In the Fill pane, select Picture or texture fill, and then under Insert from, click File. In the Insert Picture dialog box, select a picture, and then click Insert. Also in the Format Background dialog box, in the Fill pane, in the Transparency box, enter 85%.
  • #17 Faded background picture (Basic) To reproduce the background effects on this slide, do the following: On the Home tab, in the Slides group, click Layout and then click Blank. Right-click the slide and click Format Background. In the Format Background dialog box, click Fill in the left pane. In the Fill pane, select Picture or texture fill, and then under Insert from, click File. In the Insert Picture dialog box, select a picture, and then click Insert. Also in the Format Background dialog box, in the Fill pane, in the Transparency box, enter 85%.
  • #18 Faded background picture (Basic) To reproduce the background effects on this slide, do the following: On the Home tab, in the Slides group, click Layout and then click Blank. Right-click the slide and click Format Background. In the Format Background dialog box, click Fill in the left pane. In the Fill pane, select Picture or texture fill, and then under Insert from, click File. In the Insert Picture dialog box, select a picture, and then click Insert. Also in the Format Background dialog box, in the Fill pane, in the Transparency box, enter 85%.
  • #19 Faded background picture (Basic) To reproduce the background effects on this slide, do the following: On the Home tab, in the Slides group, click Layout and then click Blank. Right-click the slide and click Format Background. In the Format Background dialog box, click Fill in the left pane. In the Fill pane, select Picture or texture fill, and then under Insert from, click File. In the Insert Picture dialog box, select a picture, and then click Insert. Also in the Format Background dialog box, in the Fill pane, in the Transparency box, enter 85%.
  • #20 Faded background picture (Basic) To reproduce the background effects on this slide, do the following: On the Home tab, in the Slides group, click Layout and then click Blank. Right-click the slide and click Format Background. In the Format Background dialog box, click Fill in the left pane. In the Fill pane, select Picture or texture fill, and then under Insert from, click File. In the Insert Picture dialog box, select a picture, and then click Insert. Also in the Format Background dialog box, in the Fill pane, in the Transparency box, enter 85%.
  • #21 Faded background picture (Basic) To reproduce the background effects on this slide, do the following: On the Home tab, in the Slides group, click Layout and then click Blank. Right-click the slide and click Format Background. In the Format Background dialog box, click Fill in the left pane. In the Fill pane, select Picture or texture fill, and then under Insert from, click File. In the Insert Picture dialog box, select a picture, and then click Insert. Also in the Format Background dialog box, in the Fill pane, in the Transparency box, enter 85%.
  • #22 Faded background picture (Basic) To reproduce the background effects on this slide, do the following: On the Home tab, in the Slides group, click Layout and then click Blank. Right-click the slide and click Format Background. In the Format Background dialog box, click Fill in the left pane. In the Fill pane, select Picture or texture fill, and then under Insert from, click File. In the Insert Picture dialog box, select a picture, and then click Insert. Also in the Format Background dialog box, in the Fill pane, in the Transparency box, enter 85%.
  • #23 Faded background picture (Basic) To reproduce the background effects on this slide, do the following: On the Home tab, in the Slides group, click Layout and then click Blank. Right-click the slide and click Format Background. In the Format Background dialog box, click Fill in the left pane. In the Fill pane, select Picture or texture fill, and then under Insert from, click File. In the Insert Picture dialog box, select a picture, and then click Insert. Also in the Format Background dialog box, in the Fill pane, in the Transparency box, enter 85%.
  • #24 Faded background picture (Basic) To reproduce the background effects on this slide, do the following: On the Home tab, in the Slides group, click Layout and then click Blank. Right-click the slide and click Format Background. In the Format Background dialog box, click Fill in the left pane. In the Fill pane, select Picture or texture fill, and then under Insert from, click File. In the Insert Picture dialog box, select a picture, and then click Insert. Also in the Format Background dialog box, in the Fill pane, in the Transparency box, enter 85%.
  • #25 Faded background picture (Basic) To reproduce the background effects on this slide, do the following: On the Home tab, in the Slides group, click Layout and then click Blank. Right-click the slide and click Format Background. In the Format Background dialog box, click Fill in the left pane. In the Fill pane, select Picture or texture fill, and then under Insert from, click File. In the Insert Picture dialog box, select a picture, and then click Insert. Also in the Format Background dialog box, in the Fill pane, in the Transparency box, enter 85%.
  • #26 Faded background picture (Basic) To reproduce the background effects on this slide, do the following: On the Home tab, in the Slides group, click Layout and then click Blank. Right-click the slide and click Format Background. In the Format Background dialog box, click Fill in the left pane. In the Fill pane, select Picture or texture fill, and then under Insert from, click File. In the Insert Picture dialog box, select a picture, and then click Insert. Also in the Format Background dialog box, in the Fill pane, in the Transparency box, enter 85%.
  • #27 Faded background picture (Basic) To reproduce the background effects on this slide, do the following: On the Home tab, in the Slides group, click Layout and then click Blank. Right-click the slide and click Format Background. In the Format Background dialog box, click Fill in the left pane. In the Fill pane, select Picture or texture fill, and then under Insert from, click File. In the Insert Picture dialog box, select a picture, and then click Insert. Also in the Format Background dialog box, in the Fill pane, in the Transparency box, enter 85%.
  • #28 Faded background picture (Basic) To reproduce the background effects on this slide, do the following: On the Home tab, in the Slides group, click Layout and then click Blank. Right-click the slide and click Format Background. In the Format Background dialog box, click Fill in the left pane. In the Fill pane, select Picture or texture fill, and then under Insert from, click File. In the Insert Picture dialog box, select a picture, and then click Insert. Also in the Format Background dialog box, in the Fill pane, in the Transparency box, enter 85%.
  • #29 Faded background picture (Basic) To reproduce the background effects on this slide, do the following: On the Home tab, in the Slides group, click Layout and then click Blank. Right-click the slide and click Format Background. In the Format Background dialog box, click Fill in the left pane. In the Fill pane, select Picture or texture fill, and then under Insert from, click File. In the Insert Picture dialog box, select a picture, and then click Insert. Also in the Format Background dialog box, in the Fill pane, in the Transparency box, enter 85%.