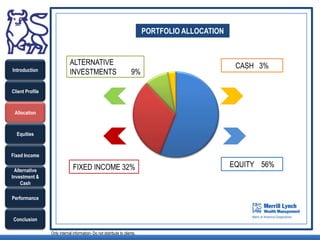
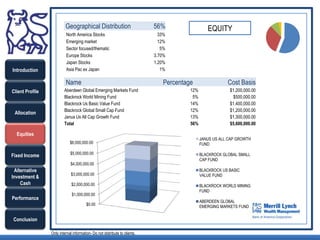
Global Wealth Management

Downtown Intern Financial Advising
            July 30th 2010
Tamer Antabi                                     Rishi Katariwala
                           Global Wealth Management Intern                  Global Wealth Management Intern
                           tamerantabi@gmail.com                            rishikatariwala@gmail.com
                           Tel: 813-679-3689                                Tel: 732-403-9532


Introduction


Client Profile             Jaime Cohen                                      Bradley Morse
                           Global Wealth Management Intern                  Global Wealth Management Intern
                           Jimmycperu@hotmail.com                           bradjmorse@gmail.com
 Allocation                Tel: 917-345-5824                                Tel: 720-261-1190


  Equities


Fixed Income
                           Zachary Harbage                                  Leticia Salama
                           Global Wealth Management Intern                  Global Wealth Management Intern
 Alternative
Investment &
                           Zachary.harbage@gmail.com                        letisalama@hotmail.com
    Cash                   Tel: 203-216-9485                                Tel: 646-377-2617

Performance


Conclusion

                 Only internal information- Do not distribute to clients.
Ney Pereira                   Leila Pereira
                               Gender                                Male                          Female
                               Date of Birth                         08/12/1948                    04/12/1952
                               Age                                   61 years                      58 years

Introduction                   Place of Birth                        Ubatuba, Brazil               Sao Paulo, Brazil
                               Citizenship                                                 Brazilian

Client Profile                 Marital Status                                              Married
                               Children                                                     None

 Allocation                    Occupation                                              Brewery Owners
                               Invest                                                  $ 10,000,000.00
                               Previous                                                    Equities
  Equities
                               Experience                                                Fixed Income
                                                                                         Hedge Funds
Fixed Income
                                                                                         Mutual Funds
 Alternative                                                                           Cash Management
Investment &
    Cash                       Years of experience                                         10 years
                               Objective                                               Income & Growth
Performance
                               Risk Factor                                                Moderate

Conclusion

                 Only internal information- Do not distribute to clients.
MARKET HIGHLIGHTS                             INVESTING IDEAS

                                       Increase in volatility and risk
                                                                               Actively Managed Hedge funds
                                                 aversion
Introduction


Client Profile
                                      Consumer confidence is down                  Higher portfolio liquidity


 Allocation
                                              Low treasury yields           15% of total portfolio is invested in EM

  Equities

                                     Sovereign debt crisis in Europe                 Diversified Portfolio
Fixed Income

 Alternative                   EM balance sheets are strong with low
Investment &
    Cash
                                      debt and high savings

Performance                     Gold continues to be a reliable hedge
                                    against equity movement in
                                       unpredictable markets
Conclusion

                 Only internal information- Do not distribute to clients.
RIC REPORT


                             Conservative             Moderately Conservative          Moderate   Moderately Aggressive         Aggressive

Introduction


Client Profile                  Higher Liquidity                            Moderate Liquidity                      Lower Liquidity
                                         8%                                             5%                                7%
                                   2%                                             8%
                                 5%                                                                             14%
 Allocation                                                                  7%
                                                                                                                                             40%
                                                                            5%
                                                                                                   50%         9%
                                                                   55%
  Equities                 30%
                                                                                                                5%
                                                                                25%
Fixed Income                                                                                                              25%


 Alternative
Investment &
    Cash

Performance


Conclusion

                 Only internal information- Do not distribute to clients.
PORTFOLIO ALLOCATION


                             ALTERNATIVE                                                            CASH 3%
Introduction                 INVESTMENTS                              9%

Client Profile


 Allocation


  Equities


Fixed Income

                               FIXED INCOME 32%                                                    EQUITY 56%
 Alternative
Investment &
    Cash

Performance


Conclusion

                 Only internal information- Do not distribute to clients.
Geographical Distribution                         56%                   EQUITY
                          North America Stocks                                33%
                          Emerging market                                     12%
                          Sector focused/thematic                              5%
                          Europe Stocks                                     3.70%
                          Japan Stocks                                      1.20%
Introduction              Asia Pac ex Japan                                    1%

                          Name                                                  Percentage                 Cost Basis
Client Profile           Aberdeen Global Emerging Markets Fund                           12%                $1,200,000.00
                         Blackrock World Mining Fund                                      5%                 $500,000.00
                         Blackrock Us Basic Value Fund                                   14%                $1,400,000.00
                         Blackrock Global Small Cap Fund                                 12%                $1,200,000.00
 Allocation
                         Janus Us All Cap Growth Fund                                    13%                $1,300,000.00
                         Total                                                           56%                $5,600,000.00

  Equities
                                                                                               JANUS US ALL CAP GROWTH
                             $6,000,000.00                                                     FUND

                             $5,000,000.00                                                     BLACKROCK GLOBAL SMALL
Fixed Income
                                                                                               CAP FUND
                             $4,000,000.00
 Alternative                                                                                   BLACKROCK US BASIC
                              $3,000,000.00                                                    VALUE FUND
Investment &
    Cash                      $2,000,000.00                                                    BLACKROCK WORLD MINING
                                                                                               FUND
                              $1,000,000.00
Performance
                                                                                               ABERDEEN GLOBAL
                                        $0.00                                                  EMERGING MARKETS FUND

Conclusion

                 Only internal information- Do not distribute to clients.
Fixed Income Categories                          32%                    Fixed Income
                          Investment Grade Bonds                            25.70%
                          High Yield Bonds                                   3.30%
                          Emerging Market Bonds                                 3%


Introduction              Name                                                       Percentage              Cost Basis
                         Templeton Global Total Return Fund                                   8%               $800,000.00
                         PIMCO GIS Global Bond Fund                                           8%               $800,000.00
Client Profile           Blackrock Global Government Bond Fund                                8%               $800,000.00
                         Aberdeen Global Emerging Markets Bond Fund                           3%               $300,000.00
                         Schroder IS Global Convertible Bond Fund                             3%               $300,000.00
 Allocation              Aberdeen Global Asian Bond Fund                                      2%               $200,000.00
                         Total                                                               32%              $3,200,000.00

  Equities                                                                                    ABERDEEN GLOBAL ASIAN
                             $3,500,000.00                                                    BOND FUND
                             $3,000,000.00                                                    SCHRODER ISF GLOBAL
Fixed Income                                                                                  CONVERTIBLE BOND FUND
                             $2,500,000.00
                                                                                              ABERDEEN GLOBAL EMERGING
 Alternative                  $2,000,000.00                                                   MARKETS BOND FUND
Investment &                  $1,500,000.00                                                   BLACKROCK GLOBAL
    Cash                                                                                      GOVERNMENT BOND FUND
                              $1,000,000.00
                                                                                              PIMCO GIS GLOBAL BOND
                                                                                              FUND
Performance                     $500,000.00

                                         $0.00                                                TEMPLETON GLOBAL TOTAL
                                                                                              RETURN FUND

Conclusion

                 Only internal information- Do not distribute to clients.
Categories                                              9%                 ALTERNATIVE
                          Global Macro                                             5%                 INVESTMENTS
                          Multi Strategy                                           2%
                          Commodities                                              2%

                          Name                                                          Percentage                Cost Basis
Introduction             Schroder AS Gold and Metals Fund                                        3%                 $300,000.00
                         Permal Macro Holdings Fund                                              6%                 $600,000.00


Client Profile
                                 $1,000,000.00
                                                                                            PERMAL MACRO HOLDINGS
                                                                                            FUND
 Allocation                         $500,000.00
                                                                                            SCHRODER AS GOLDEN
                                                                                            METALS FUND
                                            $0.00

  Equities


Fixed Income               Cash                                             3%                            CASH
                          Total Cash Invested                        $300,000.00
 Alternative
Investment &
                                   $400,000.00
    Cash
                                   $200,000.00                                              Total Cash Invested
Performance
                                            $0.00


Conclusion

                 Only internal information- Do not distribute to clients.
TRACKING PORTFOLIO

                                  EQUITY
                                                                                                                                                             Total                                Percentage                                           Gain/
                       Name                                                                                         Ticker                                                                                            Gain/ Loss      Total Value
                                                                                                                                                             Investment                           Invested                                             Loss %
Introduction

                      Aberdeen Global Emerging Markets Fund ABEFROA LX                                                                             $1,200,000.00                                              12%   $1.48          $1,233,617.26         2.80%
Client Profile        Blackrock World Mining Fund                                                    MIGWMFA LX                                    $500,000.00                                                5%    $4.76          $540,189.13           8.04%
                      Blackrock Us Basic Value Fund                                                  MABAX US                                      $1,400,000.00                                              14%   $1.07          $1,467,998.18         4.86%
                      Blackrock Global Small Cap Fund                                                MERGSML LX                                    $1,200,000.00                                              12%   $1.42          $1,232,895.75         2.74%
 Allocation           Janus Us All Cap Growth Fund                                                   JANACA1 ID                                    $1,300,000.00                                              13%   $0.40          $1,344,482.46         3.42%


                      Equity Totals                                                                                                                $5,600,000.00                                              56%   $219,182.79    $5,819,182.79
  Equities                                                                                                                                                                                                                                            3.91%
                                                                                                                                                                                                                                                   Performance
                                                                                                                                                                                                                                                   Contribution
Fixed Income                                                            Equity Tracker
                           $5,900,000.00
                           $5,800,000.00
 Alternative               $5,700,000.00
Investment &               $5,600,000.00
    Cash                   $5,500,000.00
                           $5,400,000.00
                                                7/16/2010
                                                            7/17/2010
                                                                         7/18/2010
                                                                                     7/19/2010
                                                                                                 7/20/2010
                                                                                                             7/21/2010
                                                                                                                         7/22/2010
                                                                                                                                     7/23/2010
                                                                                                                                                 7/24/2010
                                                                                                                                                              7/25/2010
                                                                                                                                                                          7/26/2010
                                                                                                                                                                                      7/27/2010
Performance                                                                                                                                                                                       7/28/2010


Conclusion

                 Only internal information- Do not distribute to clients.
TRACKING PORTFOLIO

                             Fixed Income
                                                                                          Total      Percentage
                       Name                                                    Ticker                           Gain/ Loss    Total Value Gain/ Loss %
                                                                                          Investment Invested
Introduction

                      Templeton Global Total Return Fund                    TGTRFAD LX    $800,000.00    8%           $0.32    $816,171.83          2.02%
Client Profile        PIMCO GIS Global Bond Fund                            PIMGBAI ID    $800,000.00    8%          -$0.05    $798,081.53          -0.24%
                      Blackrock Global Government Bond Fund                 MIGSDGI LX    $800,000.00    8%          -$0.04    $798,599.56          -0.18%
                      Aberdeen Global Emerging Markets Bond Fund ABESOAA LX               $300,000.00    3%           $0.54    $305,316.70          1.77%
 Allocation           Schroder IS Global Convertible Bond Fund              SCHGOBA LX $300,000.00       3%           $1.18    $303,635.24          1.21%
                      Aberdeen Global Asian Bond Fund                       AETABBA LX    $200,000.00    2%           $0.06    $201,910.83          0.96%

  Equities
                      Fixed Income Totals                                                $3,200,000.00   32%    $23,715.70    $3,223,715.70        0.74%
                                                                                                                                              Performance
Fixed Income                                         Fixed Income Tracker                                                                     Contribution
                           $3,230,000.00
                           $3,220,000.00
 Alternative               $3,210,000.00
Investment &               $3,200,000.00
    Cash                   $3,190,000.00
                           $3,180,000.00
                           $3,170,000.00
Performance


Conclusion

                 Only internal information- Do not distribute to clients.
ALTERNATIVE                                           TRACKING PORTFOLIO
                               INVESTMENTS

                                                                                         Total      Percentage
                       Name                                                 Ticker                             Gain/ Loss Total Value      Gain/ Loss %
                                                                                         Investment Invested

Introduction          Schroder As Gold and Metals Fund              SAGMADD LX            $300,000.00    3%         -$0.05   $298,429.32             -0.52%
                      Permal Macro Holdings Fund                    PRMCOMI VI            $600,000.00    6%         $0.00    $600,000.00             0.00%

Client Profile
                      Fixed Income Totals                                                 $900,000.00    9%     -$1,570.68   $898,429.32
                                                                                                                                                  -0.17%
                                                Alternative Investments Tracker
 Allocation                                                                                                                                   Performance
                         $904,000.00
                         $902,000.00                                                                                                          Contribution
                         $900,000.00
                         $898,000.00
  Equities               $896,000.00
                         $894,000.00
                         $892,000.00


Fixed Income

 Alternative
Investment &                        CASH
    Cash
                                                                      Total                                      Gain/
                       Name                                                            Gain/ Loss Total Value
Performance                                                           Investment                                 Loss %


                      Total Cash Invested                             $300,000.00 $385.88         $300,385.88
                                                                                                                0.13%
Conclusion

                 Only internal information- Do not distribute to clients.
OVERALL GROWTH


                                                                            Invested         Gain/Loss Total Value        Percentage
                           Equity                                           $5,600,000.00    $219,182.79    $5,819,182.79        3.91%
Introduction
                           Fixed Income                                     $3,200,000.00    $23,715.70     $3,223,715.70      0.74%
Client Profile
                           Alternative Investments                          $900,000.00      -$1,570.68      $898,429.32      -0.17%

 Allocation
                           Cash Invested                                    $300,000.00      $385.88         $300,385.88       0.13%

  Equities                 Total Performance                                $10,000,000.00   $241,713.69   $10,241,713.69      2.42%


Fixed Income

 Alternative                      RIC report’s suggestions
Investment &
    Cash                          Highly diversified portfolio
                                Medium to Long Term portfolio
Performance
                             Maintain suggested client’s allocation

Conclusion

                 Only internal information- Do not distribute to clients.
Introduction


Client Profile


 Allocation


  Equities


Fixed Income

 Alternative
Investment &
    Cash

Performance


Conclusion

                 Only internal information- Do not distribute to clients.

Ppt dt ml

  • 1.
    Global Wealth Management DowntownIntern Financial Advising July 30th 2010
  • 2.
    Tamer Antabi Rishi Katariwala Global Wealth Management Intern Global Wealth Management Intern tamerantabi@gmail.com rishikatariwala@gmail.com Tel: 813-679-3689 Tel: 732-403-9532 Introduction Client Profile Jaime Cohen Bradley Morse Global Wealth Management Intern Global Wealth Management Intern Jimmycperu@hotmail.com bradjmorse@gmail.com Allocation Tel: 917-345-5824 Tel: 720-261-1190 Equities Fixed Income Zachary Harbage Leticia Salama Global Wealth Management Intern Global Wealth Management Intern Alternative Investment & Zachary.harbage@gmail.com letisalama@hotmail.com Cash Tel: 203-216-9485 Tel: 646-377-2617 Performance Conclusion Only internal information- Do not distribute to clients.
  • 3.
    Ney Pereira Leila Pereira Gender Male Female Date of Birth 08/12/1948 04/12/1952 Age 61 years 58 years Introduction Place of Birth Ubatuba, Brazil Sao Paulo, Brazil Citizenship Brazilian Client Profile Marital Status Married Children None Allocation Occupation Brewery Owners Invest $ 10,000,000.00 Previous Equities Equities Experience Fixed Income Hedge Funds Fixed Income Mutual Funds Alternative Cash Management Investment & Cash Years of experience 10 years Objective Income & Growth Performance Risk Factor Moderate Conclusion Only internal information- Do not distribute to clients.
  • 4.
    MARKET HIGHLIGHTS INVESTING IDEAS Increase in volatility and risk Actively Managed Hedge funds aversion Introduction Client Profile Consumer confidence is down Higher portfolio liquidity Allocation Low treasury yields 15% of total portfolio is invested in EM Equities Sovereign debt crisis in Europe Diversified Portfolio Fixed Income Alternative EM balance sheets are strong with low Investment & Cash debt and high savings Performance Gold continues to be a reliable hedge against equity movement in unpredictable markets Conclusion Only internal information- Do not distribute to clients.
  • 5.
    RIC REPORT Conservative Moderately Conservative Moderate Moderately Aggressive Aggressive Introduction Client Profile Higher Liquidity Moderate Liquidity Lower Liquidity 8% 5% 7% 2% 8% 5% 14% Allocation 7% 40% 5% 50% 9% 55% Equities 30% 5% 25% Fixed Income 25% Alternative Investment & Cash Performance Conclusion Only internal information- Do not distribute to clients.
  • 6.
    PORTFOLIO ALLOCATION ALTERNATIVE CASH 3% Introduction INVESTMENTS 9% Client Profile Allocation Equities Fixed Income FIXED INCOME 32% EQUITY 56% Alternative Investment & Cash Performance Conclusion Only internal information- Do not distribute to clients.
  • 7.
    Geographical Distribution 56% EQUITY North America Stocks 33% Emerging market 12% Sector focused/thematic 5% Europe Stocks 3.70% Japan Stocks 1.20% Introduction Asia Pac ex Japan 1% Name Percentage Cost Basis Client Profile Aberdeen Global Emerging Markets Fund 12% $1,200,000.00 Blackrock World Mining Fund 5% $500,000.00 Blackrock Us Basic Value Fund 14% $1,400,000.00 Blackrock Global Small Cap Fund 12% $1,200,000.00 Allocation Janus Us All Cap Growth Fund 13% $1,300,000.00 Total 56% $5,600,000.00 Equities JANUS US ALL CAP GROWTH $6,000,000.00 FUND $5,000,000.00 BLACKROCK GLOBAL SMALL Fixed Income CAP FUND $4,000,000.00 Alternative BLACKROCK US BASIC $3,000,000.00 VALUE FUND Investment & Cash $2,000,000.00 BLACKROCK WORLD MINING FUND $1,000,000.00 Performance ABERDEEN GLOBAL $0.00 EMERGING MARKETS FUND Conclusion Only internal information- Do not distribute to clients.
  • 8.
    Fixed Income Categories 32% Fixed Income Investment Grade Bonds 25.70% High Yield Bonds 3.30% Emerging Market Bonds 3% Introduction Name Percentage Cost Basis Templeton Global Total Return Fund 8% $800,000.00 PIMCO GIS Global Bond Fund 8% $800,000.00 Client Profile Blackrock Global Government Bond Fund 8% $800,000.00 Aberdeen Global Emerging Markets Bond Fund 3% $300,000.00 Schroder IS Global Convertible Bond Fund 3% $300,000.00 Allocation Aberdeen Global Asian Bond Fund 2% $200,000.00 Total 32% $3,200,000.00 Equities ABERDEEN GLOBAL ASIAN $3,500,000.00 BOND FUND $3,000,000.00 SCHRODER ISF GLOBAL Fixed Income CONVERTIBLE BOND FUND $2,500,000.00 ABERDEEN GLOBAL EMERGING Alternative $2,000,000.00 MARKETS BOND FUND Investment & $1,500,000.00 BLACKROCK GLOBAL Cash GOVERNMENT BOND FUND $1,000,000.00 PIMCO GIS GLOBAL BOND FUND Performance $500,000.00 $0.00 TEMPLETON GLOBAL TOTAL RETURN FUND Conclusion Only internal information- Do not distribute to clients.
  • 9.
    Categories 9% ALTERNATIVE Global Macro 5% INVESTMENTS Multi Strategy 2% Commodities 2% Name Percentage Cost Basis Introduction Schroder AS Gold and Metals Fund 3% $300,000.00 Permal Macro Holdings Fund 6% $600,000.00 Client Profile $1,000,000.00 PERMAL MACRO HOLDINGS FUND Allocation $500,000.00 SCHRODER AS GOLDEN METALS FUND $0.00 Equities Fixed Income Cash 3% CASH Total Cash Invested $300,000.00 Alternative Investment & $400,000.00 Cash $200,000.00 Total Cash Invested Performance $0.00 Conclusion Only internal information- Do not distribute to clients.
  • 10.
    TRACKING PORTFOLIO EQUITY Total Percentage Gain/ Name Ticker Gain/ Loss Total Value Investment Invested Loss % Introduction Aberdeen Global Emerging Markets Fund ABEFROA LX $1,200,000.00 12% $1.48 $1,233,617.26 2.80% Client Profile Blackrock World Mining Fund MIGWMFA LX $500,000.00 5% $4.76 $540,189.13 8.04% Blackrock Us Basic Value Fund MABAX US $1,400,000.00 14% $1.07 $1,467,998.18 4.86% Blackrock Global Small Cap Fund MERGSML LX $1,200,000.00 12% $1.42 $1,232,895.75 2.74% Allocation Janus Us All Cap Growth Fund JANACA1 ID $1,300,000.00 13% $0.40 $1,344,482.46 3.42% Equity Totals $5,600,000.00 56% $219,182.79 $5,819,182.79 Equities 3.91% Performance Contribution Fixed Income Equity Tracker $5,900,000.00 $5,800,000.00 Alternative $5,700,000.00 Investment & $5,600,000.00 Cash $5,500,000.00 $5,400,000.00 7/16/2010 7/17/2010 7/18/2010 7/19/2010 7/20/2010 7/21/2010 7/22/2010 7/23/2010 7/24/2010 7/25/2010 7/26/2010 7/27/2010 Performance 7/28/2010 Conclusion Only internal information- Do not distribute to clients.
  • 11.
    TRACKING PORTFOLIO Fixed Income Total Percentage Name Ticker Gain/ Loss Total Value Gain/ Loss % Investment Invested Introduction Templeton Global Total Return Fund TGTRFAD LX $800,000.00 8% $0.32 $816,171.83 2.02% Client Profile PIMCO GIS Global Bond Fund PIMGBAI ID $800,000.00 8% -$0.05 $798,081.53 -0.24% Blackrock Global Government Bond Fund MIGSDGI LX $800,000.00 8% -$0.04 $798,599.56 -0.18% Aberdeen Global Emerging Markets Bond Fund ABESOAA LX $300,000.00 3% $0.54 $305,316.70 1.77% Allocation Schroder IS Global Convertible Bond Fund SCHGOBA LX $300,000.00 3% $1.18 $303,635.24 1.21% Aberdeen Global Asian Bond Fund AETABBA LX $200,000.00 2% $0.06 $201,910.83 0.96% Equities Fixed Income Totals $3,200,000.00 32% $23,715.70 $3,223,715.70 0.74% Performance Fixed Income Fixed Income Tracker Contribution $3,230,000.00 $3,220,000.00 Alternative $3,210,000.00 Investment & $3,200,000.00 Cash $3,190,000.00 $3,180,000.00 $3,170,000.00 Performance Conclusion Only internal information- Do not distribute to clients.
  • 12.
    ALTERNATIVE TRACKING PORTFOLIO INVESTMENTS Total Percentage Name Ticker Gain/ Loss Total Value Gain/ Loss % Investment Invested Introduction Schroder As Gold and Metals Fund SAGMADD LX $300,000.00 3% -$0.05 $298,429.32 -0.52% Permal Macro Holdings Fund PRMCOMI VI $600,000.00 6% $0.00 $600,000.00 0.00% Client Profile Fixed Income Totals $900,000.00 9% -$1,570.68 $898,429.32 -0.17% Alternative Investments Tracker Allocation Performance $904,000.00 $902,000.00 Contribution $900,000.00 $898,000.00 Equities $896,000.00 $894,000.00 $892,000.00 Fixed Income Alternative Investment & CASH Cash Total Gain/ Name Gain/ Loss Total Value Performance Investment Loss % Total Cash Invested $300,000.00 $385.88 $300,385.88 0.13% Conclusion Only internal information- Do not distribute to clients.
  • 13.
    OVERALL GROWTH Invested Gain/Loss Total Value Percentage Equity $5,600,000.00 $219,182.79 $5,819,182.79 3.91% Introduction Fixed Income $3,200,000.00 $23,715.70 $3,223,715.70 0.74% Client Profile Alternative Investments $900,000.00 -$1,570.68 $898,429.32 -0.17% Allocation Cash Invested $300,000.00 $385.88 $300,385.88 0.13% Equities Total Performance $10,000,000.00 $241,713.69 $10,241,713.69 2.42% Fixed Income Alternative RIC report’s suggestions Investment & Cash Highly diversified portfolio Medium to Long Term portfolio Performance Maintain suggested client’s allocation Conclusion Only internal information- Do not distribute to clients.
  • 14.
    Introduction Client Profile Allocation Equities Fixed Income Alternative Investment & Cash Performance Conclusion Only internal information- Do not distribute to clients.

Editor's Notes