Download to read offline


![Rolling SUM
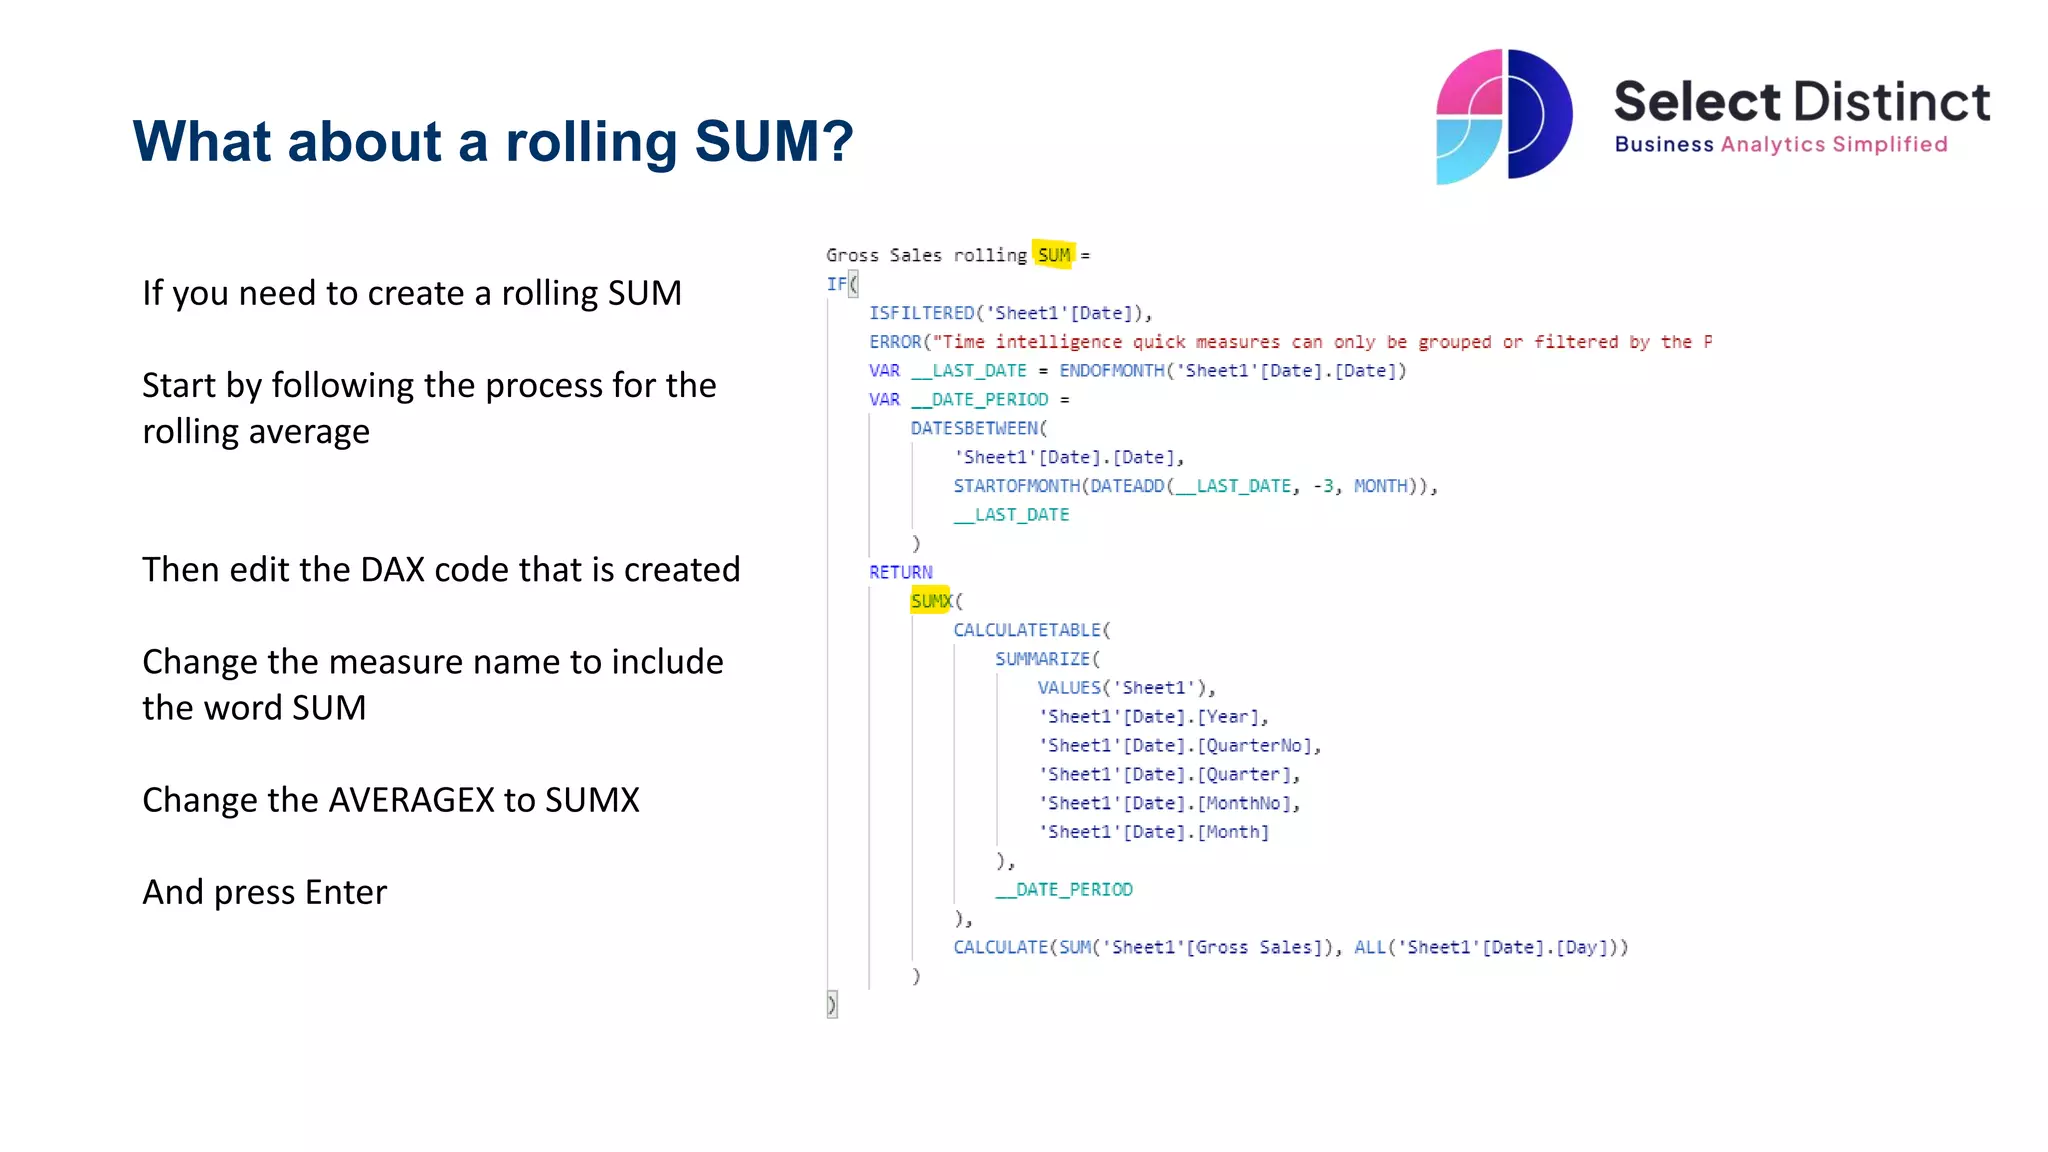
Add the newly created Rolling SUM
measure to a chart
A word of caution though, you can see
on the chart that the first periods don’t
contain the three periods, so you may
need to exclude those from the chart
Alternatively, you can and a little extra
code to the measure to check for the
required periods
That’s one for a separate video, but
here is a sneak peek
if(Stockturn_13m_Rolling[Location
_on_hand_value rolling count]
< 13, "",](https://image.slidesharecdn.com/powerbitipsrollingaveragesandrollingsums-230427155635-0117cdad/75/Power-BI-Tips-Rolling-Averages-and-Rolling-Sums-pptx-7-2048.jpg)


The document provides a guide on creating rolling averages and rolling sums in Power BI using quick measures. It outlines steps such as selecting the rolling average option, setting the period intervals, and modifying the DAX code for rolling sums. It also warns about potential issues with initial periods in charts and suggests excluding them or adding extra code.