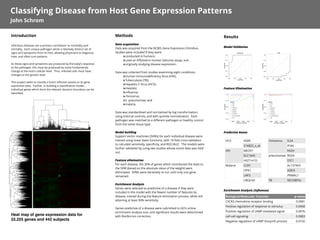
1. Heat map of gene expression data for
22,225 genes and 442 subjects
Introduction
Infectious diseases are a primary contributor to morbidity and
mortality. Each unique pathogen elicits a relatively distinct set of
signs and symptoms from its host, allowing physicians to diagnose,
treat, and often cure patients.
As these signs and symptoms are produced by the body’s response
to the pathogen, this must be produced by some fundamental
change at the host’s cellular level. Thus, infected cells must have
changes at the genetic level.
This project seeks to classify a host’s infection based on its gene
expression data. Further, in building a classification model,
individual genes which form the relevant decision boundary can be
identified.
Results
Model Validation
Feature Elimination
Predictive Genes
Enrichment Analysis (influenza)
Methods
Data acquisition
Data was acquired from the NCBI’s Gene Expression Omnibus.
Studies were included if they were:
‣conducted in humans;
‣used an Affymetrix Human Genome assay; and
‣originally studying disease expression.
Data was collected from studies examining eight conditions:
‣Human Immunodeficiency Virus (HIV);
‣Tuberculosis (TB);
‣Hepatitis C Virus (HCV);
‣measles;
‣influenza;
‣rhinovirus;
‣S. pneumoniae; and
‣malaria.
Data was standardized and normalized by log transformation,
using internal controls, and with quintile normalization. Each
pathogen was matched to a different pathogen or healthy control
from the same tissue type.
Model building
Support vector machines (SVMs) for each individual disease were
trained using linear basis functions, with 10-fold cross-validation
to calculate sensitivity, specificity, and ROC/AUC. The models were
further validated by using two studies whose entire data was held
out.
Feature elimination
For each disease, the 30% of genes which contributed the least to
the SVM (based on the absolute value of the weight) were
eliminated. SVMs were iteratively re-run until only one gene
remained.
Enrichment Analysis
Genes were selected as predictive of a disease if they were
included in the model with the fewest number of features by
disease, trained during the feature elimination process, while still
attaining at least 90% sensitivity.
Genes predictive of a disease were submitted to GO’s online
enrichment analysis tool, and significant results were determined
with Bonferroni correction.
Classifying Disease from Host Gene Expression Patterns
John Schrom
HCV ASB9
216822_x_at
HIV MEOX1
SLC16A5
HIST1H1D
Malaria CUX1
ITPK1
LAP3
UBQLN2
rhinovirus IL24
IFI44
FA2H
pneumoniae RGS4
STC1
AL137403
ADD3
PNMAL1
TB SECISBP2L
Biological/Molecular Function p-value
CXCR3 chemokine receptor binding 0.0081
Positive regulation of response to stimulus 0.0068
Positive regulation of cAMP-mediated signal 0.0076
cell-cell signaling 0.0083
Negative regulation of cAMP biosynth process 0.0102