1. Quantifying the Effect of Statin Use in Pre-Diabetic Phenotypes Discovered
Through Association Rule Mining
John R. Schrom, MPH1
, Pedro J. Caraballo, MD2
, M. Regina Castro, MD2
,
György J. Simon, PhD1
1
University of Minnesota, Minneapolis, MN and 2
Mayo Clinic, Rochester, MN
Abstract
Prediabetes is the most important risk factor for developing type-2 diabetes mellitus, an important and growing
epidemic. Prediabetes is often associated with comorbidities including hypercholesterolemia. While statin drugs
are indicated to treat hypercholesterolemia, recent reports suggest a possible increased risk of developing overt
diabetes associated with the use of statins. Association rule mining is a data mining technique capable of identifying
interesting relationships between risks and treatments. However, it is limited in its ability to accurately calculate
the effect of a treatment, as it does not appropriately account for bias and confounding. We propose a novel
combination of propensity score matching and association rule mining to account for this bias, and find meaningful
associations between a treatment and outcome for various subpopulations. We demonstrate this technique on a real
diabetes data set examining the relationship between statin use and diabetes, and identify risk and protective factors
previously not clearly defined.
Introduction
Diabetes mellitus is a growing epidemic, affecting more than 25 million people in the United States alone. In
addition, an estimated 79 million people suffer from prediabetes14
, defined by blood glucose levels above normal but
below the threshold for the diagnosis of diabetes. Prediabetes is often accompanied by other comorbidities, such as
obesity, hyperlipidemia and hypertension, which require appropriate treatment including the use of multiple drugs.
In the case of hyperlipidemia, statin therapy is usually prescribed. While use of statins lowers cholesterol levels, and
the overall risk of cardiovascular mortality6,7,8
, there has been recent research indicating an increased risk of incident
diabetes associated with their use.1,2,3,4
Association rule mining is a technique used to discover associations between items. Association rules are
implications, where a set of co-occurring conditions implies increased risk of another condition. Applied to a
treatment and condition, association rules can be viewed as identifying phenotypes or etiologic pathways within a
population. They are interpretable, and they suggest interconnections between risk factors. Furthermore, they are
rules, which makes them straightforward to implement in a clinical decision support system. While association rules
can identify patient subpopulations (phenotypes) at particularly high risk of a given disease, they do not directly give
us information about the efficacy of treatments.
In this work, we extend the association rule mining methodology to identify subpopulations where the effect of a
treatment on an outcome differs among subpopulations, or differs from the general population. For example, in a
pre-diabetic patient population, statin use has been shown to have no significant effect on the diabetes outcome.15
The proposed methodology can identify phenotypes within the prediabetic patient population, in which statins are
significantly harmful; and it can also identify phenotypes where the use of statins may actually be beneficial.
The success of developing such a methodology fundamentally depends on our ability to accurately quantify the
effect of a treatment in a phenotype. Suppose we wish to quantify the effect of statins on diabetes in a phenotype
defined by the association pattern {hypertension, renal failure}. In association rule mining, a naïve and commonly
used technique is to directly compare the prevalence of diabetes among those who take statins and those who do not,
among the patients presenting with hypertension and renal failure.
This method provides an accurate quantification of the effect of statins, only if the statin-receiving and non-statin-
receiving subpopulations within a phenotype are comparable. We do not believe this assumption to be universally
true. In our above example, if the statin-receiving group has higher lipid levels than the non-statin receiving group,
then these two groups are not comparable from a diabetes perspective: even if statins had no effect at all, we would
see that the statin-receiving group has higher risk of diabetes simply because of their higher LDL levels. Given that
statins are drugs that reduce LDL levels, this scenario is not only feasible, but also very likely. Failure to take such
2. differences into account would lead to the erroneous assertion of a relationship between statins and diabetes among
untreated hypertensive patients.
To address this issue, we propose a combination of propensity score matching and association rule mining. Our
proposed methodology preserves association rule mining’s outstanding ability to identify distinct phenotypes, while
allowing for accurate estimation of treatment effects.
The key idea is as follows. We use association rule mining to identify distinct phenotypes. Within each phenotype,
some patients receive statins and some do not. While the two (statin-receiving and non-statin-receiving)
subpopulations are not comparable in their entirety, they may contain pairs of patients who are. In our statin-use
example, where the key differentiator between the two subpopulations was LDL level, such patient pairs could be
formed from the patients with lowest LDL levels in the statin-receiving group matched with patients with the highest
LDL levels in the non-statin-receiving group. We utilize propensity score matching to identify such patient pairs,
thus addressing confounding and bias while still fully utilizing this powerful data mining technique.
We first discover association rules (phenotypes) from the diagnosis codes, dichotomized laboratory results and
medications. For each association rule, we match patients in the treatment (statin-receiving) and control (non-statin-
receiving) groups based on their respective propensity scores. If we can find a sufficient number of pairs to support
the estimation of the treatment effect, we calculate the relative risk of the outcome between the treatment and control
subpopulations. The result is a set of easily interpretable phenotypes, each with a distinct effect from the treatment.
We applied this methodology to a real clinical data set collected at Mayo Clinic. The data set consists of patients
who were prediabetic in 2005 and our clinical interest lies in their progression to over diabetes within 5 years.
Specifically, we show the proposed approach identified clinically relevant phenotypes, and we also show that these
phenotypes exhibited qualitatively different treatment effects of statins in terms of progression to overt diabetes.
Methods
In order to quantify the effects of statin use among prediabetic patients, we must discover association rules, build a
propensity score model, and calculate the statin’s effect for each phenotypic group. In the following sections, we
describe these steps in detail.
Association Rule Mining
Association rule mining12
is a data mining technique used to identify interesting relationships between variables.
Let an item be a binarized variable indicating the presence of some risk factor (e.g., hypertension). The predictors
in our data set include diagnosis codes and medications. To increase interpretability, we combined diagnosis codes
with their respective medications forming items such as ‘hypertension with medication’ or ‘hypertension without
medication’.
Let an itemset be a set of items, which indicates whether the corresponding risk factors are all present in the patient.
If they are, the itemset is said to apply to a patient. The support of an itemset I is the number of patients to whom I
applies.
An association rule represents an implication defined by an itemset I implying that patients to whom I applies face
an increased (or decreased) risk of diabetes. An association rule applies to the set of patients to whom its defining
itemset I applies and its support is the support of I. Another metric that characterizes an association rule is its
confidence. Intuitively, the confidence quantifies the strength of the association between the itemset and the
outcome. Mathematically, the confidence of a rule is the fraction of patients who developed diabetes among the
patients to whom the rule applied. In other words, the confidence is the conditional probability of a patient
developing diabetes given that the rule applies to this patient. We define the risk of progression to diabetes for a
patient to whom a rule applies as the confidence of the rule.
The statistical significance of the association (between the itemset and the outcome) can be assessed using
predictive significance16
. Predictive significance tests the hypothesis that the conditional probability of diabetes
given the itemset is statistically significantly higher (or lower) than the prior probability of diabetes, which is the
overall rate of diabetes in our entire prediabetic cohort. Since significant association rules select a subpopulation
with a disease outcome that is different from the general population, each rule can be viewed as a prediabetic
phenotype.
A simple (but as we later show, inaccurate) method of quantifying the effect of a treatment (statin use in our
application) in each phenotype is as follows. In each phenotype, some patients received statins (we call treatment
3. patients) and some did not (control patients). We can quantify the relative risk of developing diabetes between the
treatment and the control subpopulations (of the same phenotype) by calculating the ratio of the probability of
progression to diabetes in the treatment subpopulation divided by the probability of progression in the control
subpopulation. Henceforth, we refer to this quantity as the unmatched relative risk. The statistical significance of
the unmatched relative risk is assessed using bootstrap simulation.
Propensity Score Matching
Arguably, the most accurate method of estimating the effect of a treatment is through a case-control study or a
randomized clinical trial. These studies are designed to minimize variation in non-treatment variables among the
study groups. This ensures the two groups are mostly identical, thus minimizing bias and allowing the researcher to
be relatively assured that an effect is due to the treatment variable.
With secondary analysis, we must shift our focus from study design techniques to statistical methods to account for
bias, as we are no longer in a position to make the two populations identical. Propensity score matching is one
technique that can be used to account for the confounding and bias present with receiving a particular treatment.
With this technique, a model is built using the treatment as the dependent variable. The propensity score becomes
the model-based probability that the subject received the treatment. This allows a researcher to identify pairs of
patients—one having received the treatment and one who has not—such that the two patients in each pair are
equally likely to have received a given treatment. While this does not guarantee that these two patients in all pairs
are identical, it ensures that no observable variable confounds the treatment effect within each pair.
Using the propensity score, patients in the treatment group are matched to one or more patients in the control group.
This is typically achieved using either a nearest neighbor or nearest neighbor within a caliper distance9
. The nearest
neighbor method matches a treatment to the control with the minimum difference between the propensity scores.
The nearest neighbor within a caliper matches a treatment to the control with the minimum difference between the
propensity scores, provided it is less than a set caliper distance17
. Additional methods, including matching all
treatment patients with all controls using some weight, are available. We will focus on the caliper method, as our
data provide good coverage between the treatment and control groups. Specifically, we allow the treatment and
control groups to differ at most by 1%.
Once all of the patients in the treatment group have been matched, the analysis can be continued using methods
appropriate for the matched pairs.
Combining Association Rule Mining with Propensity Score Matching
Association rules were discovered, as described above. This process identifies the phenotypes that are associated
with increased or decreased risk of developing diabetes relative to the general prediabetic population.
Next, within each phenotype, the propensity score model is constructed. While fitting the propensity score model on
a per-phenotype basis offers improved ability to account for confounders (i.e. we can eliminate phenotype-specific
confounders), we need to exercise caution as we potentially fit the model to a small population. Models fitted to
small populations are more susceptible to overfitting. Given this limitation, it is important to utilize a penalized
logistic regression model, such as lasso or ridge regression, to avoid overfitting.10,11
The treatment, statin use, is the
dependent variable for regression, while all variables that are not part of the phenotype definition were used as
independent variables.
Once a model was developed, patients were matched using the caliper technique. The risk of developing diabetes
was calculated using a logistic regression model. The matched relative risk of developing diabetes was calculated
using the model-based diabetes probability. We used bootstrap simulation to assess the statistical significance of the
relative risks.
Results
The data set consists of 18,958 patients who were pre-diabetic at the beginning of 2005. The pre-diabetic status was
defined as having at least one fasting glucose measurement between 101 and 125 mg/dl in the period from
01/01/1999 to 12/31/2004. Patients were followed until 2010, and our outcome of interest was progression to overt
diabetes within 5 years. The baseline five-year risk of developing diabetes among this patient population was 13.6%
among those on statins, and 9.8% among those not on statins. The data set also contains covariates that are
potentially predictive of progression to diabetes. The covariates include laboratory results, medications and co-
morbid disease diagnosis codes. The most important covariates are listed in Table 1.
4. As preprocessing, we created binary variables. Lab variables were dichotomized to indicate abnormal results using
the ADA guidelines13
. Diagnosis and medication variables indicate the presence of a diagnosis or prescription within
the study period.
Table 1 Important predictors of progression to overt diabetes
Predictor Abbr. %
demographic
gender male genderM 49
Diagnoses
hypertension htn 31
hyperlipidemia hyperlip 37
obese obese 20
ischemic heart disease ihd 10
peripheral vascular disease pvd 2
Medications
ACE/ARB acearb 13
beta blocker bb 17
Ca channel blocker ccb 7
diuretic diuret 13
fibrate fibra 2
statin statin 18
aspirin aspirin 29
abnormal lab results
High systolic blood pressure sbp 21
High diastolic blood
pressure
dbp 9
High total cholesterol tchol 43
Low high-density
lipoprotein
hdl 23
High low-density lipoprotein ldl 63
High body mass index bmi 27
High triglycerides trigl 30
Additional analysis variables were created based on the combination of a diagnosis and its relevant medication. For
example, two hypertension variables were created: hypertension with medications, and hypertension without
medication. In this example, “hypertension with medications” indicates a diagnosis of hypertension, and a
prescription for any medication used to treat hypertension (e.g., diuretic, beta-blocker).
As we are examining the effect of statins, we created a separate dichotomized variable to indicate a prescription for
statins. As such, “hyperlipidemia with medications” includes hyperlipidemia medications other than statins. This is
an important distinction, as including statins in “hyperlipidemia with medication” will produce uninterpretable
results.
In what follows, we will estimate the effect of statins in phenotypes we discovered using association rule mining
using a naïve method yielding the unmatched relative risk. We will then compare the unmatched relative risks to
(matched) relative risk computed using the proposed method.
5. Treatment Effect Estimated from Association Rule Mining – Naïve Method
Association rules were discovered from the population, and the unmatched relative risk of developing diabetes given
statin use was calculated for each rule. Thirty rules were discovered, Table 2 shows the 19 rules that achieved a p-
value less than 0.2. The Table presents the phenotypes (in the ‘Itemset’ column) and the relative risk (RR) that this
phenotype confers on the patient. The interpretation is straightforward: patients with a particular phenotype who
take statins face a proportional change (increase or decrease) in the risk of diabetes relative to the patients of the
same phenotype who did not take statins. For example, the {Obesity, hyperlipidemia w/o medication} phenotype
would be interpreted as: patients who are obese, have hyperlipidemia, and are not on any hyperlipidemia medication
(other than possibly statins) are 25% more likely to develop diabetes when given statins.
Table 2 suggests that in all phenotypes, where the effect of statins was (even mildely) significant (p-value of .2),
statins increased risk of diabetes.
Table 2. Risk of diabetes using association rule mining without propensity score matching. `Itemset’ defines the
phenotype, RR denotes the (unmatched) relative risk of diabetes due to statins and the stars denote the significance
of the effect of the statin treatment.
Itemset Sup RR
Obesity 0.35 1.28**
Hyperlipidemia w/o medication 0.52 1.22**
Hypertension w/ medication 0.03 1.13*
Hypertension w/o medication 0.15 1.23
Elevated blood pressure w/ medication 0.12 1.23*
Elevated blood pressure w/o medication 0.09 1.35
Obesity, hyperlipidemia w/o medication 0.19 1.25**
Obesity, hypertension w/ medication 0.12 1.21*
Obesity, hypertension w/o medication 0.06 1.28
Obesity, elevated blood pressure w/ medication 0.05 1.31*
Hyperlipidemia w/o medication, hypertension w/ medication 0.23 1.13
Hyperlipidemia w/o medication, elevated blood pressure w/
medication
0.10 1.30*
Hypertension w/ medication, elevated blood pressure w/
medication
0.11 1.23*
Hypertension w/o medication, elevated blood pressure w/o
medication
0.09 1.34
Obesity, hyperlipidemia w/o medication, hypertension w/
medication
0.11 1.29*
Hyperlipidemia w/o medication, hypertension w/ medication,
elevated blood pressure w/ medication
0.10 1.30*
Obesity, hyperlipidemia w/o medication, elevated blood pressure
w/ medication
0.03 1.41*
Obesity, hypertension w/ medication, elevated blood pressure w/
medication
0.05 1.31*
Obesity, hyperlipidemia w/o medication, hypertension w/
medication, elevated blood pressure w/ medication
0.04 1.41*
* = p < 0.05; ** = p < 0.01; *** = p < 0.0001
The straightforward interpretation of the results makes this method popular, however, it fails to take into account
differences among the treatment and control subpopulations within each phenotype. For example, consider the
{hyperlipidemia without medications, hypertension with medications} rule. Table 3 shows some differences
between patients who received statins and those that did not within this phenotype. In particular, the statin receiving
subpopulation has a higher prevalence of renal disease, is more likely to be male, and has higher LDL cholesterol
6. than the non-statin receiving group. An increased LDL is a known risk factor for cardiovascular disease and other
complications, thus the observed difference in diabetes outcome between the two groups may be in part due to statin
use and other clinical differences.
Instead of producing the treatment effect of statins, the naïve method is reflecting a combination of the treatment
effect of statins and differences between the two patient populations. As such, attributing the observed difference
entirely to statin use will lead to inaccurate results.
Table 3. Comparison of patient subpopulation characteristics within the {hyperlipidemia w/o drugs; hypertension w/
drugs} phenotype. Subpopulations of patients who take statins and who do not take statins are compared
Characteristic Statin No Statin
Tobacco Use 17.7% 16.1%
Renal Disease** 2.9% 1.5%
Male* 49.6% 47.3%
Total Cholesterol 201 199
LDL Cholesterol* 118 116
* = p < 0.05; ** = p < 0.01; *** = p < 0.0001
Treatment Effect Estimated from Propensity Score
Association rules were discovered for the population, and a propensity score model was used to match statin and
non-statin receiving patients together. Propensity scores were modeled specifically for each rule, and there was
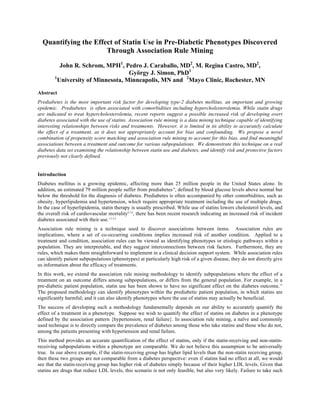
sufficient overlap between the treatment and control groups to successfully match each treatment patient. Figure 1
illustrates the propensity score distribution of the example phenotype discussed above: {hyperlipidemia without
medications, hypertension with medications}. The almost perfect overlap in the propensity score ranges is evident
from this figure. This demonstrates that, while the patients that received statins are generally different from those
that did not within this phenotype, there are still comparable patients on which to base our analysis.
0.0 0.2 0.4 0.6 0.8 1.0
01234
Propensity Score
Density
treatment
control
7. Figure 1. Distribution of propensity scores of an example phenotype for statin (blue) and non-statin (red) groups.
Among the 30 rules discovered, 15 achieved a p-value less than 0.2, and 6 were statistically significant (p < 0.05).
These rules are presented in Table 4. Analogously to Table 2, the rule can be interpreted as the proportional change
in risk of diabetes within the given phenotype when the patient is given statins. For example, the phenotype
{Obesity, hyperlipidemia w/o medication} can be interpreted as: patients that are obese, have hyperlipidemia, and
are not on any hyperlipidemia medication (other than statins) are 15% more likely to develop diabetes when given
statins. You will notice that the relative risk has decreased from that calculated using the naïve method (1.25 versus
1.15). Some of the risk of developing diabetes was incorrectly attributed to statin use instead of to the treatment
group being at higher risk of diabetes irrespective of statin use.
Table 4. Risk of diabetes using association rule mining with propensity score matching.
Itemset Sup RR
Obesity, elevated blood pressure w/ meds 0.05
1
1.73*
Hyperlipidemia w/o meds, hypertension w/ meds 0.23 1.35*
Hyperlipidemia w/o meds, elevated blood pressure w/ meds 0.10 1.62*
Obesity, Hyperlipidemia w/o meds, elevated blood pressure
w/ meds
0.03 1.76*
Obesity, hypertension w/ meds, elevated blood pressure w/
meds
0.05 1.76*
Hyperlipidemia w/o meds, hypertension w/ meds, elevated
blood pressure w/ meds
0.10 1.61*
Obesity, hyperlipidemia w/ meds 0.19 0.59
Hyperlipidemia w/ meds, hypertension w/ meds 0.02 0.59
Hyperlipidemia w/o meds 0.52 1.14
Elevated blood pressure w/ meds 0.12 1.32
Obesity, hyperlipidemia w/o meds 0.19 1.15
Obesity, hypertension w/ meds 0.12 1.19
Hypertension w/ meds, elevated blood pressure w/ meds 0.11 1.31
Obesity, hyperlipidemia w/o meds, hypertension w/ meds 0.11 1.41
Obesity, hyperlipidemia w/o meds, hypertension w/ meds,
elevated blood pressure w/ meds
0.04 1.72
* = p < 0.05; ** = p < 0.01; *** = p < 0.0001
These results suggest phenotypes with unique risks of developing diabetes associated with the use of statins.
Patients with hyperlipidemia and a prescription for non-statin anti-hyperlipidemia medication, and either obesity or
treated and controlled hypertension, appear to be at a lower risk of developing diabetes when they are also
prescribed statins. Patients with untreated hyperlipidemia, and hypertension that remains uncontrolled despite
medications, are at a higher risk of developing diabetes (RR = 1.62). However, patients with untreated
hyperlipidemia, and treated and controlled hypertension are at an intermediate risk of developing diabetes (RR =
1.35).
These results generally parallel the results seen using the naïve method, but matching produces relative risks that are
more cleanly attributable to the treatment. Figure 2 depicts changes in relative risk by phenotype using these two
methods. Each point is a phenotype, the x-axis is the relative risk calculated using the matched method, the y-axis is
the relative risk calculated using the naïve method, and the line indicates the two methods being equal. The vast
majority of phenotypes (90%) had the same effect direction using the two methods (i.e. the two methods were in
agreement regarding whether statin use in the particular phenotype is beneficial or harmful). While the effect for a
few phenotypes did change direction, almost all had the relative risk estimates change, as shown in Figure 2.
8. ●
●
●
●
● ●
●
●
●
●
●
●
●
●
●
●
●
●
●
●
●
●
●
●
●
●
●
●
●
●
0.6 0.8 1.0 1.2 1.4 1.6 1.8
0.91.01.11.21.31.4
Matched
Unmatched
Figure 2. Relative risk of propensity score matched versus unmatched rules
Conclusion
In this study, we measured the unmatched relationship between statin use and diabetes among phenotypes identified
through association rule mining. This method found that statins statistically significantly increase the risk of
diabetes between 13% and 41% among various phenotypes. However, this method of calculating relative risk
assumes that the treatment and control groups are generally similar. We note that this is not always the case — the
treatment group tends to be sicker than the control group, and thus more likely to develop diabetes irrespective of
their use of statins.
We demonstrated that propensity score matching could be used to account for the bias and confounding present
among the treatment and control groups. After introducing this method, we found three distinct relationships with
unique risks between statin use and diabetes. For patients with hyperlipidemia, a prescription for a non-statin anti-
hyperlipidemia medication, and either obesity or treated and controlled hypertension, also receiving statins tends to
lower their risk of developing diabetes (RR = 0.59). Patients with hyperlipidemia not receiving any non-statin anti-
hyperlipidemia medications and treated and controlled hypertension are at an intermediate risk of developing
diabetes when receiving statins (RR = 1.35). While, patients with untreated hyperlipidemia and treated but
uncontrolled hypertension are at a higher risk of developing diabetes while receiving statins (RR = 1.62).
From the clinical point of view, these results suggest the multiplicity of prediabetes phenotypes that may have
different susceptibilities, and perhaps different outcomes, based on the associated comorbidities and the drugs used
to treat such comorbidities. This includes what seems to be a previously unrecognized diabetes risk reduction in
some prediabetes phenotypes after statin use.
These association rules are additionally helpful as they are easily interpretable, and could be quickly incorporated
into clinical practice using computer-based decision support tools. Furthermore, as demonstrated using this
technique, it is possible to identify patient phenotypes that respond to treatment differently, both from the general
9. population and from each other. This characteristic further highlights the importance of properly accounting for
confounding while using any data mining technique: it is difficult to ascertain whether a discovered relationship is
due to a subpopulation being sicker than another population, or truly due to the presence of a particular treatment.
References
1. Rajpathak SN, Kumbhani DJ, Crandall J, et al., Statin Therapy and Risk of Developing Type 2 Diabetes: A
Meta-Analysis. Diabetes Care, 2009. 32(10): p. 1924-1929.
2. Sattar N, Preiss D, Murray HM, et al., Statins and risk of incident diabetes: a collaborative meta-analysis of
randomised statin trials. Lancet, 2010. 375(9716): p. 735-42.
3. Preiss, D., et al., Risk of incident diabetes with intensive-dose compared with moderate-dose statin therapy: a
meta-analysis. JAMA, 2011. 305(24): p. 2556-64.
4. Waters, D.D., et al., Predictors of new-onset diabetes in patients treated with atorvastatin: results from 3 large
randomized clinical trials. Journal of the American College of Cardiology, 2011. 57(14): p. 1535-45.
5. Culver, A.L., et al., Statin use and risk of diabetes mellitus in postmenopausal women in the Women's Health
Initiative. Archives of internal medicine, 2012. 172(2): p. 144-52.
6. Costa, J., et al., Efficacy of lipid lowering drug treatment for diabetic and non-diabetic patients: meta-analysis
of randomised controlled trials. BMJ, 2006. 332(7550): p. 1115-24.
7. Cholesterol Treatment Trialists, C., The effects of lowering LDL cholesterol with statin therapy in people at low
risk of vascular disease: meta-analysis of individual data from 27 randomised trials. The Lancet, 2012.
380(9841): p. 581-90.
8. Baigent, C., et al., Efficacy and safety of cholesterol-lowering treatment: prospective meta-analysis of data from
90,056 participants in 14 randomised trials of statins. Lancet, 2005. 366(9493): p. 1267-78.
9. Austin, P., An Introduction to Propensity Score Methods for Reducing the Effects of Confounding in
Observational Studies. Multivariate Behav Res, 2011. 46(3): p. 399-424.
10. Friedman, J., Hastie, T., Tibshirani, R., Regularization Paths for Generalized Linear Models via Coordinate
Descent. J Statistical Software, 2010. 33(1).
11. Hastie, T., Tibshirani, R., Friedman, J. Elements of Statistical Learning. New York: Springer, 2009. Print.
12. Agrawal R, Srikant R. Fast algorithms for mining association rules. In VLDB Conference, 1994.
13. American Diabetes Association. Executive summary: Standards of medical care in diabetes—2013. In Diabetes
Care. American Diabetes Association, 2012.
14. National diabetes fact sheet: national estimates and general information on diabetes and prediabetes in the
United States, 2011. In: Department of Health and Human Services CfDCaP, ed. Atlanta, GA: U.S. ; 2011.
15. Caraballo PJ, Castro MR, Yawn BP, Cha SS, Melton LJ. Statin Use, Diabetes Incidence and Mortality in
Prediabetic Patients [abstract]. Diabetes. June 24, 2011 2011; 60(Supplement 1): A356.
16. Simon GJ, Kumar V and Li PW. A simple statistical model and association rule filtering for classification. In
ACM International Conference on Knowledge Discovery and Data Mining (KDD), 2011.
17. Oakes JM, Kaufman JS. Methods in Social Epidemiology. San Francisco: Wiley, 2006. Print.