Thin Film Pressure Estimation of Argon and Water using LAMMPS
Mars STEM poster final draft
1. Using Restricted Principle Component Analysis for
Martian Surface Spectral Endmember Selection
Alexander H. Reedy and David R. Klassen Rowan University Department of Physics & Astronomy
Abstract
Although the Martian atmosphere is thin, with a typical surface pressure of 7 mbar (c.f.
1000 mbar typical for Earth), the aerosols within it play an important role in the climate
and weather cycles for the planet. Water is present as both vapor and ice in the form of
cirrus-like clouds, and recent work indicates these clouds may play an important role in the
overall water cycle on Mars. The overarching goal of this program is to measure the water
content in these clouds—this is done through measuring their optical depth. The
calculation of optical depth is dependent upon an accurate measurement of the surface
intrinsic reflectance, but retrieving the surface reflectance requires detailed knowledge of
the atmosphere and aerosols above it. One solution to this circular problem is to represent
the surface as a linear combination of a small number of spectrally pure endmembers
which can be recovered from the data using principal component analysis (PCA). This
research focuses on using a more restricted method of PCA and comparing its effectiveness
in determining the linearly uncorrelated variables of the Martian imaging spectra to that of
previously applied PCA methods. This version increases the restrictions in incident and
emission angle of the data from ~70°–80° to 50°, effectively decreasing the amount of data
affected by geometric and atmospheric path-length effects on the spectra and should
create a more robust technique. Robustness is defined as the degree of consistency in the
significant eigenvector spectra through time. We will present the eigenvector spectra from
several dates of observations from 1995–2001 relative to their overall median and compare
them to previous, less restrictive, PCA tests.
Data
• Images taken at NASA Infrared Telescope Facility on Mauna Kea, HI
• Using NSFCAM, 256×256 InSb array with circular variable filter
• Image cubes of Mars covering 1.5–4.1 µm
• This work uses data collected during oppositions from1995-2001
Procedure
• Two methods of restricted PCA (see below) done on data from 1995 – 2001 opposition.
• Restricted incident/emission angle to 50°
• Restricted incident/emission angle to 50° and removed 2µm region due to
dominance of saturated 𝐶𝑂2 gas absorption band which, as an
atmospheric feature does not contribute to analysis of the surface.
• Resulting eigenvector spectra is then analyzed for consistency
• The first four eigenvectors are plotted on a single graph for all dates and
sets.
• The median of each eigenvector is plotted and root-mean-square (RMS)
error is calculated from the median.
• An average RMS error is then calculated for each eigenvector in each test
and an average of this average for the first three eigenvectors is calculated.
• Best method of endmember determination is done by comparing the average RMS
values.
• The lowest RMS average the more consistence the test is and can be
considered as a best method for endmember selection.
Principal Component Analysis (PCA)
• PCA is a statistical method of turning correlated
data into linearly uncorrelated data
• Origin is set at the center of the data cloud and a
line is drawn along the direction of largest variance,
this is the 0th dimension.
• Another line is drawn along the direction of the
second highest variance, this is the 1st dimension.
• Process is continued until we have 32 orthogonal
dimension.
• This process is a classic eigenvector problem where
the dimensions are the eigenvectors of the
variance/covariance matrix of the data.
PCA Restriction
Lowest RMS Value of Eigenvectors
PCA Method 𝒆 𝟎 𝒆 𝟏 𝒆 𝟐 𝒆 𝟑 𝒆 𝟎−𝟐
PCA Full 0.0488 0.0772 0.1474 0.1732 0.0912
No 2µm 0.0514 0.0824 0.1409 0.1946 0.0916
No Pole
0.0423 0.0798 0.1490 0.1671 0.0903
No Pole / No 2µm
0.0429 0.0752 0.1322 0.1893 0.0834
Restricted PCA Full 0.0463 0.0648 0.1558 0.1696 0.0890
Restricted No 2µm
0.0483 0.0773 0.1603 0.1790 0.0953
• No Pole / No 2µm maintains has the lowest average RMS value of 0.083 as well has having the lowest value for eigenvector
2.
• Restricted PCA Full has the second lowest average RMS of 0.0890 as well as lowest for eigenvector 1. However it is
important to note that the values found in Restricted PCA Full have an ~10% difference to those of No Pole / No 2µm which
is on the order of observational error in the data itself.
• Restricted No 2µm has the largest average RMS of 0.0953 and does not contain any lowest RMS values.
Analysis and Conclusion
Acknowledgments
This work has been supported by NASA Mars Data Analysis Program (NAG5-11076) and by both the National Science Foundation
Planetary Astronomy and Research at Undergraduate Institutions programs (0307924 and 1008744).
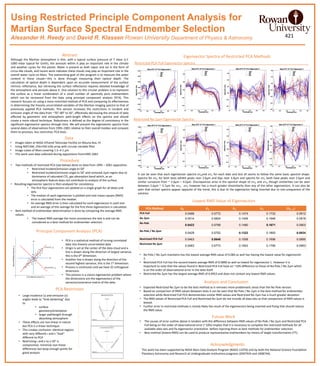
Eigenvector Spectra of Restricted PCA Methods
Restricted PCA Full Eigenvector Spectra____________________________________________________________
Restricted No 2µm Eigenvector Spectra___________________________________________________________
It can be seen that each eigenvector spectra 𝑒𝑣0and 𝑒𝑣1 for each date and test all seems to follow the same basic spectral shape.
Spectra for 𝑒𝑣 𝑜 for both tests exhibit peaks near 2.6µm and dips near 3.0µm and spectra for 𝑒𝑣1 both have peaks near 2.6µm and
similar curvature from ~ 2.6µm – 4.0µm. Discrepancies arise in the spectral shape of 𝑒𝑣2 and 𝑒𝑣3 though similarities can be seen
between 2.6µm ~ 3.7µm for 𝑒𝑣2. 𝑒𝑣3 however has a much greater dissimilarity than any of the other eigenvectors. It can also be
seen that certain spectra appear opposite of the trend, this is due to the eigenvector being inverted due to non-uniqueness of the
solution.
421
• Expected Restricted No 2µm to be the best method as it removes more problematic areas than the No Pole version.
• Based on comparison of RMS values between tests it can be seen that No Pole / No 2µm is the best method for endmember
selection while Restricted Full PCA demonstrates similar RMS values and Restricted No 2µm has a much greater deviation.
• The RMS values of Restricted PCA Full and Restricted No 2µm do not include all data sets so that comparison of RMS values is
biased.
• Further error in restricted methods is mostly likely the result of the eigenvectors being inverted and fixing that should reduce
the RMS value.
Future Work
• The causes of error outline above in tandem with the difference between RMS values of No Pole / No 2µm and Restricted PCA
Full being on the order of observational error (~10%) implies that it is necessary to complete the restricted methods for all
available data sets and fix eigenvector orientation before rejecting them as best methods for endmember selection.
• Best method (lowest RMS) can be used to produce representative endmembers by means of target transformation (TT).
• Large incidence (ι) and emission (ε)
angles leads to “limb darkening” due
to
• surface
geometry/orientation
• larger pathlength through
absorbing atmosphere
• These effects are non-linear in nature
but PCA is a linear technique
• This creates confusion: identical regions
with very different ι and ε “look”
different to PCA
• Restricting ι and ε to ≤ 50° is
compromise: minimize non-linear
differences but keep enough points for
good analysis