Download as PDF, PPTX

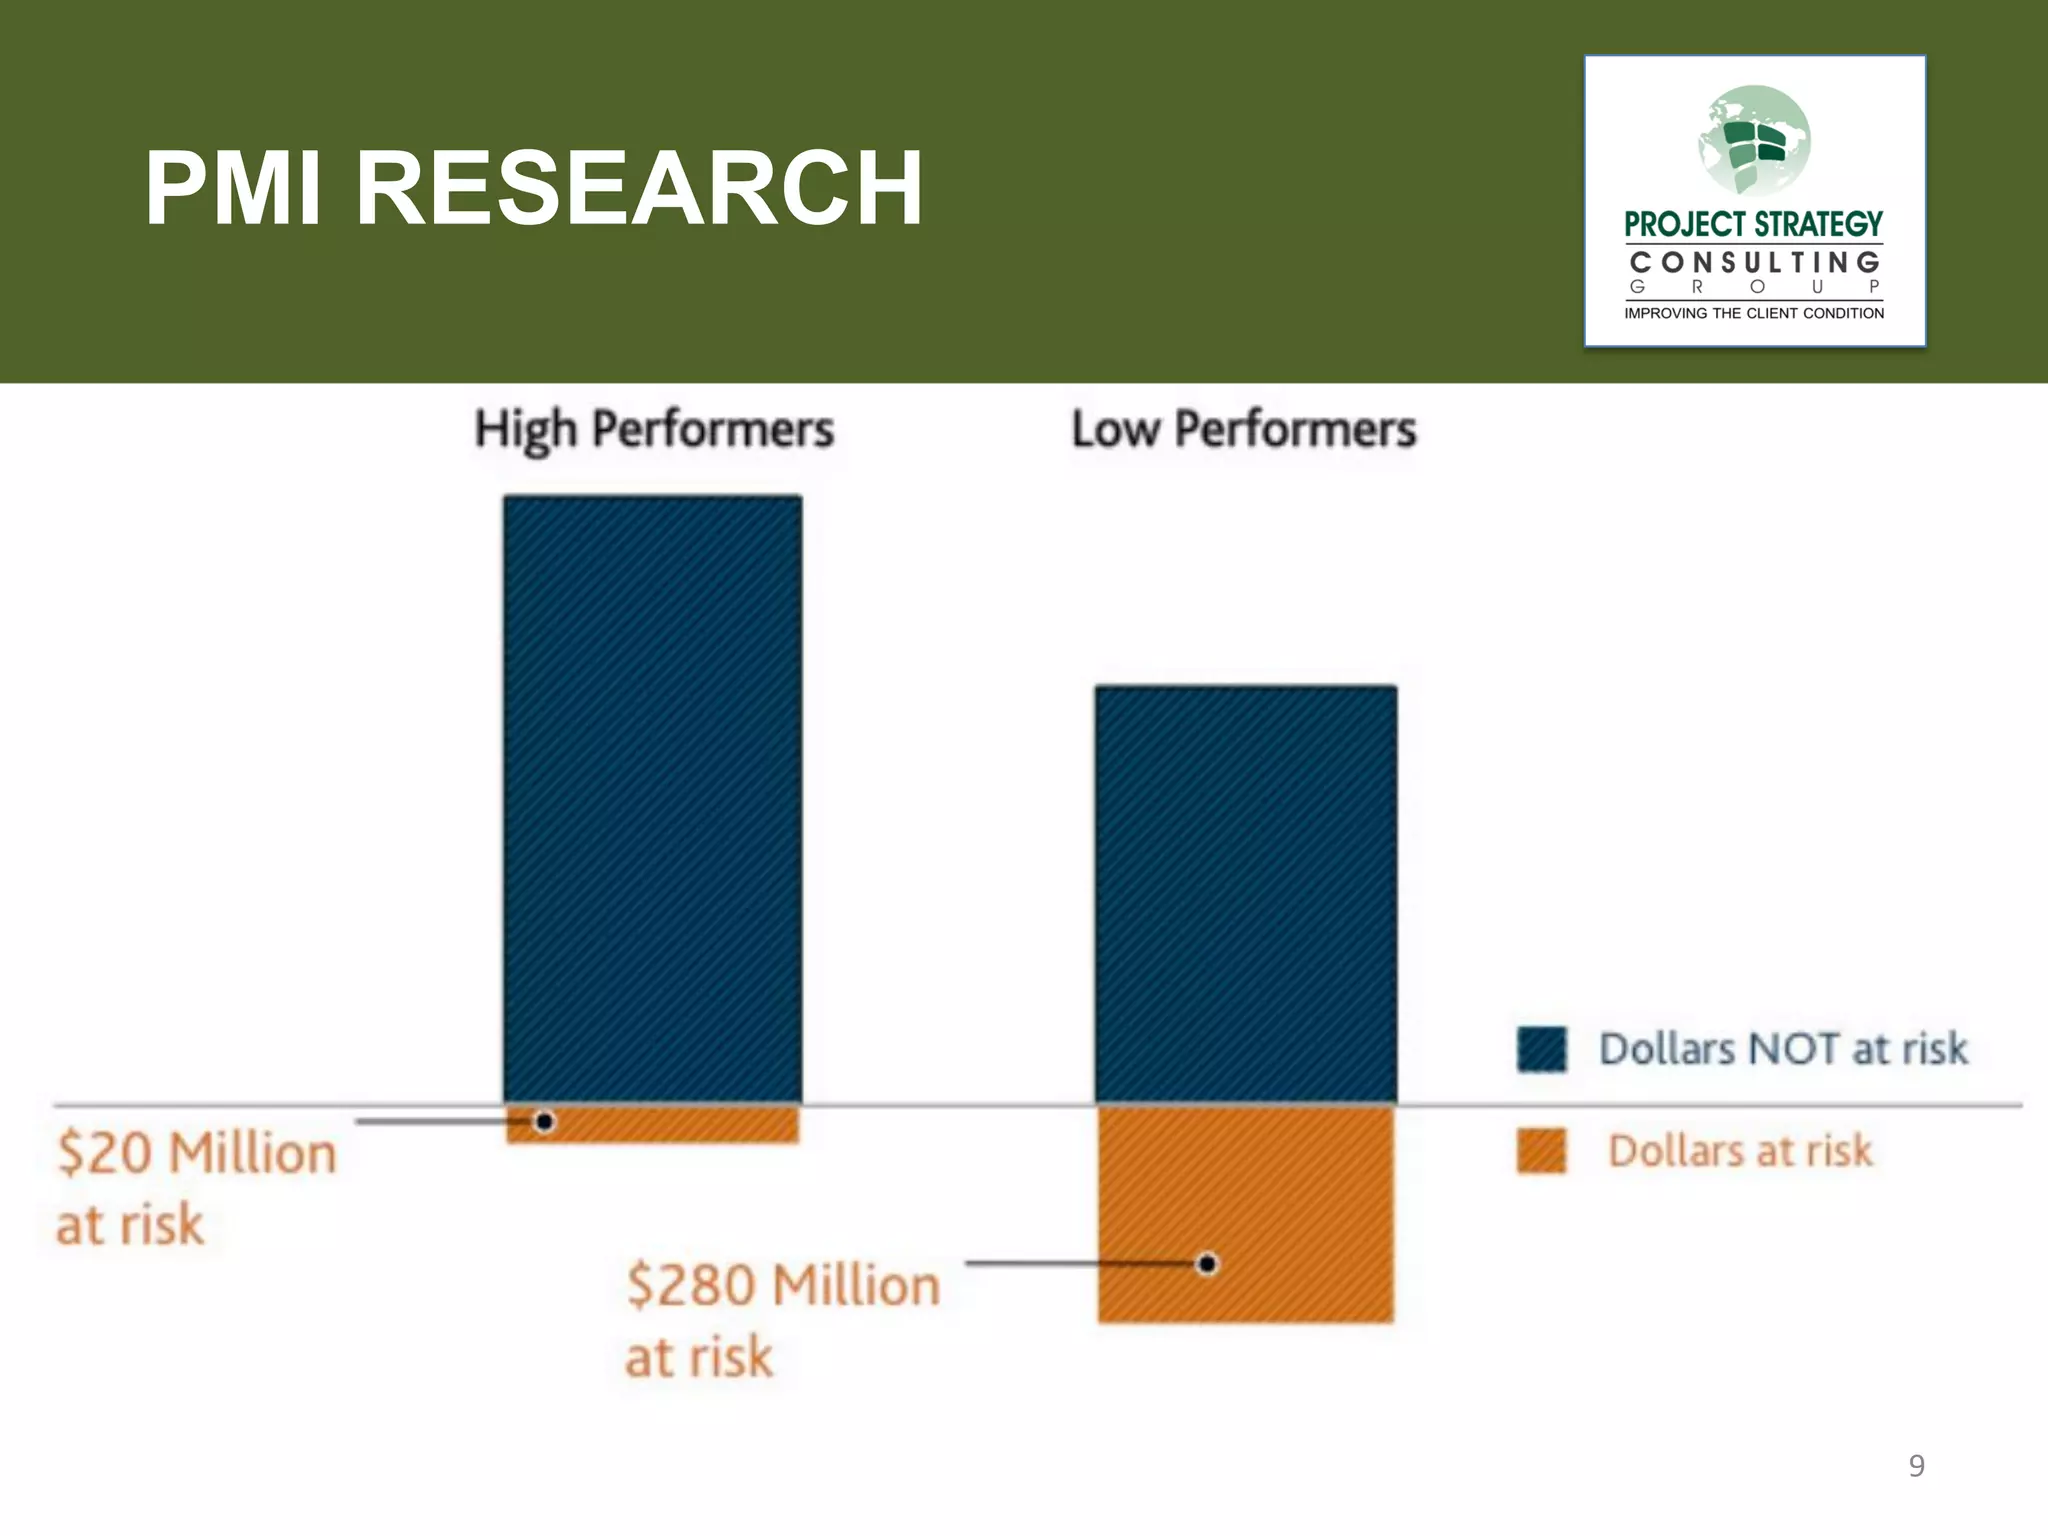
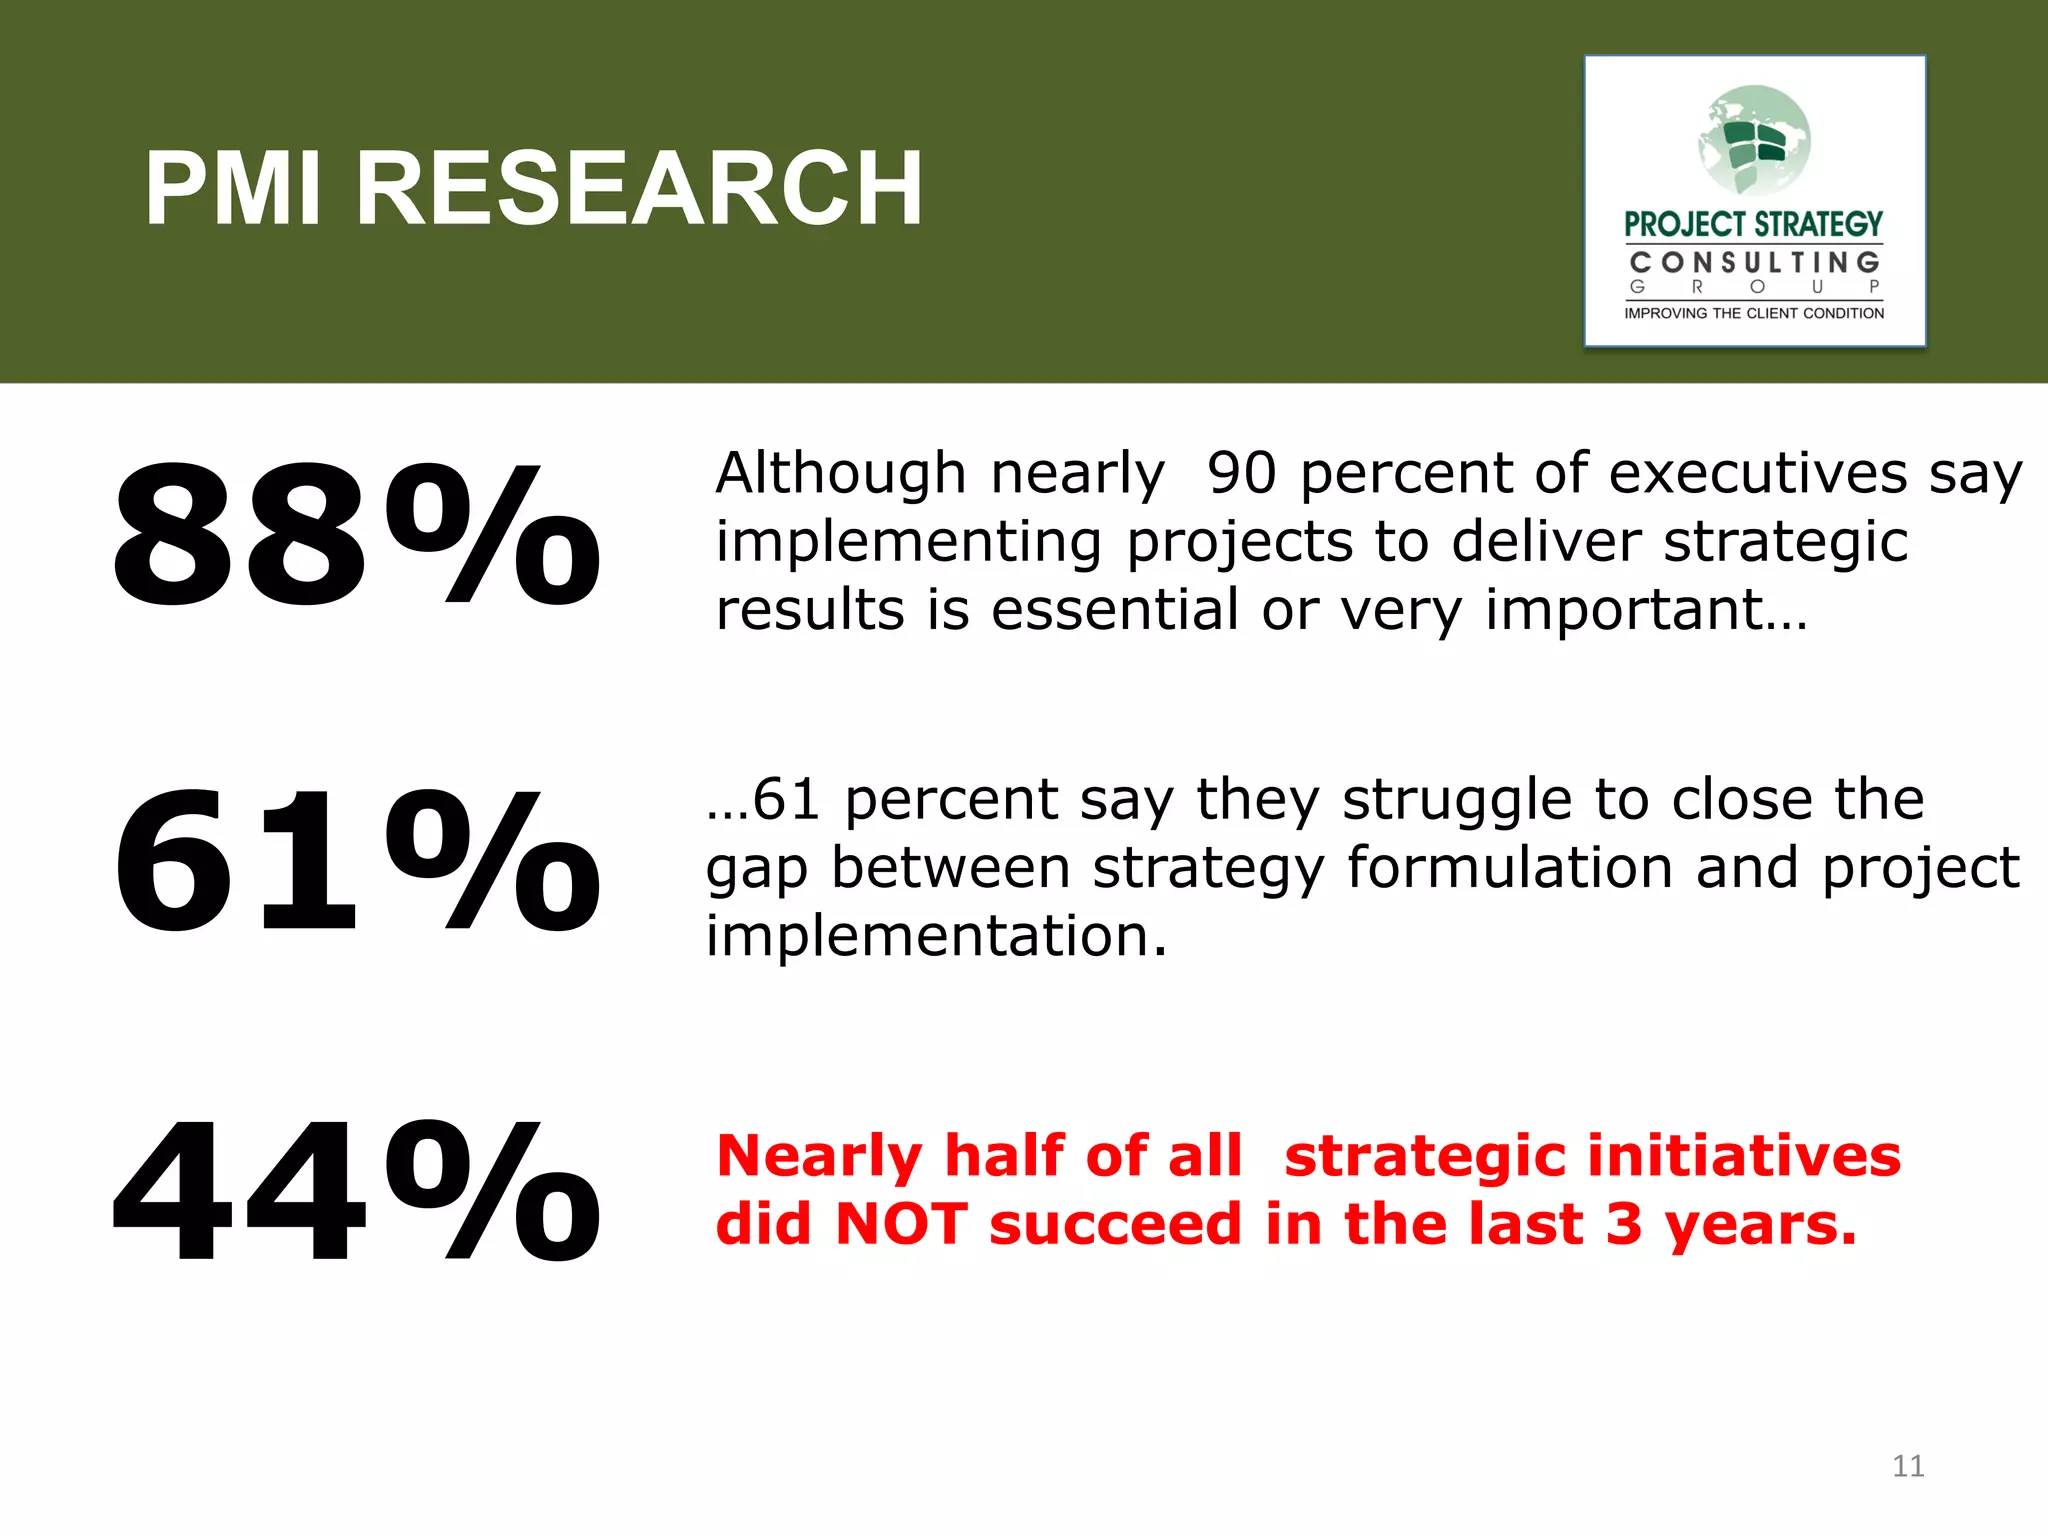

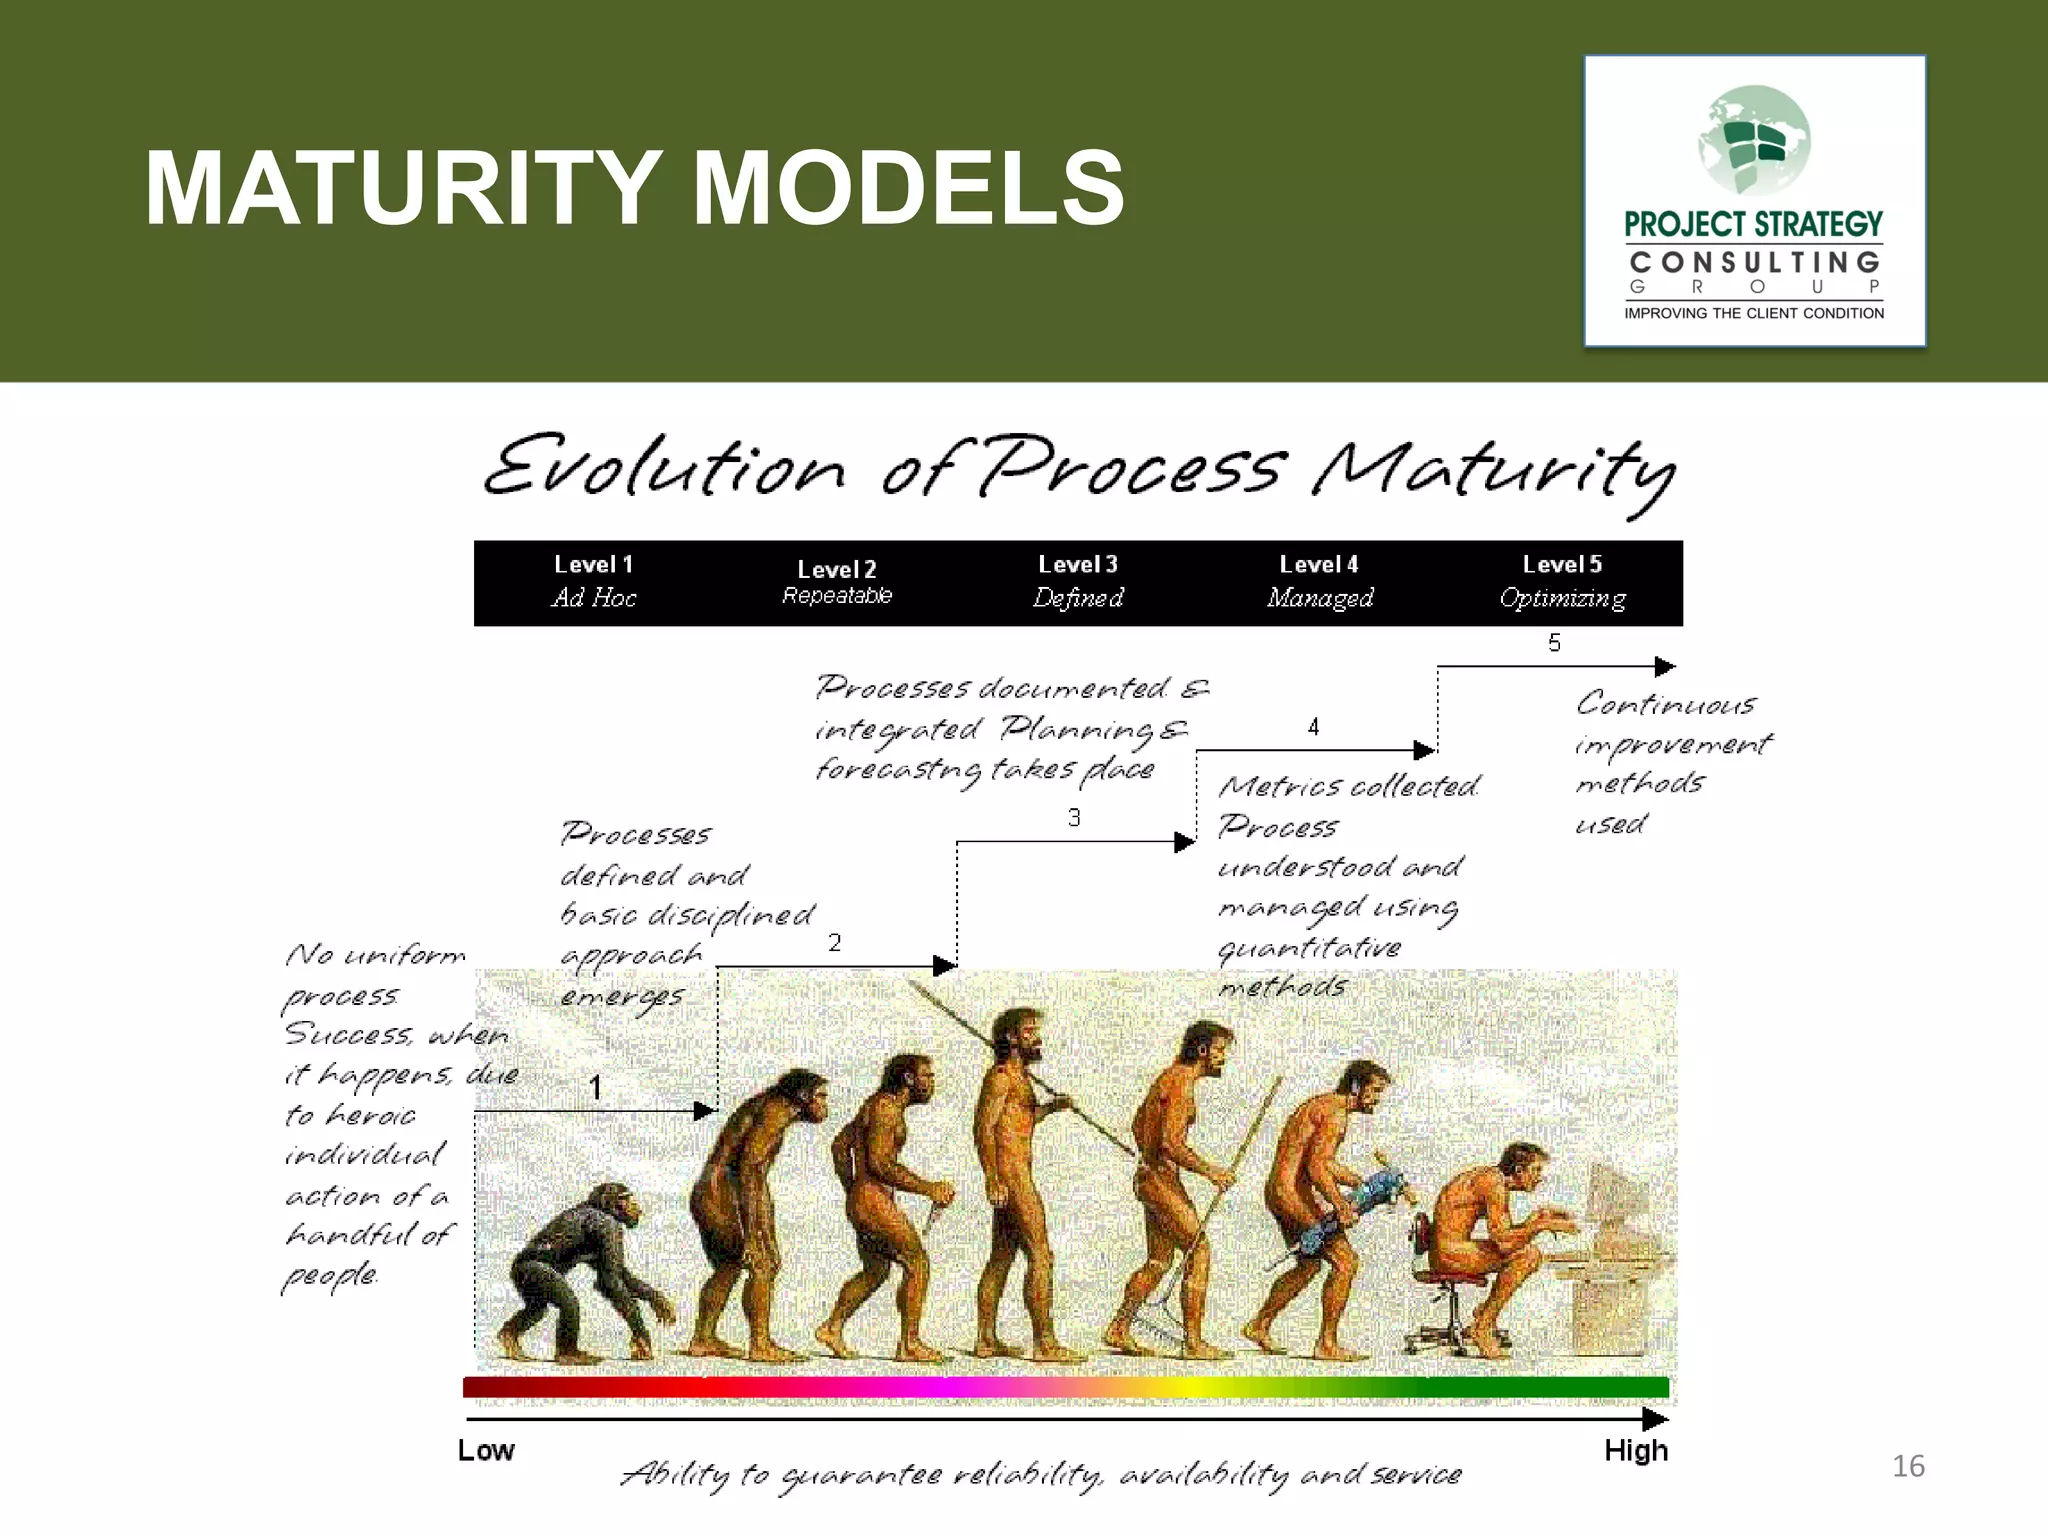
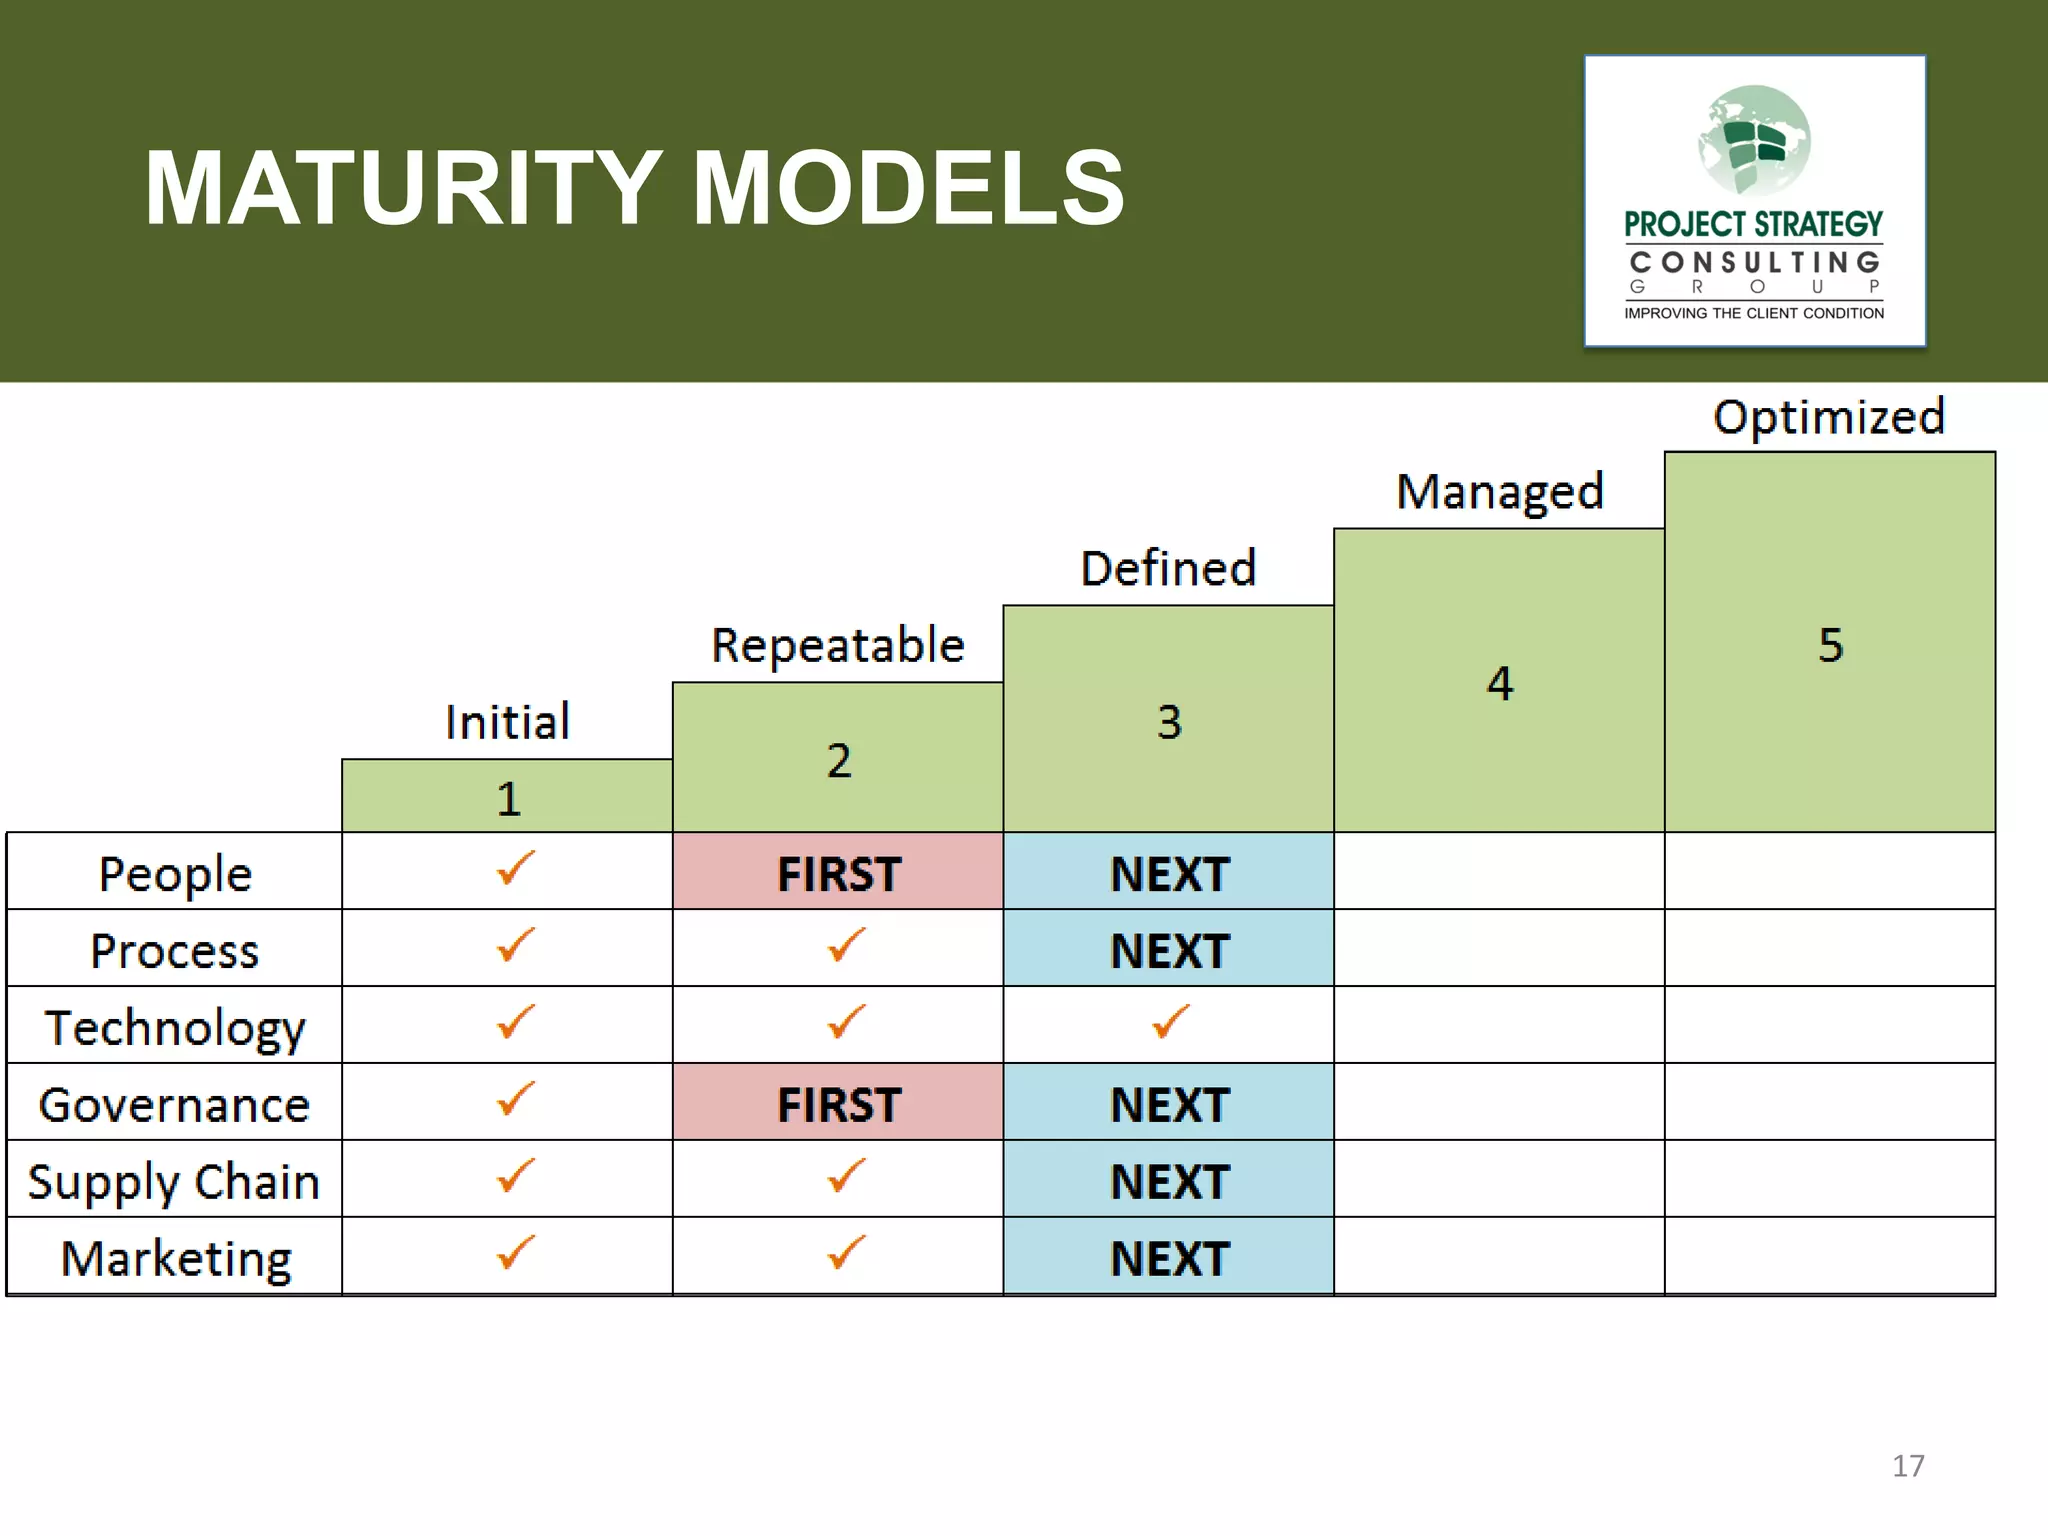
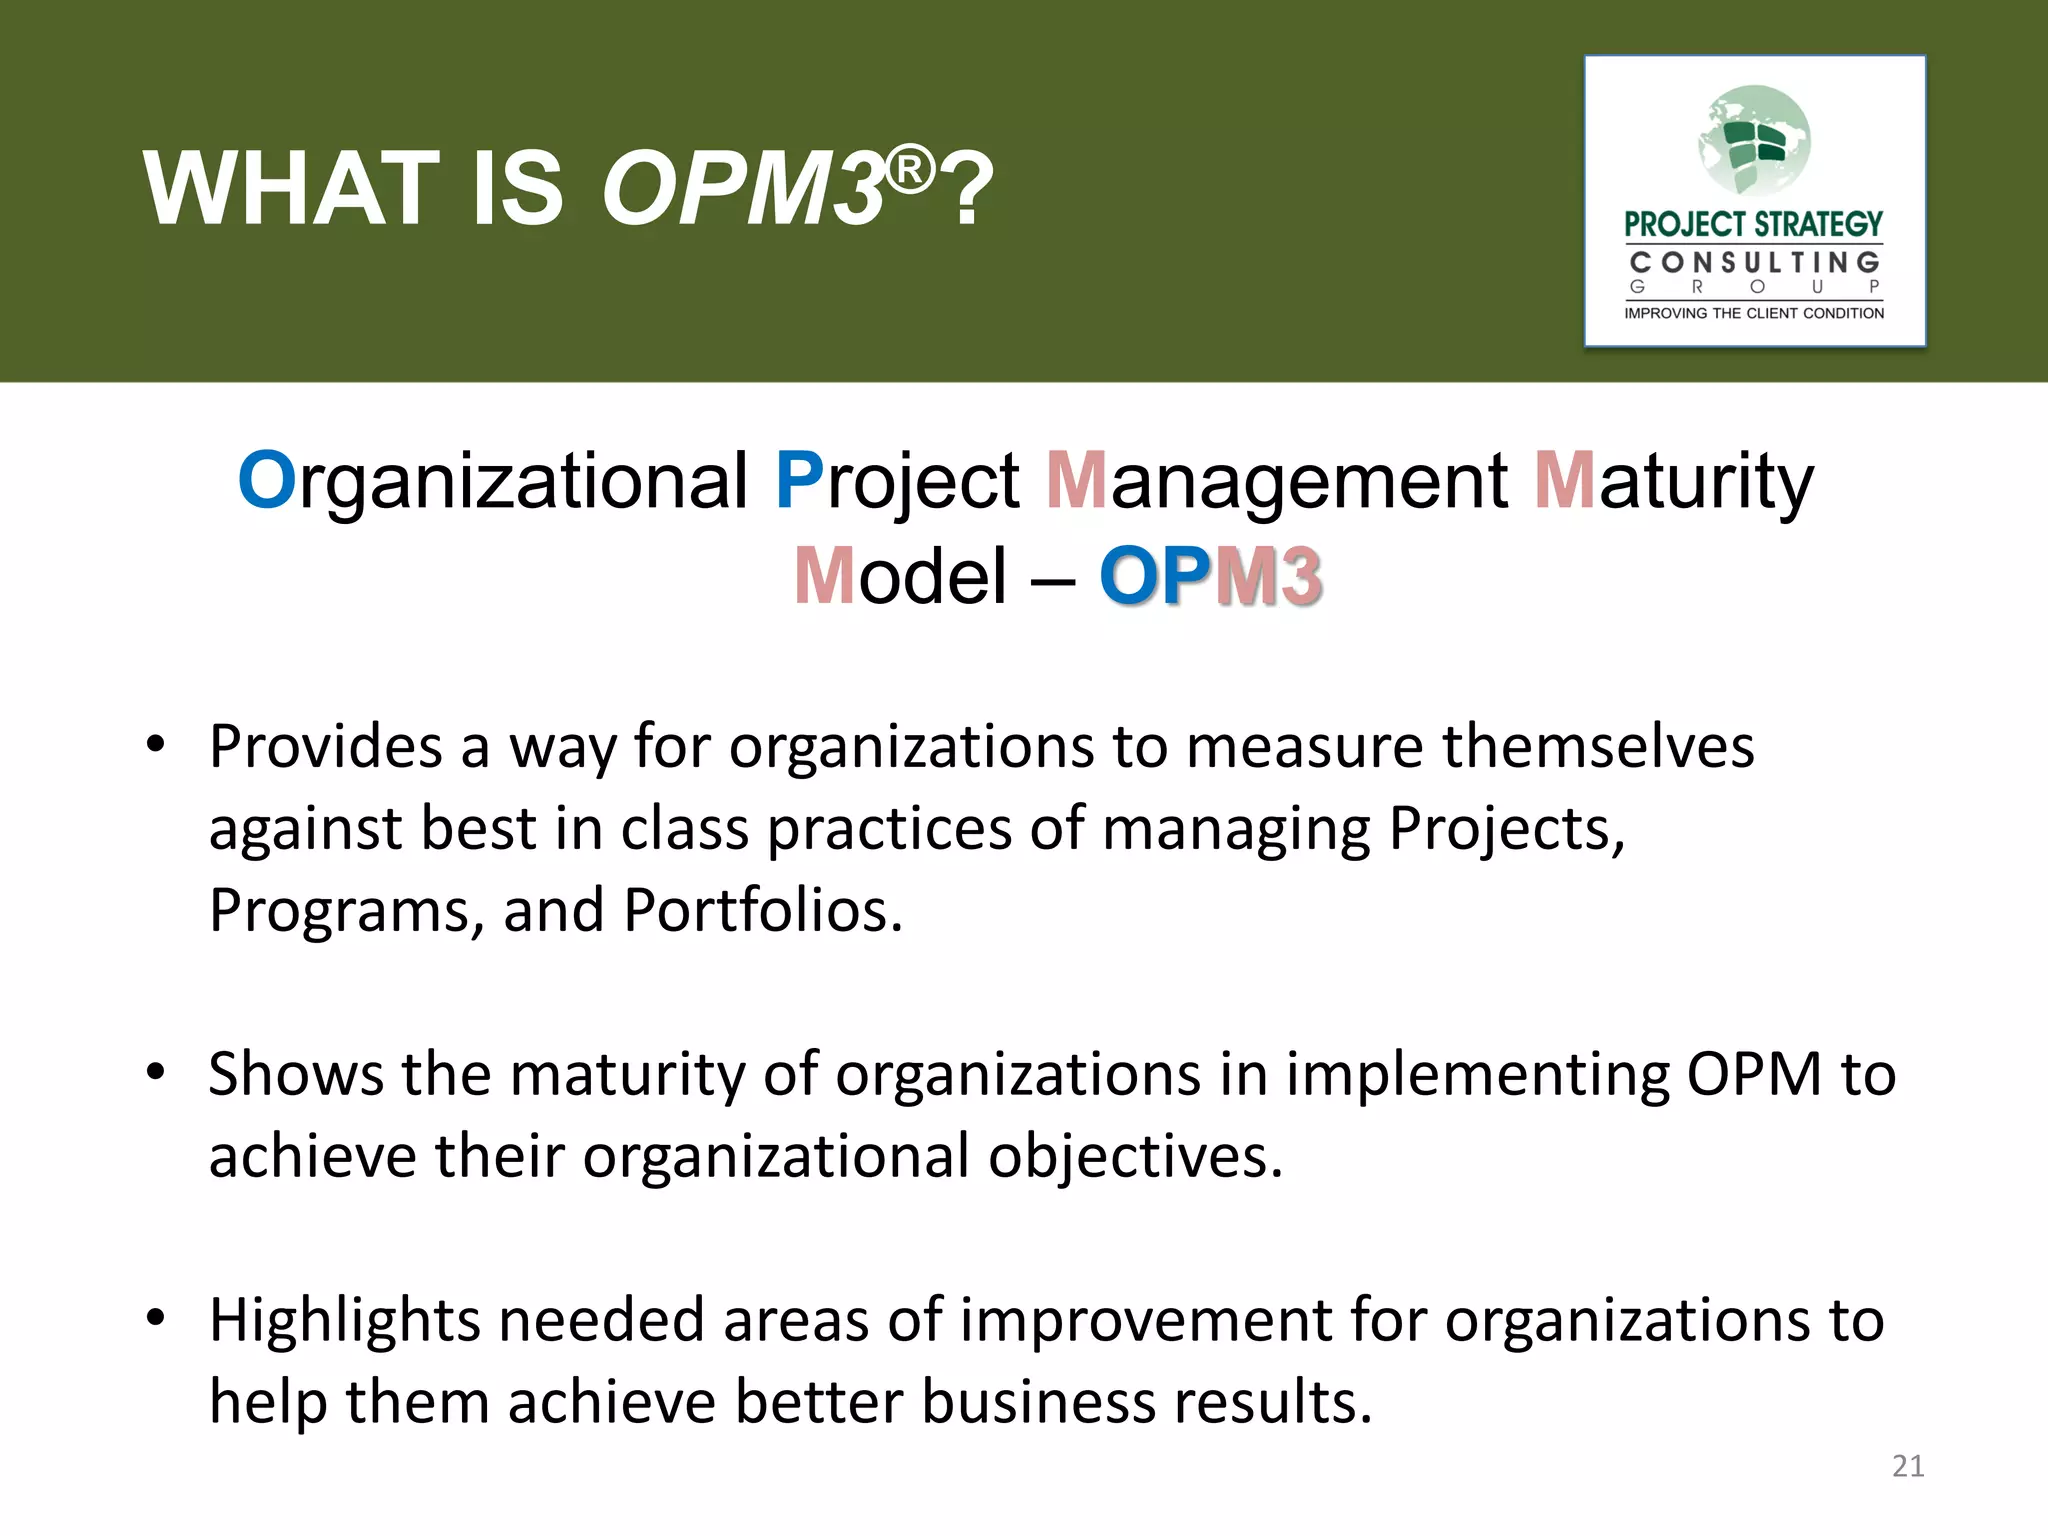
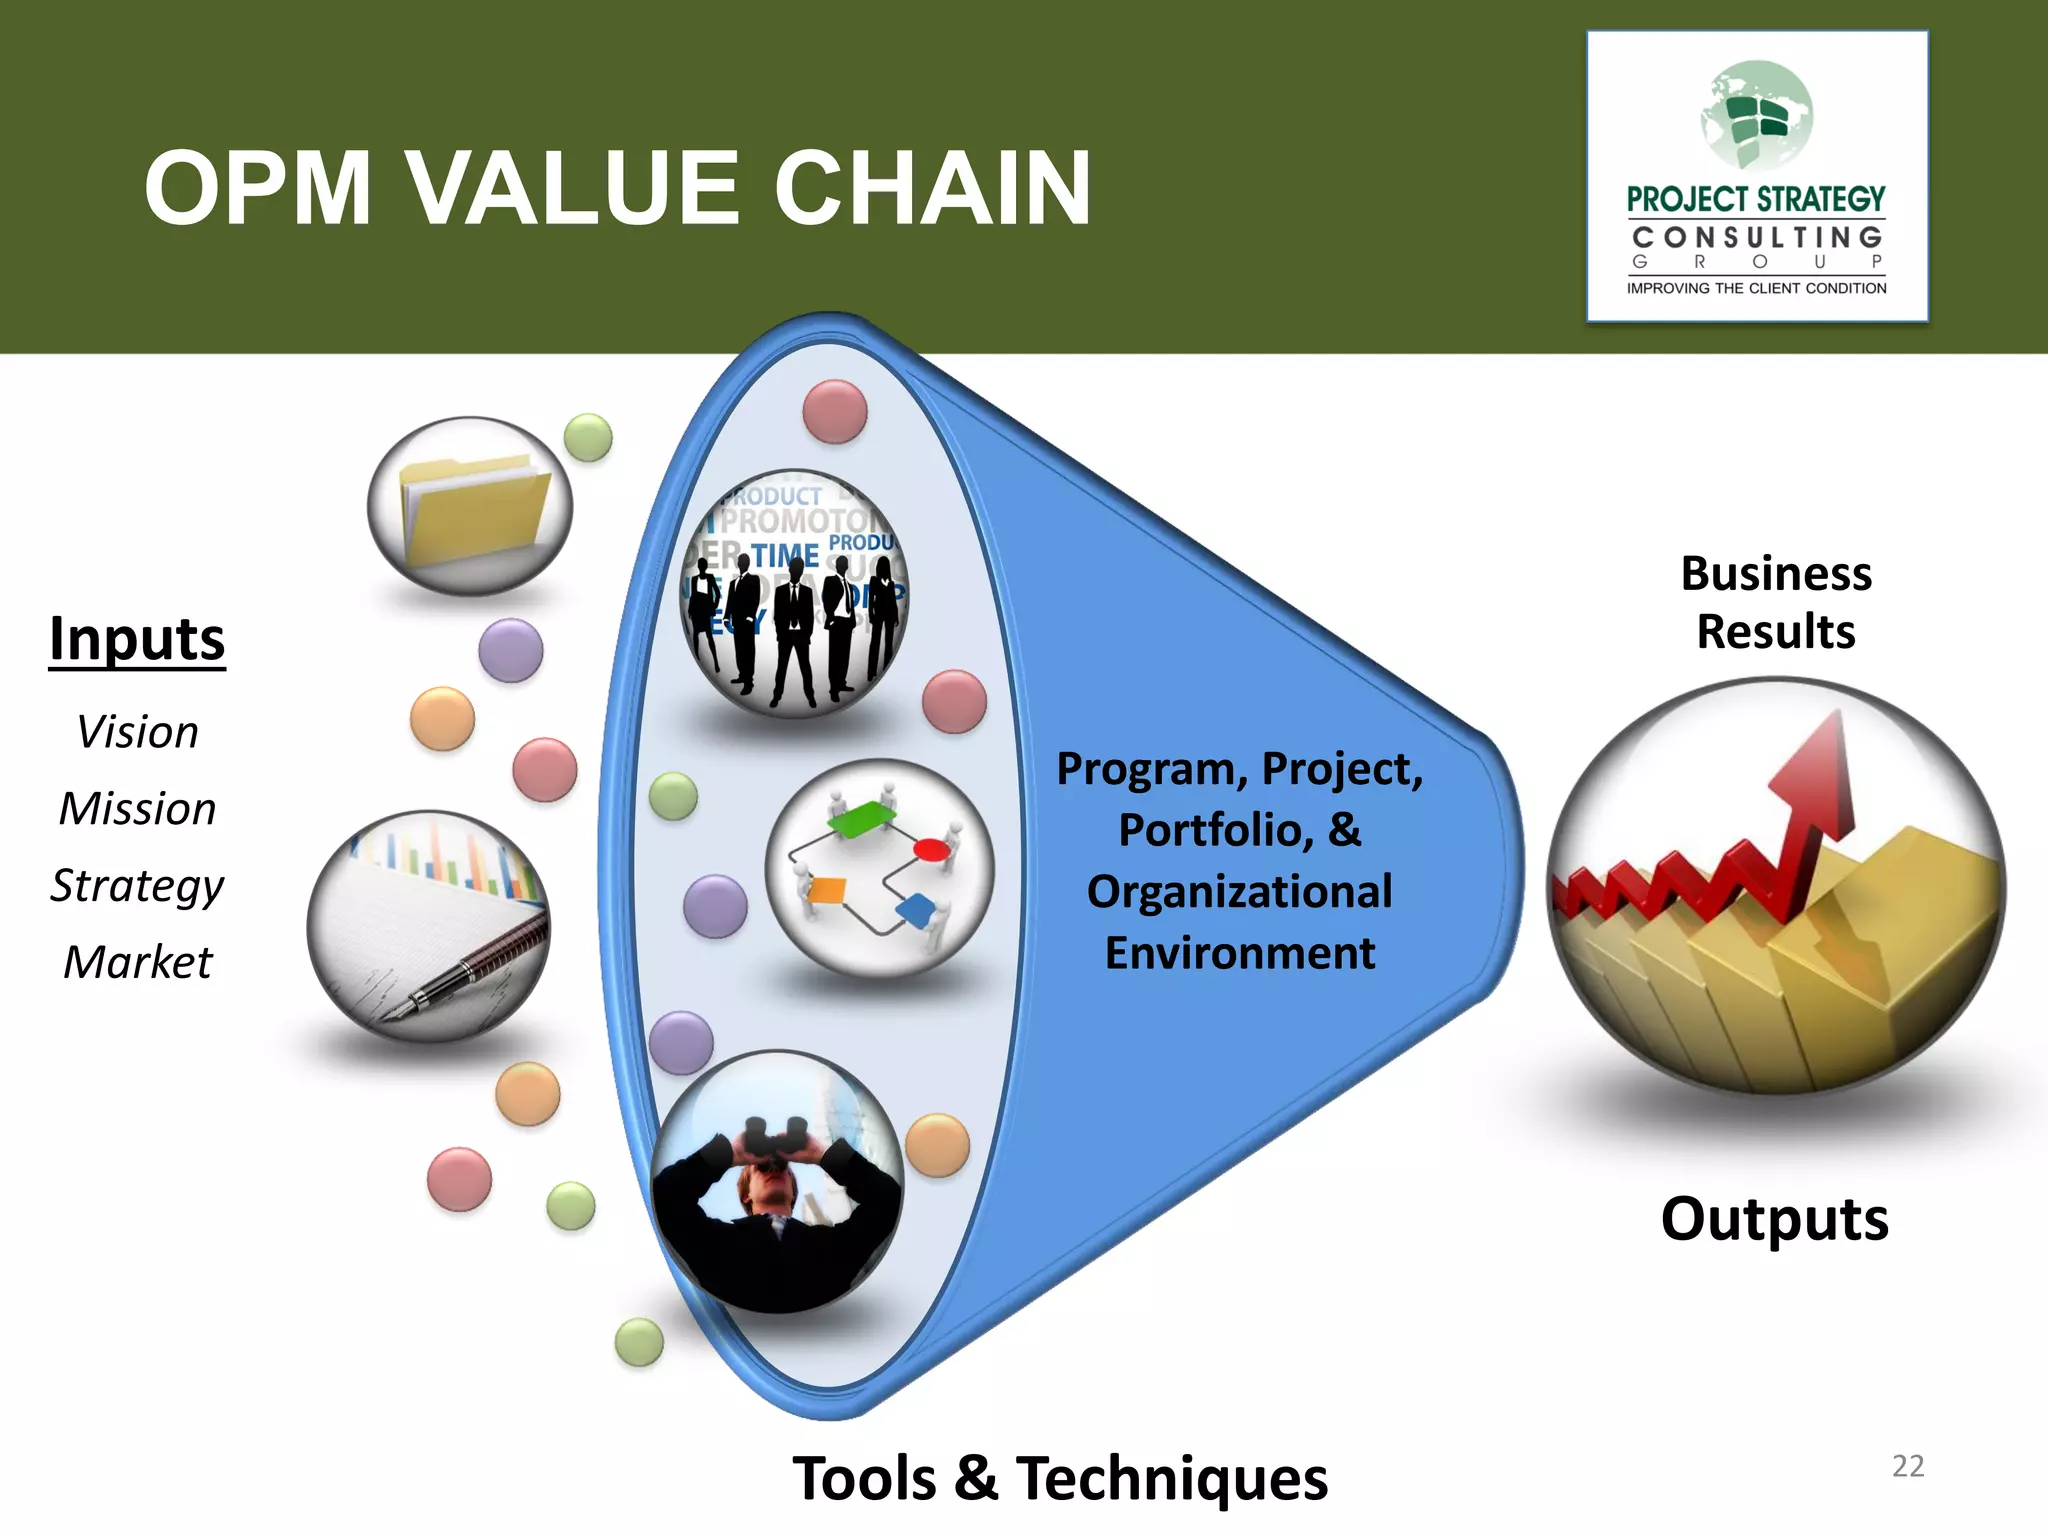
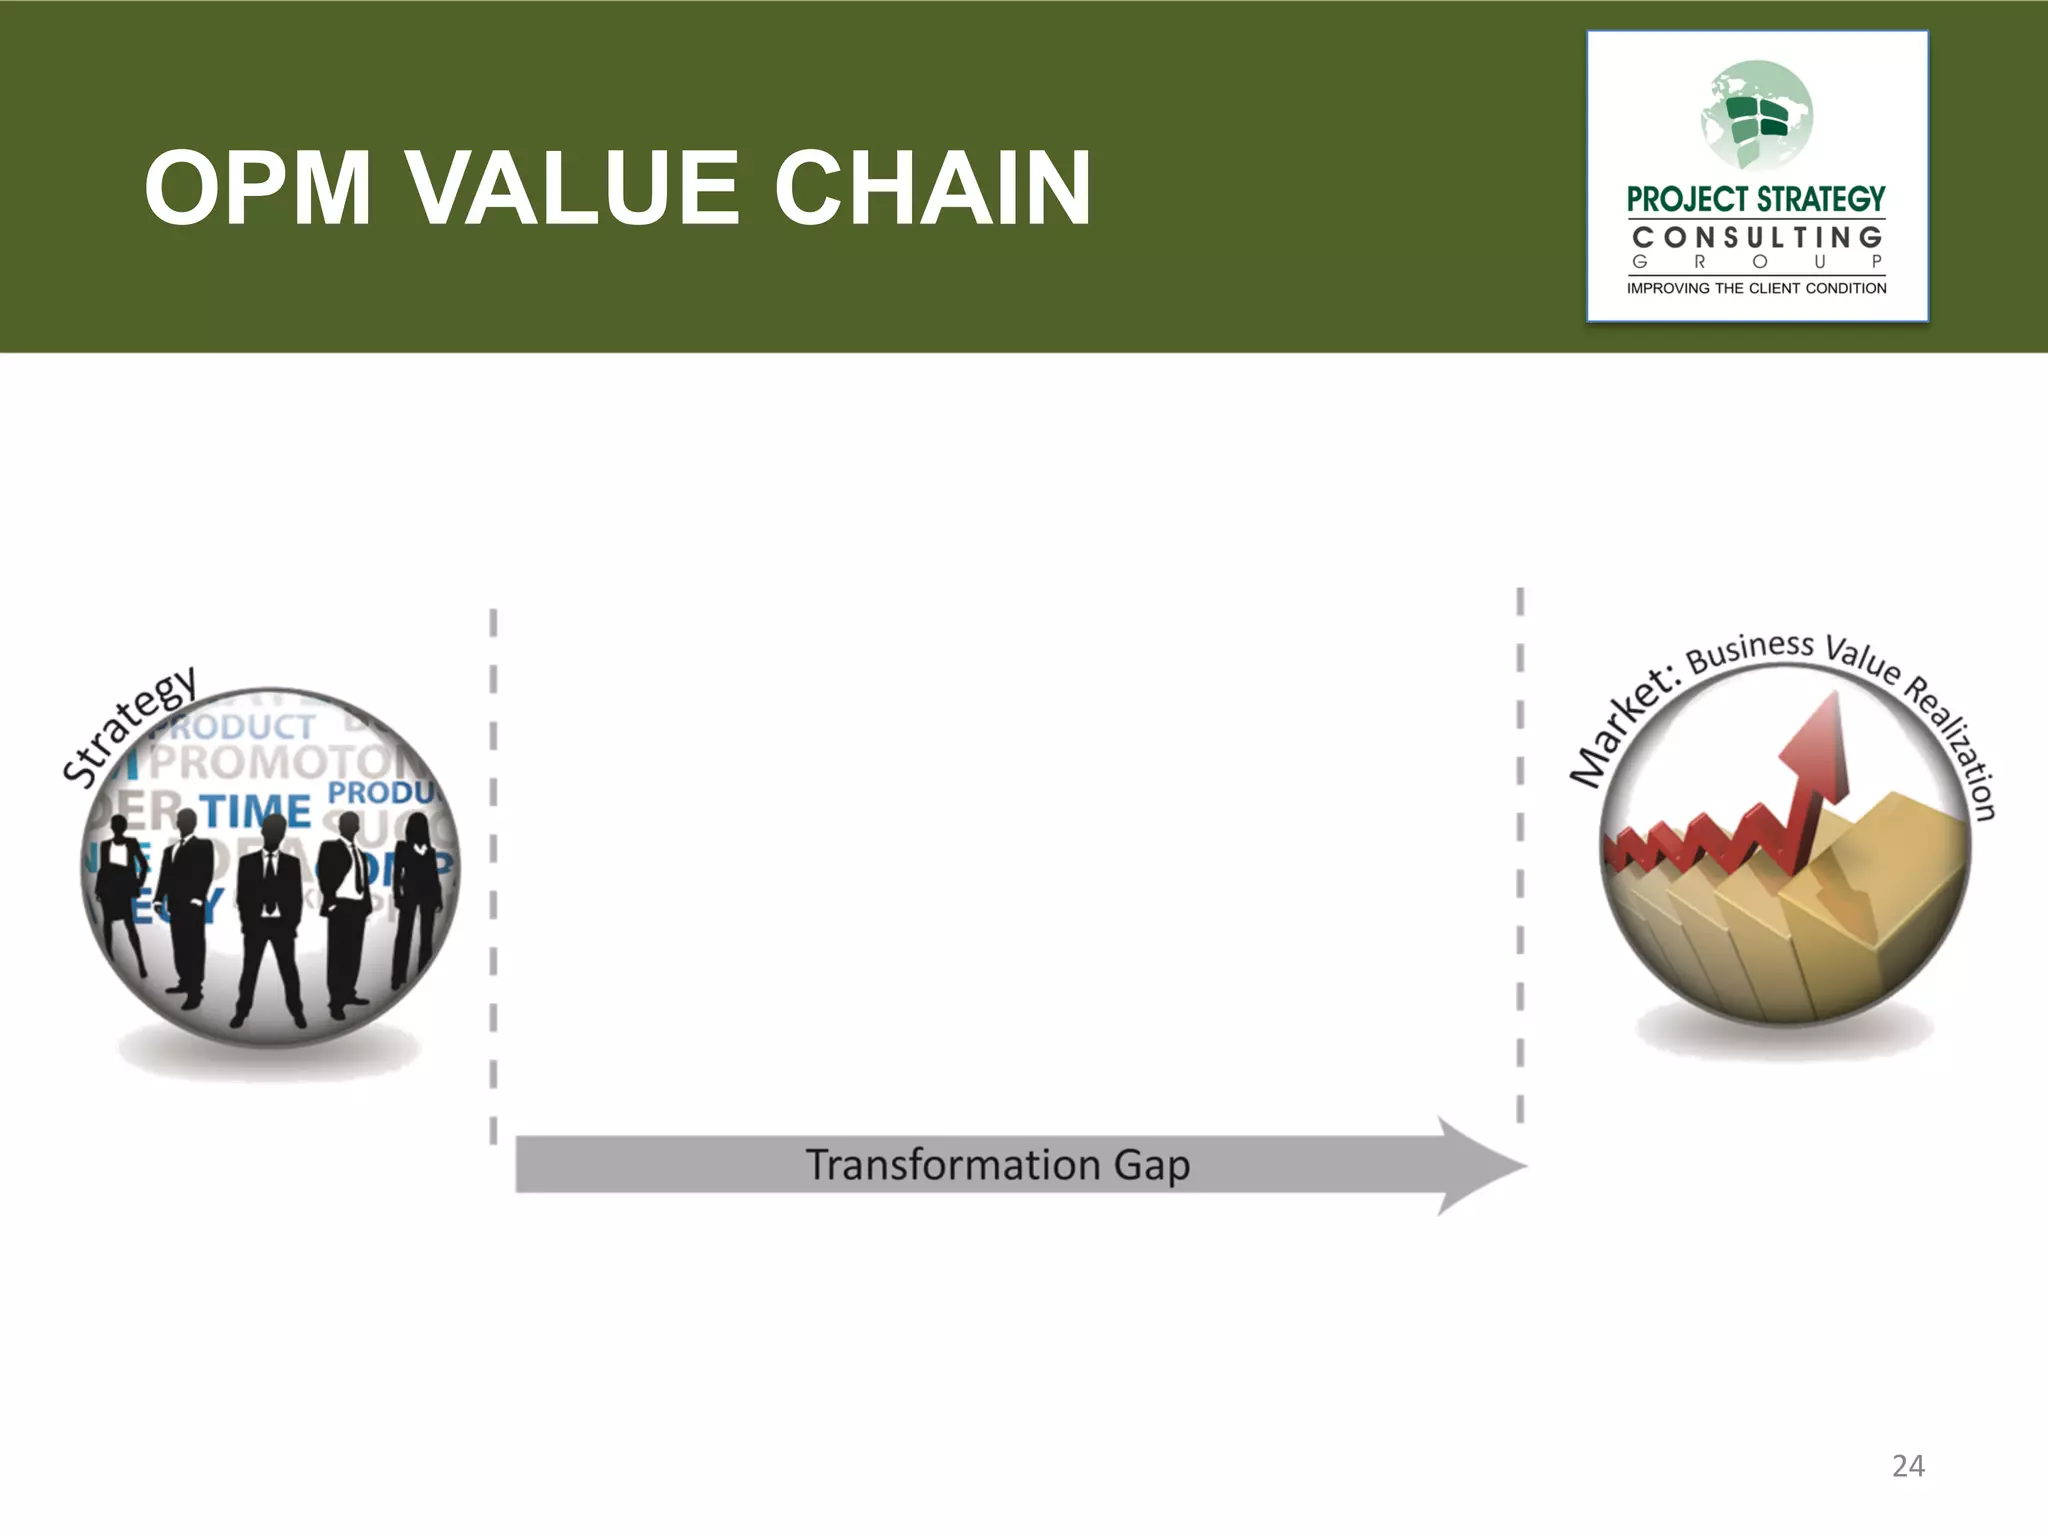
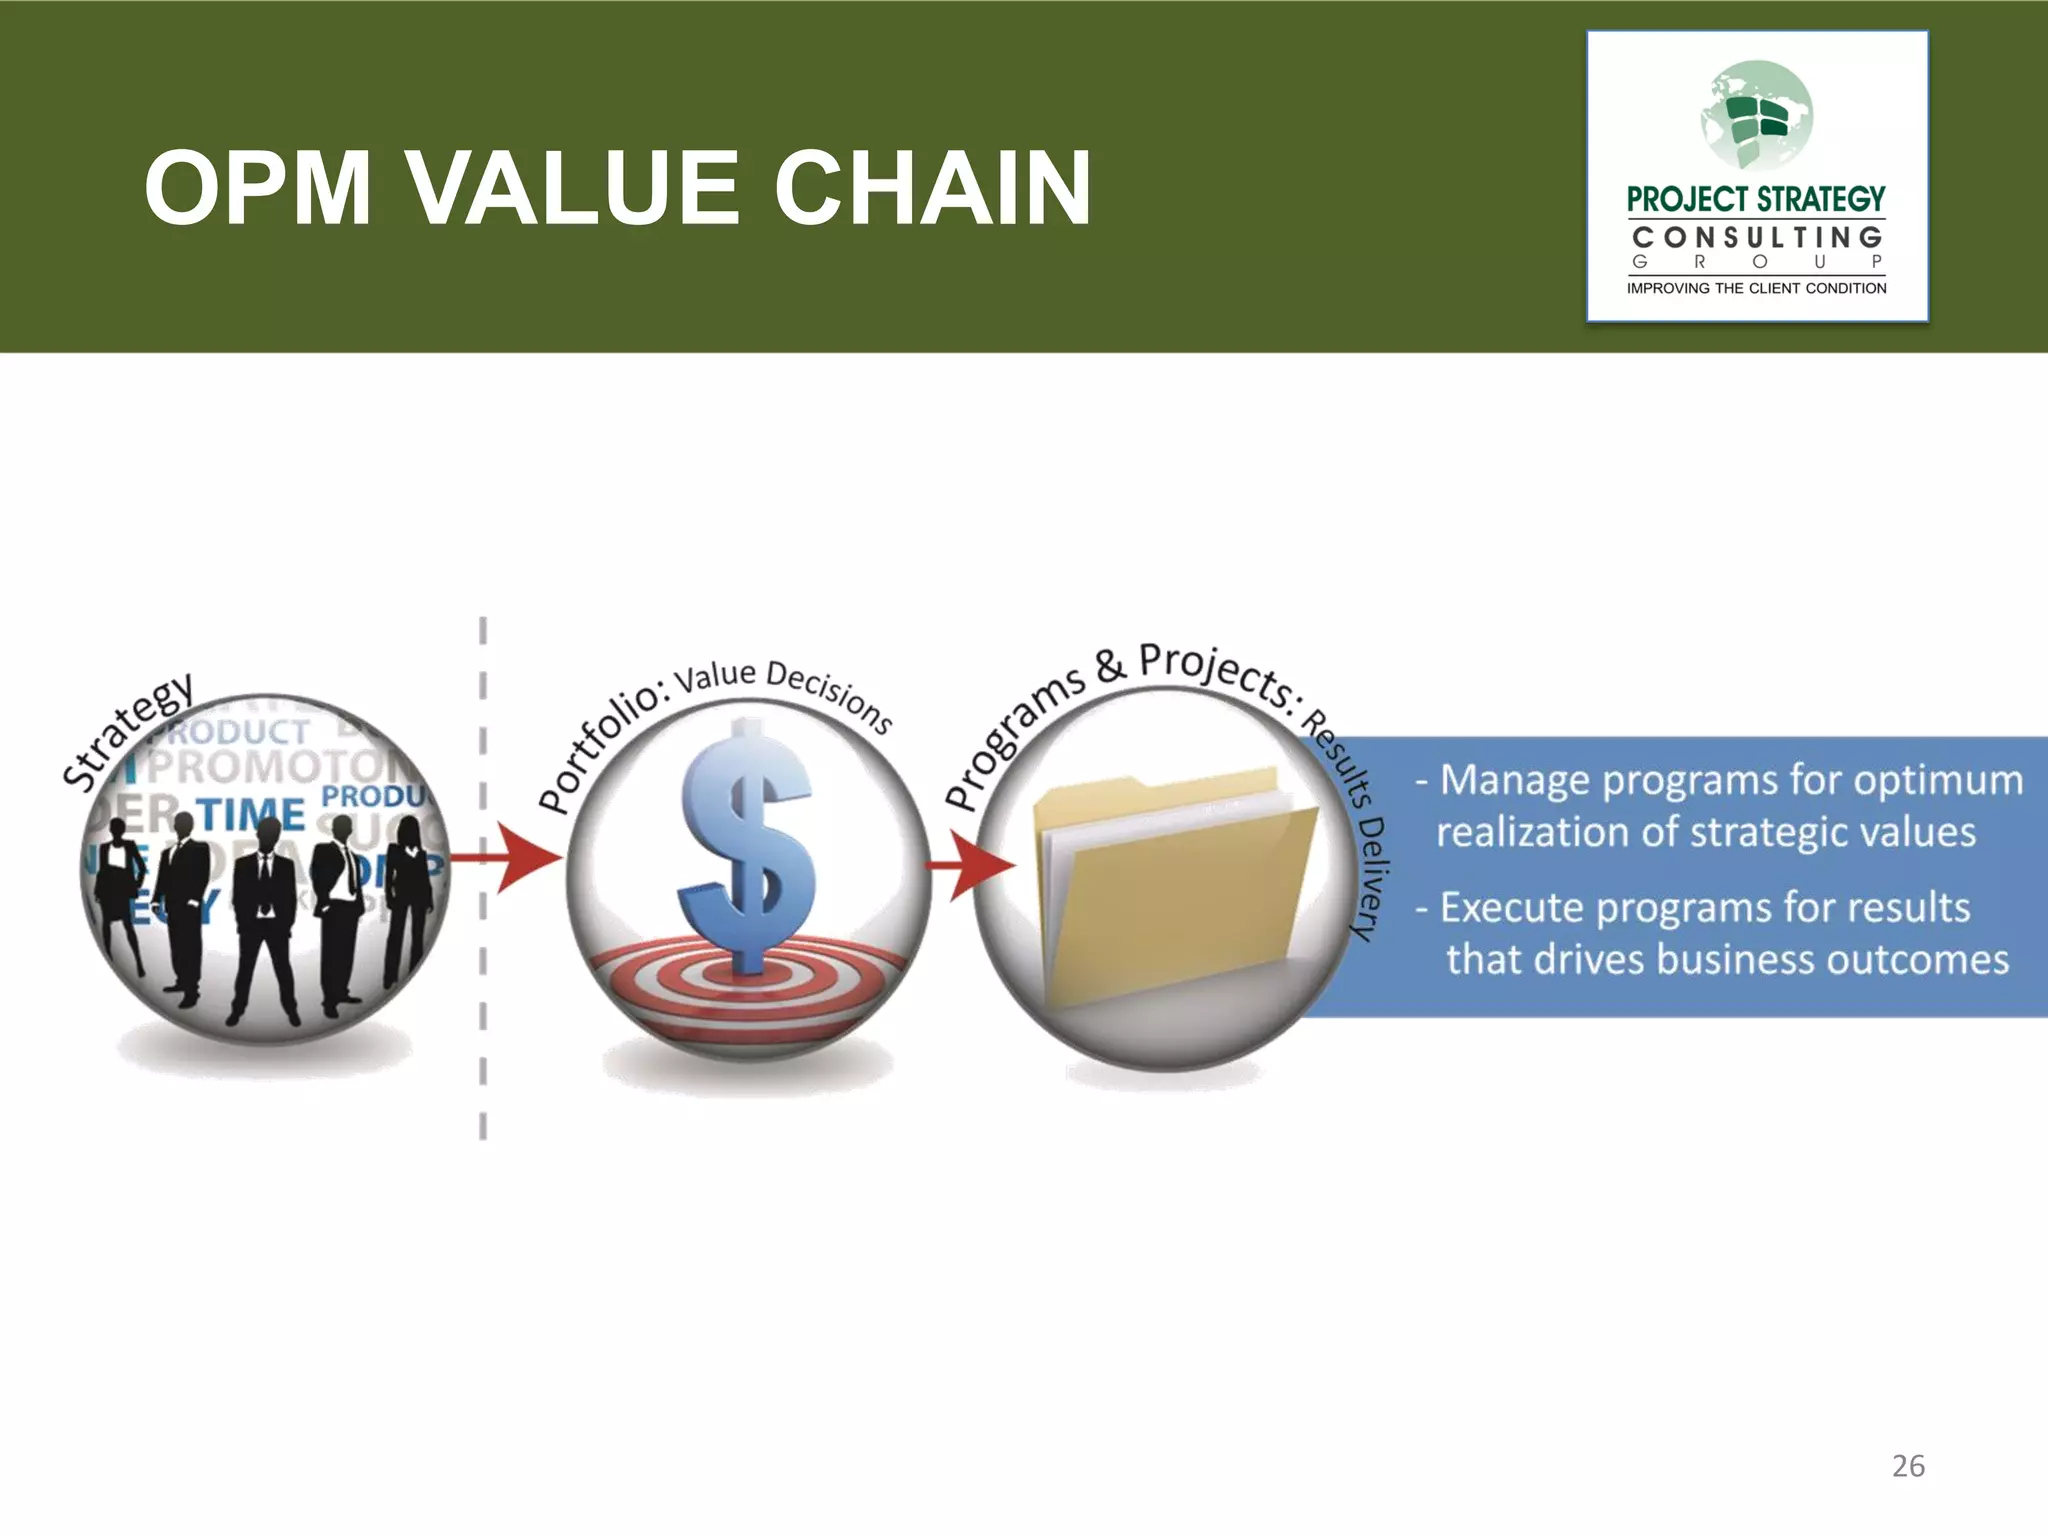
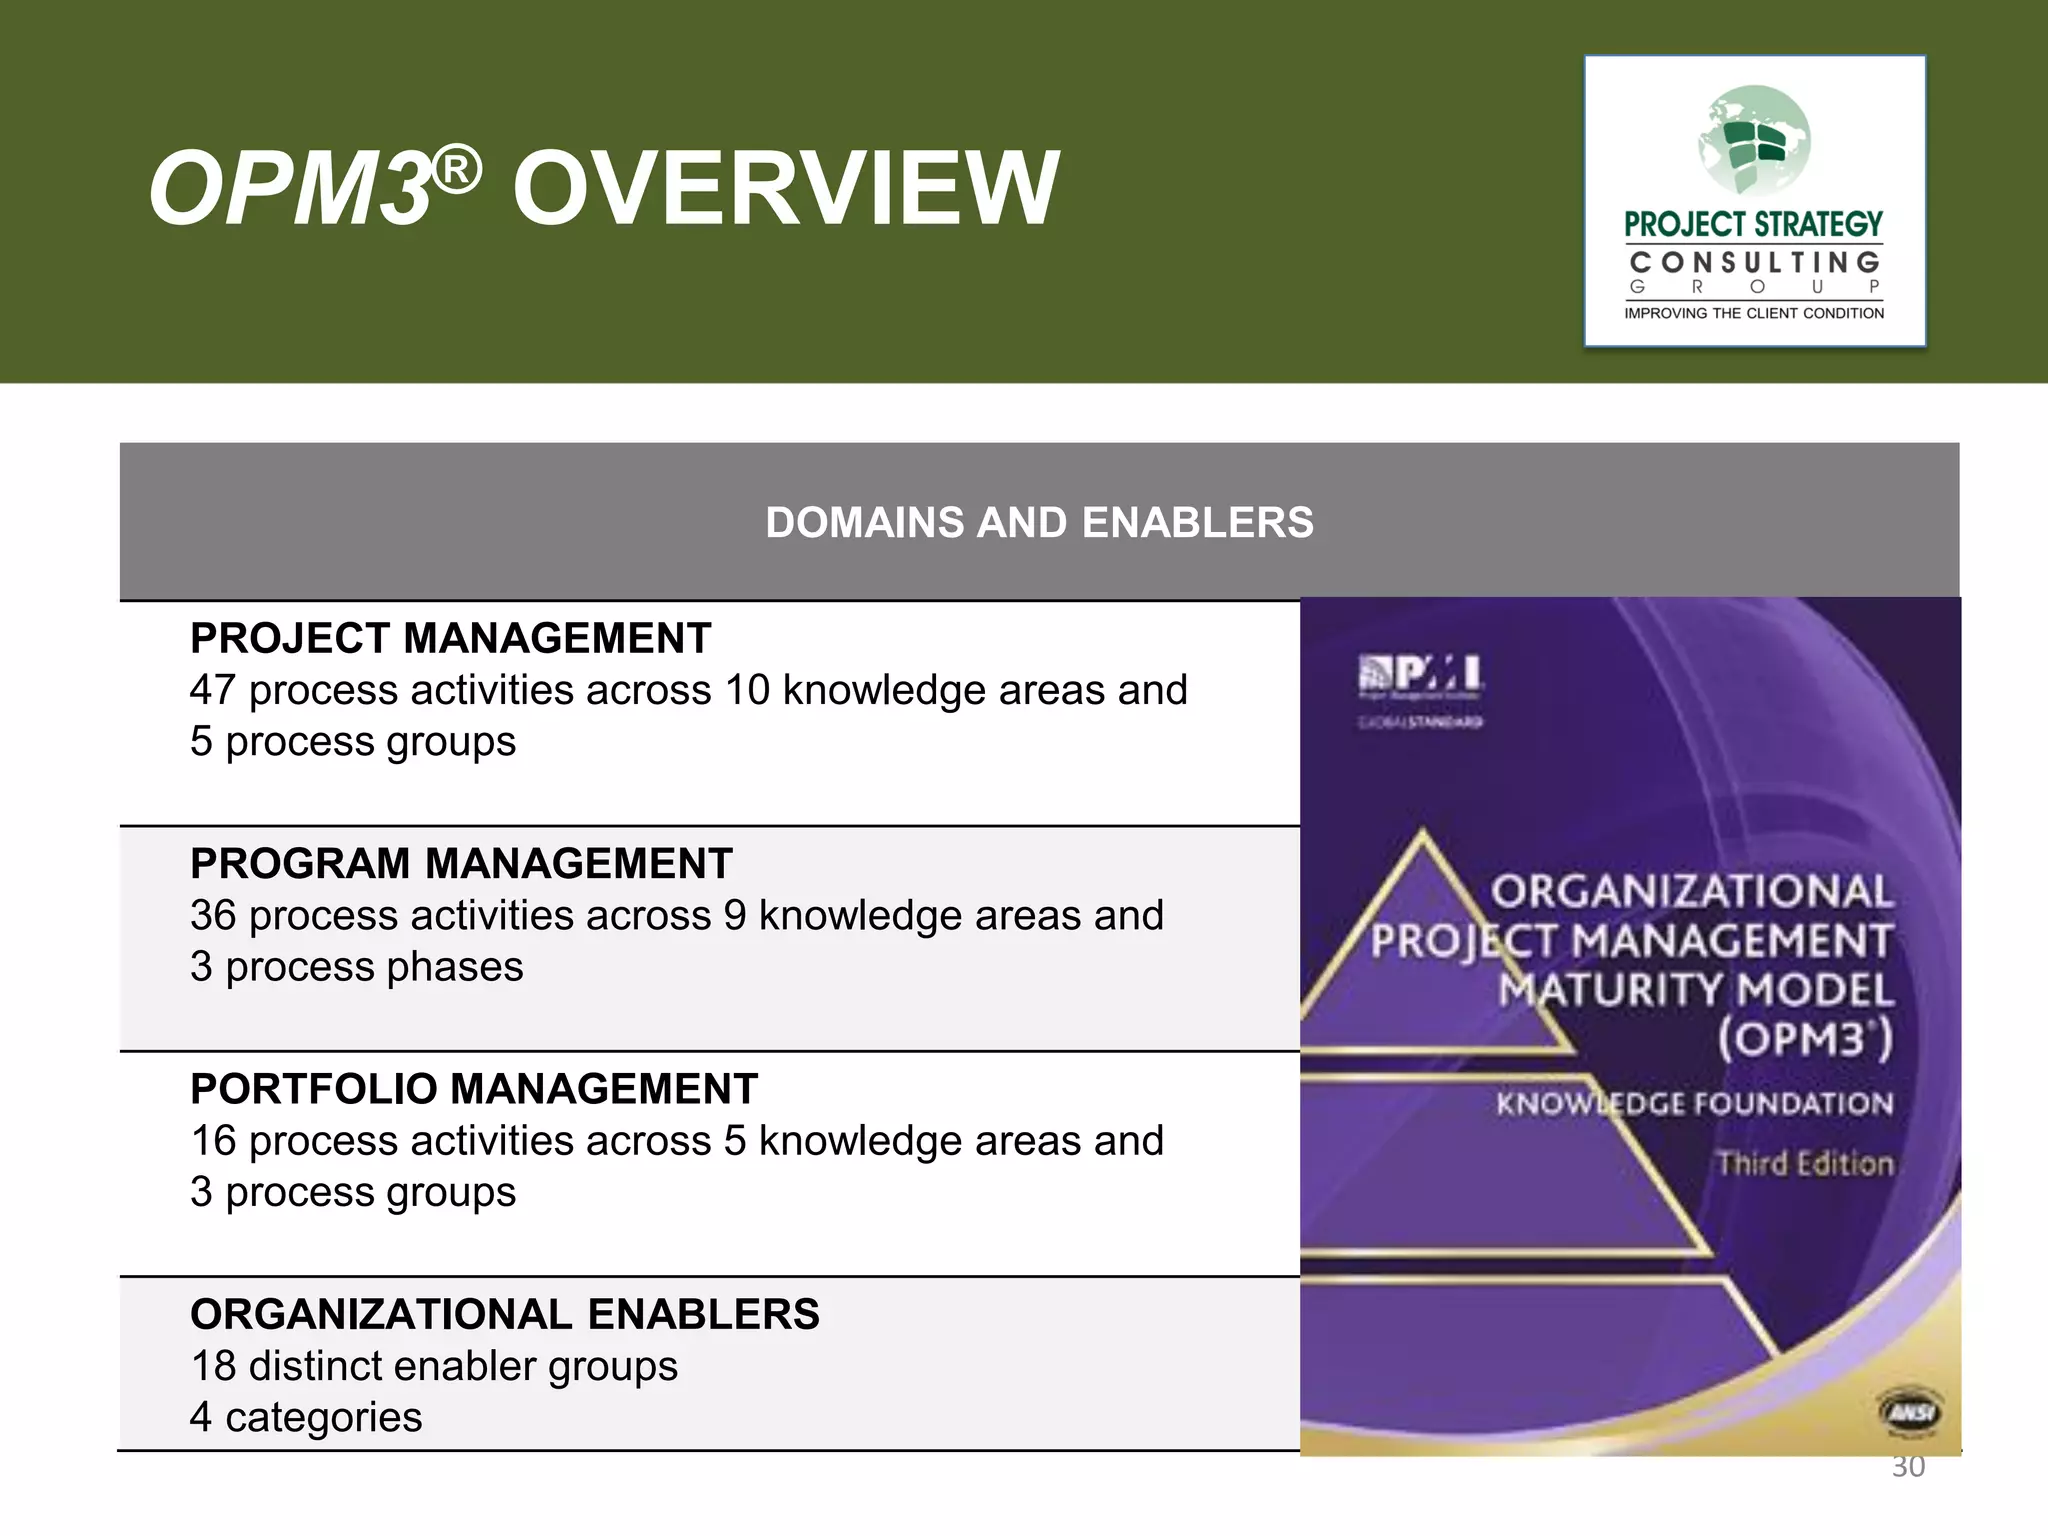
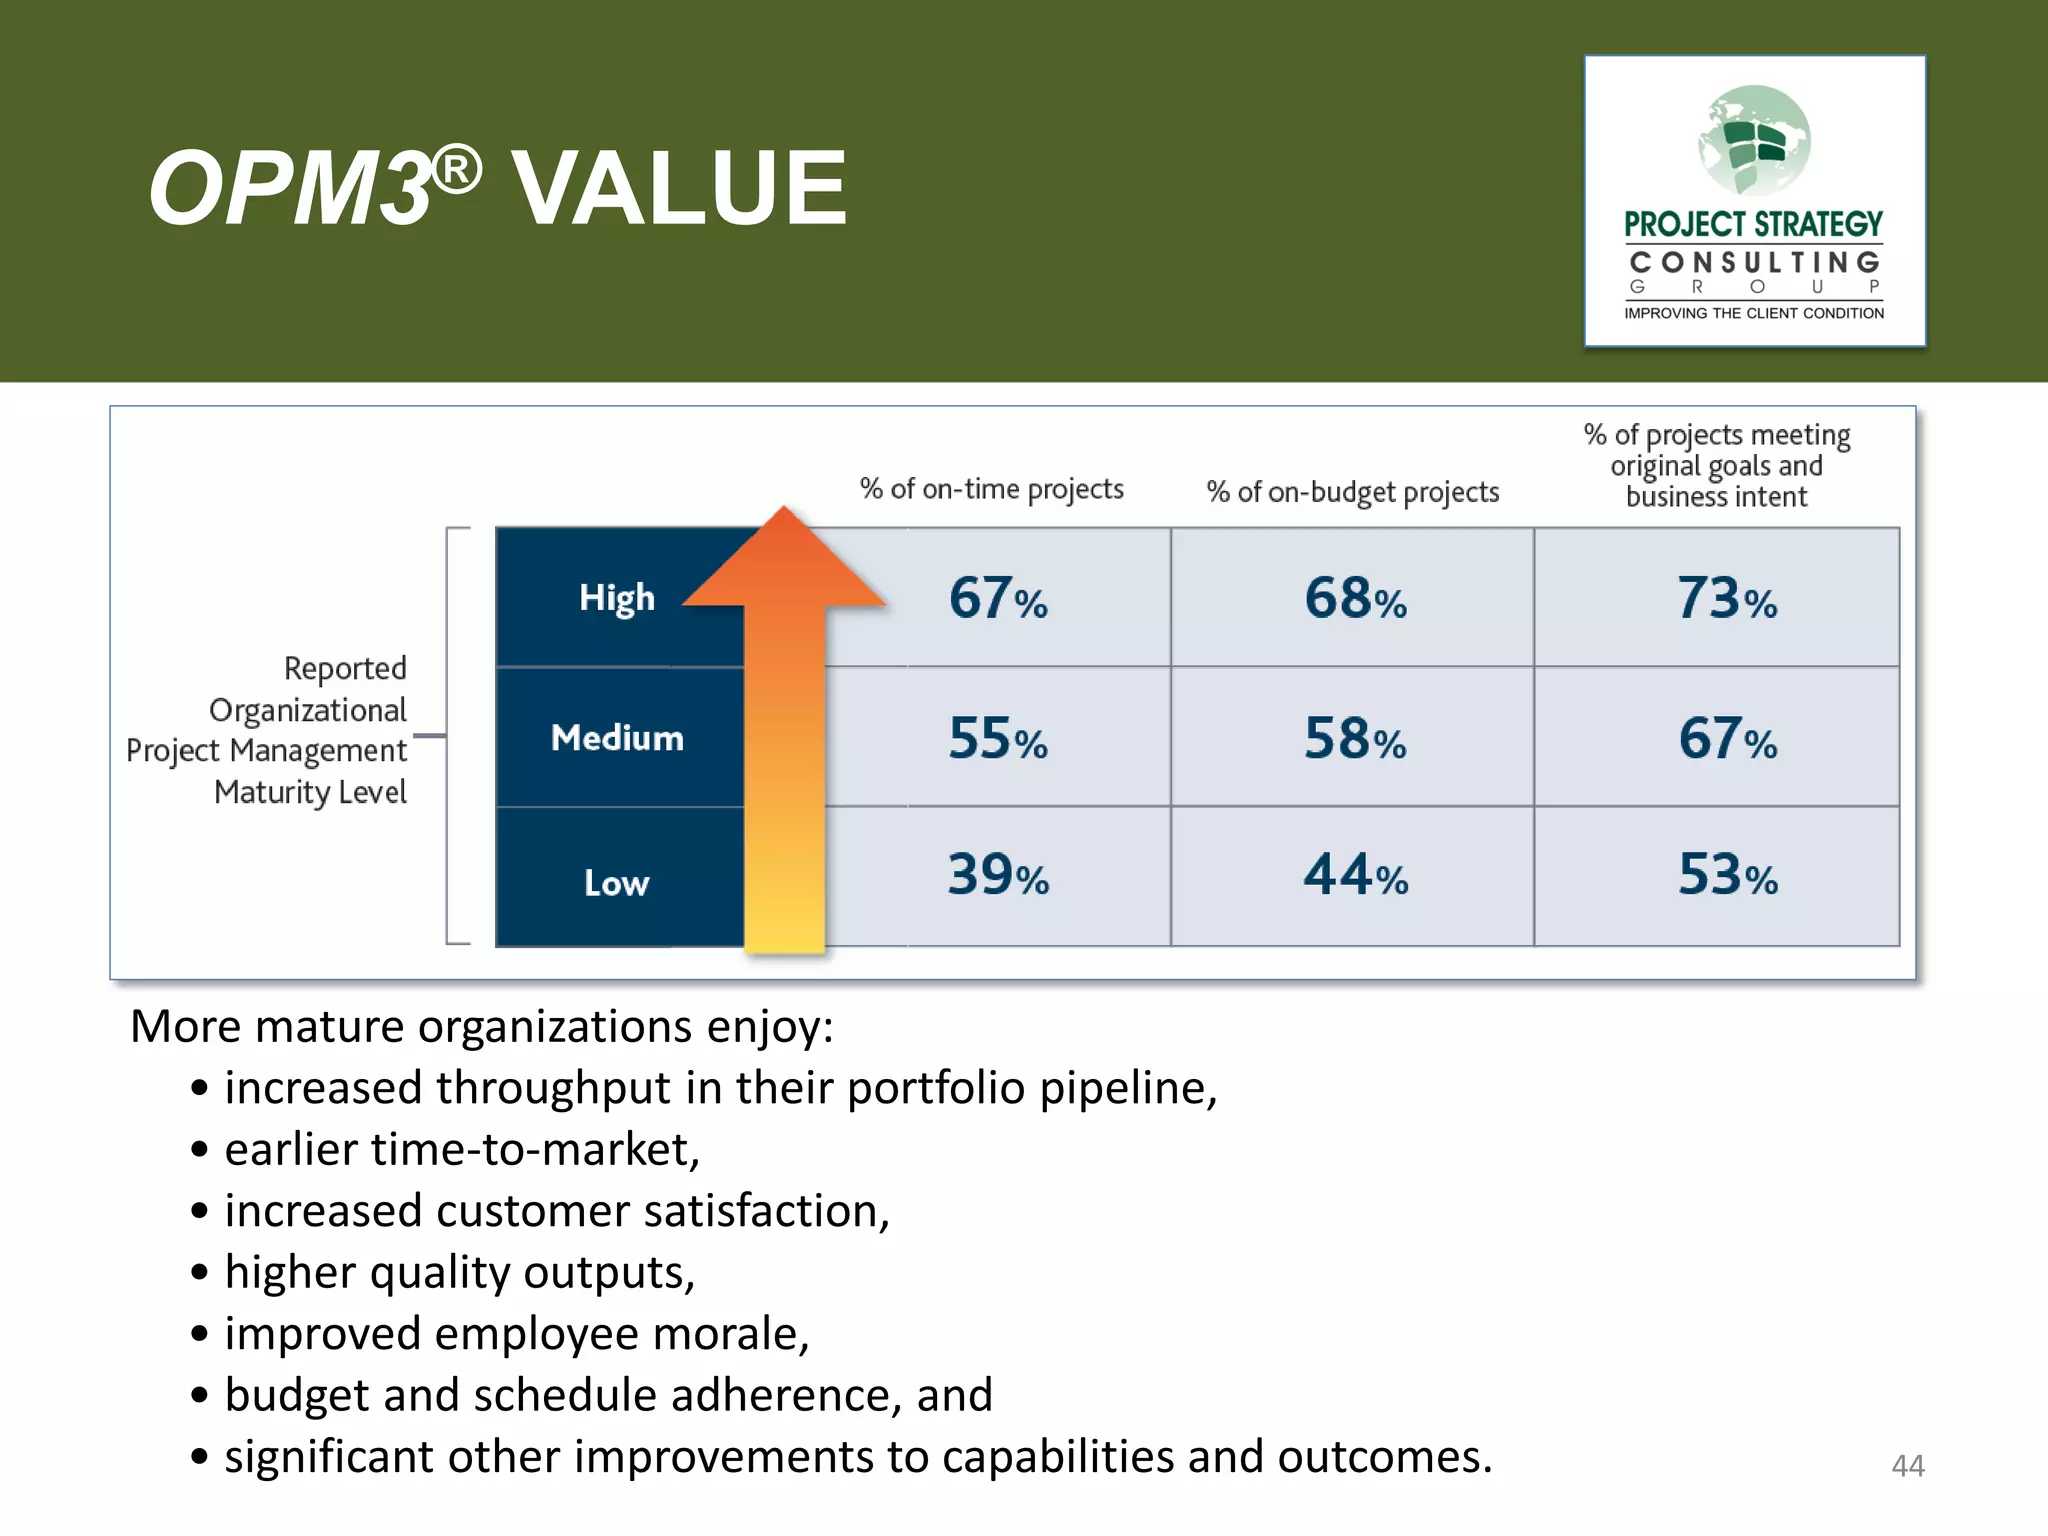


The document discusses the Organizational Project Management Maturity Model (OPM3) and its significance for organizations in measuring their project management practices. It highlights the challenges faced by organizations, such as the high percentage of failed strategic initiatives and the gap between strategy formulation and project implementation. OPM3 provides a framework for assessing and improving project management maturity to achieve better business results and enhance organizational performance.