Use of large half-duplex PIT tag antennas to evaluate entrainment
•Download as PPTX, PDF•
2 likes•4,960 views

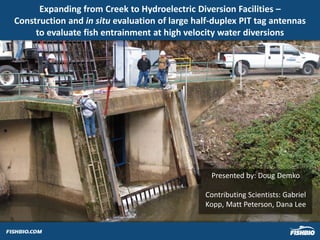
Expanding from Creek to Hydroelectric Diversion Facilities – Construction and in situ evaluation of large half-duplex PIT tag antennas to evaluate fish entrainment at high velocity water diversions

Recommended
Recommended
More Related Content
Similar to Use of large half-duplex PIT tag antennas to evaluate entrainment
Similar to Use of large half-duplex PIT tag antennas to evaluate entrainment (20)
More from FISHBIO
More from FISHBIO (20)
Recently uploaded
Recently uploaded (20)
Use of large half-duplex PIT tag antennas to evaluate entrainment
- 1. Expanding from Creek to Hydroelectric Diversion Facilities – Construction and in situ evaluation of large half-duplex PIT tag antennas to evaluate fish entrainment at high velocity water diversions Presented by: Doug Demko Contributing Scientists: Gabriel Kopp, Matt Peterson, Dana Lee
- 2. What is PIT Technology Uses and Advantages Unique individual code Long life, no battery Small size Cost effective Minimal biological impacts Full Duplex Monitor greater density of tags at one time Half Duplex Lower cost Greater read range More resilient to interference 12 mm
- 3. PIT System Components Antenna Power Supply Control Unit Data Logger Oregon RFID Thermoelectric Generator Control Unit & Data Logger Antenna
- 4. Typical PIT Field Research Antenna Deployments Small Scale Low Flow Constrained Flow to Meet Small Detection Area
- 5. Typical PIT Field Research Antenna Deployments
- 6. Study Objectives Monitor O. mykiss entrainment at hydroelectric diversion facilities for over one year All trout ≥ 60 mm tagged (O. mykiss n=536, S. trutta n=2) 60-129 mm fish (36%) = 12 mm tag 130 mm and larger (64%) = 23 mm tag Estimate entrainment based on known number of potentially vulnerable fish with PIT tags
- 7. Study Area Small tributaries in Northern Sierra Nevada Mountains Large seasonal fluctuations in flow
- 8. Study Area (cont’d) Large diversion tunnels 4.6 m x 3.7 m 4.4 m x 4.4 m High flows ≤ 24.4 cms (≤ 845 cfs) ≤ 31.1 cms (≤ 1072cfs) High Velocity Measured max = 1.5 m/s Calculated max = 3.7 m/s
- 9. Fabrication Three antenna stacked array Hydrodynamic “wing” design Rigid, strong, and durable Multiple layers of woven fiberglass mat Over 1400 hours spent fabricating both arrays ($125,000 USD) PIT detection wire embedded in fiberglass during fabrication
- 10. Antenna Fabrication Layers of Fiberglass Wiring Added Sanding Between LayersFiberglass Shell Fabrication (cont’d)
- 11. Operation 99% of all diverted flows monitored for entrained fish Antennas and electronics highly reliable Minimal required maintenance Manually re-tune antennas Easily removable - allowing built up debris to wash through system
- 12. Operation Efficiency tests for 23 mm tag were 100% at both diversions 12 mm tag efficiency above target of 80%
- 13. Flow in Oregon Creek Diversion Tunnel Maximum discharge in Oregon Creek Diversion Tunnel was 31.1 metersᶾ/sec (1072 cfs) Average flow was 4.1 metersᶾ/sec (144.2 cfs) over entire study period 0 5 10 15 20 25 30 35 Metersᶾ/second
- 14. Entrainment Results A total of 220 detection events representing 58 unique fish observations Many fish were detected multiple times, indicative of milling behavior Few individual fish detected at both diversion tunnels Entrainment rate relatively low
- 15. Fabrication Results Innovative and successful design, application, and deployment of half-duplex antenna technology Large half-duplex fiberglass antennas can be constructed to withstand high flows/velocities at large water diversions Detection efficiencies (average greater than 90%) and reliability high enough to effectively evaluate entrainment
Editor's Notes
- A Passive Integrated Transponder tag is a radio frequency device that transmits a unique individual code to a reader where it is displayed in a numeric or alphanumeric form. The tag has no internal battery, hence the term “passive". The reader powers or excites the tag circuitry by radio frequency induction and receives the code back from the tag. Radio frequency identification does not require line of sight, tags can be read as long as they are within the range of a reader. Tags can be detected through materials like plastics, water, wood products, animal tissue and bone, fabrics, fiberglass, rock and most nonferrous metals. Full-duplex (FDX) and half-duplex (HDX) both operate at 134.2 kHz frequency, but there are differences in how the tags transmit and are received by the antenna. A FDX system receives and transmits simultaneously as opposed to a HDX system that transmits then receives. FDX antenna receivers continuously emit a magnetic charge field that charges the tag and listens for the tag to transmit an ID code at a rate of up to 30 reads per second while the HDX receiver stops emitting magnetic charge while listening for a tag transmission resulting in a slower read rate of up to 14 reads per second. Because HDX tags have a capacitor to momentarily store energy, the tags transmit a stronger signal in a greater read range. However, the trade-off for a stronger signal is a larger tag in the HDX system.
- All fish tagged within 2.5 km upstream of diversion facilities 12 mm tag used in any fish between 60 – 129 mm (36% of all tagged fish) 23 mm tag used in any fish longer than 130 mm (64% of all tagged fish) Mortality resulting from PIT tagging was generally low. PIT tags are relatively small in volume, lack a battery, and are lightweight. The surgical procedure generally took less than 2 minutes, which is comparable to past studies (Moore et al. 1990). The minimal handling time and reduced influence of the tag has been shown to result in low mortality rates (Jonasson et al. 2004 and Jones and Burum 1998).
- Discharge in Oregon Creek varied from 0.06 cms to 18.5 cms (2-654 cfs) over the length of the study period Discharge averaged 0.4 cms (13.4 cfs) over entire study period Discharge in the Middle Yuba River varied from 0.7 cms to 206.6 cms (24-7296 cfs) over the length of the study period Discharge averaged 1.9 cms (65.4 cfs) over entire study period
- The largest PIT antenna in the world is the Bonneville Dam Corner Collector (5.2 m x 5.2 m), built by Destron-Fearing and installed in 2006. Due to limitations in the technology, the system misses over 50% of the tagged fish under quiet noise conditions. Our design allowed for coverage of nearly the same area with single antenna loops that spanned only 1.5 m and consequently helped us meet our study plan objective of 80% efficiency.
- Arrays were fabricated from fiberglass in a ‘wing’ shape to ensure that the large antenna would be resilient with minimal hydrodynamic drag. The shape of the crossbeams allowed water to flow by with little drag and ensured that minimal debris was accumulated on the antenna. Each crossbeam was constructed with over 15 layers of 12 oz. fiberglass mat. Fiberglass provided strength and, did not interfere with the detection field. The rigidity of the antenna was crucial to maintain proper tuning of the array and maximize read ranges within the array. The PIT detection wire was embedded into the fiberglass as it was fabricated.
- Assessing effectiveness of the PIT antenna arrays was quantifiable by determining the percent of diverted flows monitored and the effectiveness of the arrays when monitoring occurred. Maintenance required lifting antenna and debris rack from front of diversion tunnel and allowing debris to wash through system Depending on flow conditions, detection efficiencies of the antennas was tested by passing a test tag through the grid by hand or floating a test tag through the antennas from upstream. During periods when efficiency tests were not conducted, individual antenna amperages were used to monitor detection efficiency and performance of each array since antenna amperages and antenna detection efficiency are positively correlated.
- Detection area: approximately 2.5 ft or 1.0 ft upstream and downstream of the antenna depending on the size of the tag used for testing (23 mm or 12 mm). This created an area of approximately 707 and 854 cubic feet, for the two tunnels respectively, in which a 23 mm tag could be detected. Depending on flow conditions, detection efficiencies of the antennas was tested by passing a test tag through the grid by hand or floating a test tag through the antennas from upstream. During periods when efficiency tests were not conducted, individual antenna amperages were used to monitor detection efficiency and performance of each array since antenna amperages and antenna detection efficiency are positively correlated.
- Number of unique fish detected at both Our House (OH) and Log Cabin (LC) Diversion Dams = 58 Number of unique detection events (separated by a minimum of 30 minutes) = 220 Number of fish that have been detected at both sites (OH -> LC) = 30 Number of unique fish that have been tagged in Middle Yuba and detected at OH = 48 Number of unique fish that have been tagged in Oregon Creek and detected at LC = 8 Number of unique fish that have been tagged in Middle Yuba and detected at LC = 30 Number of fish that have been tagged in Middle Yuba, NOT detected at OH, then detected at LC = 1 Percent of fish that have been detected at OH arrays based on number of fish passing each site = 96.15
- Number of unique fish detected at both Our House (OH) and Log Cabin (LC) Diversion Dams = 58 Number of unique detection events (separated by a minimum of 30 minutes) = 220 Number of fish that have been detected at both sites (OH -> LC) = 30 Number of unique fish that have been tagged in Middle Yuba and detected at OH = 48 Number of unique fish that have been tagged in Oregon Creek and detected at LC = 8 Number of unique fish that have been tagged in Middle Yuba and detected at LC = 30 Number of fish that have been tagged in Middle Yuba, NOT detected at OH, then detected at LC = 1 Percent of fish that have been detected at OH arrays based on number of fish passing each site = 96.15