Science 7 - LAND and SEA BREEZE and its Characteristics
Physics Lab
1. Mint Achanaiyakul
09/10/11
Volume of Water in Cylindrical Glass and Frequency
of Sound
Introduction
When a cylindrical glass is tapped with a pencil, it makes a sound. If water is added to the
glass and it is tapped again, the pitch or the frequency changes. Different volumes of water
in the glass cause different frequencies of sound to be made when the glass is tapped.
Research Question: How does the volume of water in a cylindrical glass affect the
frequency of sound when tapped?
Glass walls vibrate when tapped. Adding water increases the effective mass that must be
moved. Therefore, frequency decreases. When there is water in the bottom of a glass, the
amount of water in the glass affects frequency less than when there is water at the top of the
glass. This is because there is less oscillation at the bottom of the glass than at the top of the
glass. There will be greater and greater increases in frequency as water reaches the top of
the glass.
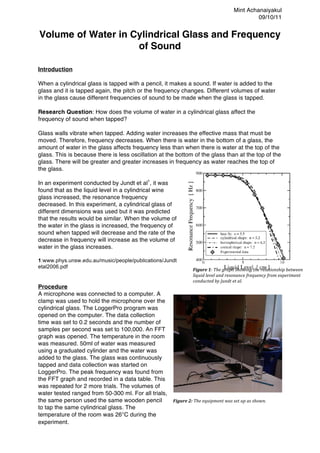
In an experiment conducted by Jundt et al1, it was
found that as the liquid level in a cylindrical wine
glass increased, the resonance frequency
decreased. In this experiment, a cylindrical glass of
different dimensions was used but it was predicted
that the results would be similar. When the volume of
the water in the glass is increased, the frequency of
sound when tapped will decrease and the rate of the
decrease in frequency will increase as the volume of
water in the glass increases.
1:www.phys.unsw.edu.au/music/people/publications/Jundt
etal2006.pdf
Figure
1:
The
graph
showing
the
relationship
between
liquid
level
and
resonance
frequency
from
experiment
conducted
by
Jundt
et
al.
Procedure
A microphone was connected to a computer. A
clamp was used to hold the microphone over the
cylindrical glass. The LoggerPro program was
opened on the computer. The data collection
time was set to 0.2 seconds and the number of
samples per second was set to 100,000. An FFT
graph was opened. The temperature in the room
was measured. 50ml of water was measured
using a graduated cylinder and the water was
added to the glass. The glass was continuously
tapped and data collection was started on
LoggerPro. The peak frequency was found from
the FFT graph and recorded in a data table. This
was repeated for 2 more trials. The volumes of
water tested ranged from 50-300 ml. For all trials,
the same person used the same wooden pencil Figure
2:
The
equipment
was
set
up
as
shown.
to tap the same cylindrical glass. The
temperature of the room was 26°C during the
experiment.
2. Mint Achanaiyakul
09/10/11
Data Collection and Processing
Dimensions of glass
Diameter: 6.6 +/- 0.2cm
Height: 14.5 +/- 0.2cm
Wall thickness: 2.0 +/- 0.2 mm
Frequency Average Frequency
(+/- 2 Hz) (+/- 3 Hz)
Volume of Water
(+/- 1 ml) Trial 1 Trial 2 Trial 3
50 1608 1602 1608 1606
100 1597 1596 1599 1597
150 1541 1544 1544 1543
200 1477 1480 1481 1479
250 1227 1230 1230 1229
300 1105 1105 1108 1106
Table 1: This shows the frequency found in the three trials tested for each volume of water and the average
frequency for each volume of water.
Sample Graph
Figure 2: This was the FFT graph for trial 1 for a water volume of 50ml. The peak frequency shown in the graph
was recorded as the frequency of the sound of the tapped glass.
3. Mint Achanaiyakul
09/10/11
Figure 3: This graph shows the relationship between the volume of water in the tapped glass and the average
frequency of the sound of the tapped glass.
Conclusion and Evaluation
It has been shown that frequency and volume of water is related by the equation
f = (1620 +/- 40 Hz) - (0.0002 +/- 0.0008)V(2.6 +/- 0.7) (Equation 1)
where f is frequency of the tapped glass and V is volume of water contained in the glass.
The equation is presented in the form A - BxC. “A”, which is 1620 +/- 40 Hz, represents the
frequency when the glass is empty. “B” and “C” show the rate of decrease in the frequency
as the volume of water increases. The calculated frequency when the glass is full is 669 +/- 3
Hz. For a glass of different dimensions, the same general shape of the graph is expected.
The variables in the equation are not applicable to other glasses because the starting point
(A) and constants (B and C) would be different for a glass of different dimensions.
The results support the theory. The rate of decrease in the frequency increased when the
volume of water in the glass was increased and there were greater and greater decreases in
frequency as the water reached the top of the glass. The graph made using the results from
this experiment shows the same general shape as the graph from the experiment conducted
by Jundt et al1 on a cylindrical wine glass.
4. Mint Achanaiyakul
09/10/11
The level of confidence in the results is medium based on the quality of data. The procedural
uncertainty shows that the results were precise. In figure 3, the curve fit of the graph does not
go through all data points.
A weakness in this experiment was that the method of tapping the cylindrical glass could not
be kept constant throughout the experiment. An equal amount of force could not be used
each time the glass was tapped. A more precise way of tapping could result in a more
accurate value for the frequency. This weakness is not significant because changing the
force of tapping could only have changed the amplitude and not the frequency.
The temperature of the glass was not measured during the experiment. A change in the
temperature of the glass during the experiment could have affected the frequency. This could
have caused inaccuracies in the results. The temperature of the glass should be measured
during the experiment.
There was an uncertainty of +/- 3Hz for the FFT graph. This instrumental uncertainty is larger
than the procedural uncertainty and could have produced imprecise measurements of
frequency. The quality of the FFT should be increased.