FULL ENJOY Call Girls In Mahipalpur Delhi Contact Us 8377877756
Glass Tapping Lab Report Curtis
1. Curtis Palmer
Lab Partner: Ben Sine
Oct. 16, 2011
Physics: Mr. Eales
Lab 5: Water in a Glass
Introduction:
When an empty glass is tapped with a solid object, the walls of the glass
resonate and a detectable frequency. By adding water in the glass, there is a
change in the pitch at with the glass walls resonate. When the glass is tapped, the
walls of the glass vibrate back and forth, creating a resonating sound wave in the
air When water is added to the glass, the glass will vibrate back and forth more
slowly, which will result in a sound wave resonating at a lower frequency.
Research was conducted called “Vibration modes of partly filled wine
glasses” at theResearch School of Physical Sciences and Engineering, Australian
National University. The report concluded that increasing the amount of liquid in
a glass decreases the frequency at which the glass resonates. The frequency is
expected to decrease at a similar rate to this research conducted.
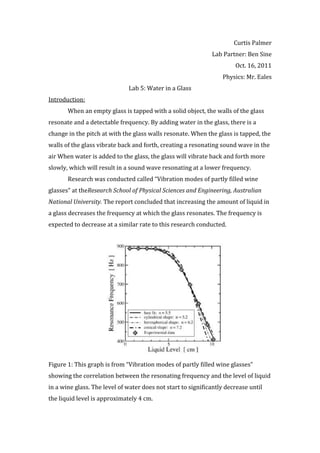
Figure 1: This graph is from “Vibration modes of partly filled wine glasses”
showing the correlation between the resonating frequency and the level of liquid
in a wine glass. The level of water does not start to significantly decrease until
the liquid level is approximately 4 cm.
2. Research Question:
How does volume of water in a cylindrical glass affect the frequency of sound
when tapped?
Procedure/Materials:
1. A ring clamp, attached to a retort stand was used to hold a Vernier
Microphone connected to a computer using Logger Pro. The glass was
placed on the table, and the microphone was placed approximately an
inch on top of the center point of the glass while the detector is facing
down.
2. The first trial, which was an empty glass, was collected using an FFT
graph on Logger Pro. Make the data collection time 0.2 seconds, and the
sample 100,000/second to make the data more accurate. Click record
while tapping the glass with a pencil and use the graph to find the
frequency of the sounds produced by the glass.
3. A 50 milliliter graduated cylinder was used to measure 50 ml of water,
which is added to the glass for each new volume of water.
4. Three trials were conducted for each volume of water for a total of 5
different volumes of water.
5. Repeat steps 2 and 3 to collect the remaining trials.
Data Collection:
Table 1: Raw Data Showing Correlation Between The Volume of Water in the
Glass and the Frequency at Which the Sound Resonates.
Volume of Water Trial 1 Trial 2 Trial 3 Average
(+ 1 ml) (+ 10 Hz) (+ 10 Hz) (+ 10 Hz) (+ 10 Hz)
0 1610 1614 1614 1610
50 1611 1611 1608 1610
100 1614 1599 1599 1600
150 1550 1550 1550 1550
200 1023 1037 1038 1070
250 820 820 817 820
Table 1: This data table shows the 3 trials that were measured for each volume
of water and the calculated averages of the frequencies of resonance.
3. Graph 1: This graph is a representation of trial 1 when the glass 250 (+ 1 ml) of
water was added to the glass.
4. Figure 2: This figure is a representation of the relationship between the volume
of water in a glass and the average frequency of resonance. This relationship
between the volume of water and average resonance is shown by using the
equation y A BxC . The experimental equation below is a representation of
the experimental data collected, where F is the frequency and V is the volume of
the water in the glass.
Equation 1:
F 1639 52.62 0.0001094 0.00001428 2.874
V 135.4
Conclusion:
The results of this investigation show that the relationship between the
volume of water in a glass and the frequency at which it resonates is represented
by the equation above. The relationship is a subtractive power relationship as
shown in the lab report cited in the introduction, which matches the expected
results. The validity of this data should be further examined because the
uncertainties are relatively high and should be further examined. Also the line
derived from the equation does not fit the line accurately. As shown in Figure 2,
the frequency does not significantly decrease until there is more than 60 ml of
water in the glass. These results where not as precise as they could have been
because of the limitations of the lab setup and this is another reason why this
relationship should be further examined.
Evaluation:
- The method that was used to measure the volume of water in the water was not
precise.
- The glass was tapped at different location for each trial; making a mark with a
marker where to hit the glass could have been used to make that more
consistant.
- This expriement was conducted in a room full of people tapping glasses, which
are resonating at different frequencies, and there was a lot of background noise.
5. To make sure that the Vernier Microphone is picking up the correct frequency
this investigation could be conducted in a silent room.