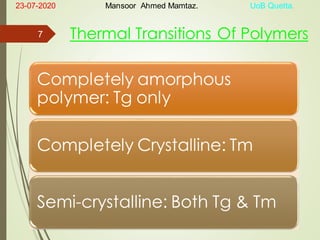
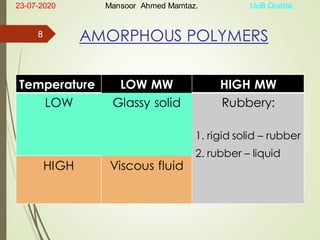
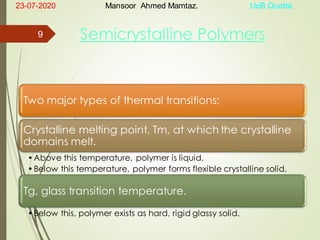
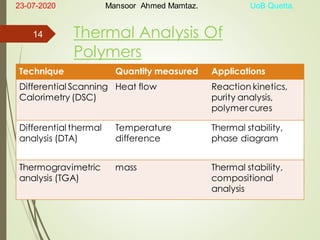
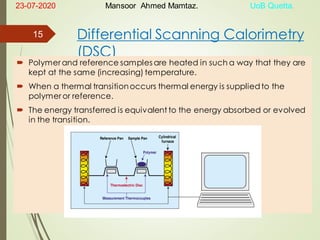
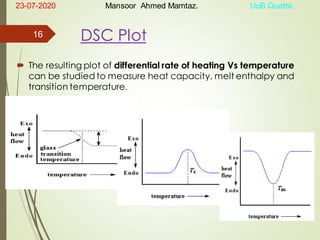
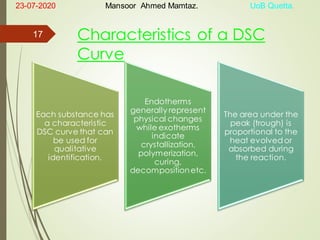
NAME: MANSOOR
AHMED.
S/O: HAJI BARI DAD.
ROLL NO: 20
PRESENTATION: PHYSICAL CHEMISTRY-V
1
PRESENTATION
CONTACT NO: 0300-8061972
23-07-2020 Mansoor Ahmed Mamtaz. UoB Quetta.
1
PRESENTATION TOPIC:
THERMAL TRANSITIONS OF
POLYMERS
 PRESENTED TO: MISS HABIBA TAJ SAHIBA.
 DATE OF PRESENTATION: 23-07-2020
2
23-07-2020 Mansoor Ahmed Mamtaz. UoB Quetta.
UNIVERSITY OF BALOCHISTAN
QUETTA
 DEPARTMENT: CHEMISTRY
 PROGRAM OF STUDY: M.Sc
 SEMESTER NO: 3RD
 SESSION: 2019-20
3
23-07-2020 Mansoor Ahmed Mamtaz. UoB Quetta.
4
CONTENTS
Glass transition temperature
Crystalline melting point
Factors affecting Tg
Factors affecting Tm
Thermal methods of polymer analysis
23-07-2020 Mansoor Ahmed Mamtaz. UoB Quetta.
5
THERMAL TRANSITIONS OF POLYMERS
23-07-2020 Mansoor Ahmed Mamtaz. UoB Quetta.
6
Thermal Transitions Of Polymers
Completely amorphous
polymer: Tg only
Completely Crystalline: Tm
Semi-crystalline: Both Tg & Tm
23-07-2020 Mansoor Ahmed Mamtaz. UoB Quetta.
7
AMORPHOUS POLYMERS
Temperature LOW MW HIGH MW
LOW Glassy solid Rubbery:
1. rigid solid – rubber
2. rubber – liquid
HIGH Viscous fluid
23-07-2020 Mansoor Ahmed Mamtaz. UoB Quetta.
8
Semicrystalline Polymers
Two major types of thermal transitions:
Crystalline melting point, Tm, at which the crystalline
domains melt.
•Above this temperature, polymer is liquid.
•Below this temperature, polymer forms flexible crystalline solid.
Tg, glass transition temperature.
•Below this, polymer exists as hard, rigid glassy solid.
23-07-2020 Mansoor Ahmed Mamtaz. UoB Quetta.
9
Factors Affecting Tg
• Nature of polymerbackbone.
• C-C and C-O bonds are flexible.
• Nature of groups directly attached
to the backbone (due to repulsion
and tendency to form H-bonding).
• Flexibility enhanced by methylene
groups.
• Flexibility reduced by ring
structures
• phenylene and amide
• substitutionof H atoms by HC
groups
• eg. Tg: PTFE > PE
Chain
flexibility,
interactions &
structure
23-07-2020 Mansoor Ahmed Mamtaz. UoB Quetta.
10
…Cont’…Factors Affecting
Tg
Inclusion of double bond stiffens it but increases
flexibility of adjacent bonds.
Segmental rotation is affected by other chains in the
same region (mainly dipole interaction and hydrogen
bonding).
• Tg: PVC > PE (more polar).
• Tg: polyvinylidene < PVC (less polar due to symmetrical
substitution.
• Hydrogen bonding also significantly increases Tg.
23-07-2020 Mansoor Ahmed Mamtaz. UoB Quetta.
11
Factors Affecting Tm
Same factors affect both Tg & Tm.
Usually high Tg & high Tm are found together and vice versa.
Asymmetrically structured polymershave higher Tm
• Eg PVC vs polyvinylidene
High polarity and hydrogen bonding increases Tm.
Molecular symmetry leads to high Tm.
• Eg PE has high Tm due to tightly packed crystals although Tg
is low due to flexibility of the chain.
23-07-2020 Mansoor Ahmed Mamtaz. UoB Quetta.
12
Values Of Tg & Tm
Polymer Repeating Unit Tg (˚C) Tm (˚C)
Polyethylene -CH2CH2- -125 137
Natural rubber -CH2C(CH3)=CHCH2- -73 28
Polypropylene -CH2CH(CH3)-- -13 176
Polyvinylchloride -CH2CHCl- 81 273
Polystyrene -CH2CHØ- 100 240
Polymethylmethacrylate -CH2C(CH3)(CO2CH3)- 105 200
23-07-2020 Mansoor Ahmed Mamtaz. UoB Quetta.
13
Thermal Analysis Of
Polymers
Technique Quantity measured Applications
Differential Scanning
Calorimetry (DSC)
Heat flow Reaction kinetics,
purity analysis,
polymercures
Differential thermal
analysis (DTA)
Temperature
difference
Thermal stability,
phase diagram
Thermogravimetric
analysis (TGA)
mass Thermal stability,
compositional
analysis
23-07-2020 Mansoor Ahmed Mamtaz. UoB Quetta.
14
Differential Scanning Calorimetry
(DSC)
 Polymer and reference samples are heated in such a way that they are
kept at the same (increasing) temperature.
 When a thermal transitionoccurs thermal energy is suppliedto the
polymer or reference.
 The energy transferred is equivalent to the energy absorbed or evolved
in the transition.
23-07-2020 Mansoor Ahmed Mamtaz. UoB Quetta.
15
DSC Plot
 The resulting plot of differential rate of heating Vs temperature
can be studied to measure heat capacity, melt enthalpy and
transition temperature.
23-07-2020 Mansoor Ahmed Mamtaz. UoB Quetta.
16
Characteristics of a DSC
Curve
Each substance has
a characteristic
DSC curve that can
be used for
qualitative
identification.
Endotherms
generally represent
physical changes
while exotherms
indicate
crystallization,
polymerization,
curing,
decompositionetc.
The area under the
peak (trough) is
proportional to the
heat evolvedor
absorbed during
the reaction.
23-07-2020 Mansoor Ahmed Mamtaz. UoB Quetta.
17
Applications Of The DSC
Curve
• % Crystallinity =  Hf,x/ Hf
= Heat of fusion of sample/heat of
fusion of 100% crystal
% Crystallinity
• Height of peak is proportional to rate
of reaction
• Heat of reaction = Heat absorbed or
emitted/No. of moles
Rate of reaction
• Manifests as a change in baseline.
• A sharp increase is typical of Tg.
Change in heat
capacity
23-07-2020 Mansoor Ahmed Mamtaz. UoB Quetta.
18
Melting Point From DSC Curve
 Can determine the exact melting point as the temperature at
which melting is complete.
 The actual melting of the polymer takes place at a range of
temperature.
On-set
Mid
23-07-2020 Mansoor Ahmed Mamtaz. UoB Quetta.
19
Thermogravimetric Analysis
TGA
Measurement of the mass vs temperature.
Plotted as mass vs time or mass vs temperature.
Characteristics
• Unique shape for each substance.
• Temperature at which changes occur.
• Each plateau indicates stable state & any deviation or
changes shows the presence of a reaction.
23-07-2020 Mansoor Ahmed Mamtaz. UoB Quetta.
20
TGA Curve
23-07-2020 Mansoor Ahmed Mamtaz. UoB Quetta.
21
THE END
22
23-07-2020 Mansoor Ahmed Mamtaz. UoB Quetta.
23

Phy Chem-V Presentation..pdf

  • 1.
    NAME: MANSOOR AHMED. S/O: HAJIBARI DAD. ROLL NO: 20 PRESENTATION: PHYSICAL CHEMISTRY-V 1 PRESENTATION CONTACT NO: 0300-8061972 23-07-2020 Mansoor Ahmed Mamtaz. UoB Quetta. 1
  • 2.
    PRESENTATION TOPIC: THERMAL TRANSITIONSOF POLYMERS  PRESENTED TO: MISS HABIBA TAJ SAHIBA.  DATE OF PRESENTATION: 23-07-2020 2 23-07-2020 Mansoor Ahmed Mamtaz. UoB Quetta.
  • 3.
    UNIVERSITY OF BALOCHISTAN QUETTA DEPARTMENT: CHEMISTRY  PROGRAM OF STUDY: M.Sc  SEMESTER NO: 3RD  SESSION: 2019-20 3 23-07-2020 Mansoor Ahmed Mamtaz. UoB Quetta.
  • 4.
    23-07-2020 Mansoor AhmedMamtaz. UoB Quetta. 4
  • 5.
    CONTENTS Glass transition temperature Crystallinemelting point Factors affecting Tg Factors affecting Tm Thermal methods of polymer analysis 23-07-2020 Mansoor Ahmed Mamtaz. UoB Quetta. 5
  • 6.
    THERMAL TRANSITIONS OFPOLYMERS 23-07-2020 Mansoor Ahmed Mamtaz. UoB Quetta. 6
  • 7.
    Thermal Transitions OfPolymers Completely amorphous polymer: Tg only Completely Crystalline: Tm Semi-crystalline: Both Tg & Tm 23-07-2020 Mansoor Ahmed Mamtaz. UoB Quetta. 7
  • 8.
    AMORPHOUS POLYMERS Temperature LOWMW HIGH MW LOW Glassy solid Rubbery: 1. rigid solid – rubber 2. rubber – liquid HIGH Viscous fluid 23-07-2020 Mansoor Ahmed Mamtaz. UoB Quetta. 8
  • 9.
    Semicrystalline Polymers Two majortypes of thermal transitions: Crystalline melting point, Tm, at which the crystalline domains melt. •Above this temperature, polymer is liquid. •Below this temperature, polymer forms flexible crystalline solid. Tg, glass transition temperature. •Below this, polymer exists as hard, rigid glassy solid. 23-07-2020 Mansoor Ahmed Mamtaz. UoB Quetta. 9
  • 10.
    Factors Affecting Tg •Nature of polymerbackbone. • C-C and C-O bonds are flexible. • Nature of groups directly attached to the backbone (due to repulsion and tendency to form H-bonding). • Flexibility enhanced by methylene groups. • Flexibility reduced by ring structures • phenylene and amide • substitutionof H atoms by HC groups • eg. Tg: PTFE > PE Chain flexibility, interactions & structure 23-07-2020 Mansoor Ahmed Mamtaz. UoB Quetta. 10
  • 11.
    …Cont’…Factors Affecting Tg Inclusion ofdouble bond stiffens it but increases flexibility of adjacent bonds. Segmental rotation is affected by other chains in the same region (mainly dipole interaction and hydrogen bonding). • Tg: PVC > PE (more polar). • Tg: polyvinylidene < PVC (less polar due to symmetrical substitution. • Hydrogen bonding also significantly increases Tg. 23-07-2020 Mansoor Ahmed Mamtaz. UoB Quetta. 11
  • 12.
    Factors Affecting Tm Samefactors affect both Tg & Tm. Usually high Tg & high Tm are found together and vice versa. Asymmetrically structured polymershave higher Tm • Eg PVC vs polyvinylidene High polarity and hydrogen bonding increases Tm. Molecular symmetry leads to high Tm. • Eg PE has high Tm due to tightly packed crystals although Tg is low due to flexibility of the chain. 23-07-2020 Mansoor Ahmed Mamtaz. UoB Quetta. 12
  • 13.
    Values Of Tg& Tm Polymer Repeating Unit Tg (˚C) Tm (˚C) Polyethylene -CH2CH2- -125 137 Natural rubber -CH2C(CH3)=CHCH2- -73 28 Polypropylene -CH2CH(CH3)-- -13 176 Polyvinylchloride -CH2CHCl- 81 273 Polystyrene -CH2CHØ- 100 240 Polymethylmethacrylate -CH2C(CH3)(CO2CH3)- 105 200 23-07-2020 Mansoor Ahmed Mamtaz. UoB Quetta. 13
  • 14.
    Thermal Analysis Of Polymers TechniqueQuantity measured Applications Differential Scanning Calorimetry (DSC) Heat flow Reaction kinetics, purity analysis, polymercures Differential thermal analysis (DTA) Temperature difference Thermal stability, phase diagram Thermogravimetric analysis (TGA) mass Thermal stability, compositional analysis 23-07-2020 Mansoor Ahmed Mamtaz. UoB Quetta. 14
  • 15.
    Differential Scanning Calorimetry (DSC) Polymer and reference samples are heated in such a way that they are kept at the same (increasing) temperature.  When a thermal transitionoccurs thermal energy is suppliedto the polymer or reference.  The energy transferred is equivalent to the energy absorbed or evolved in the transition. 23-07-2020 Mansoor Ahmed Mamtaz. UoB Quetta. 15
  • 16.
    DSC Plot  Theresulting plot of differential rate of heating Vs temperature can be studied to measure heat capacity, melt enthalpy and transition temperature. 23-07-2020 Mansoor Ahmed Mamtaz. UoB Quetta. 16
  • 17.
    Characteristics of aDSC Curve Each substance has a characteristic DSC curve that can be used for qualitative identification. Endotherms generally represent physical changes while exotherms indicate crystallization, polymerization, curing, decompositionetc. The area under the peak (trough) is proportional to the heat evolvedor absorbed during the reaction. 23-07-2020 Mansoor Ahmed Mamtaz. UoB Quetta. 17
  • 18.
    Applications Of TheDSC Curve • % Crystallinity =  Hf,x/ Hf = Heat of fusion of sample/heat of fusion of 100% crystal % Crystallinity • Height of peak is proportional to rate of reaction • Heat of reaction = Heat absorbed or emitted/No. of moles Rate of reaction • Manifests as a change in baseline. • A sharp increase is typical of Tg. Change in heat capacity 23-07-2020 Mansoor Ahmed Mamtaz. UoB Quetta. 18
  • 19.
    Melting Point FromDSC Curve  Can determine the exact melting point as the temperature at which melting is complete.  The actual melting of the polymer takes place at a range of temperature. On-set Mid 23-07-2020 Mansoor Ahmed Mamtaz. UoB Quetta. 19
  • 20.
    Thermogravimetric Analysis TGA Measurement ofthe mass vs temperature. Plotted as mass vs time or mass vs temperature. Characteristics • Unique shape for each substance. • Temperature at which changes occur. • Each plateau indicates stable state & any deviation or changes shows the presence of a reaction. 23-07-2020 Mansoor Ahmed Mamtaz. UoB Quetta. 20
  • 21.
    TGA Curve 23-07-2020 MansoorAhmed Mamtaz. UoB Quetta. 21
  • 22.
    THE END 22 23-07-2020 MansoorAhmed Mamtaz. UoB Quetta.
  • 23.
    23-07-2020 Mansoor AhmedMamtaz. UoB Quetta. 23