Download as PDF, PPTX


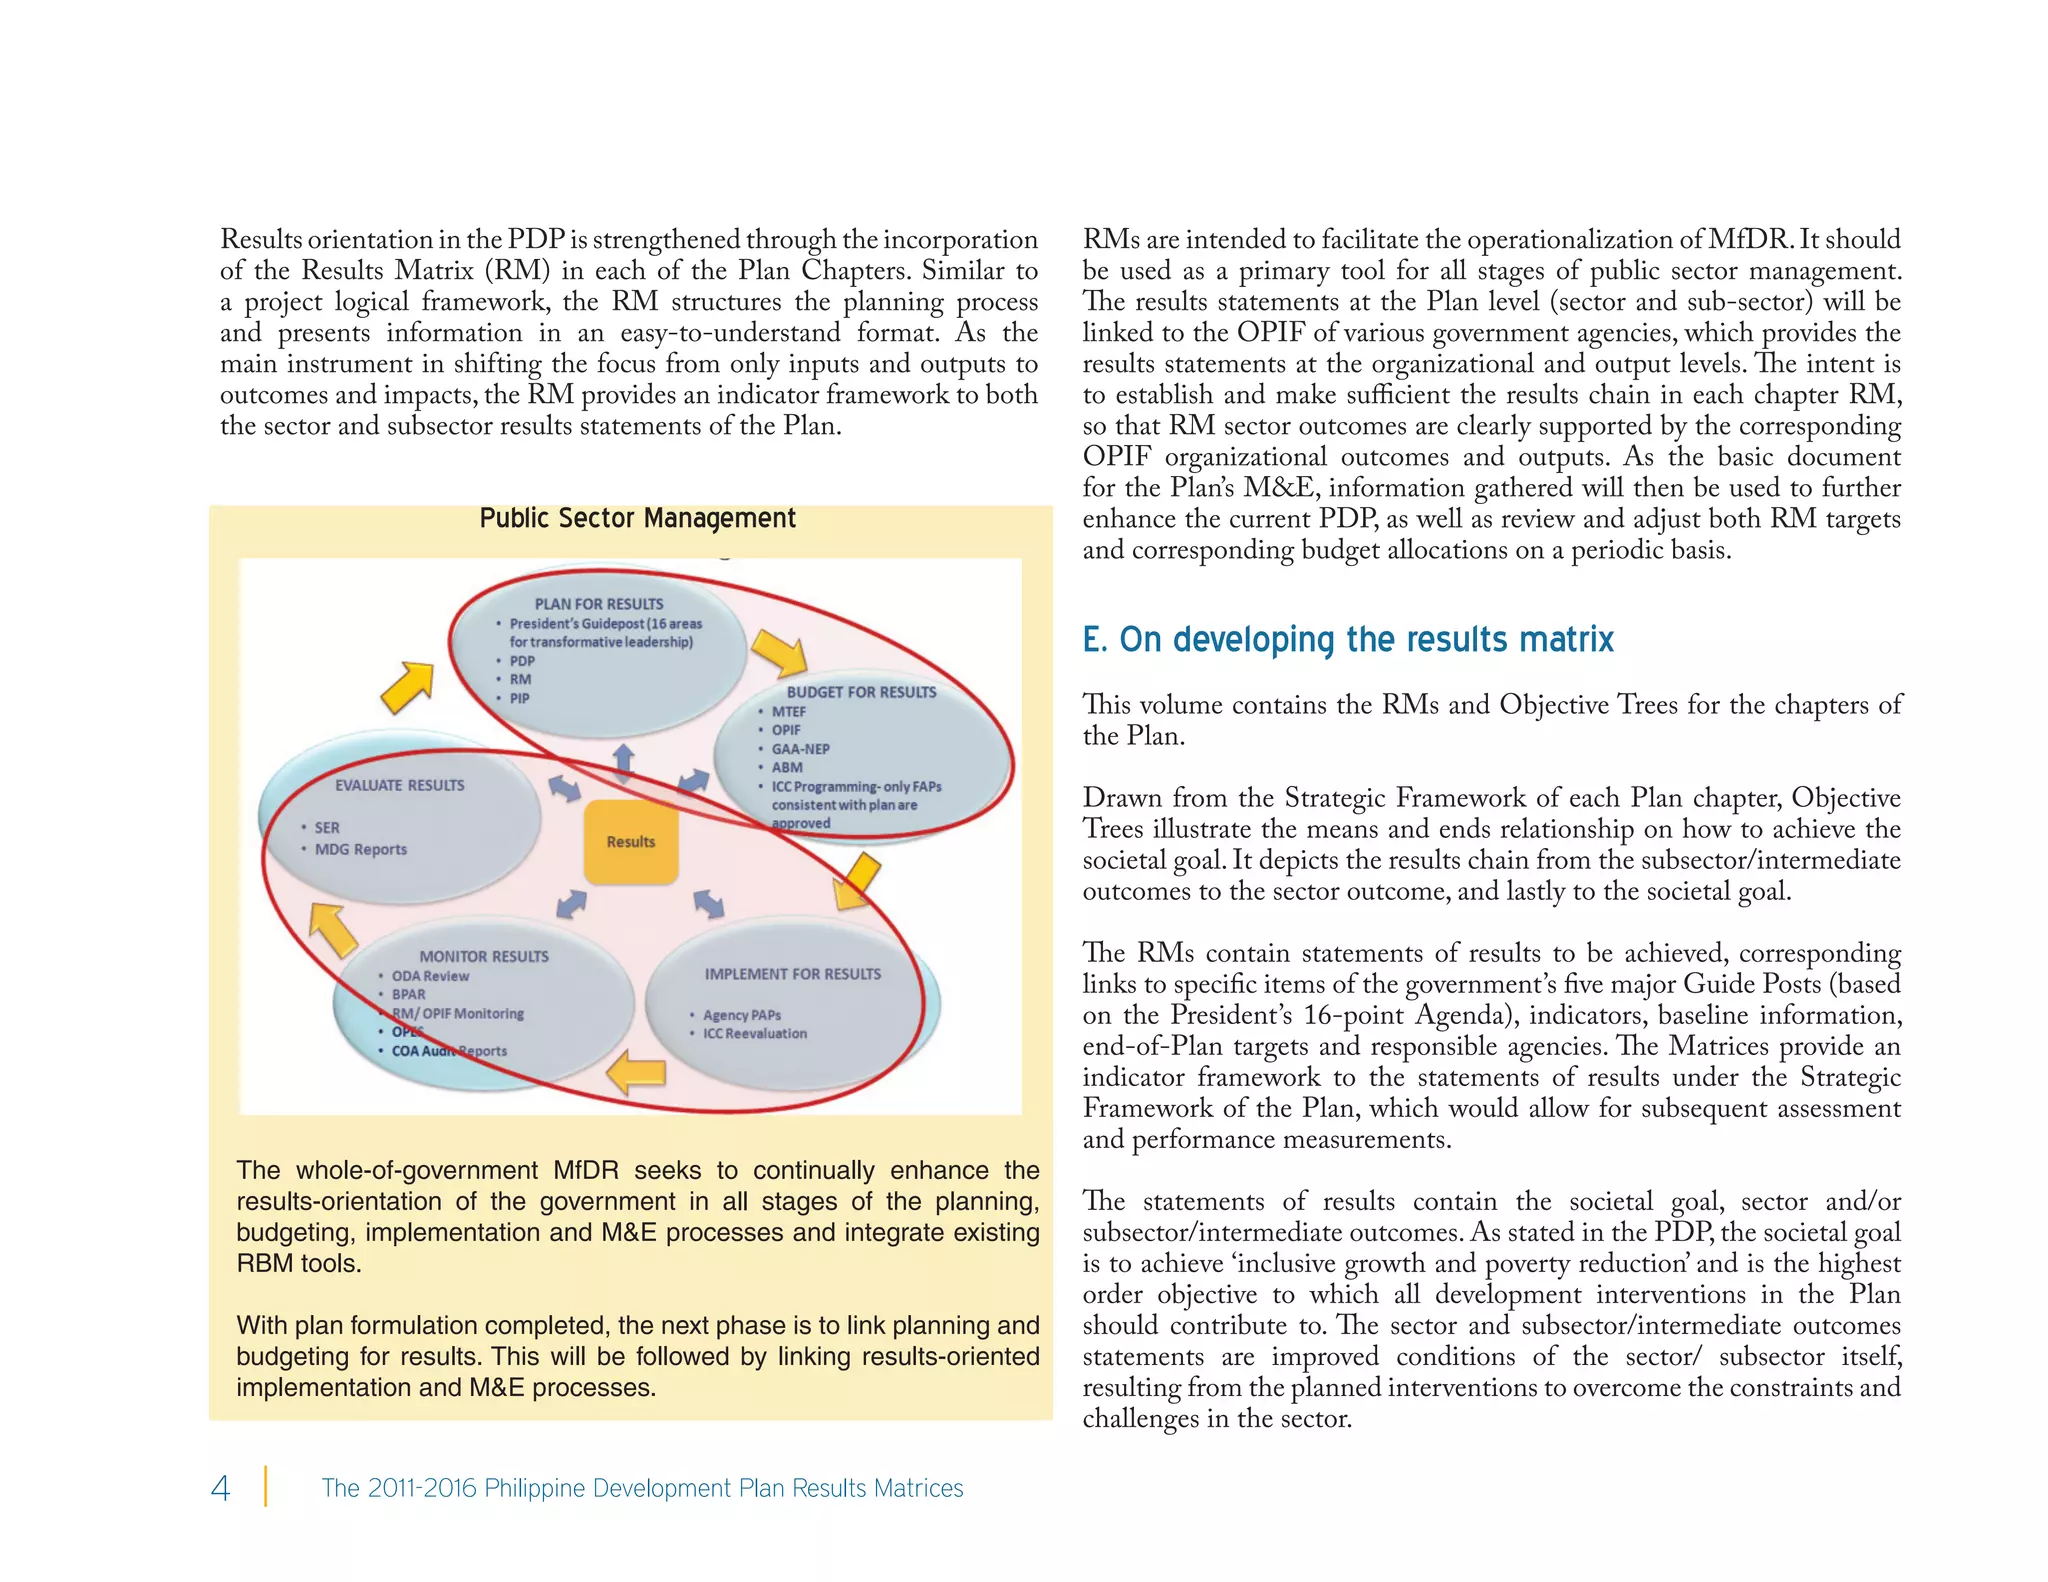
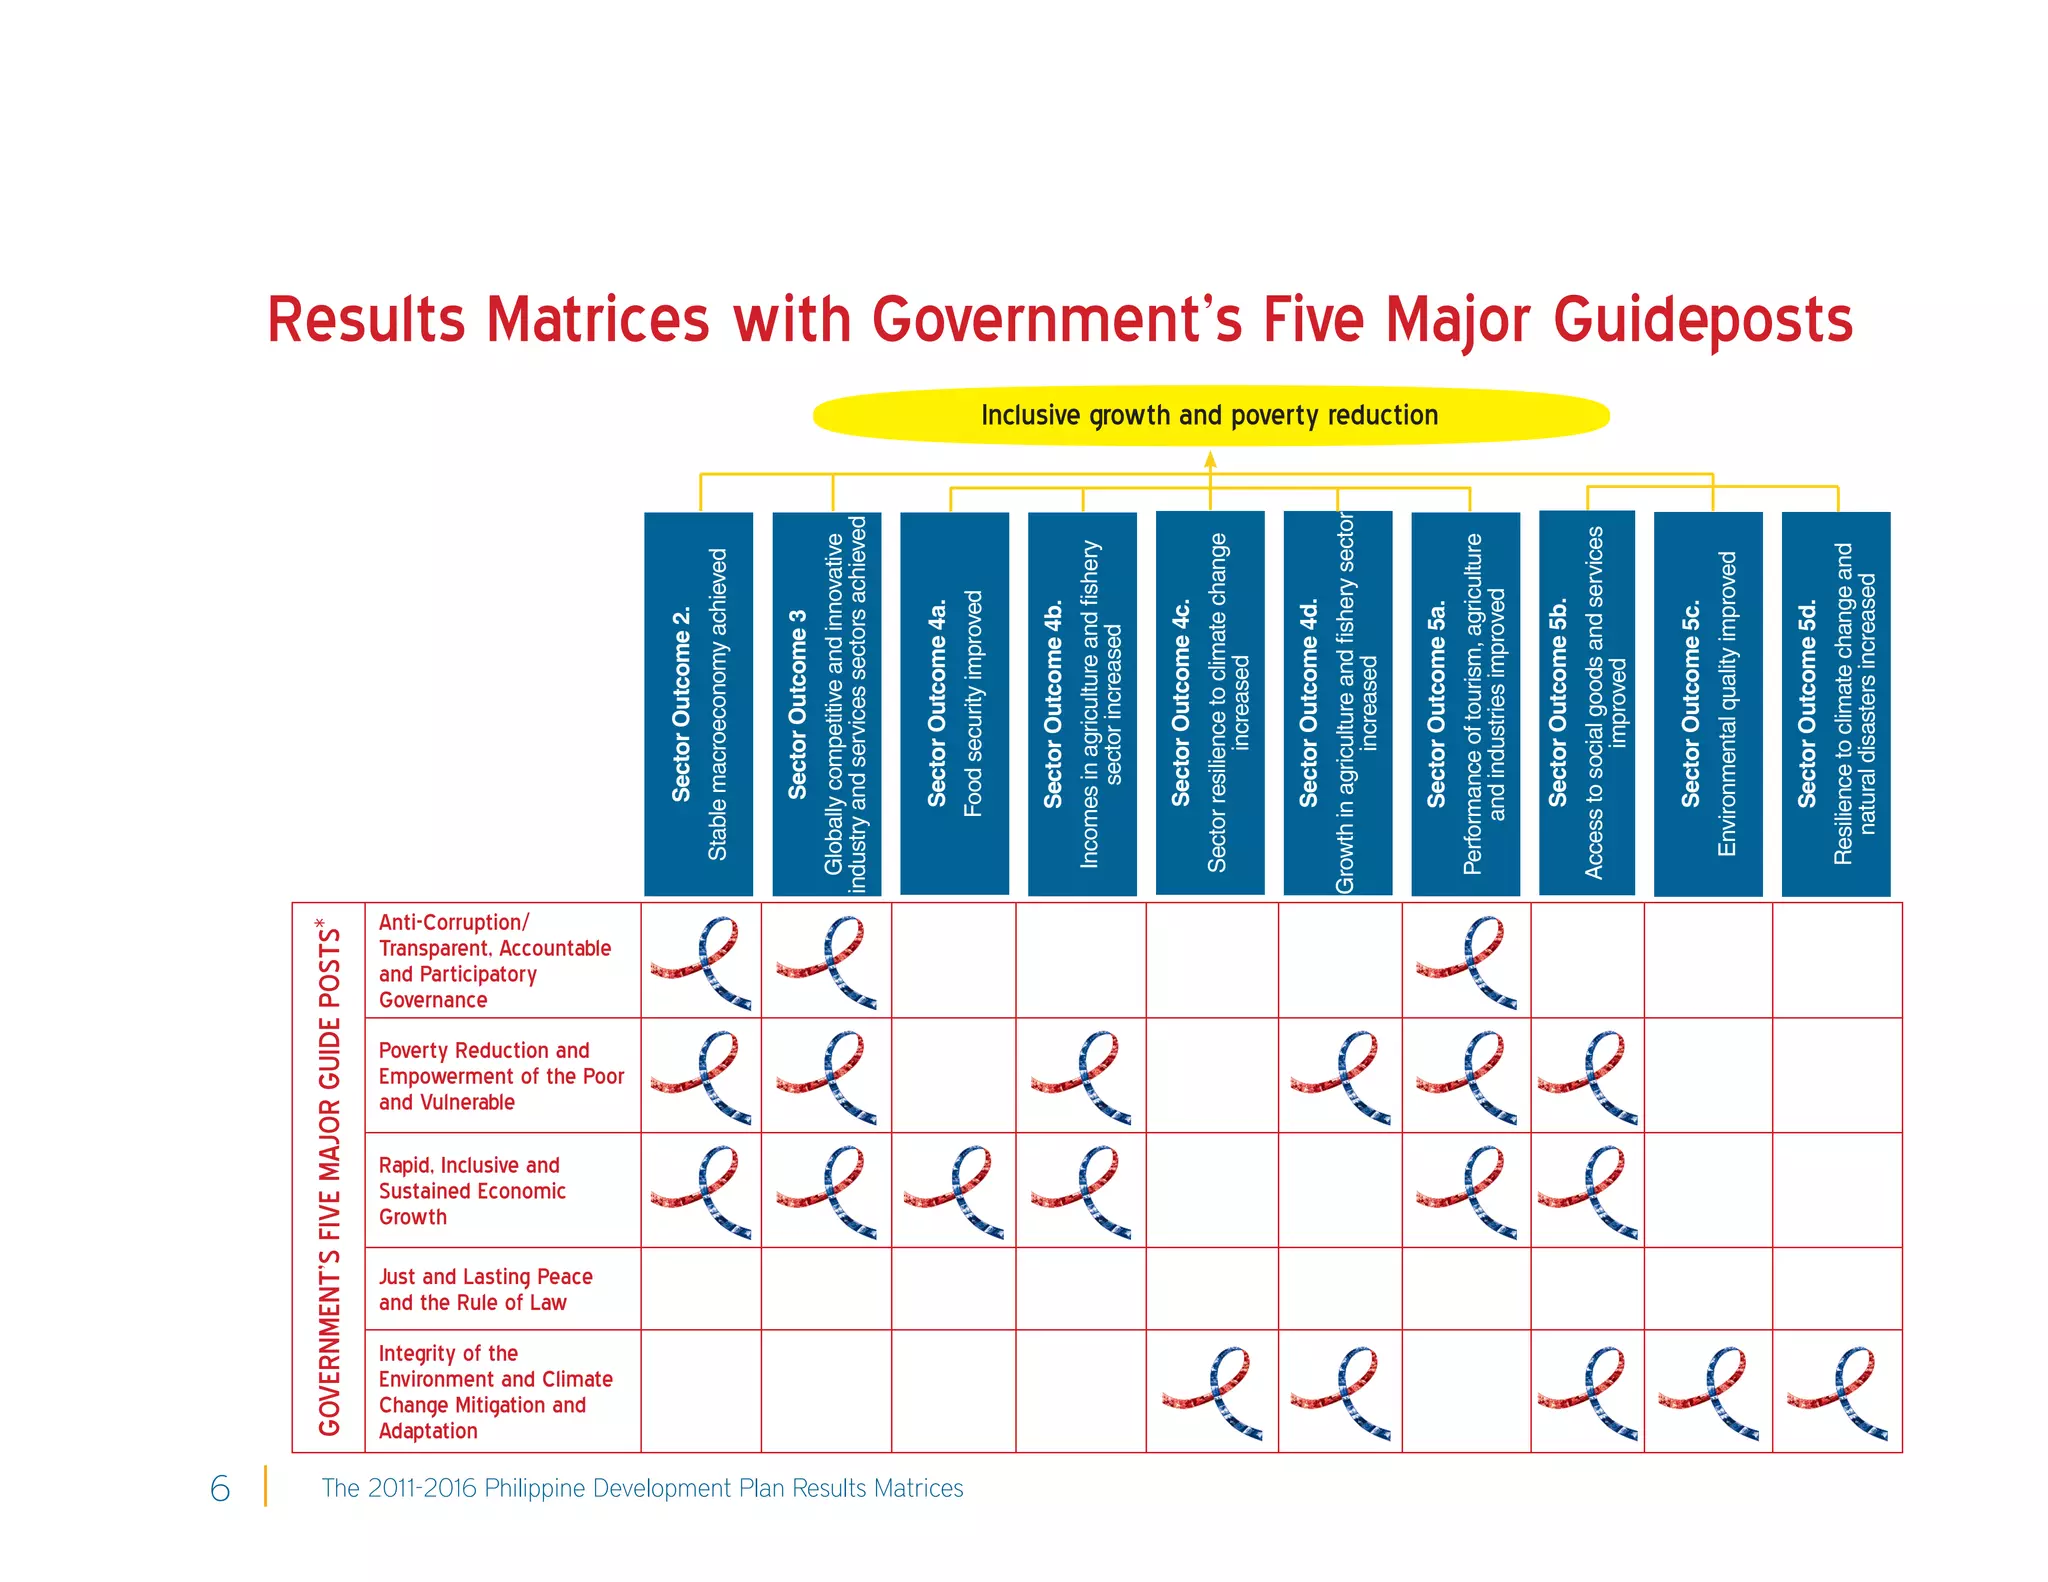
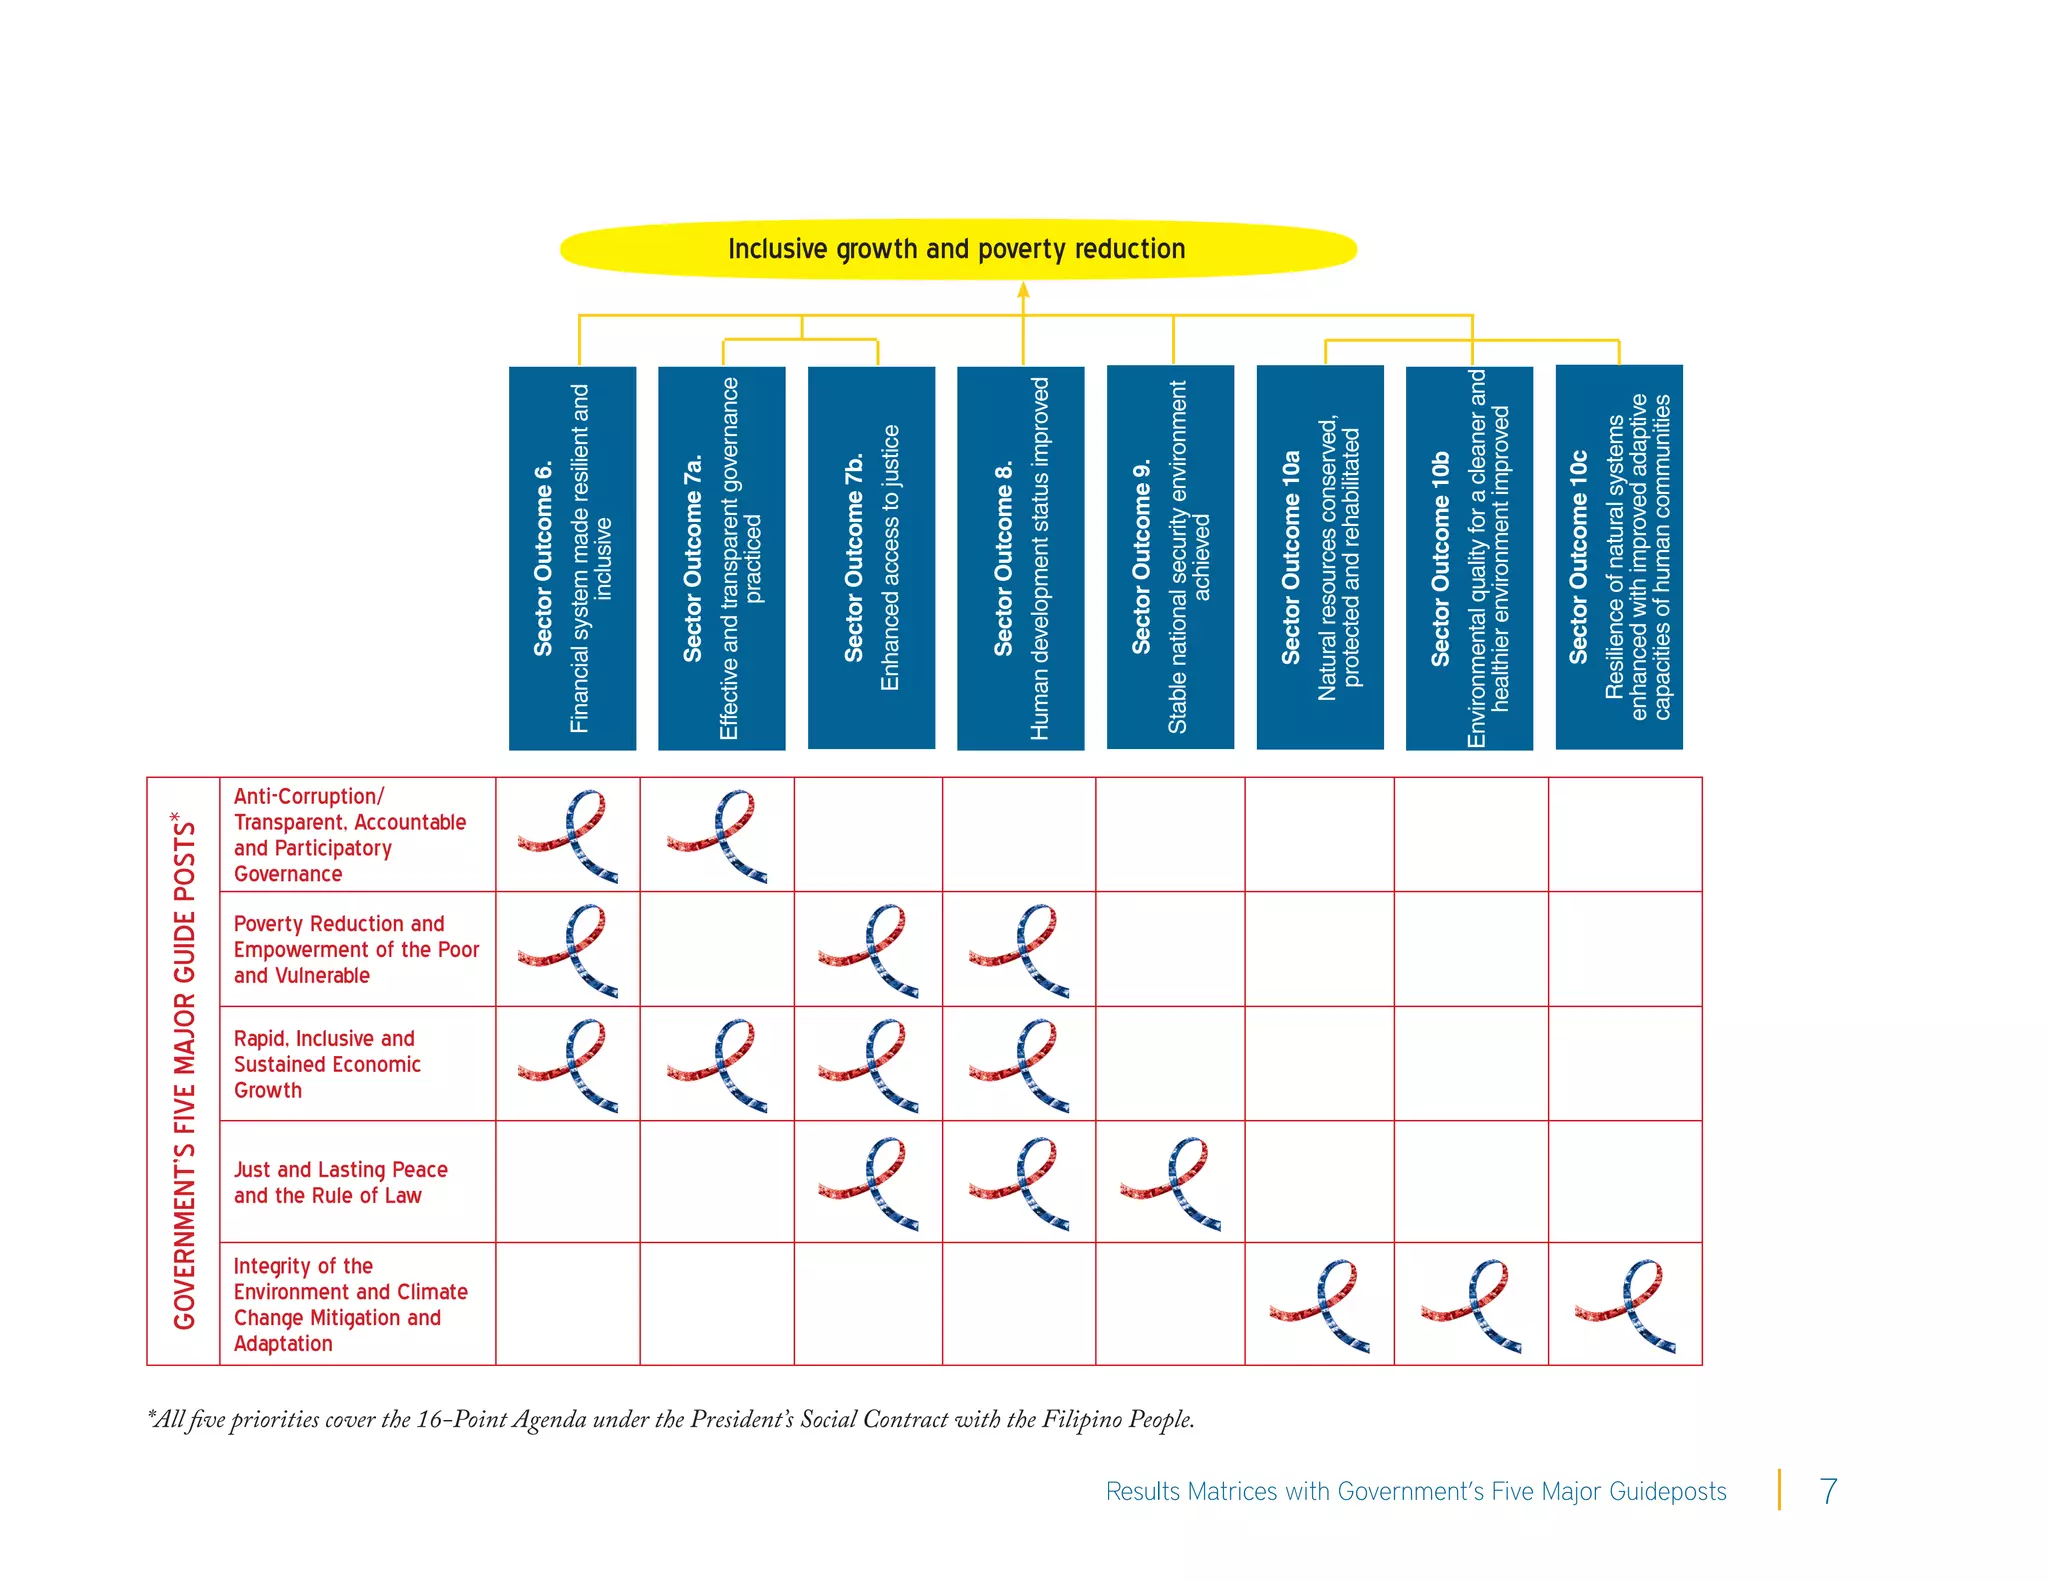

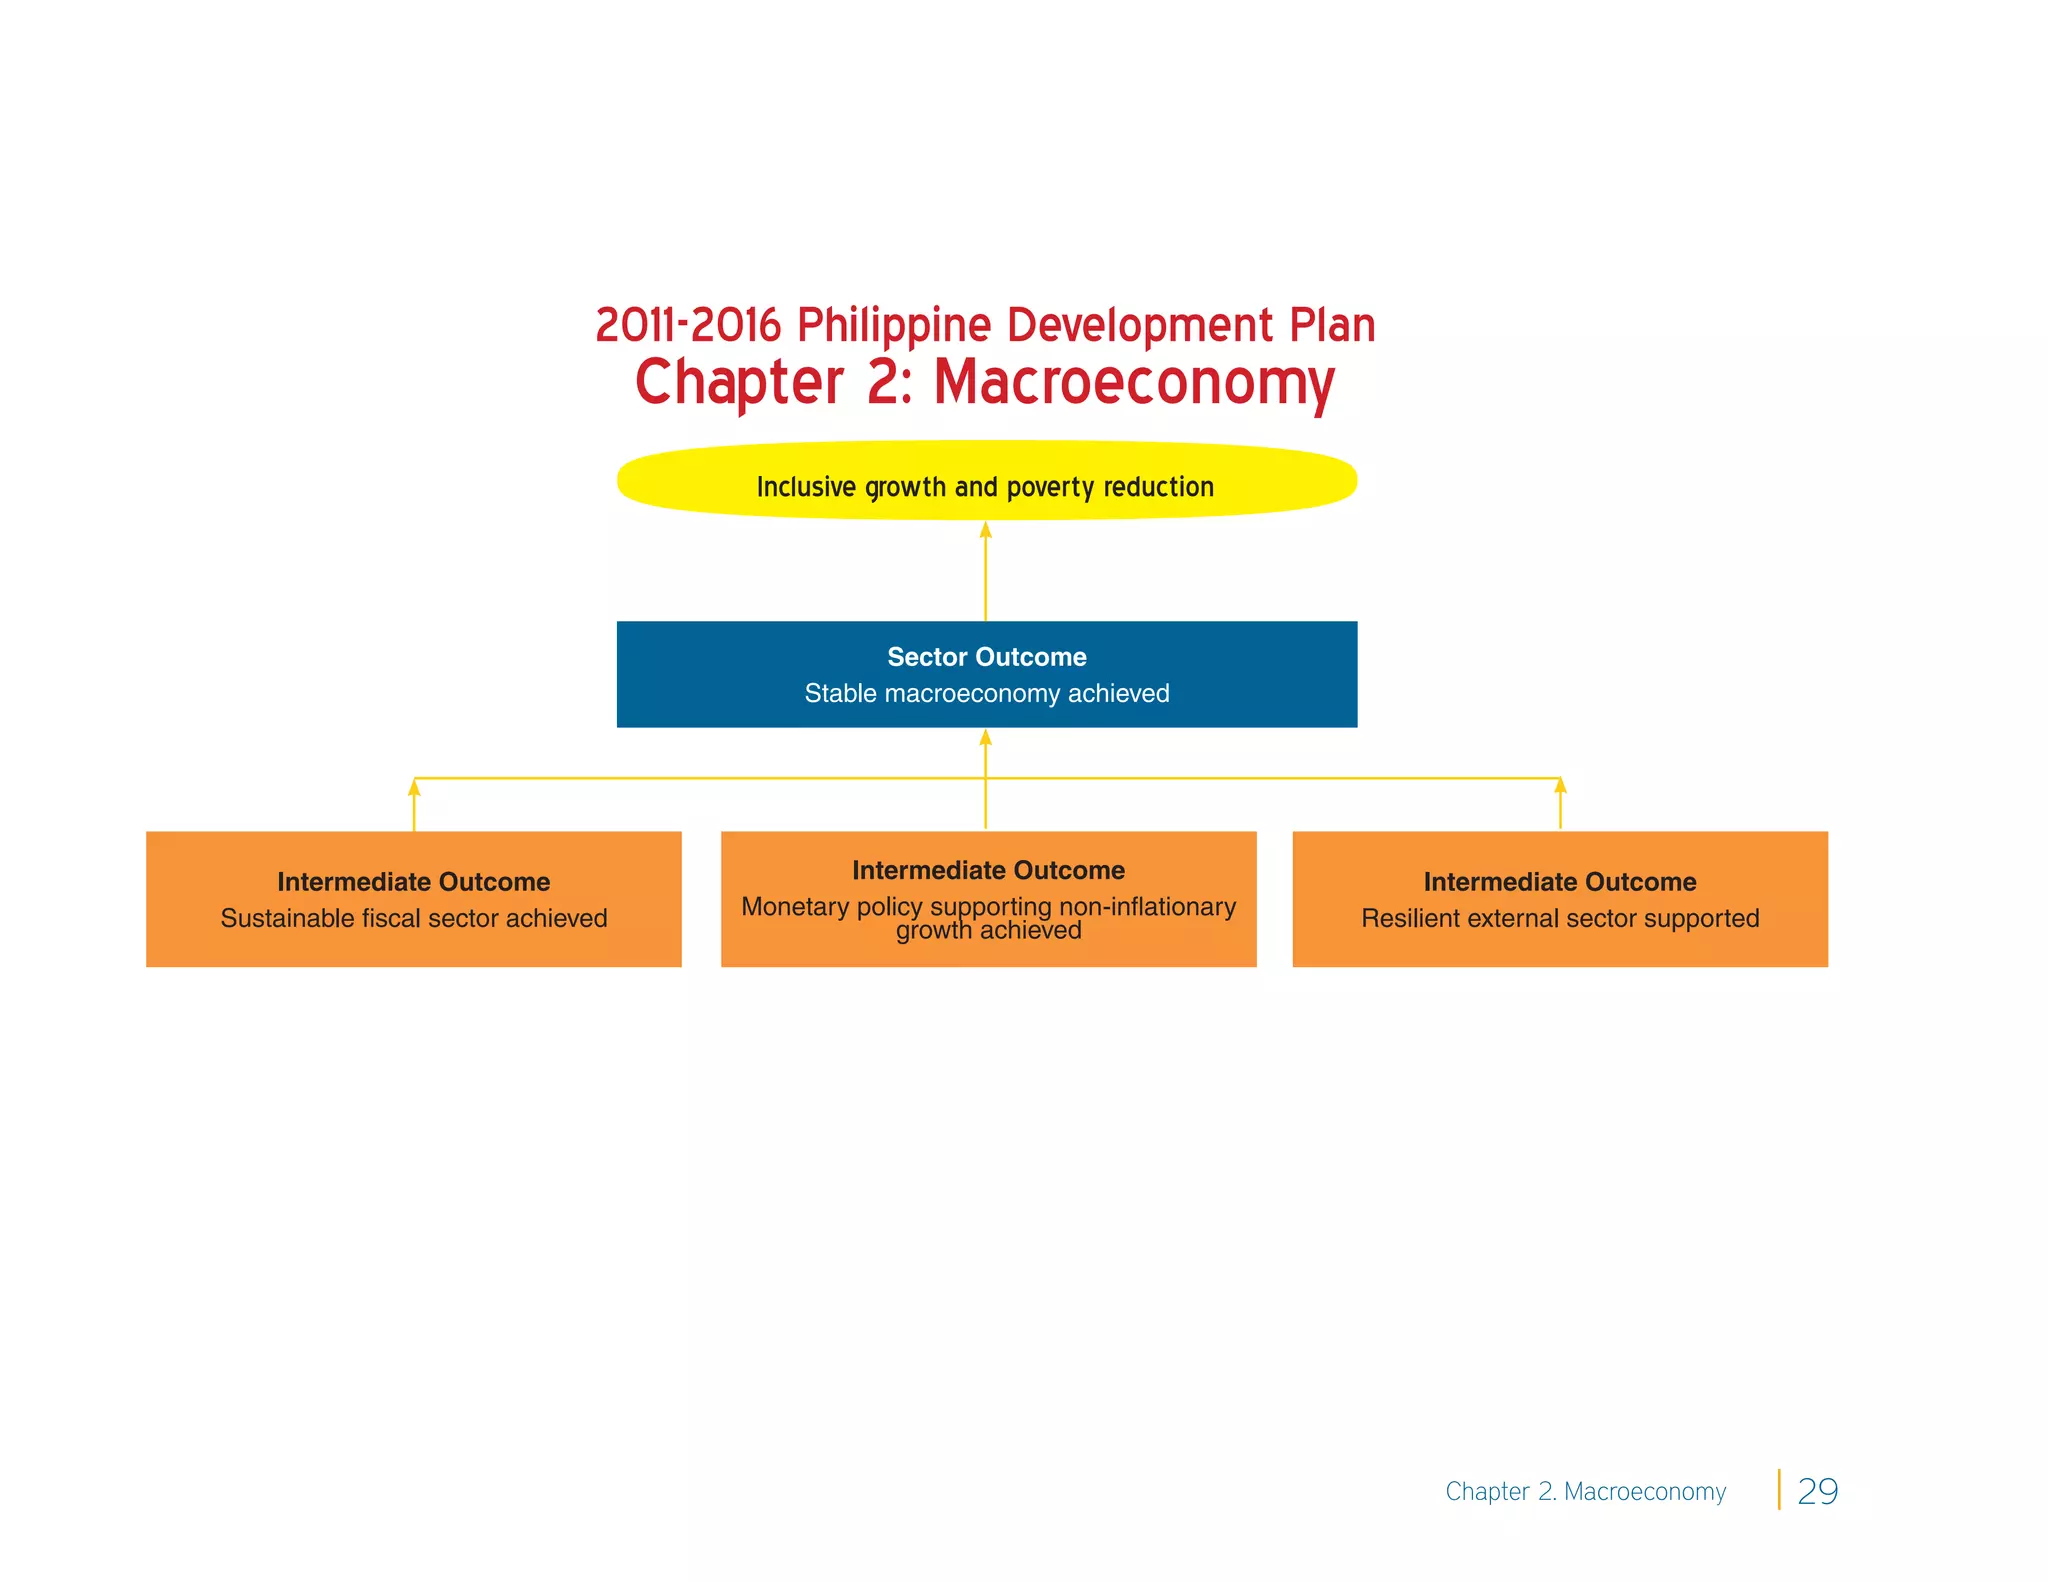
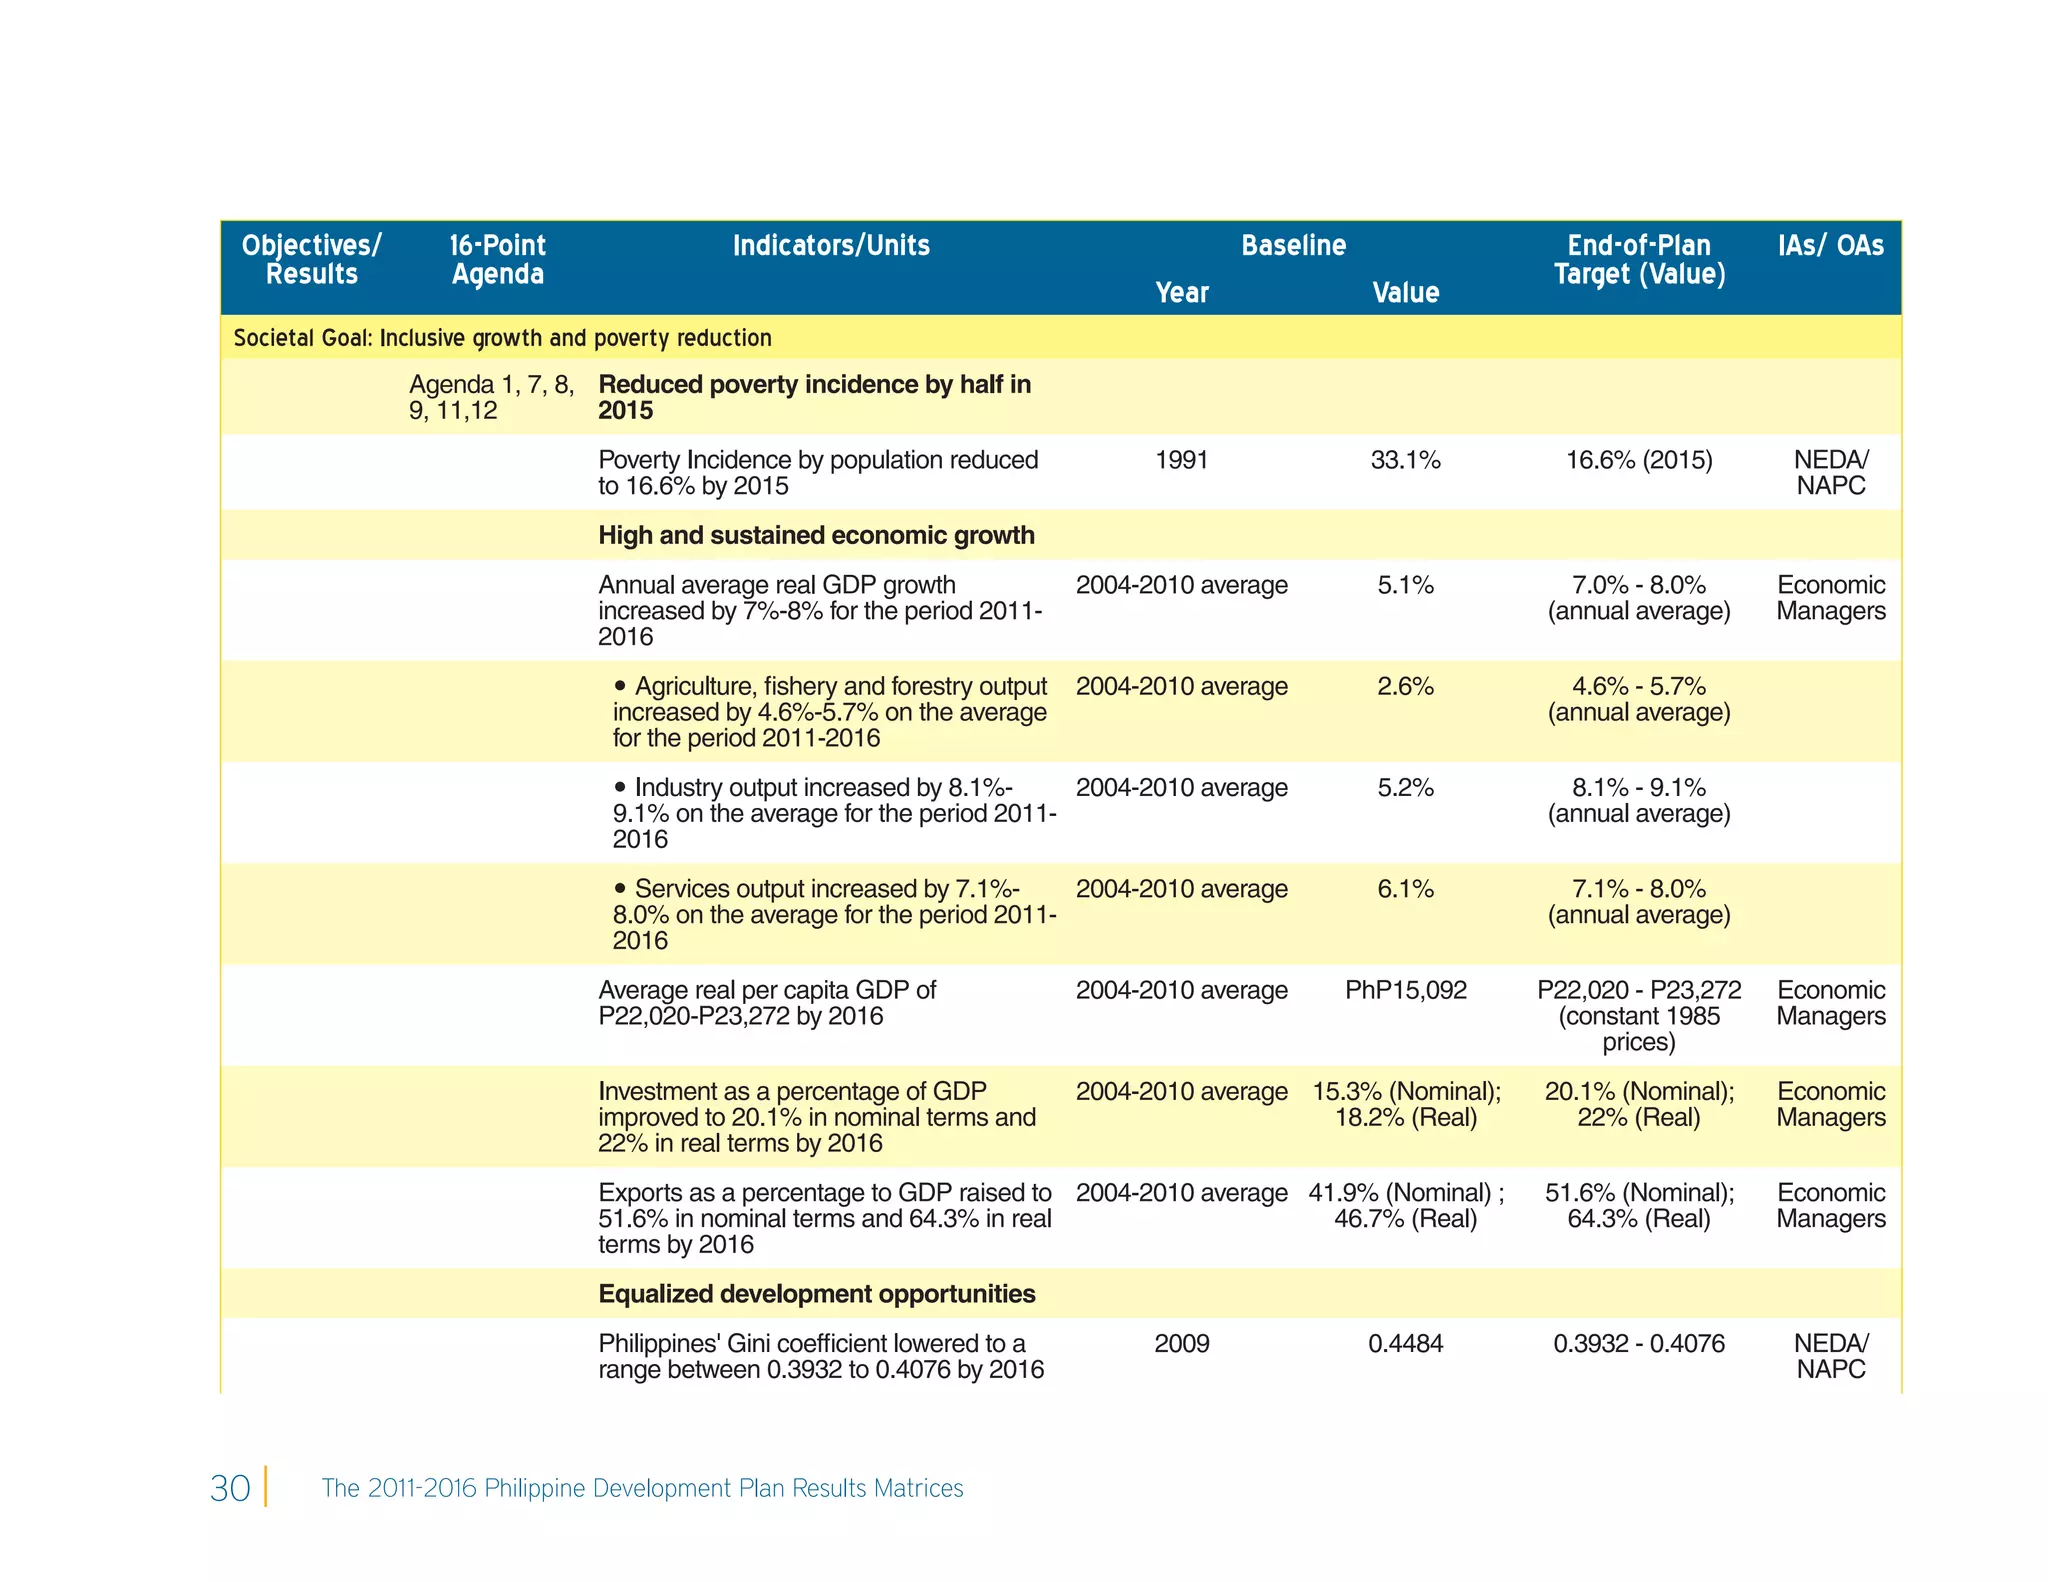
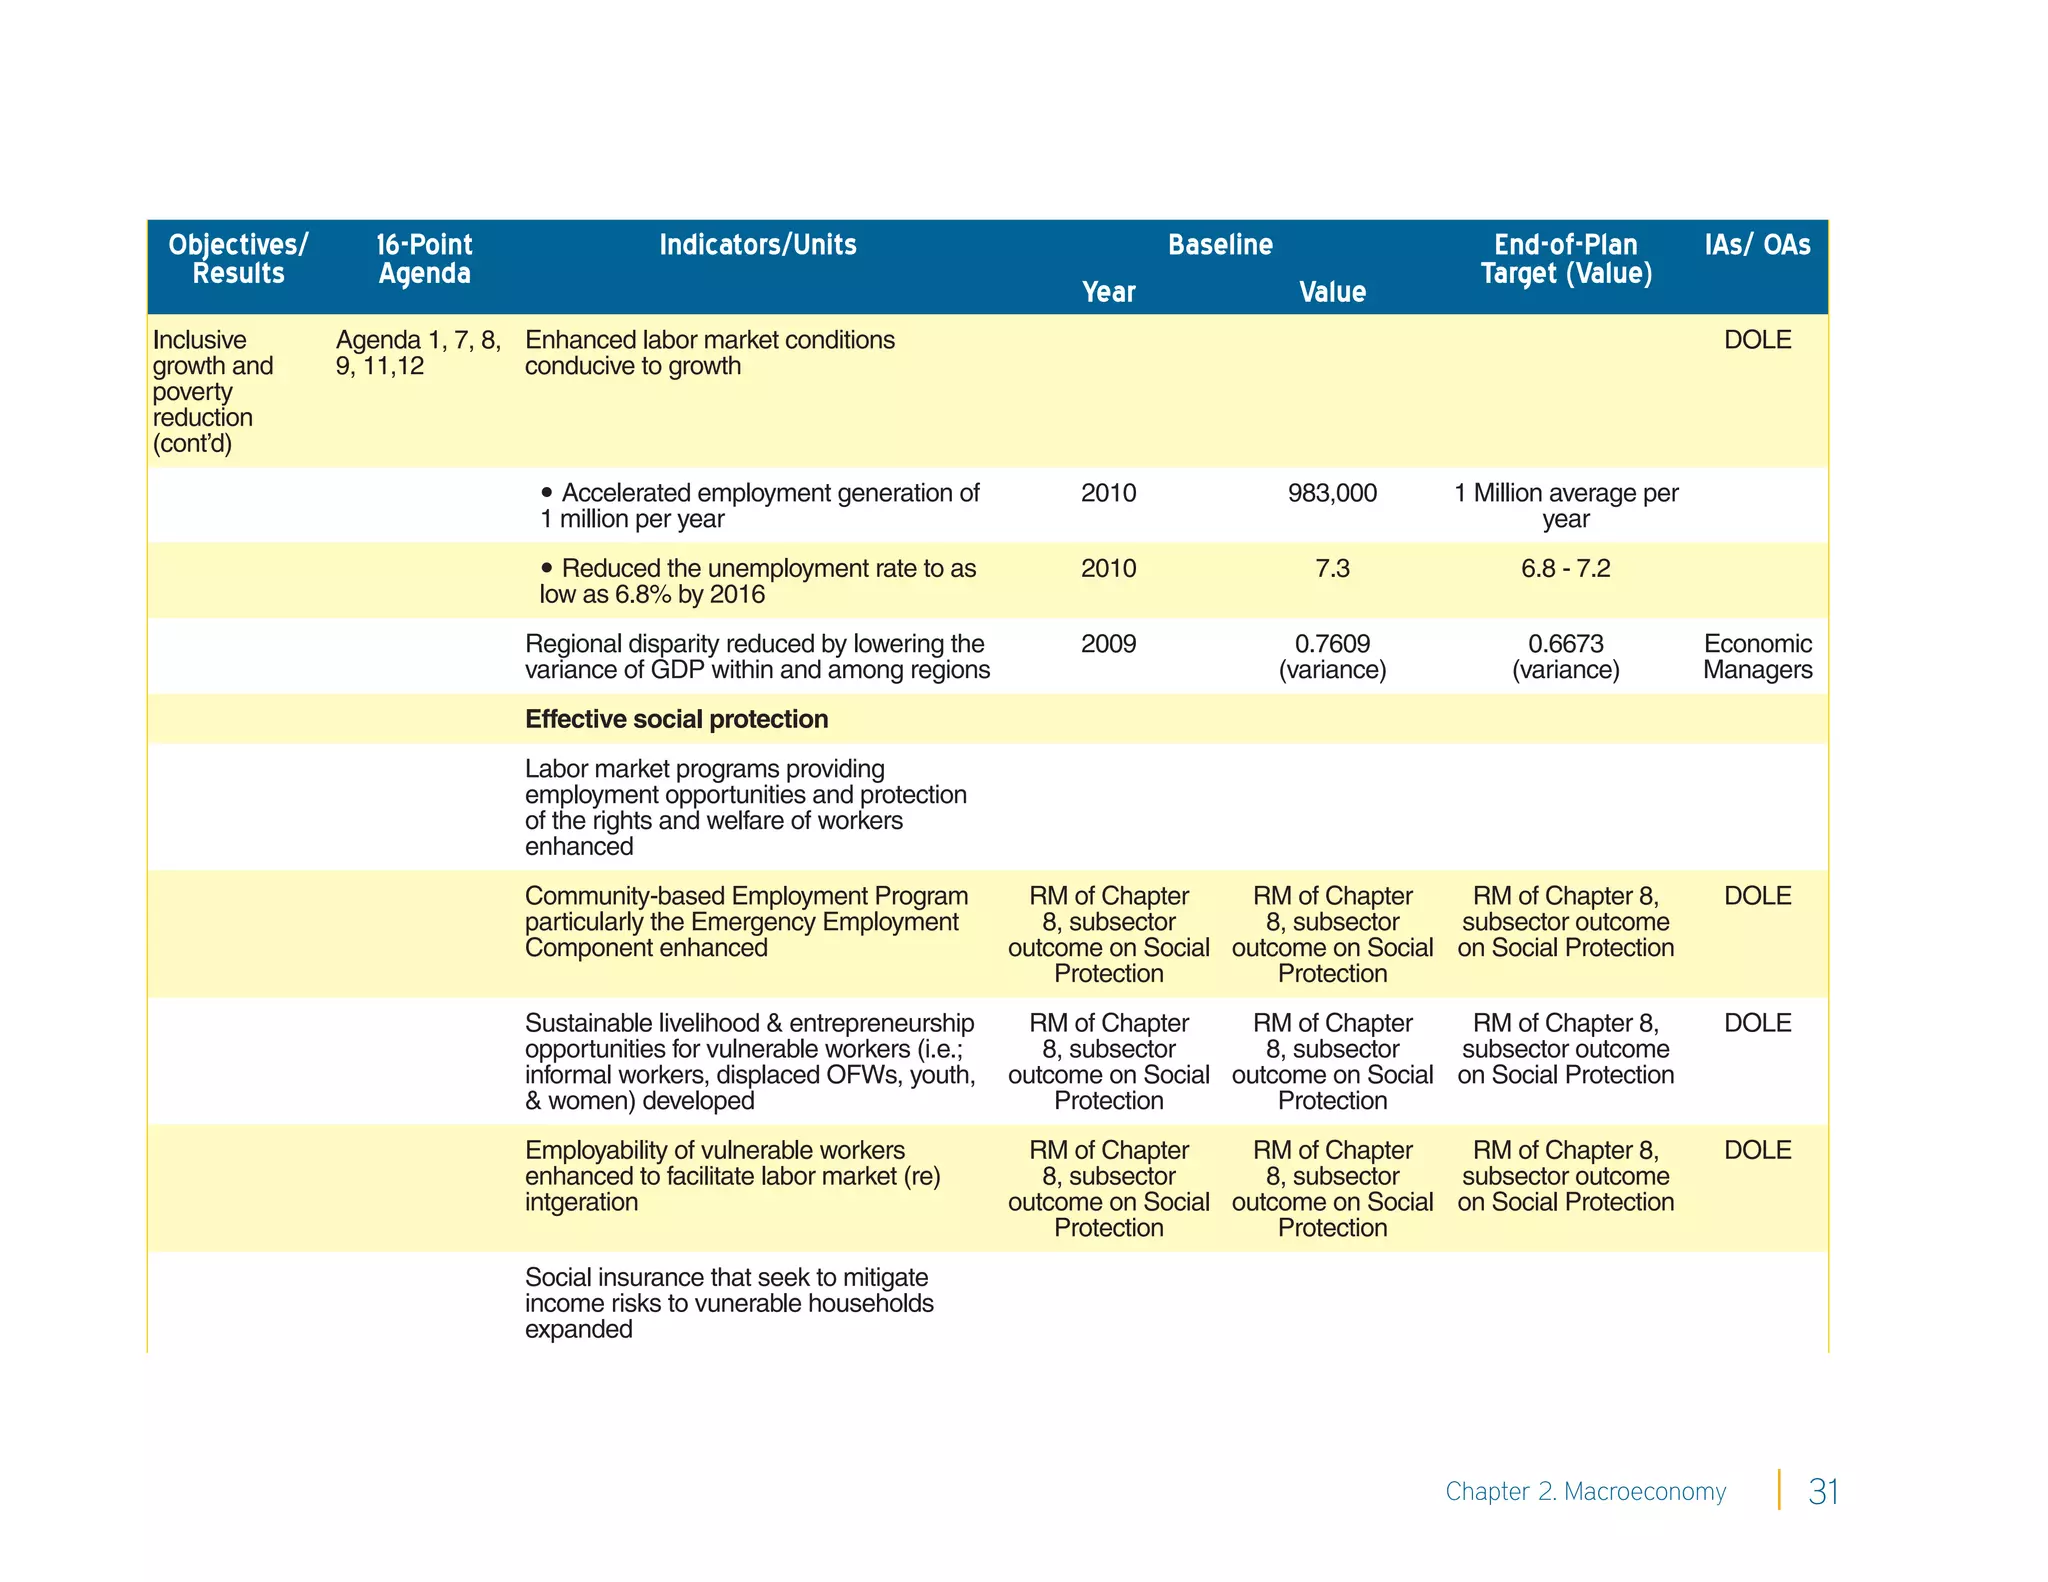
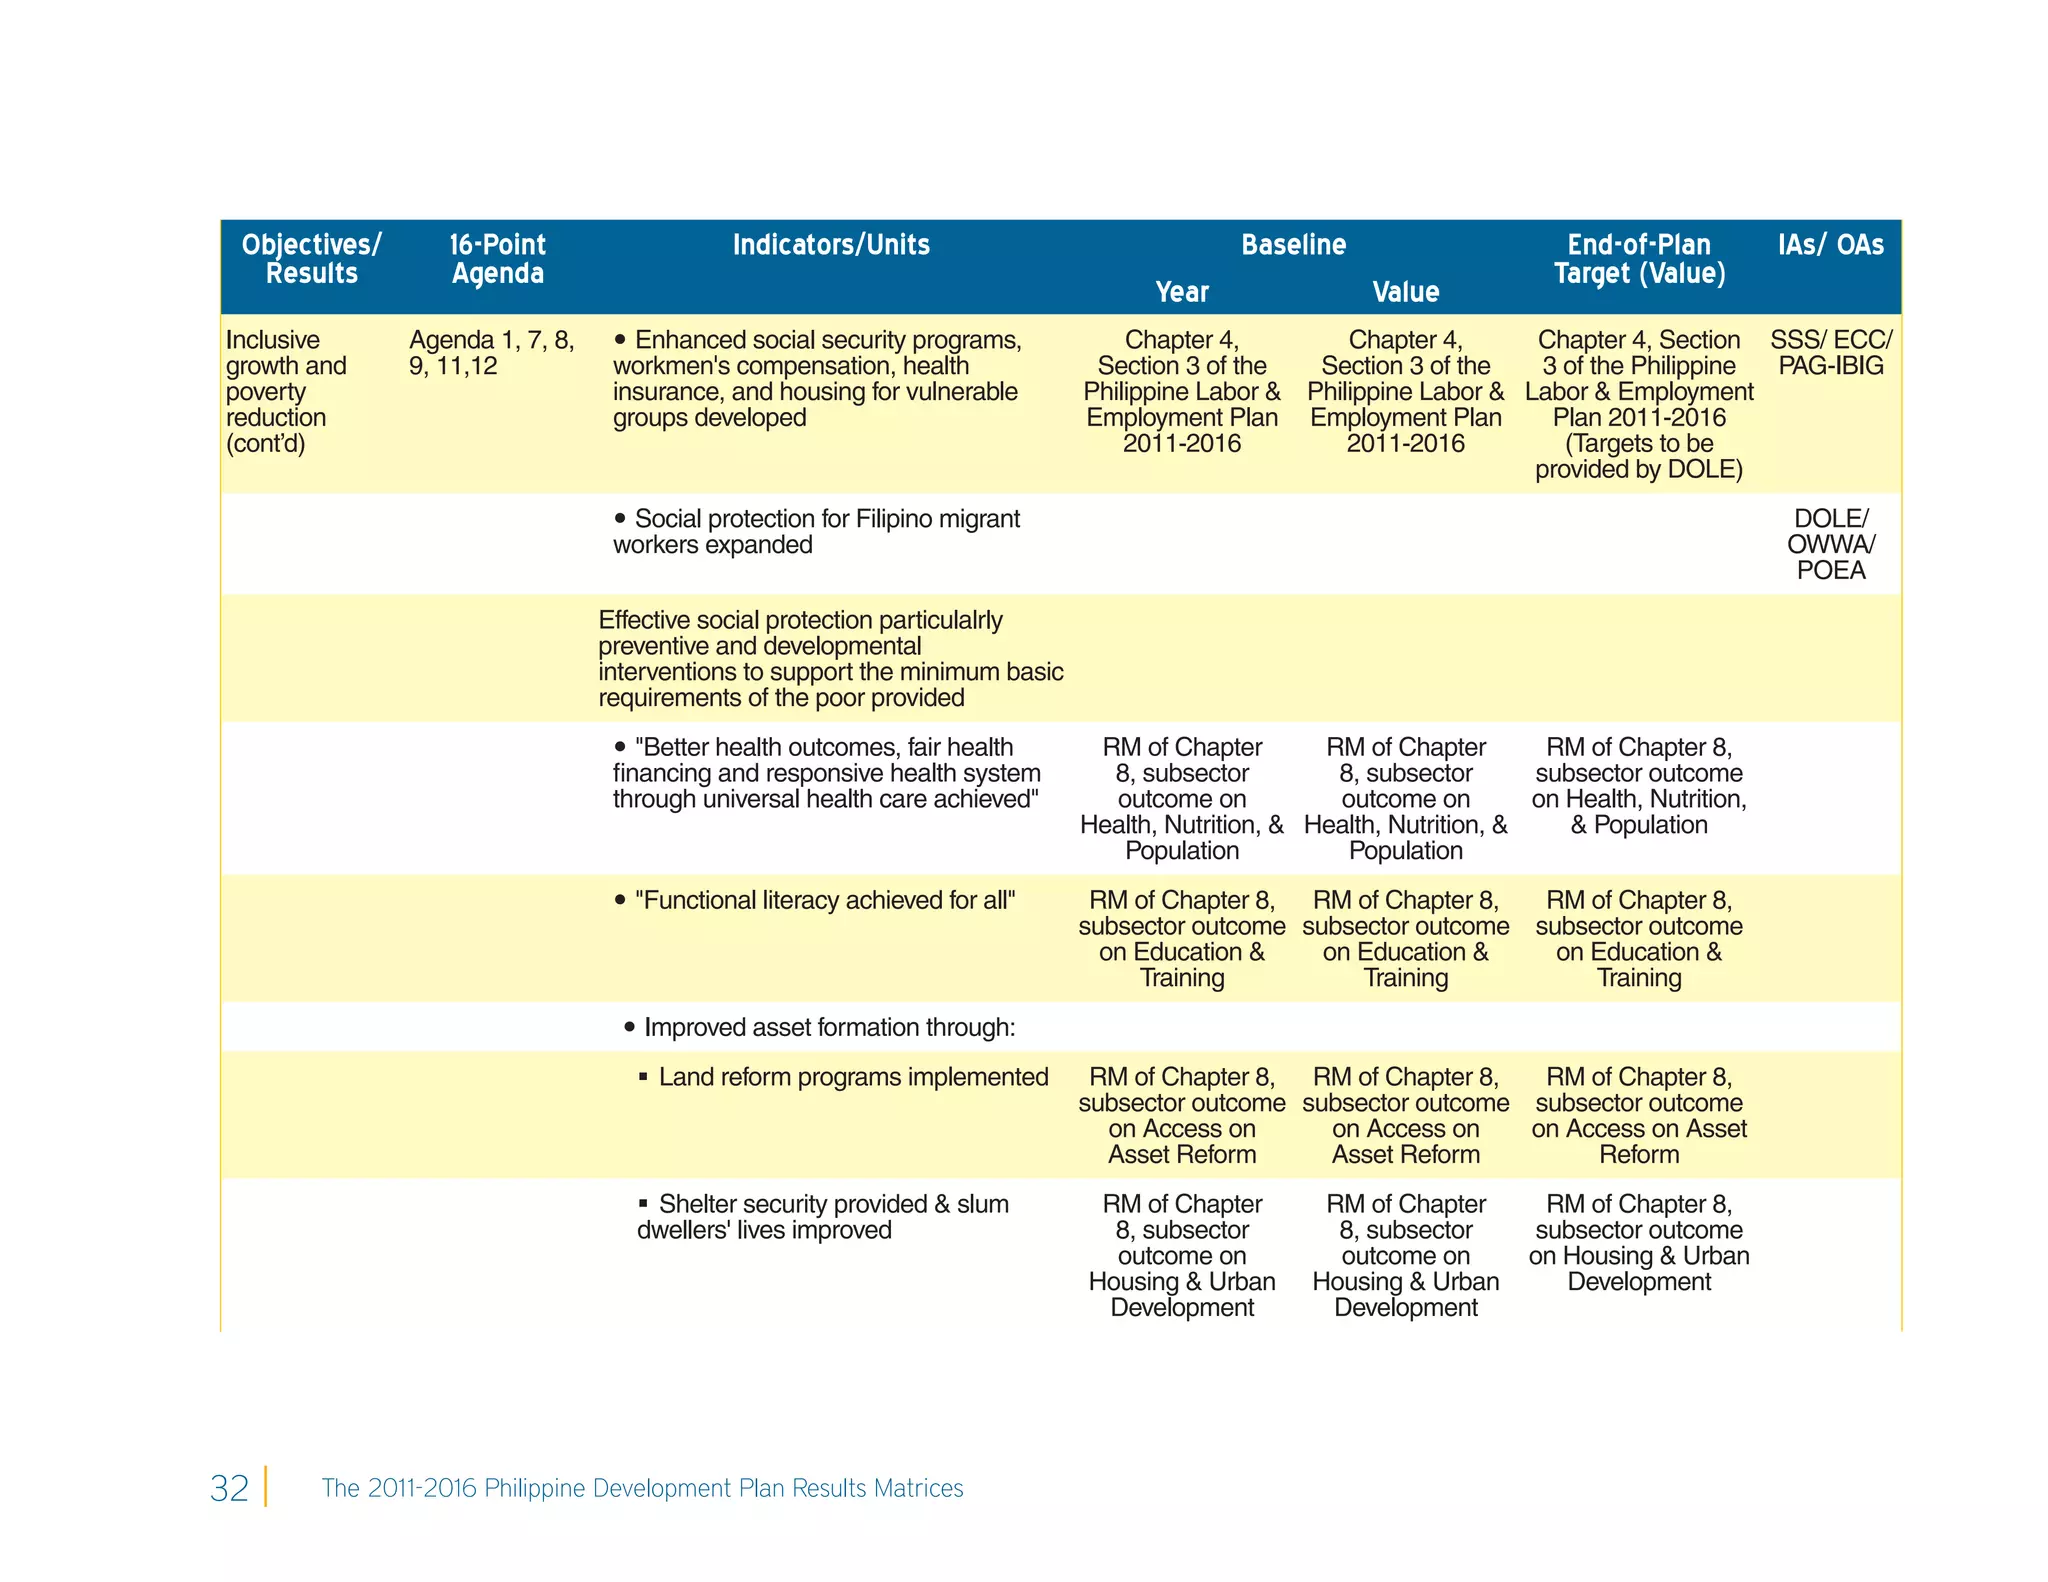
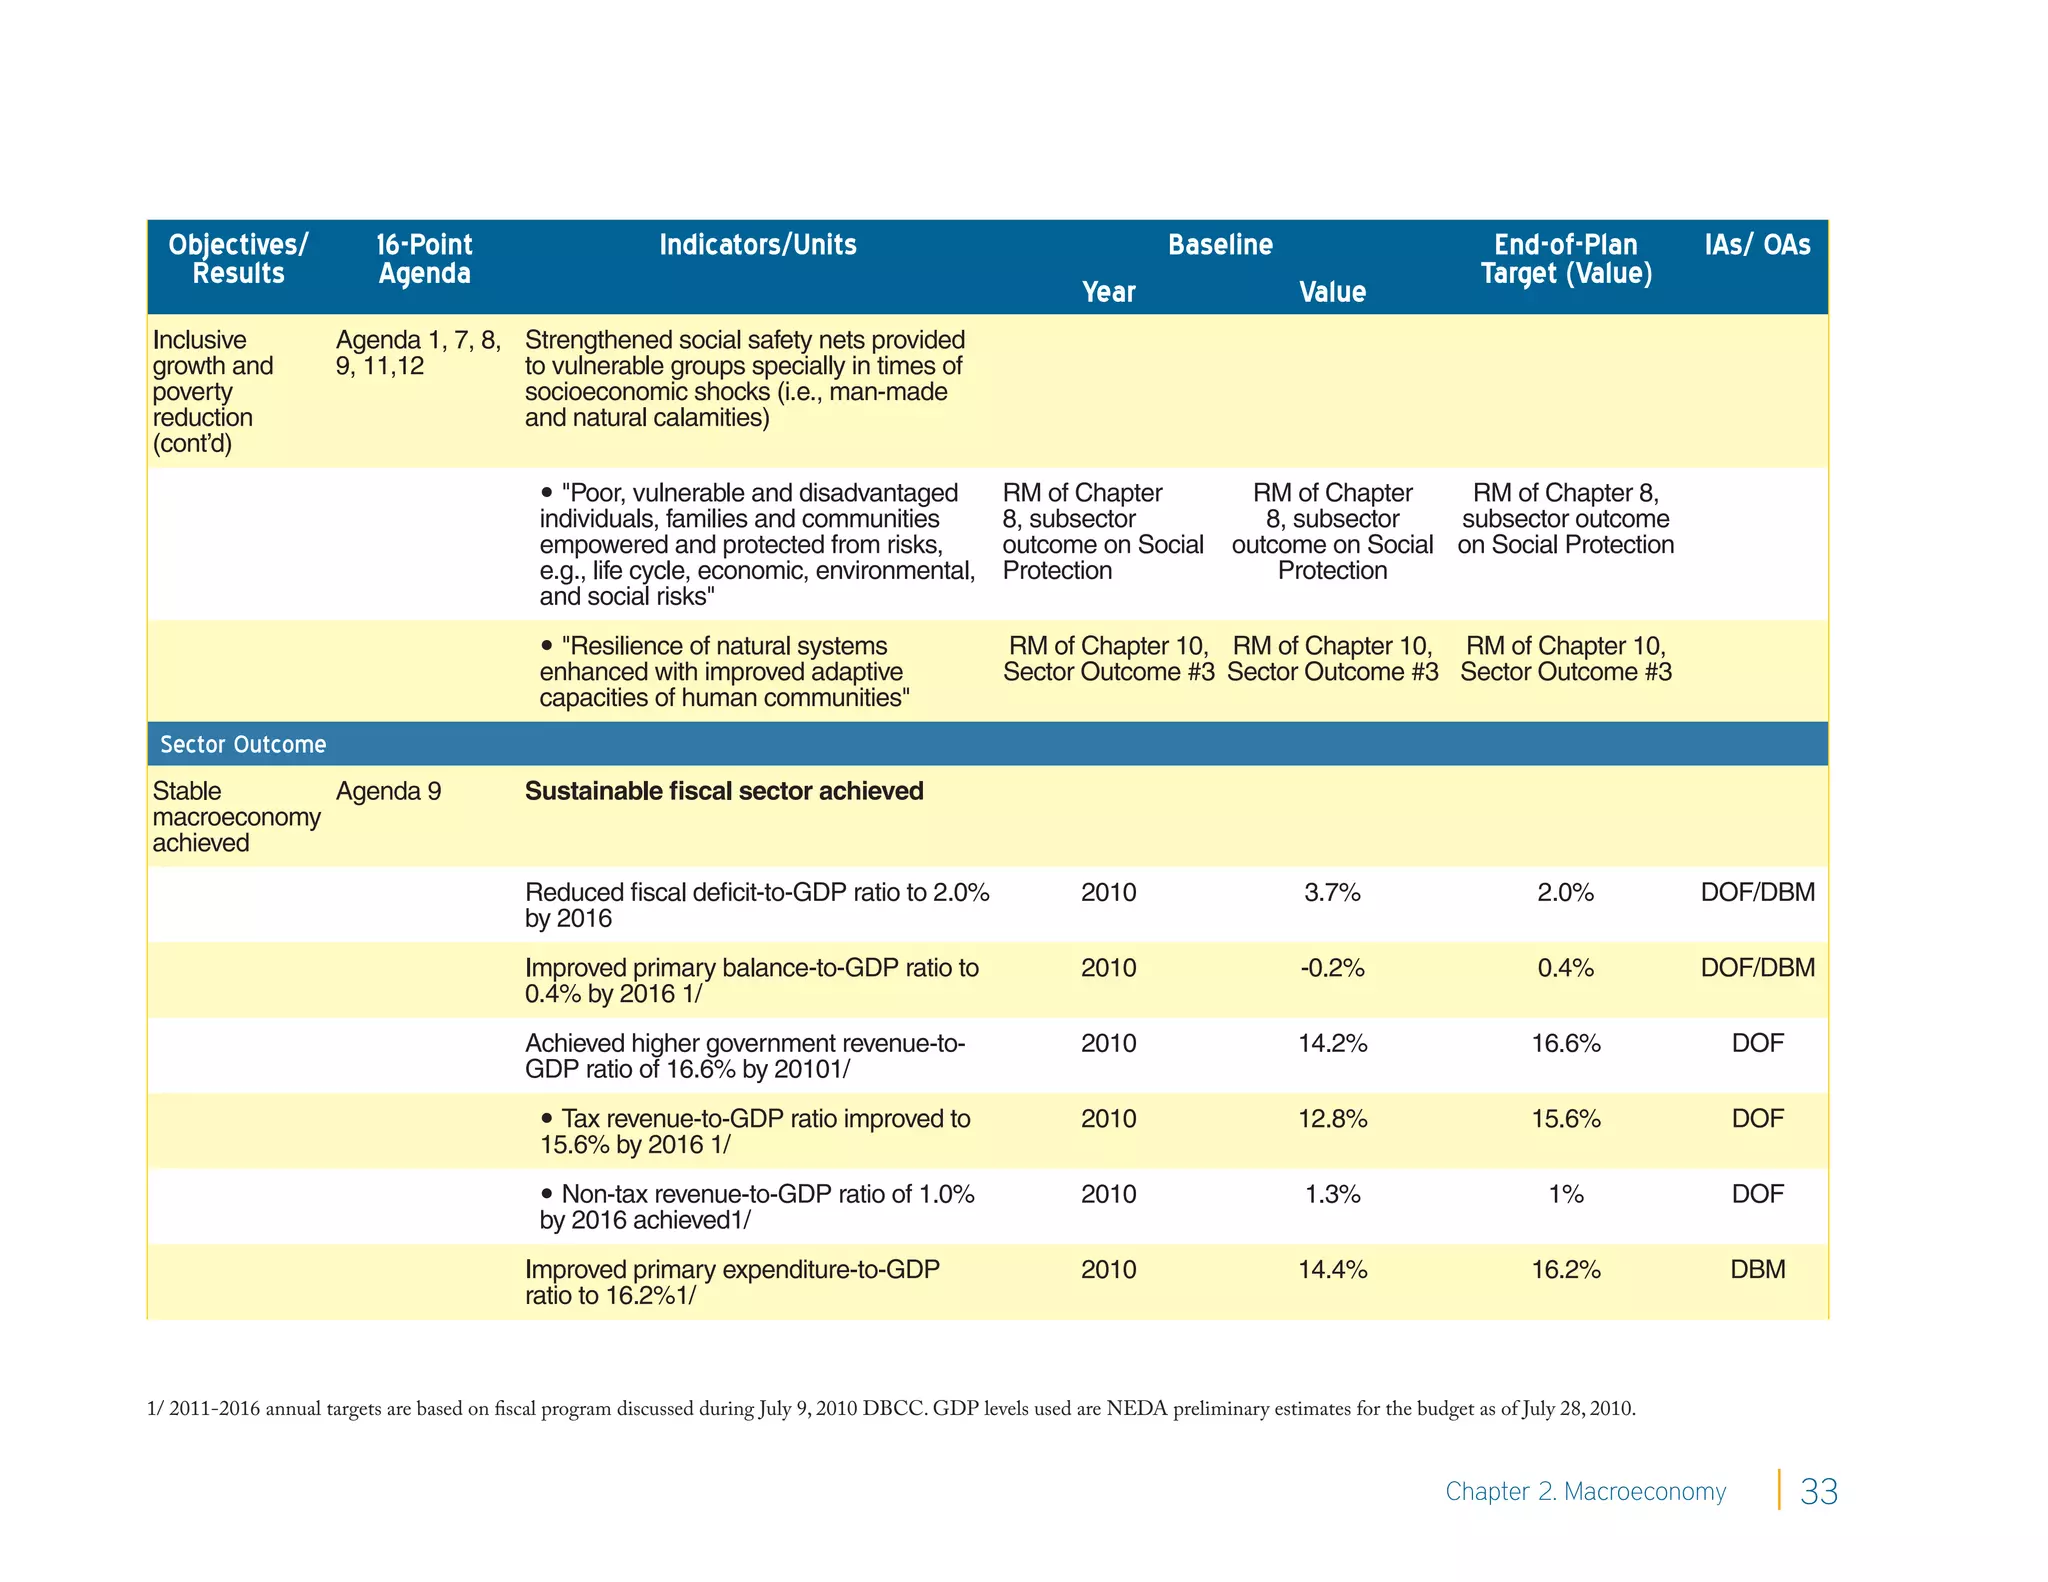
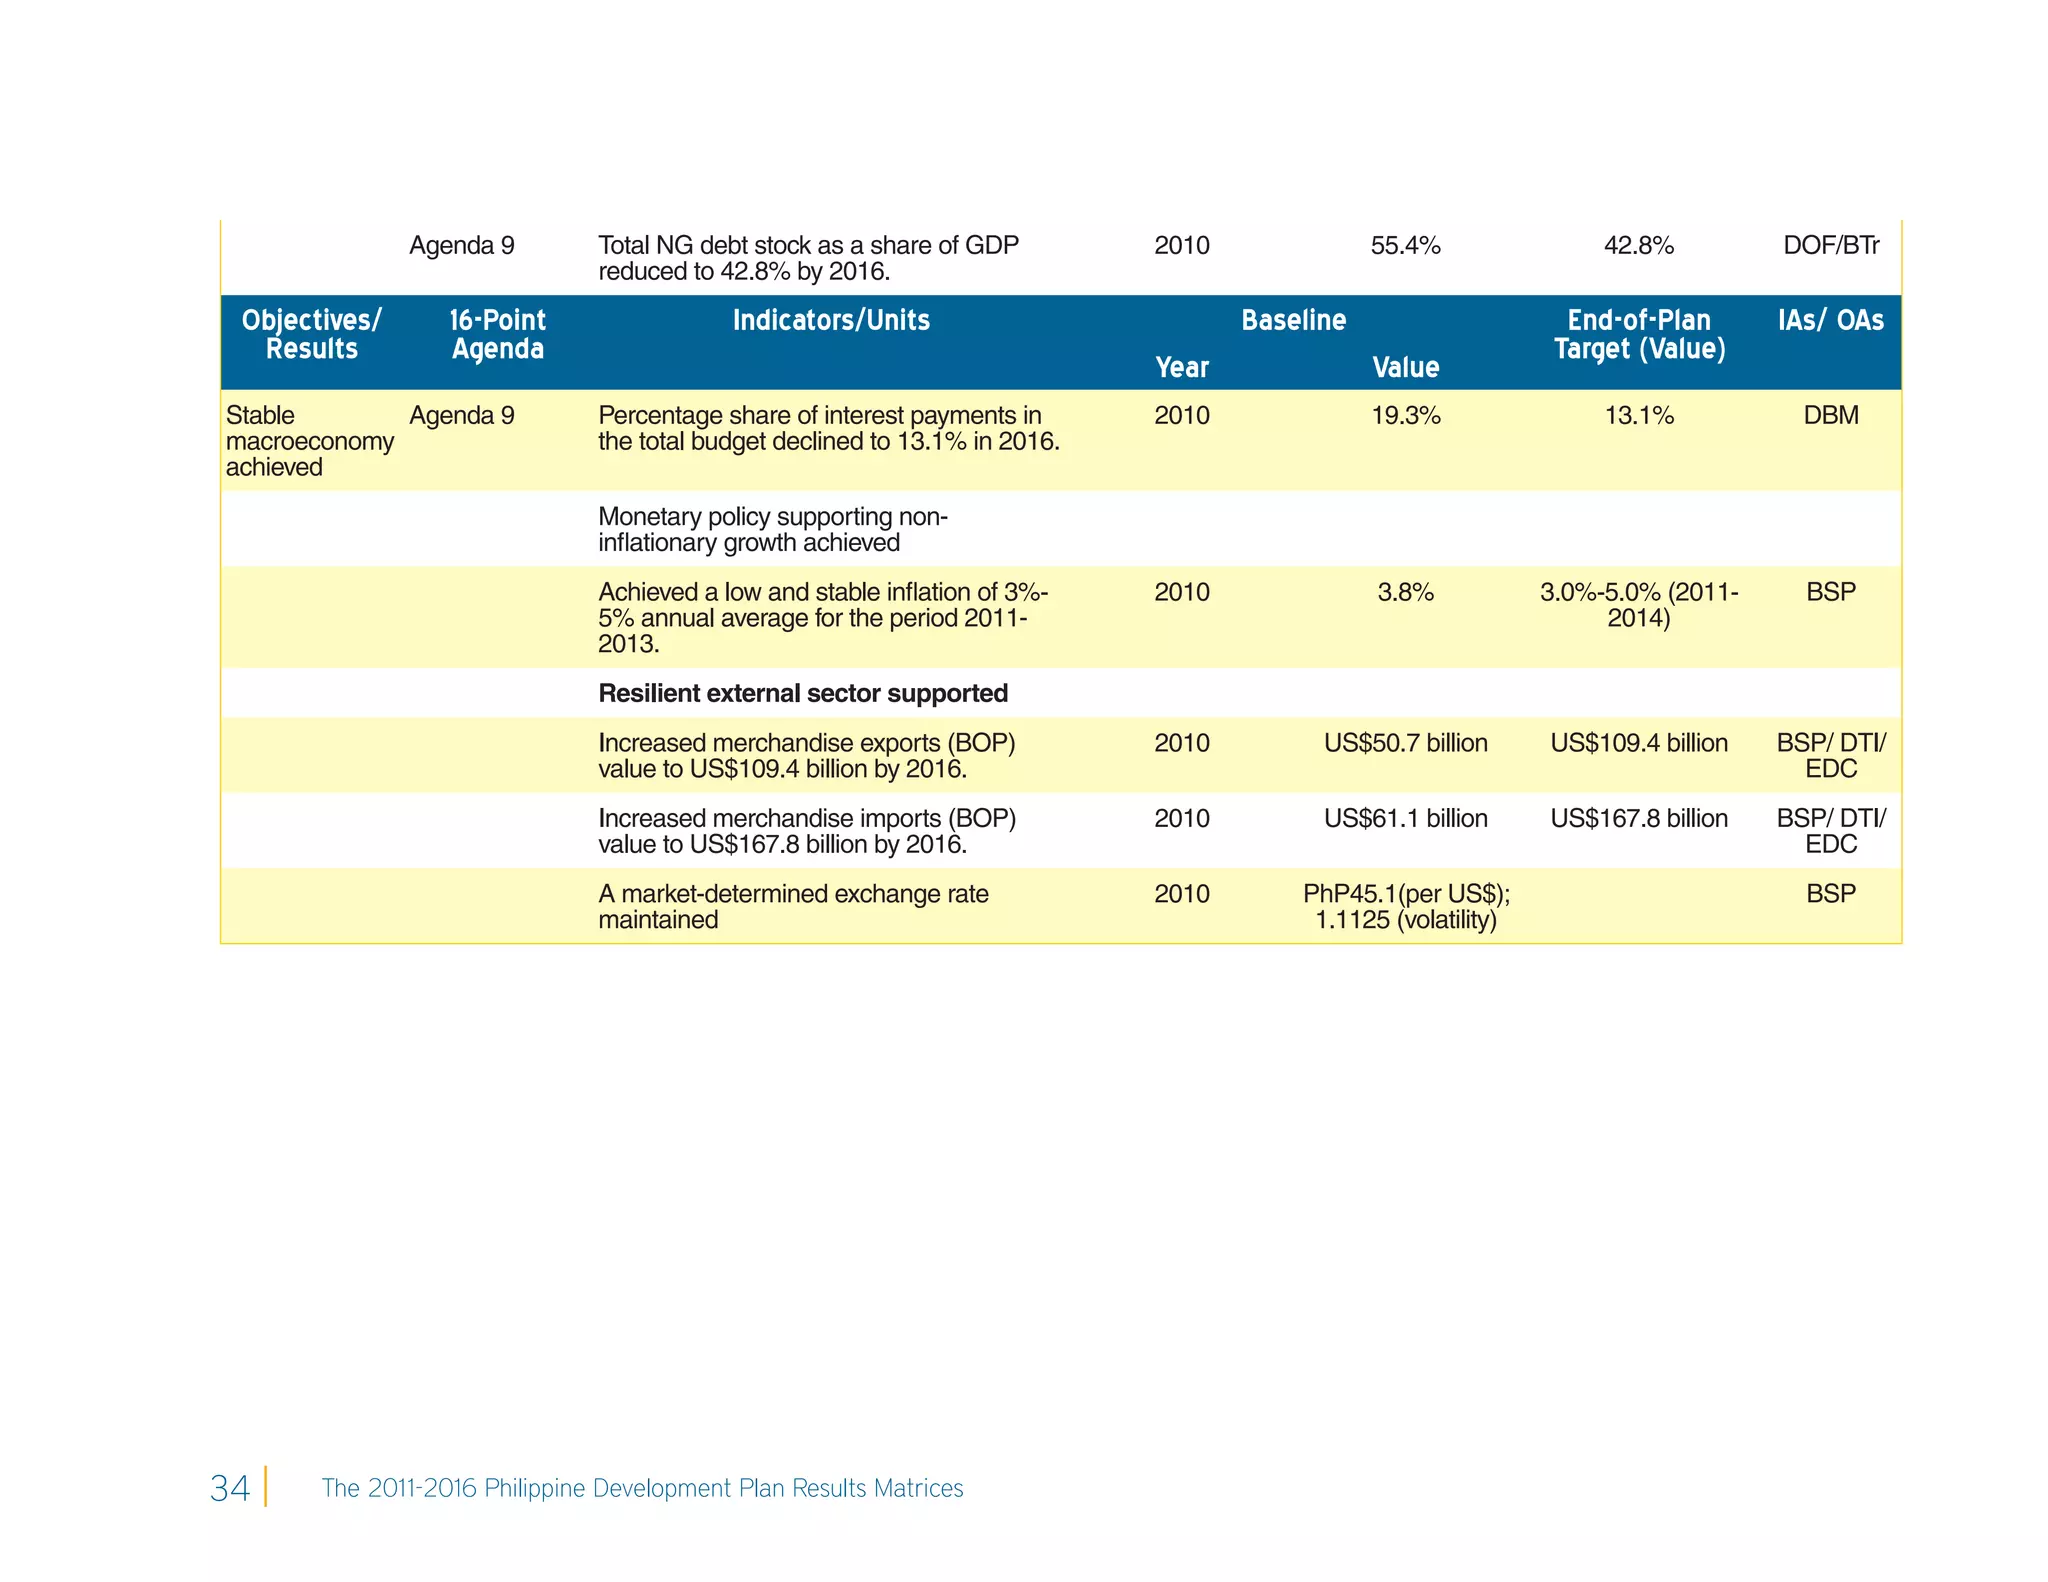
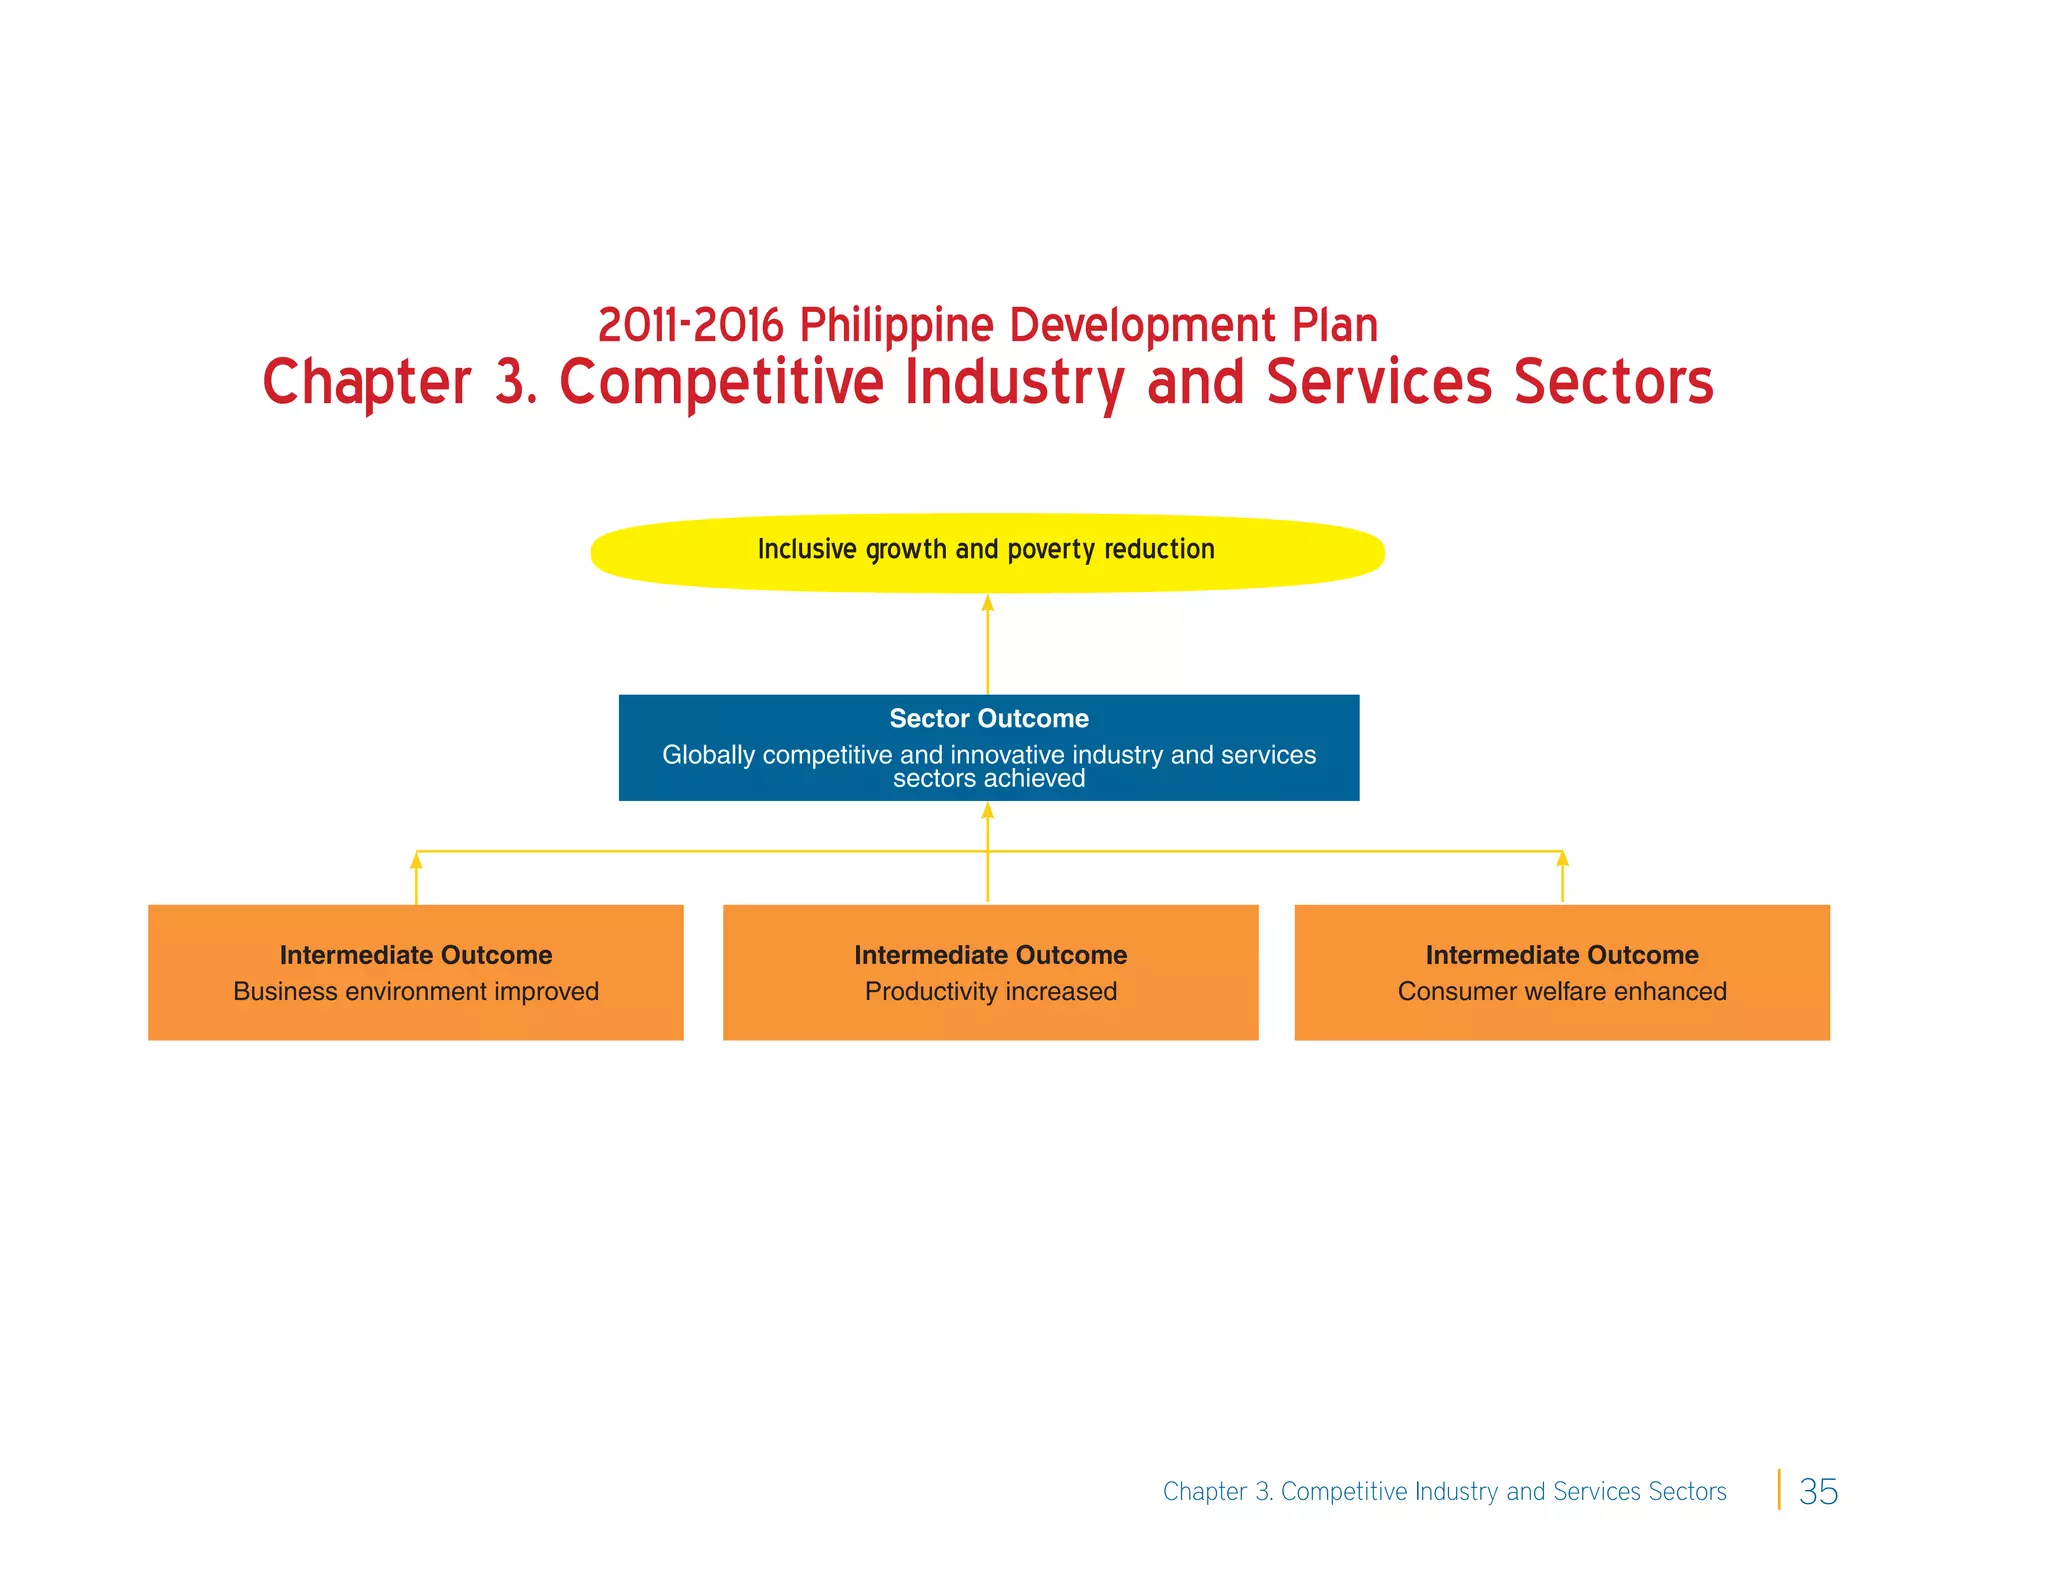
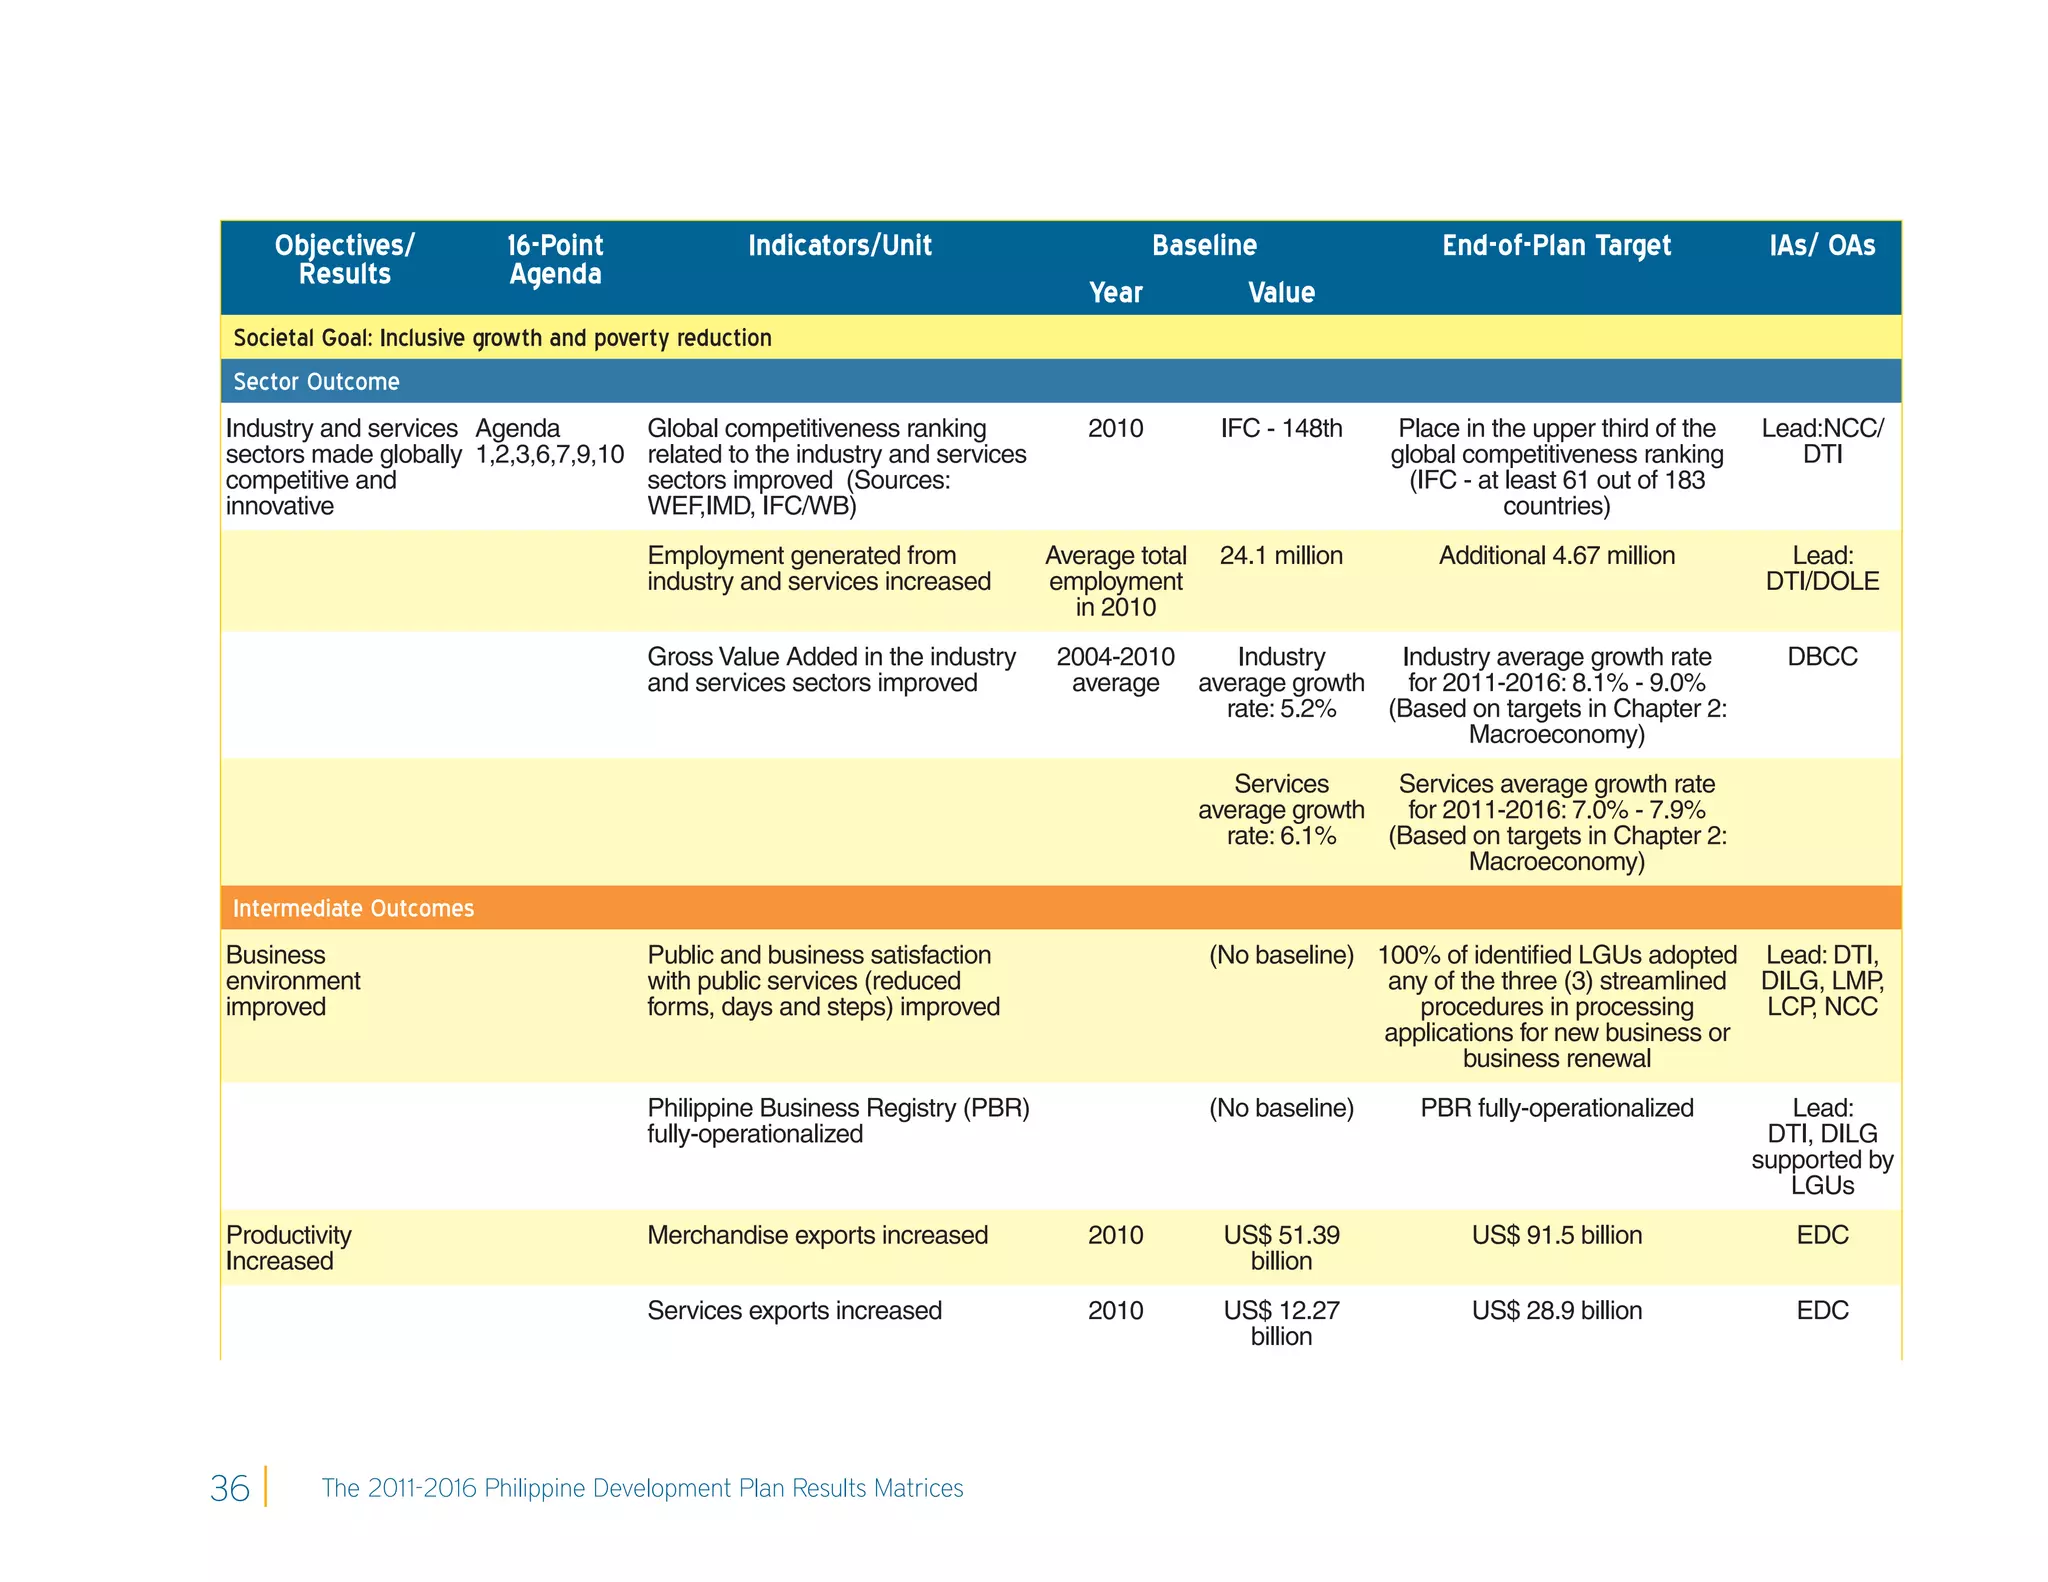
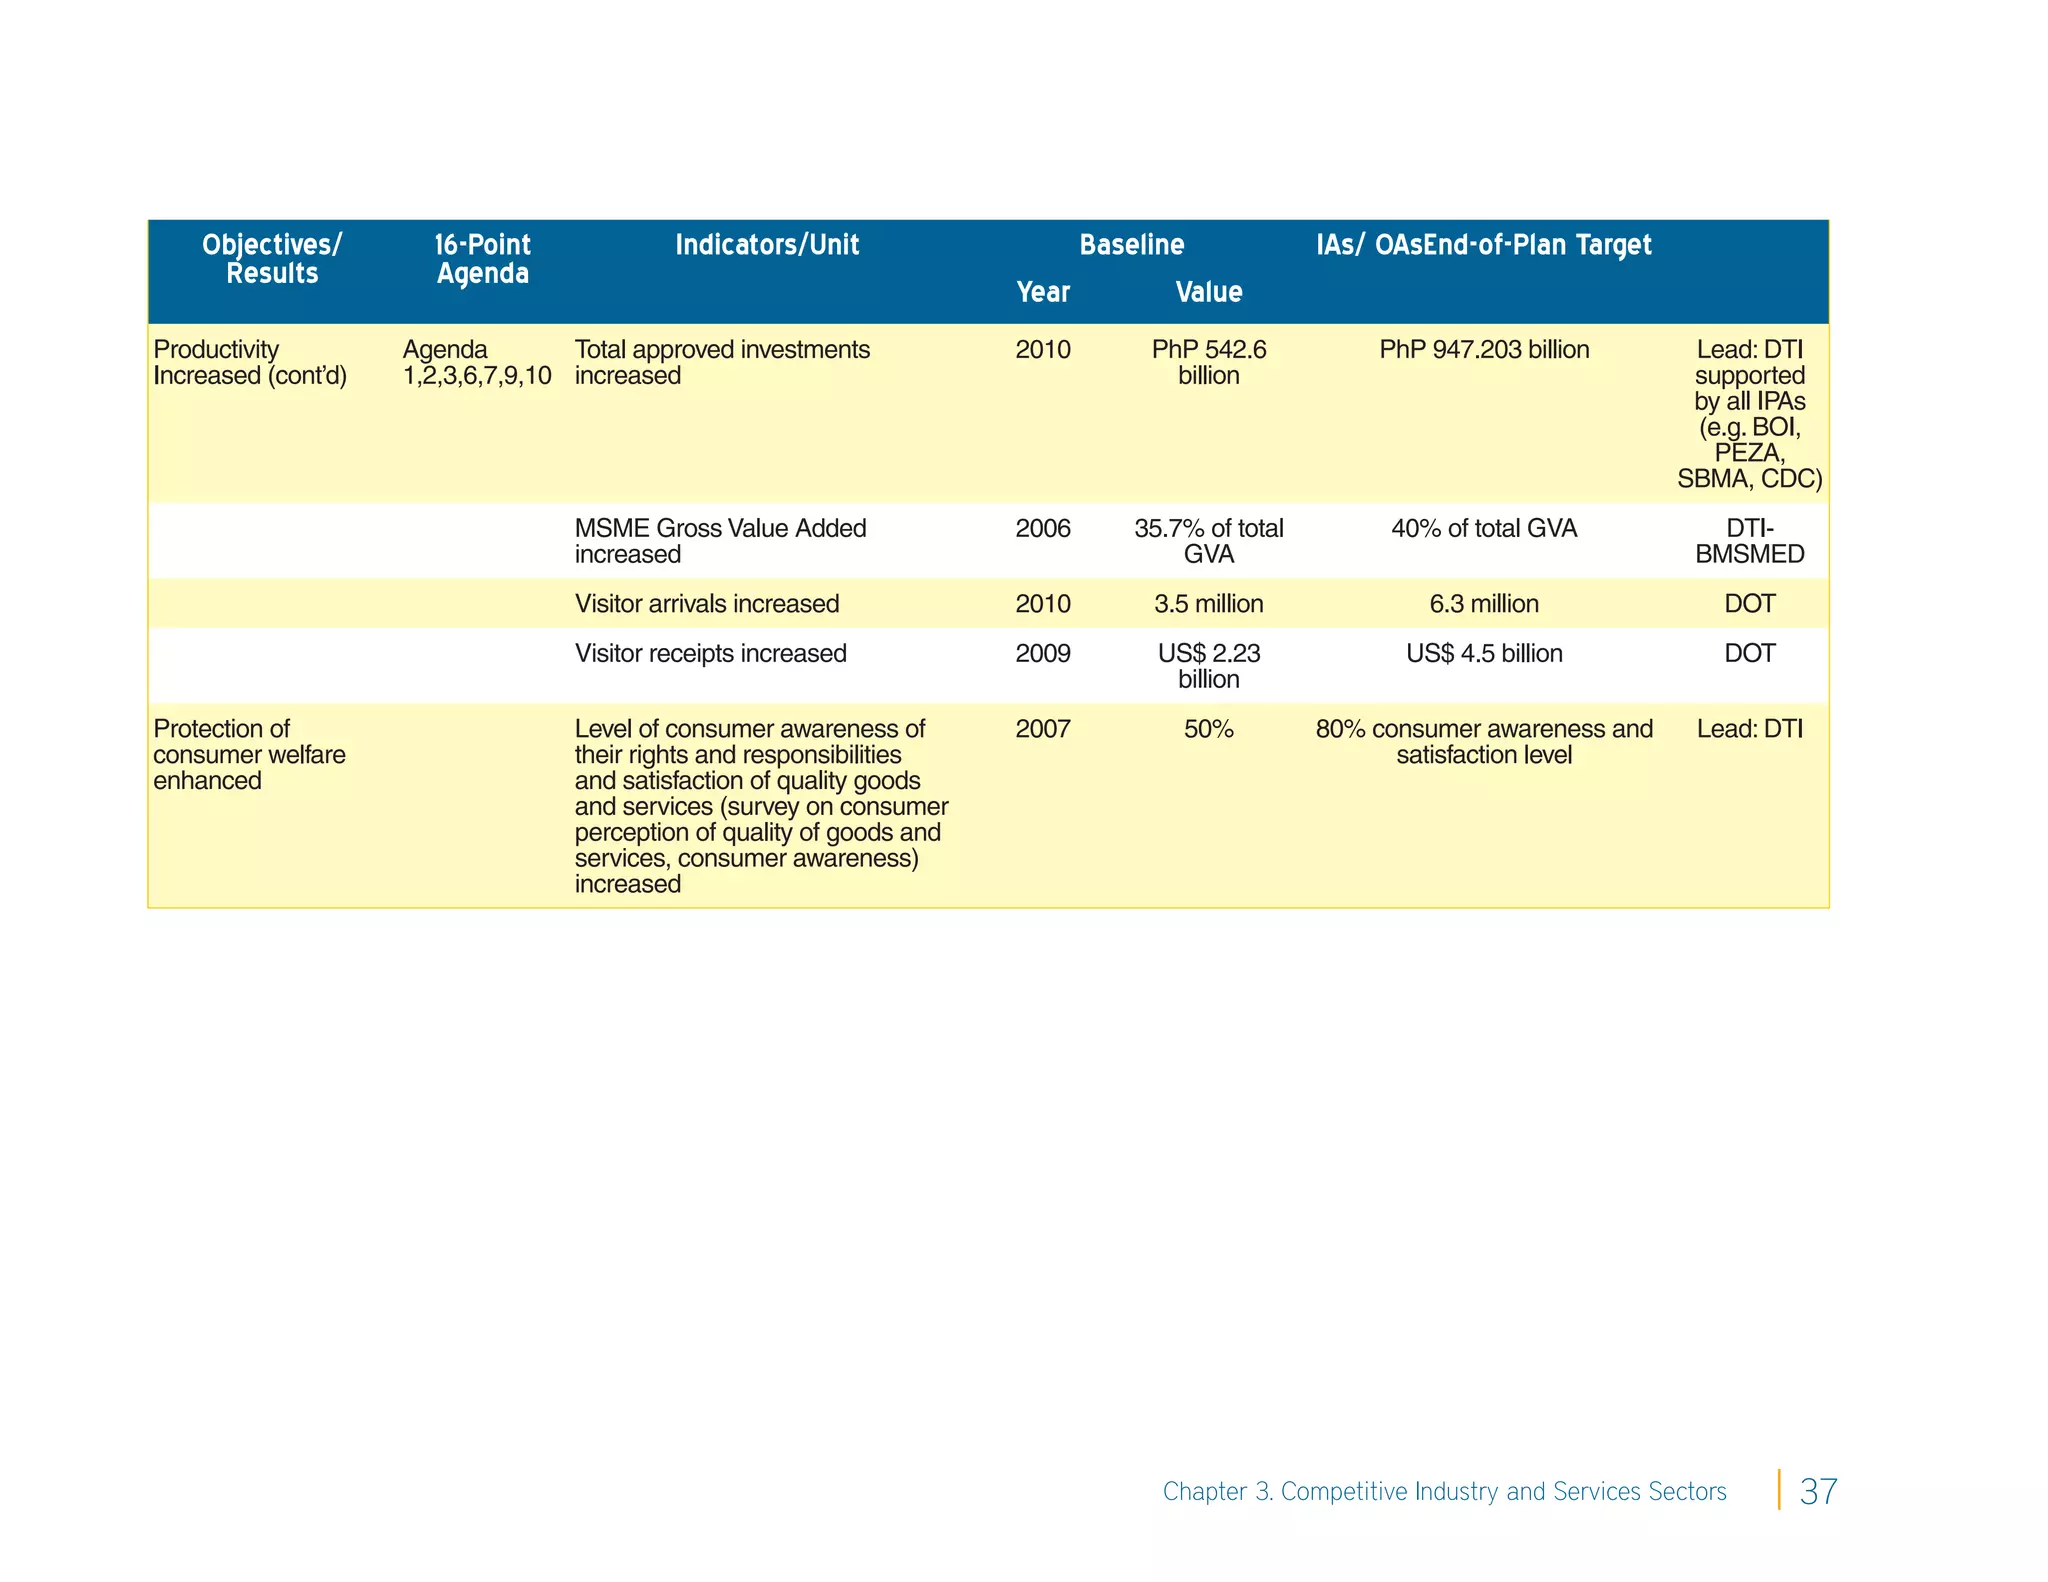
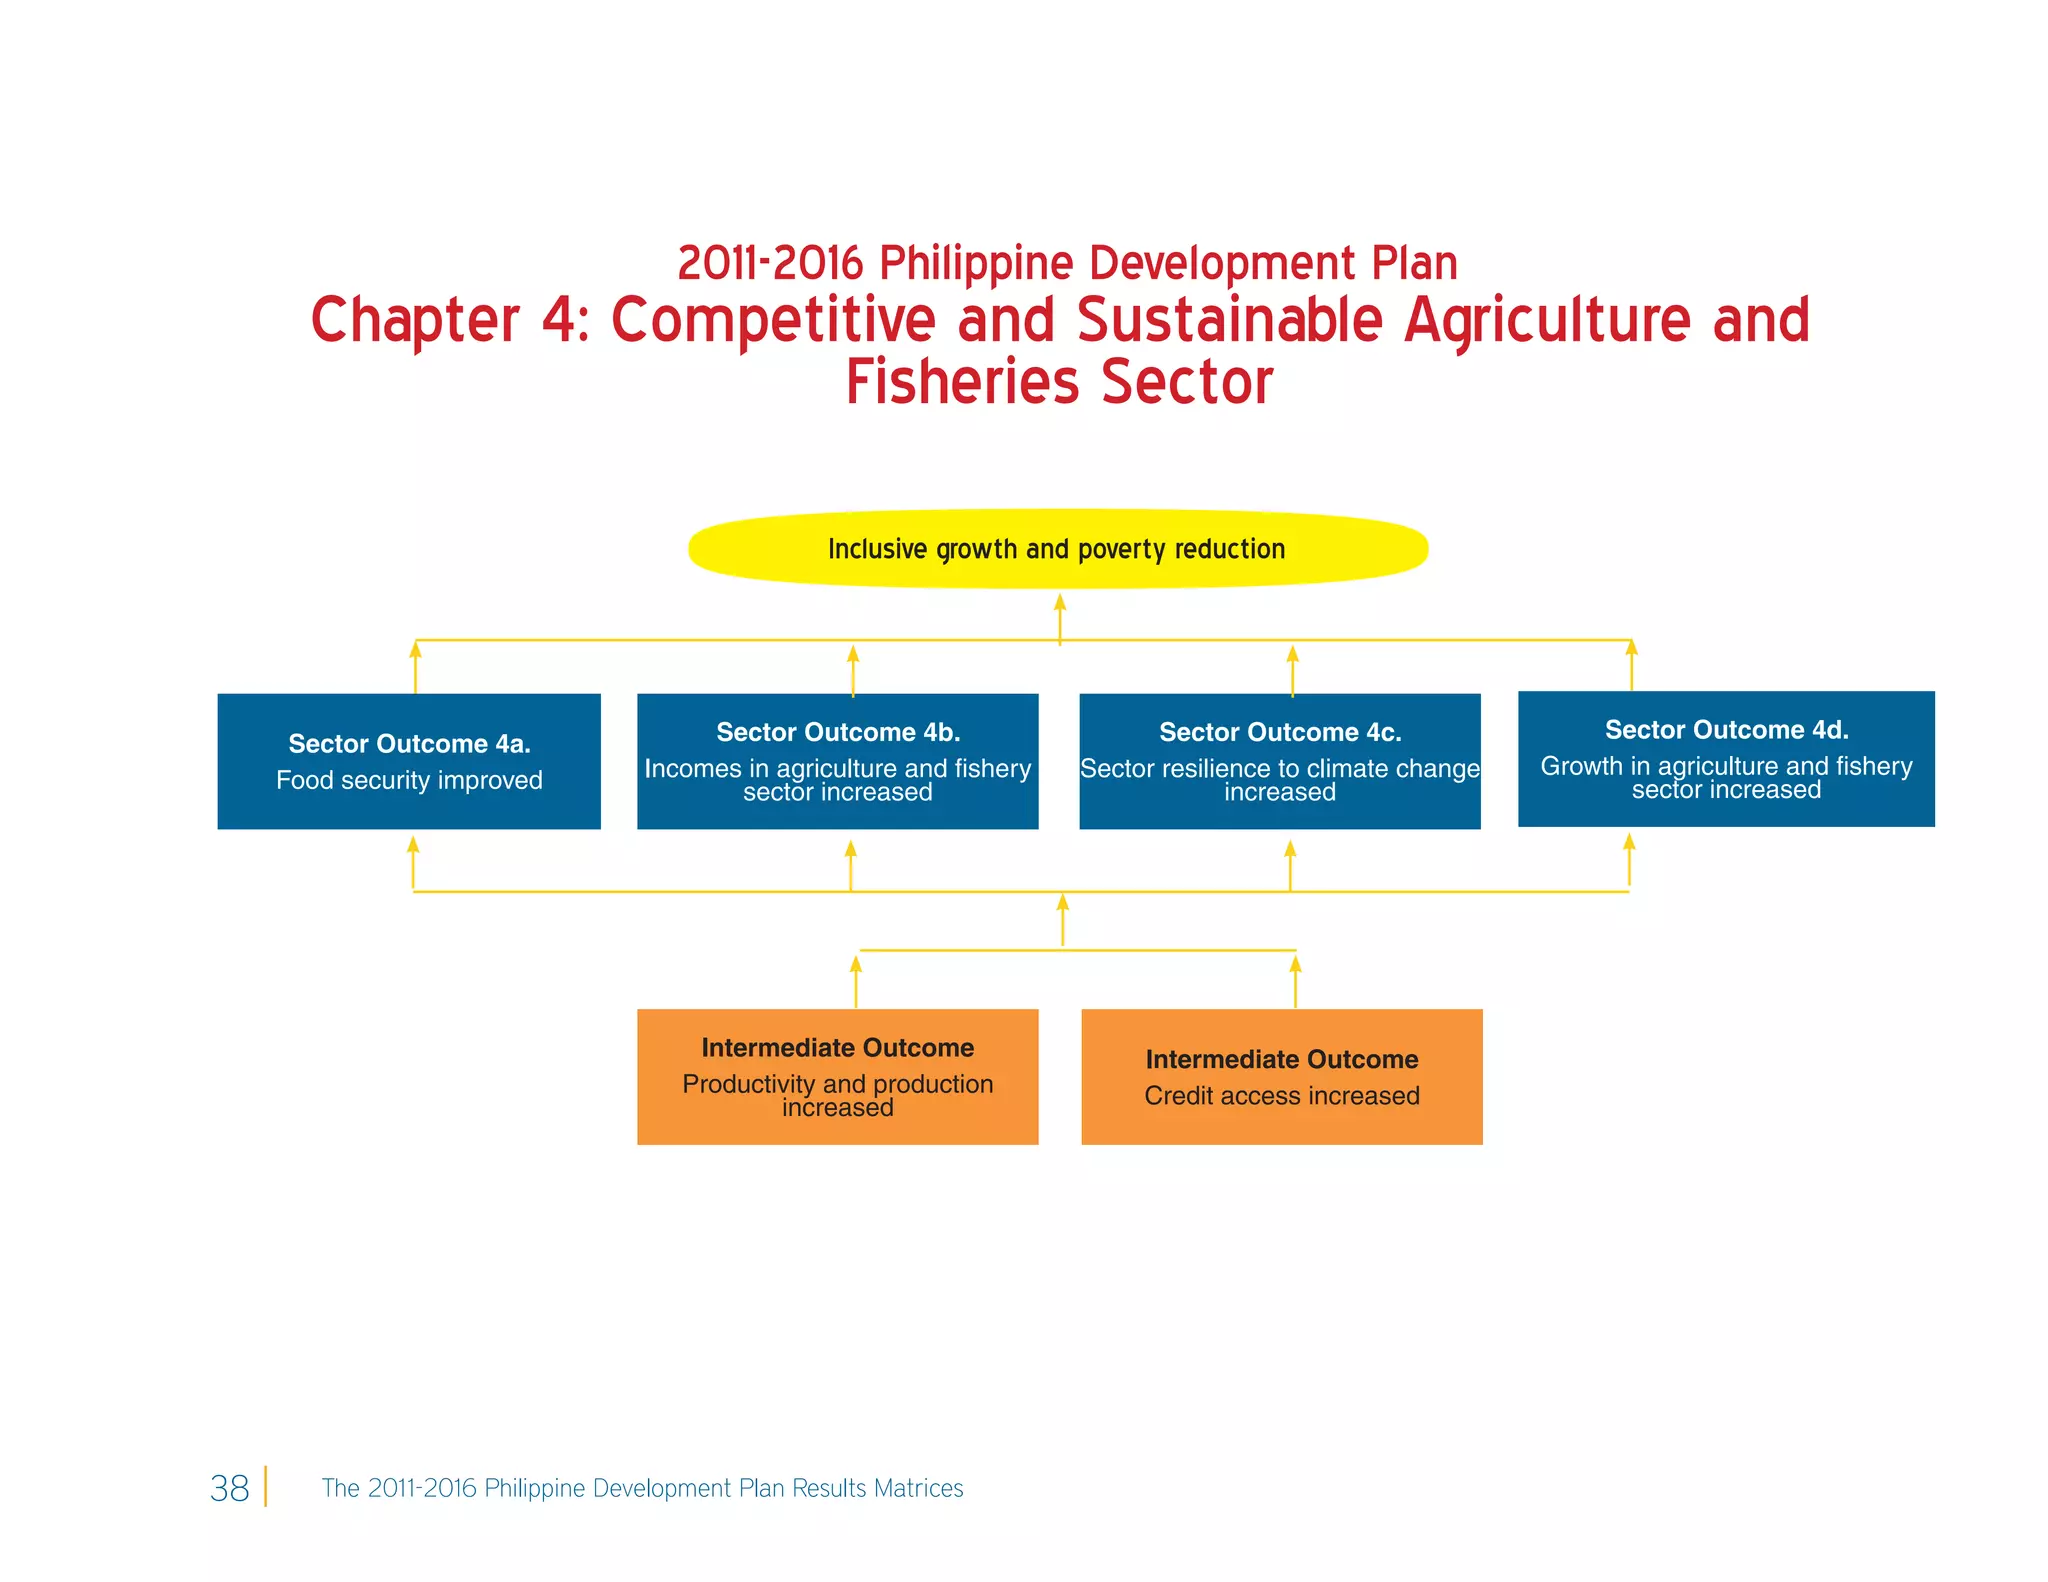
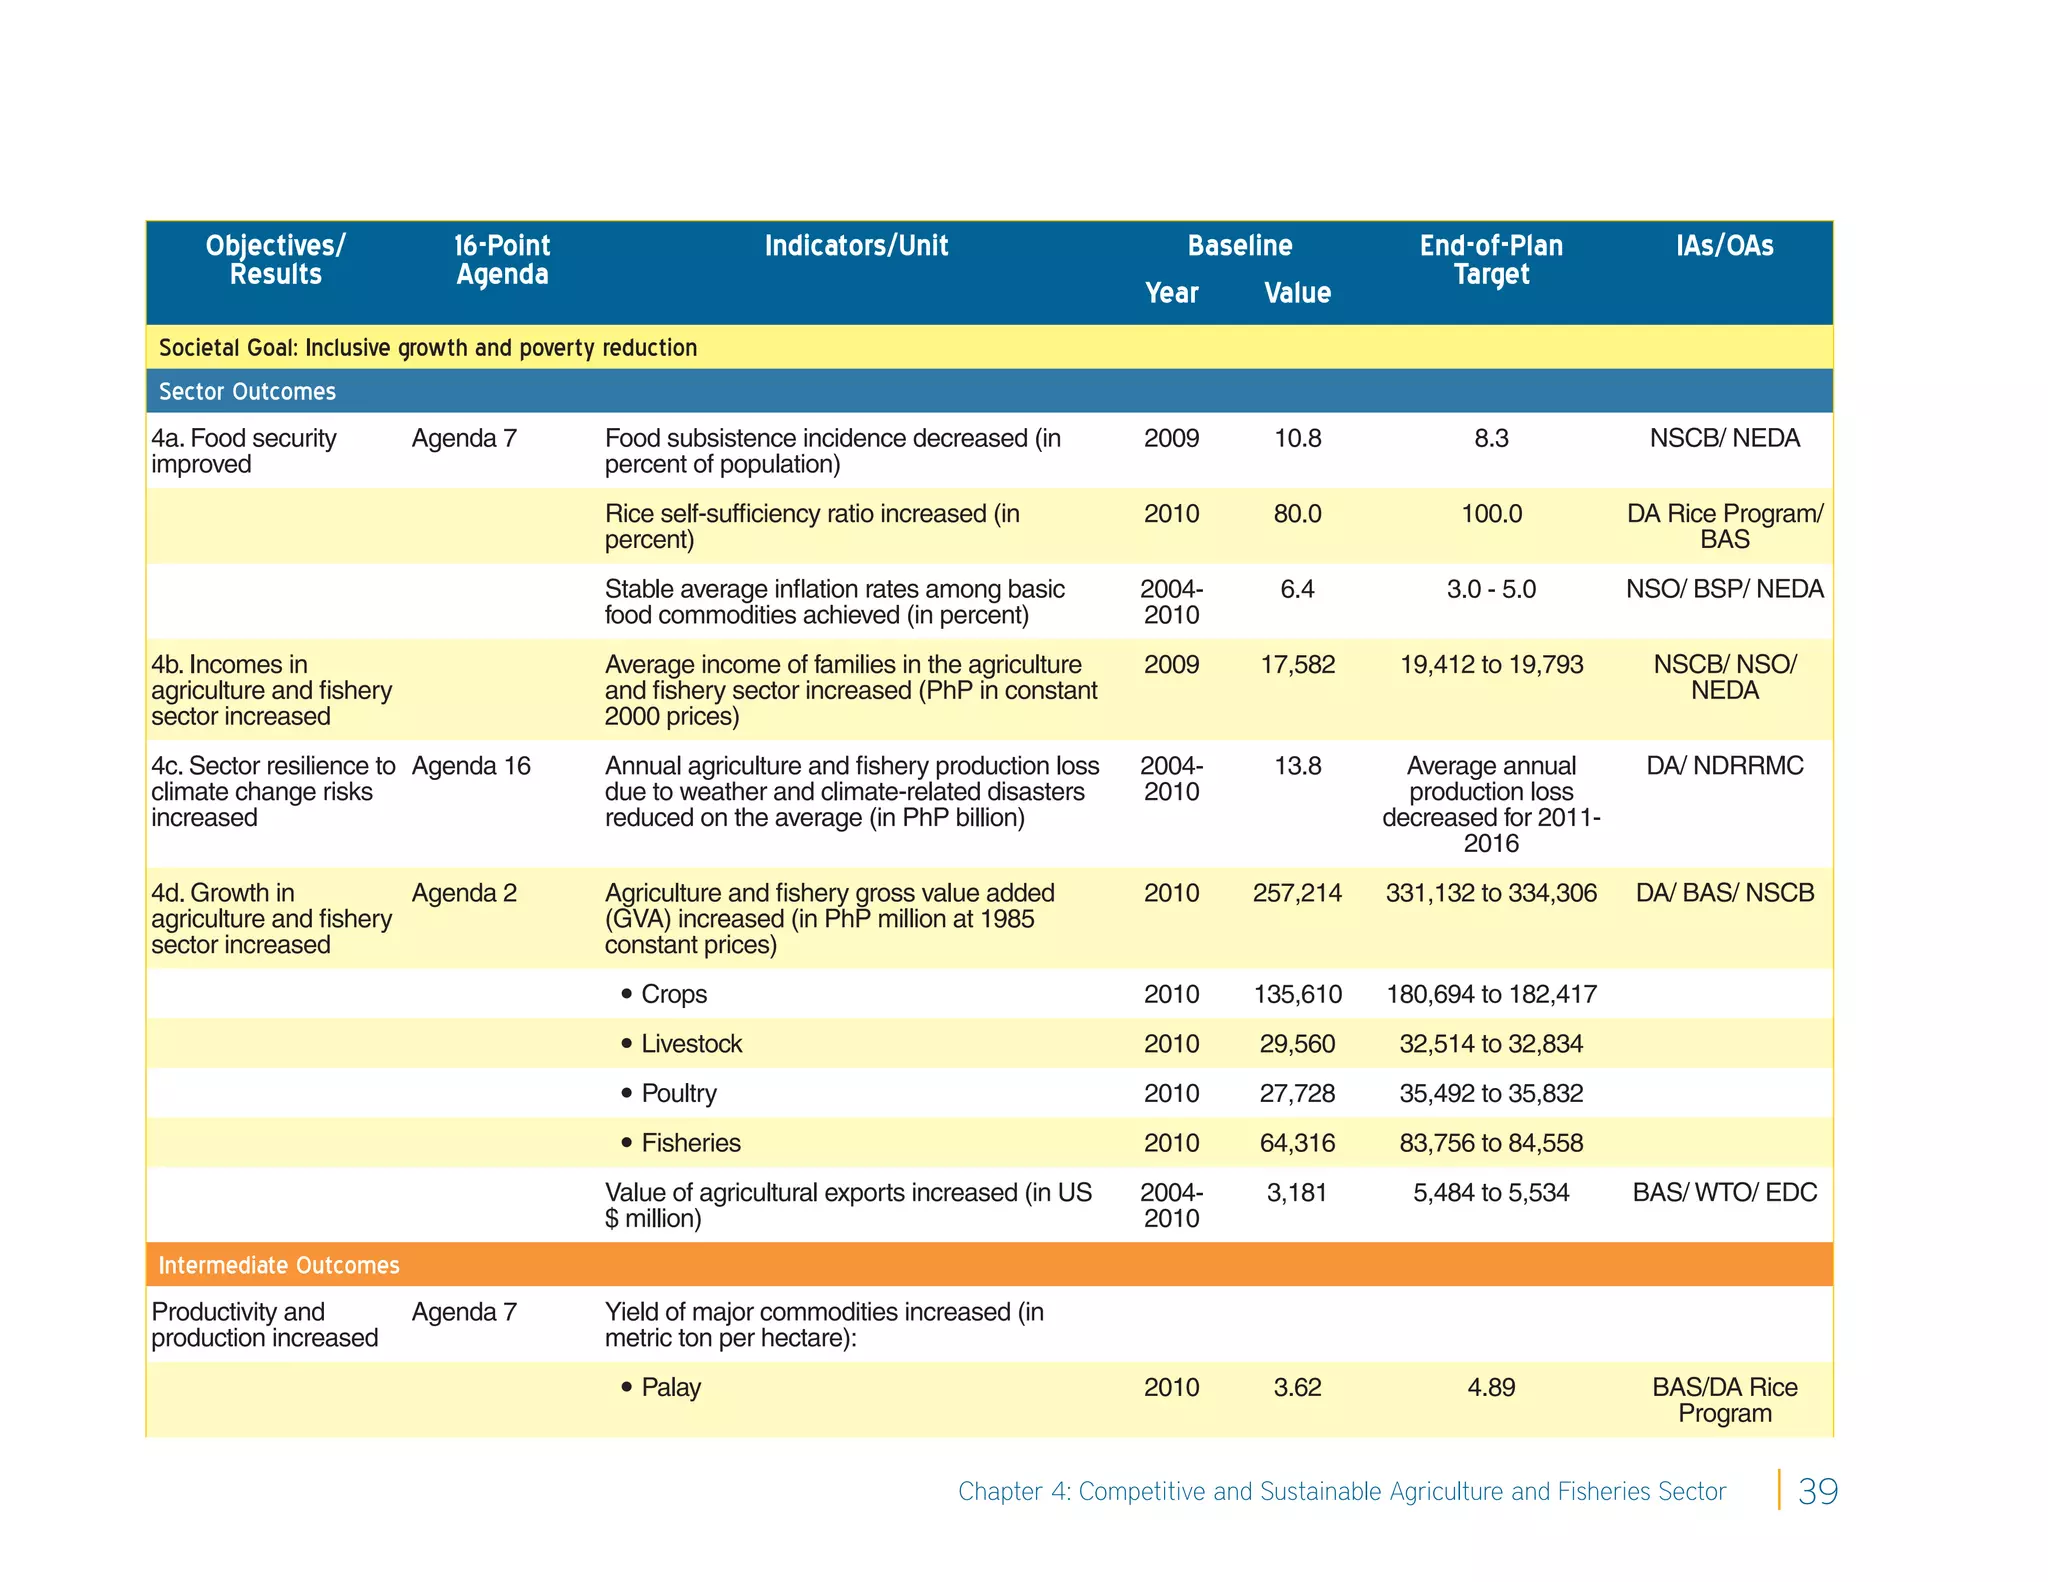
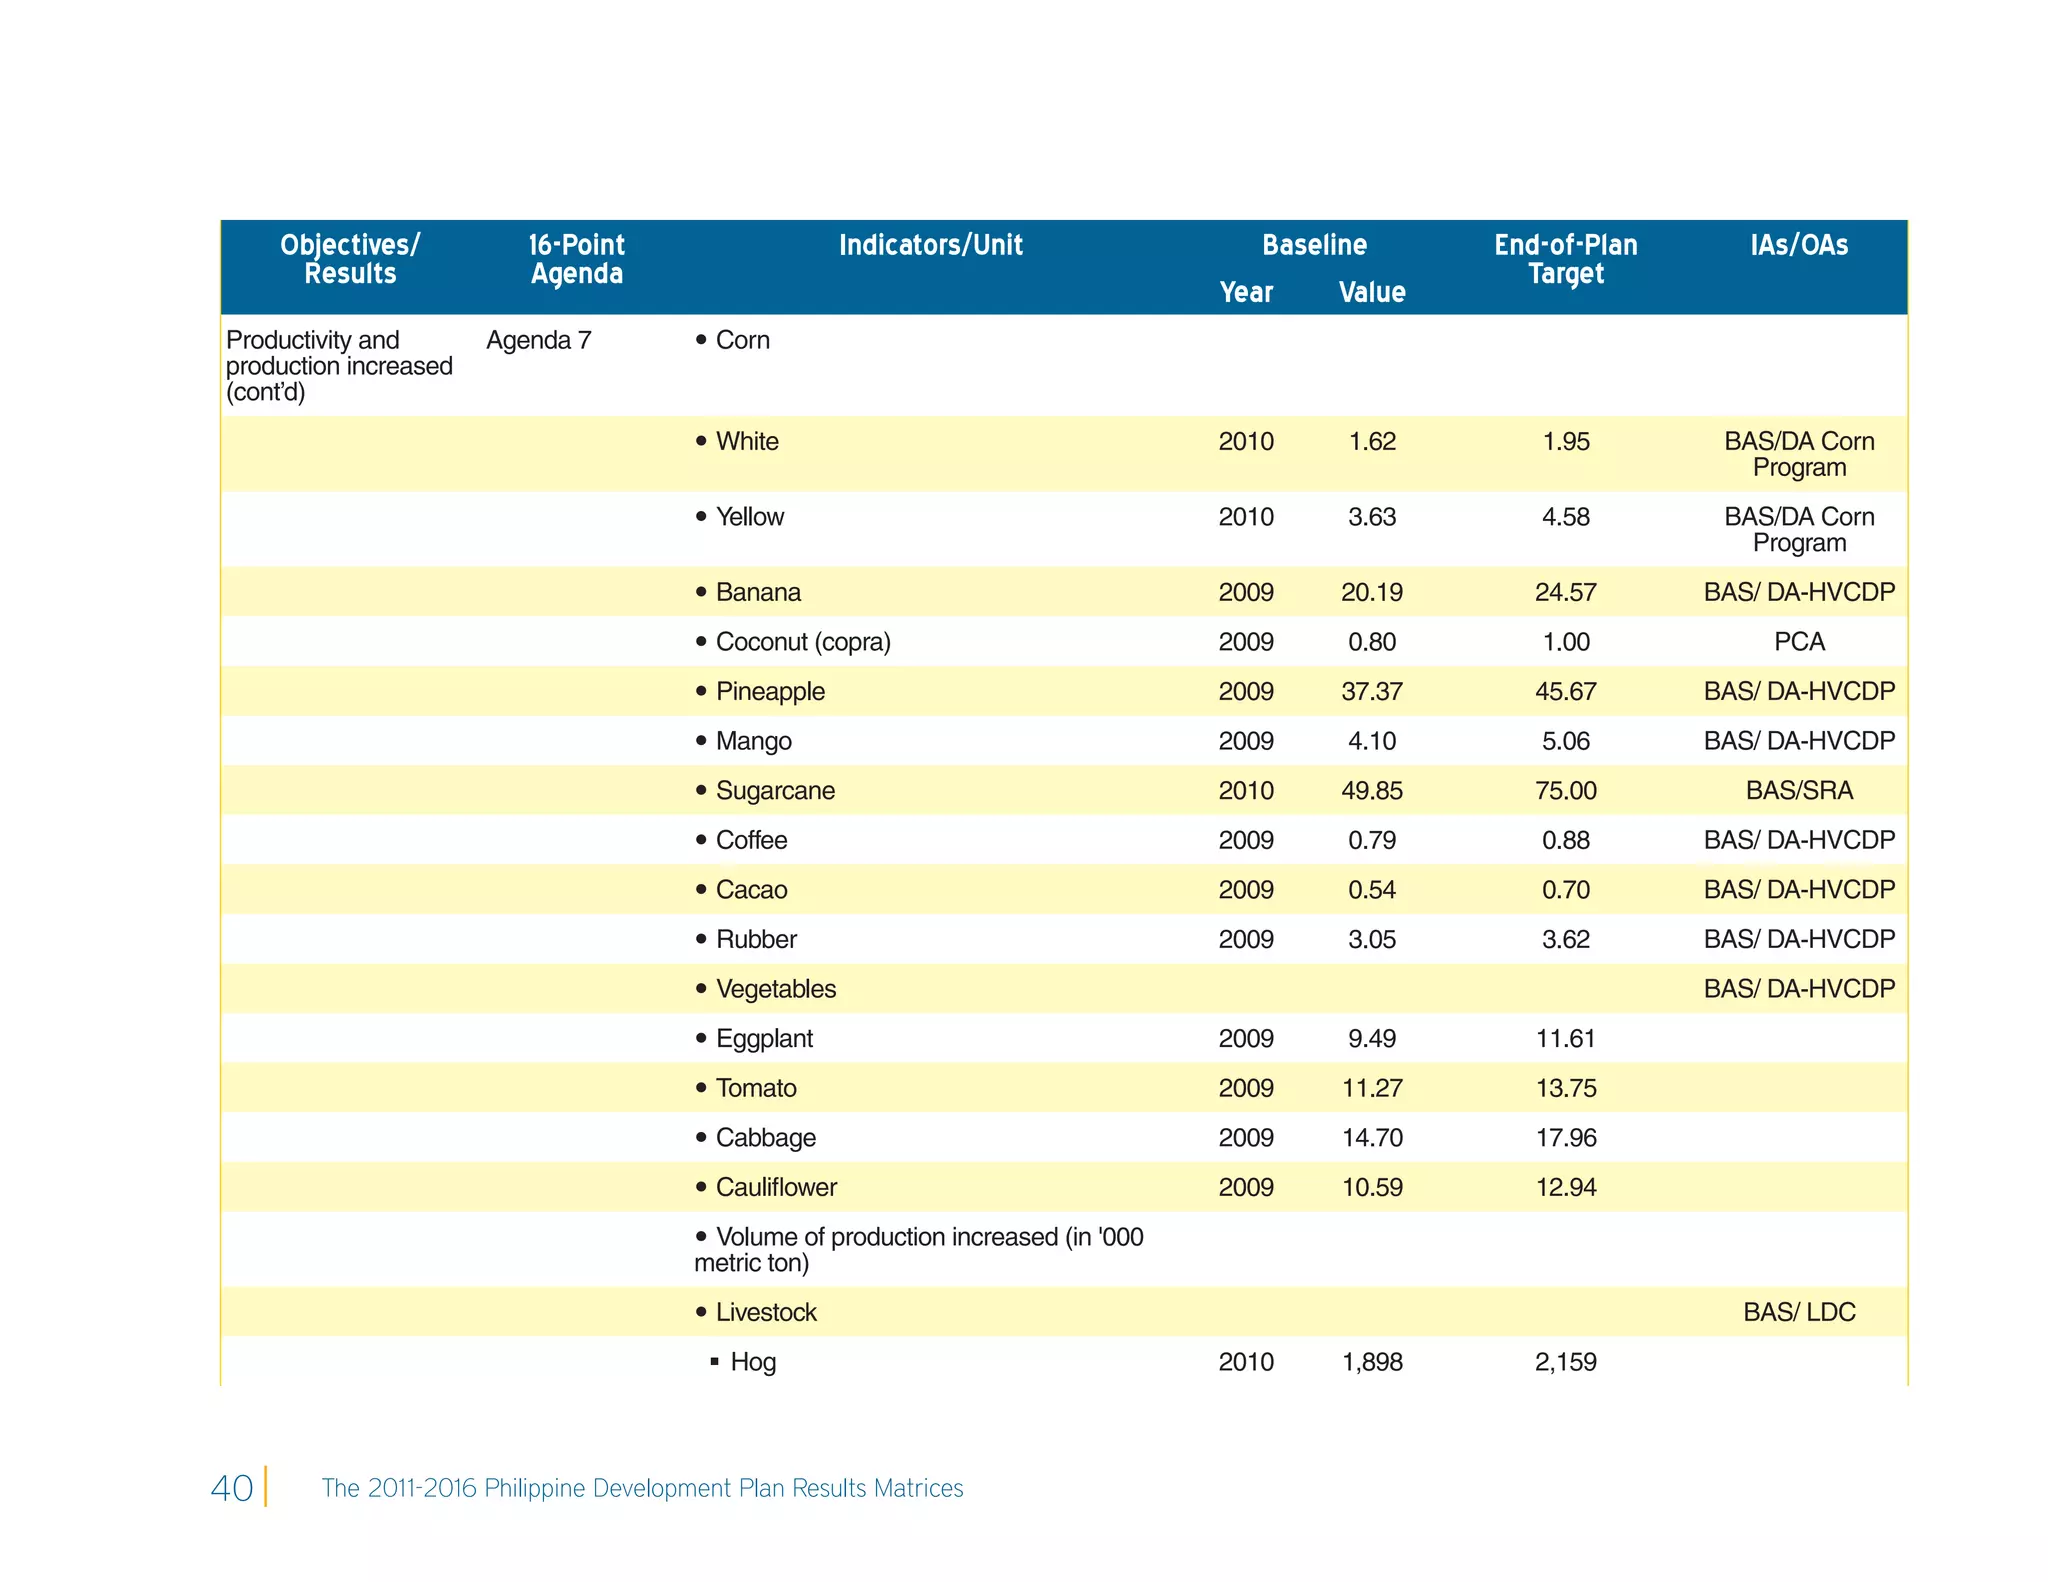
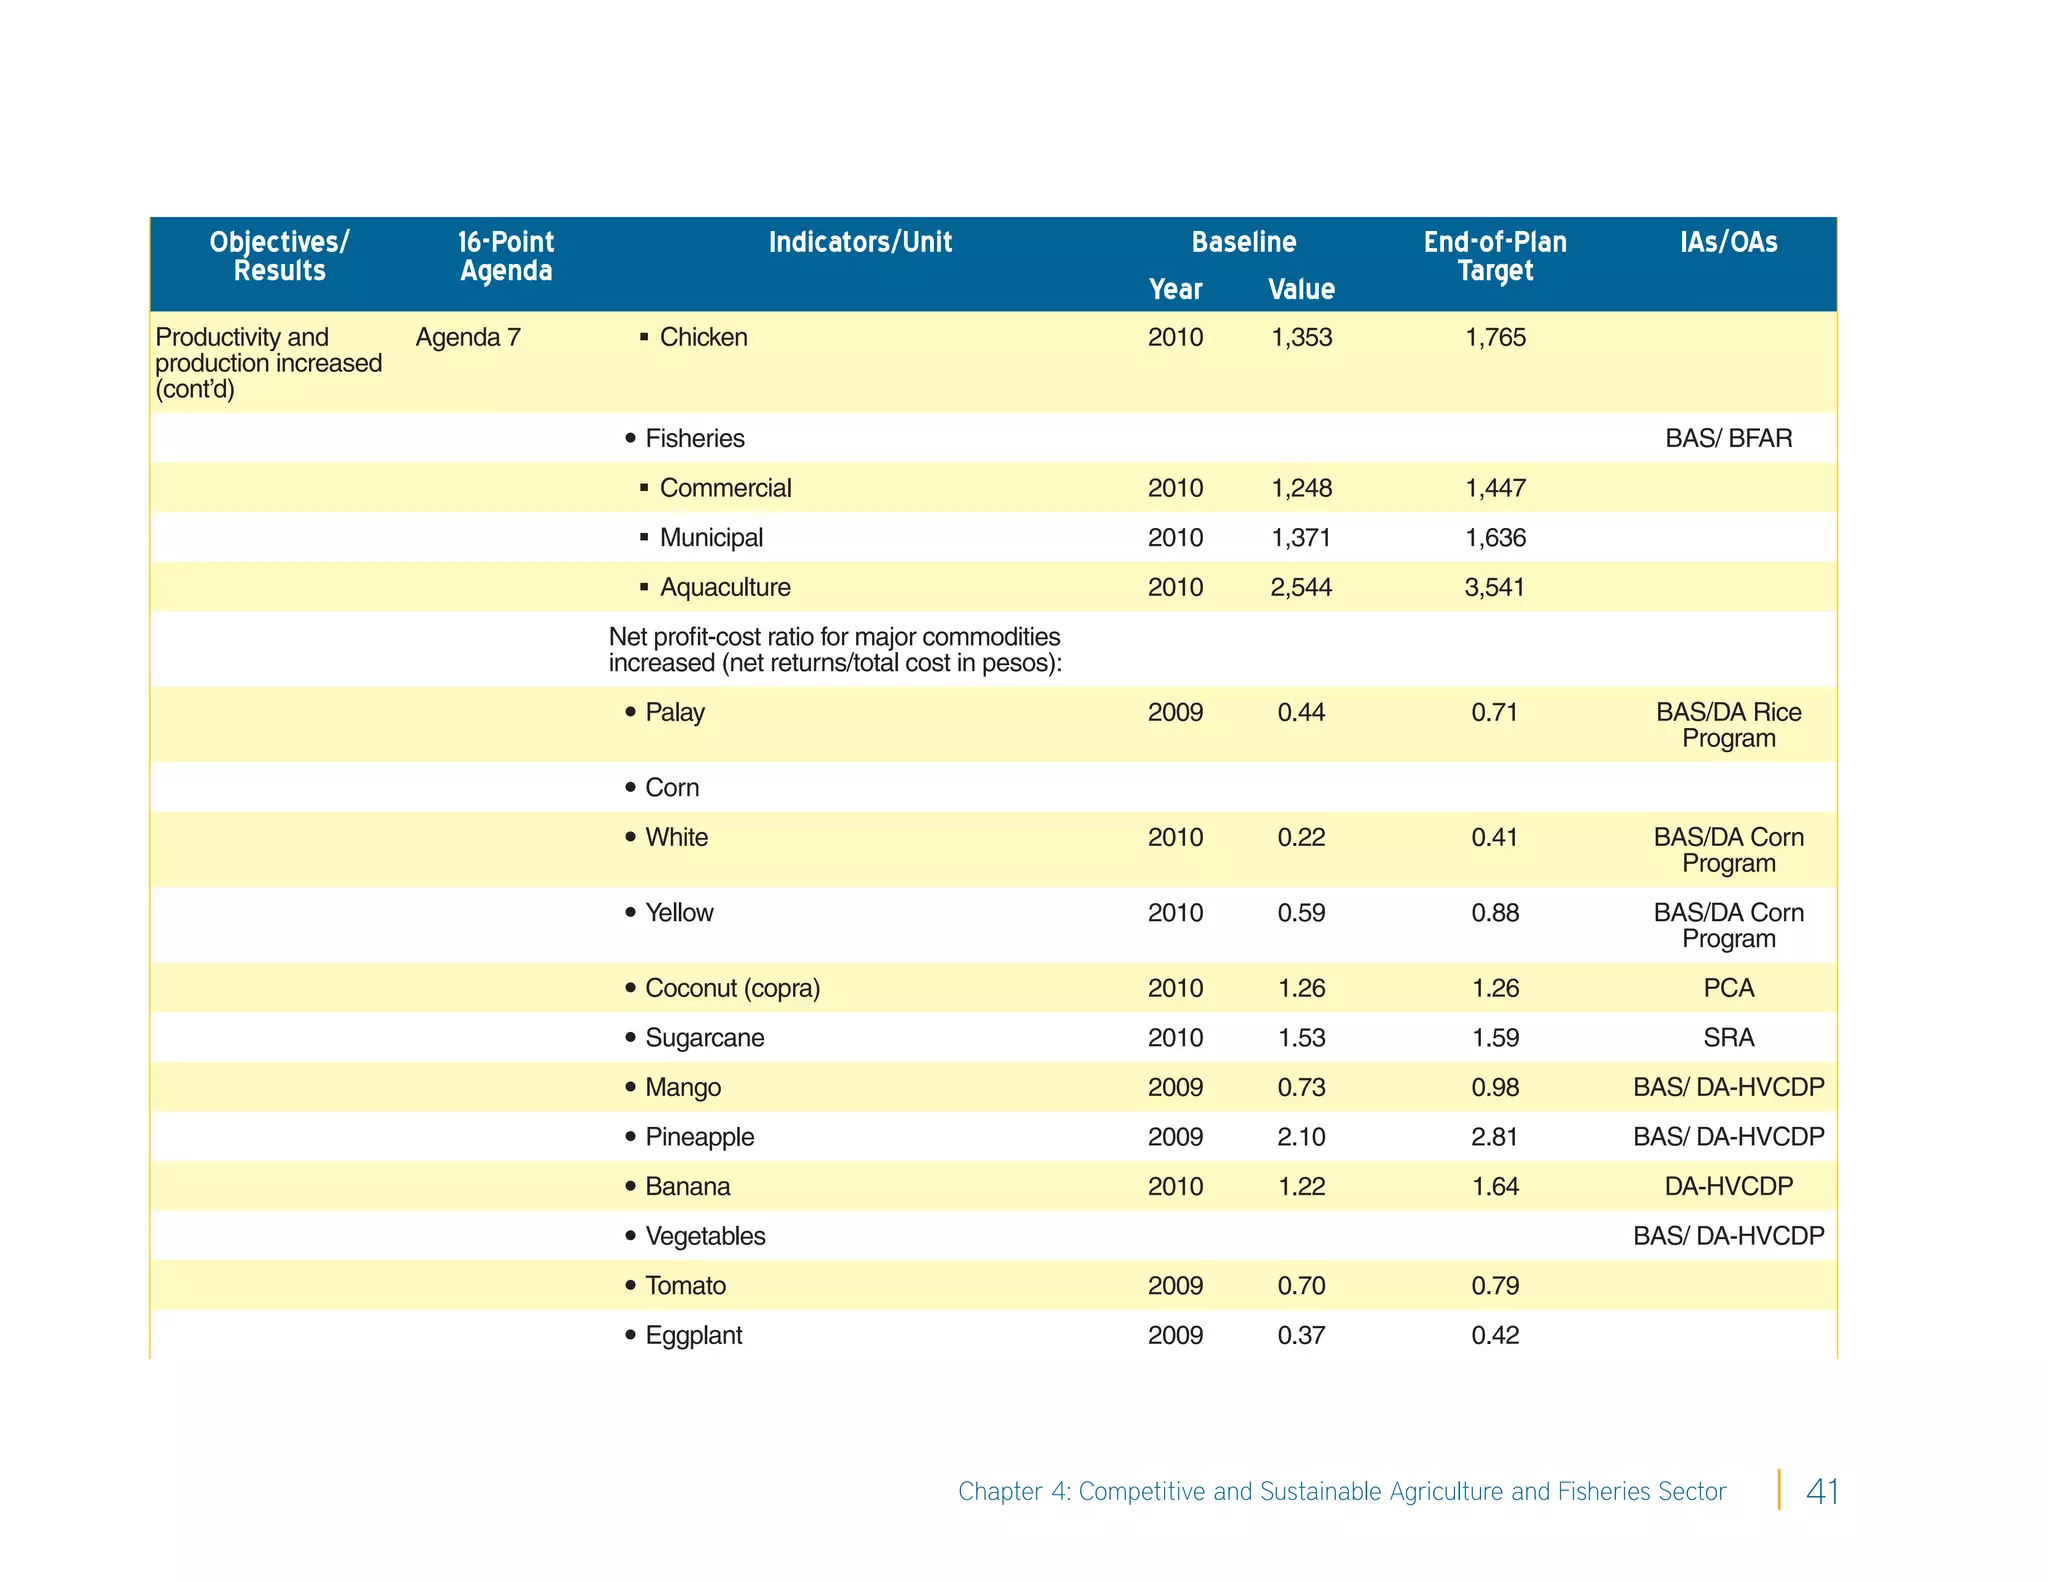
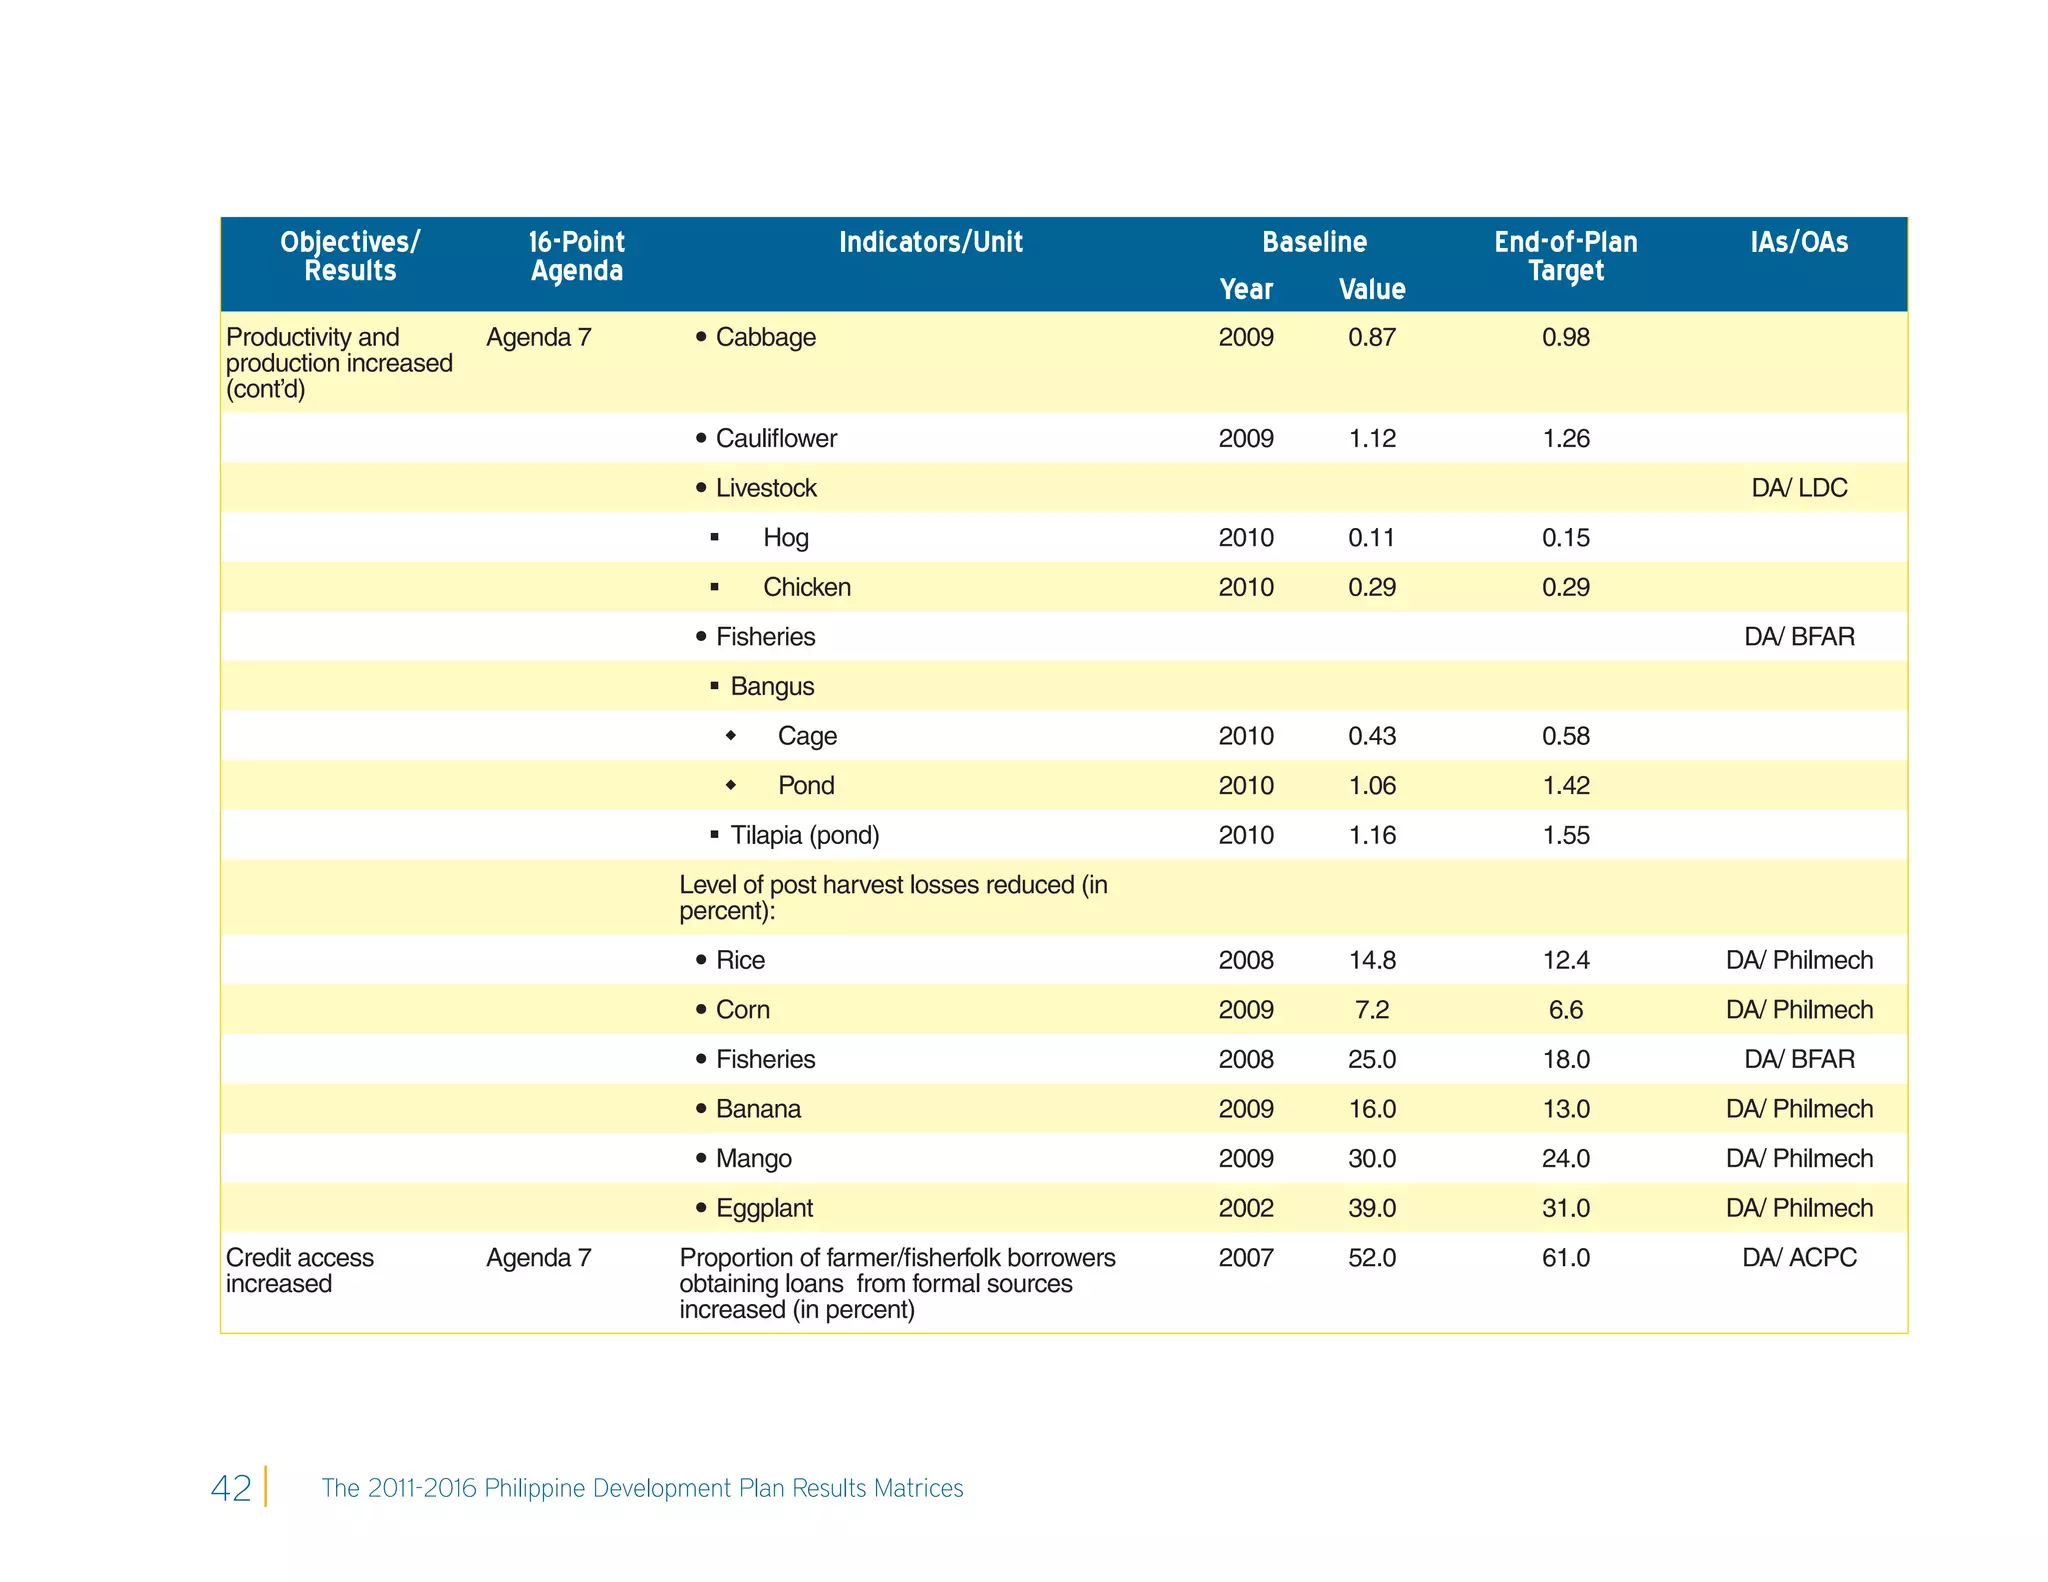
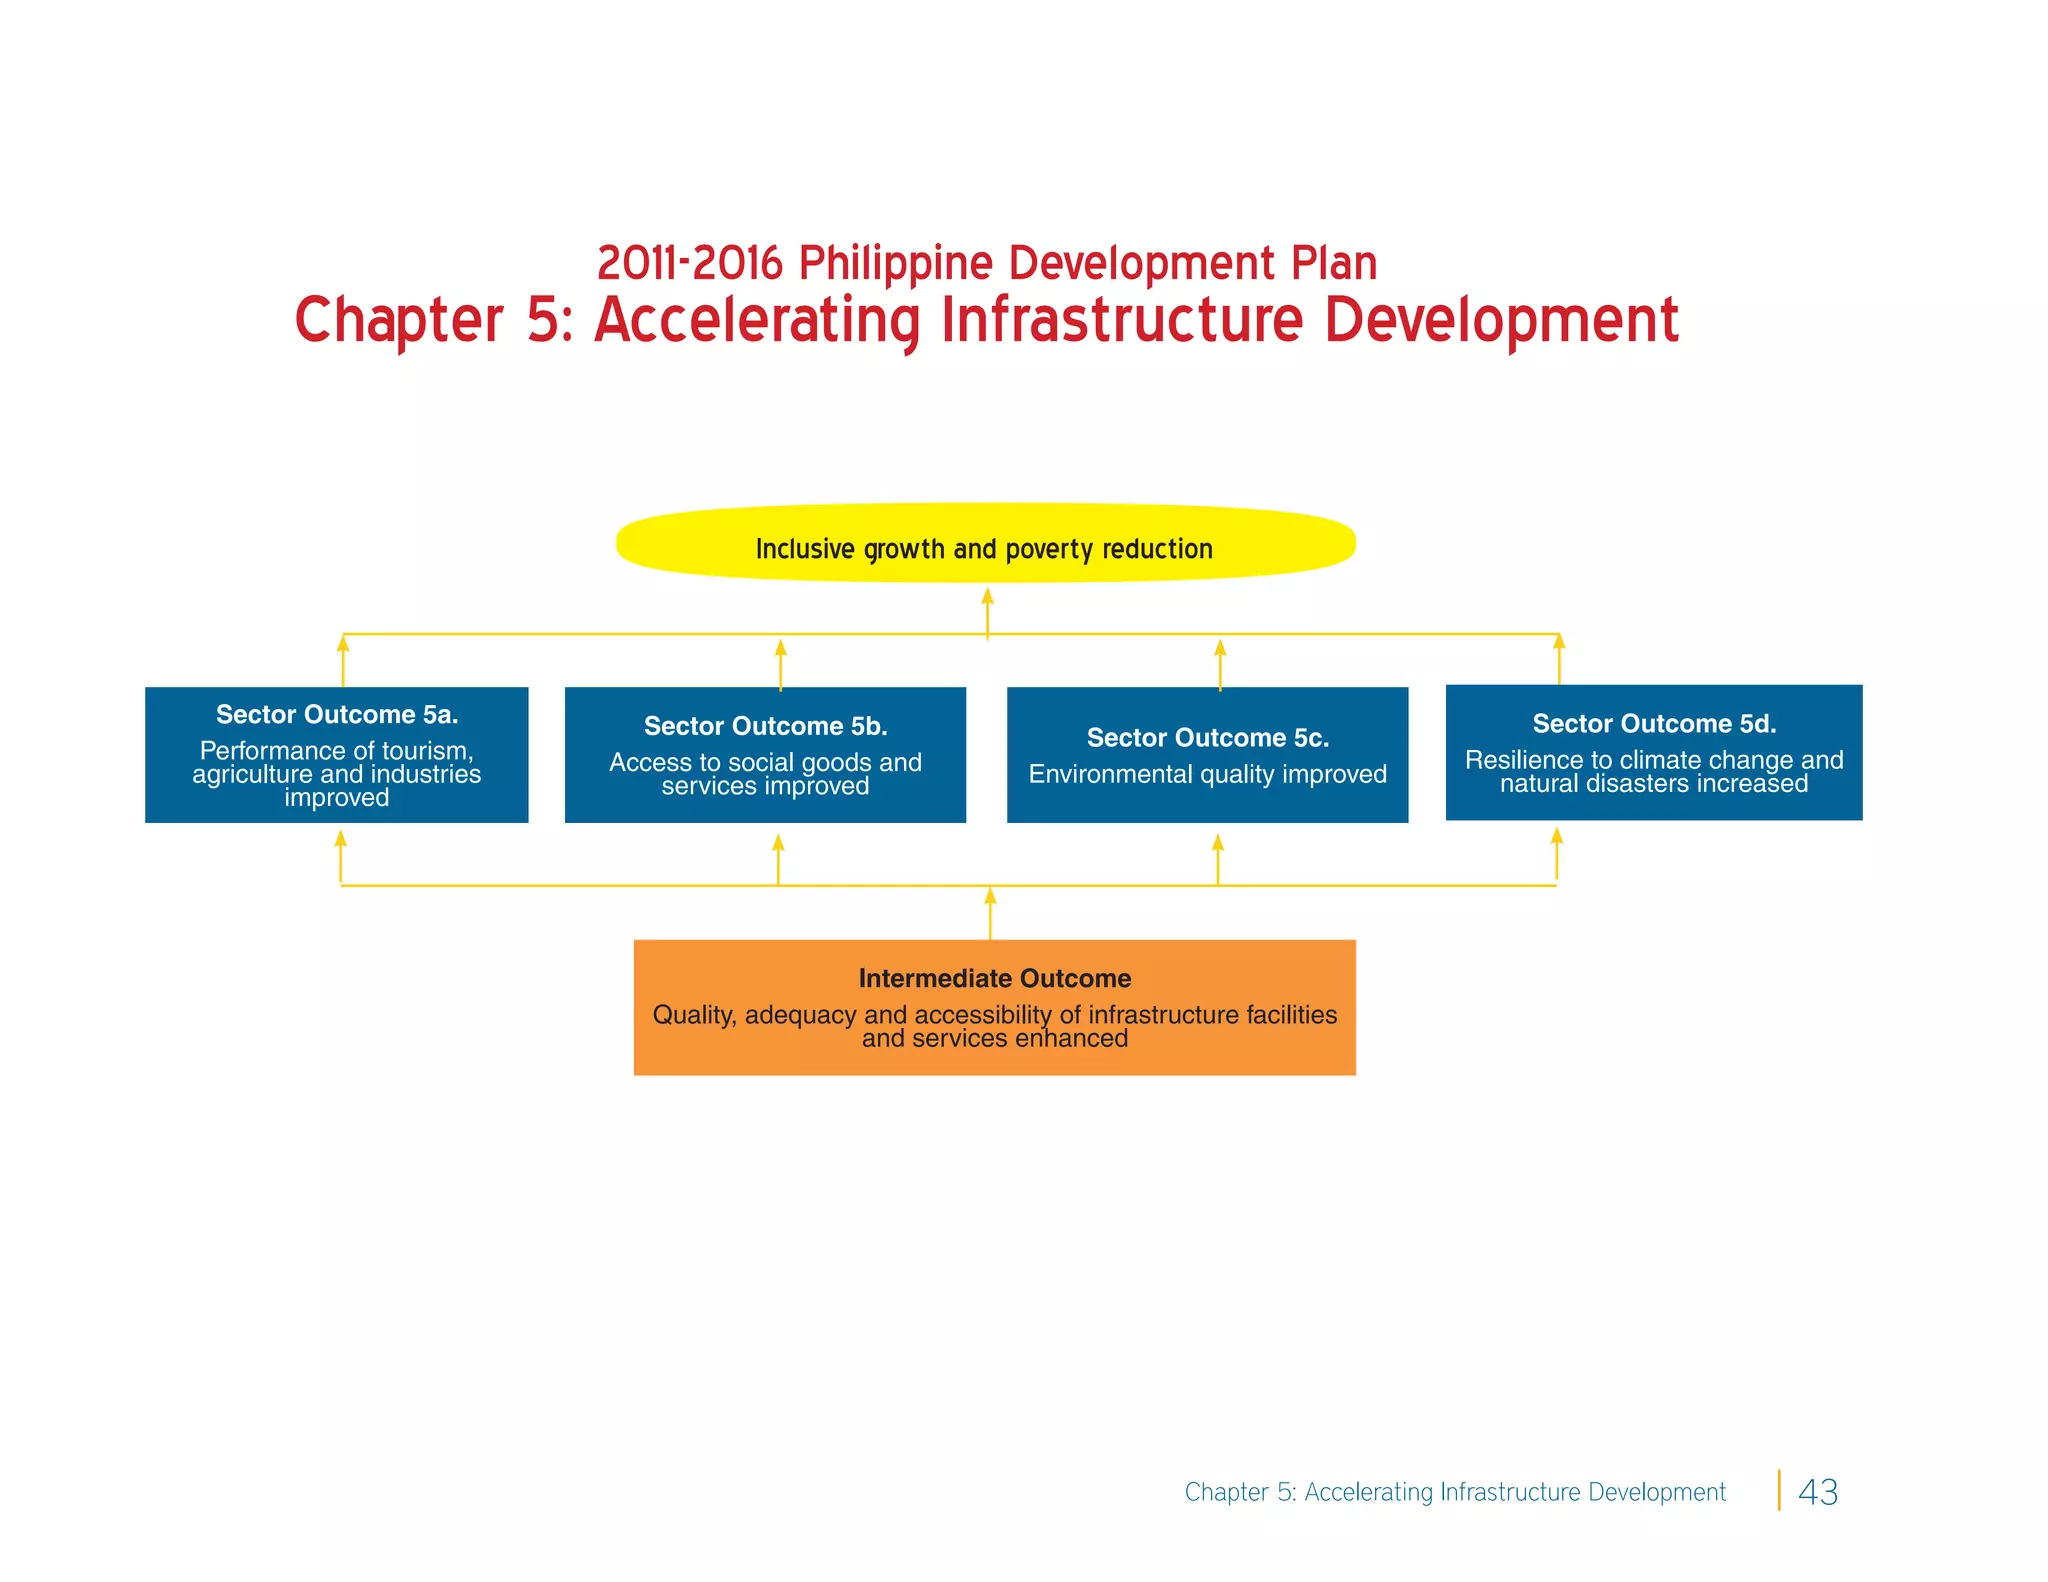
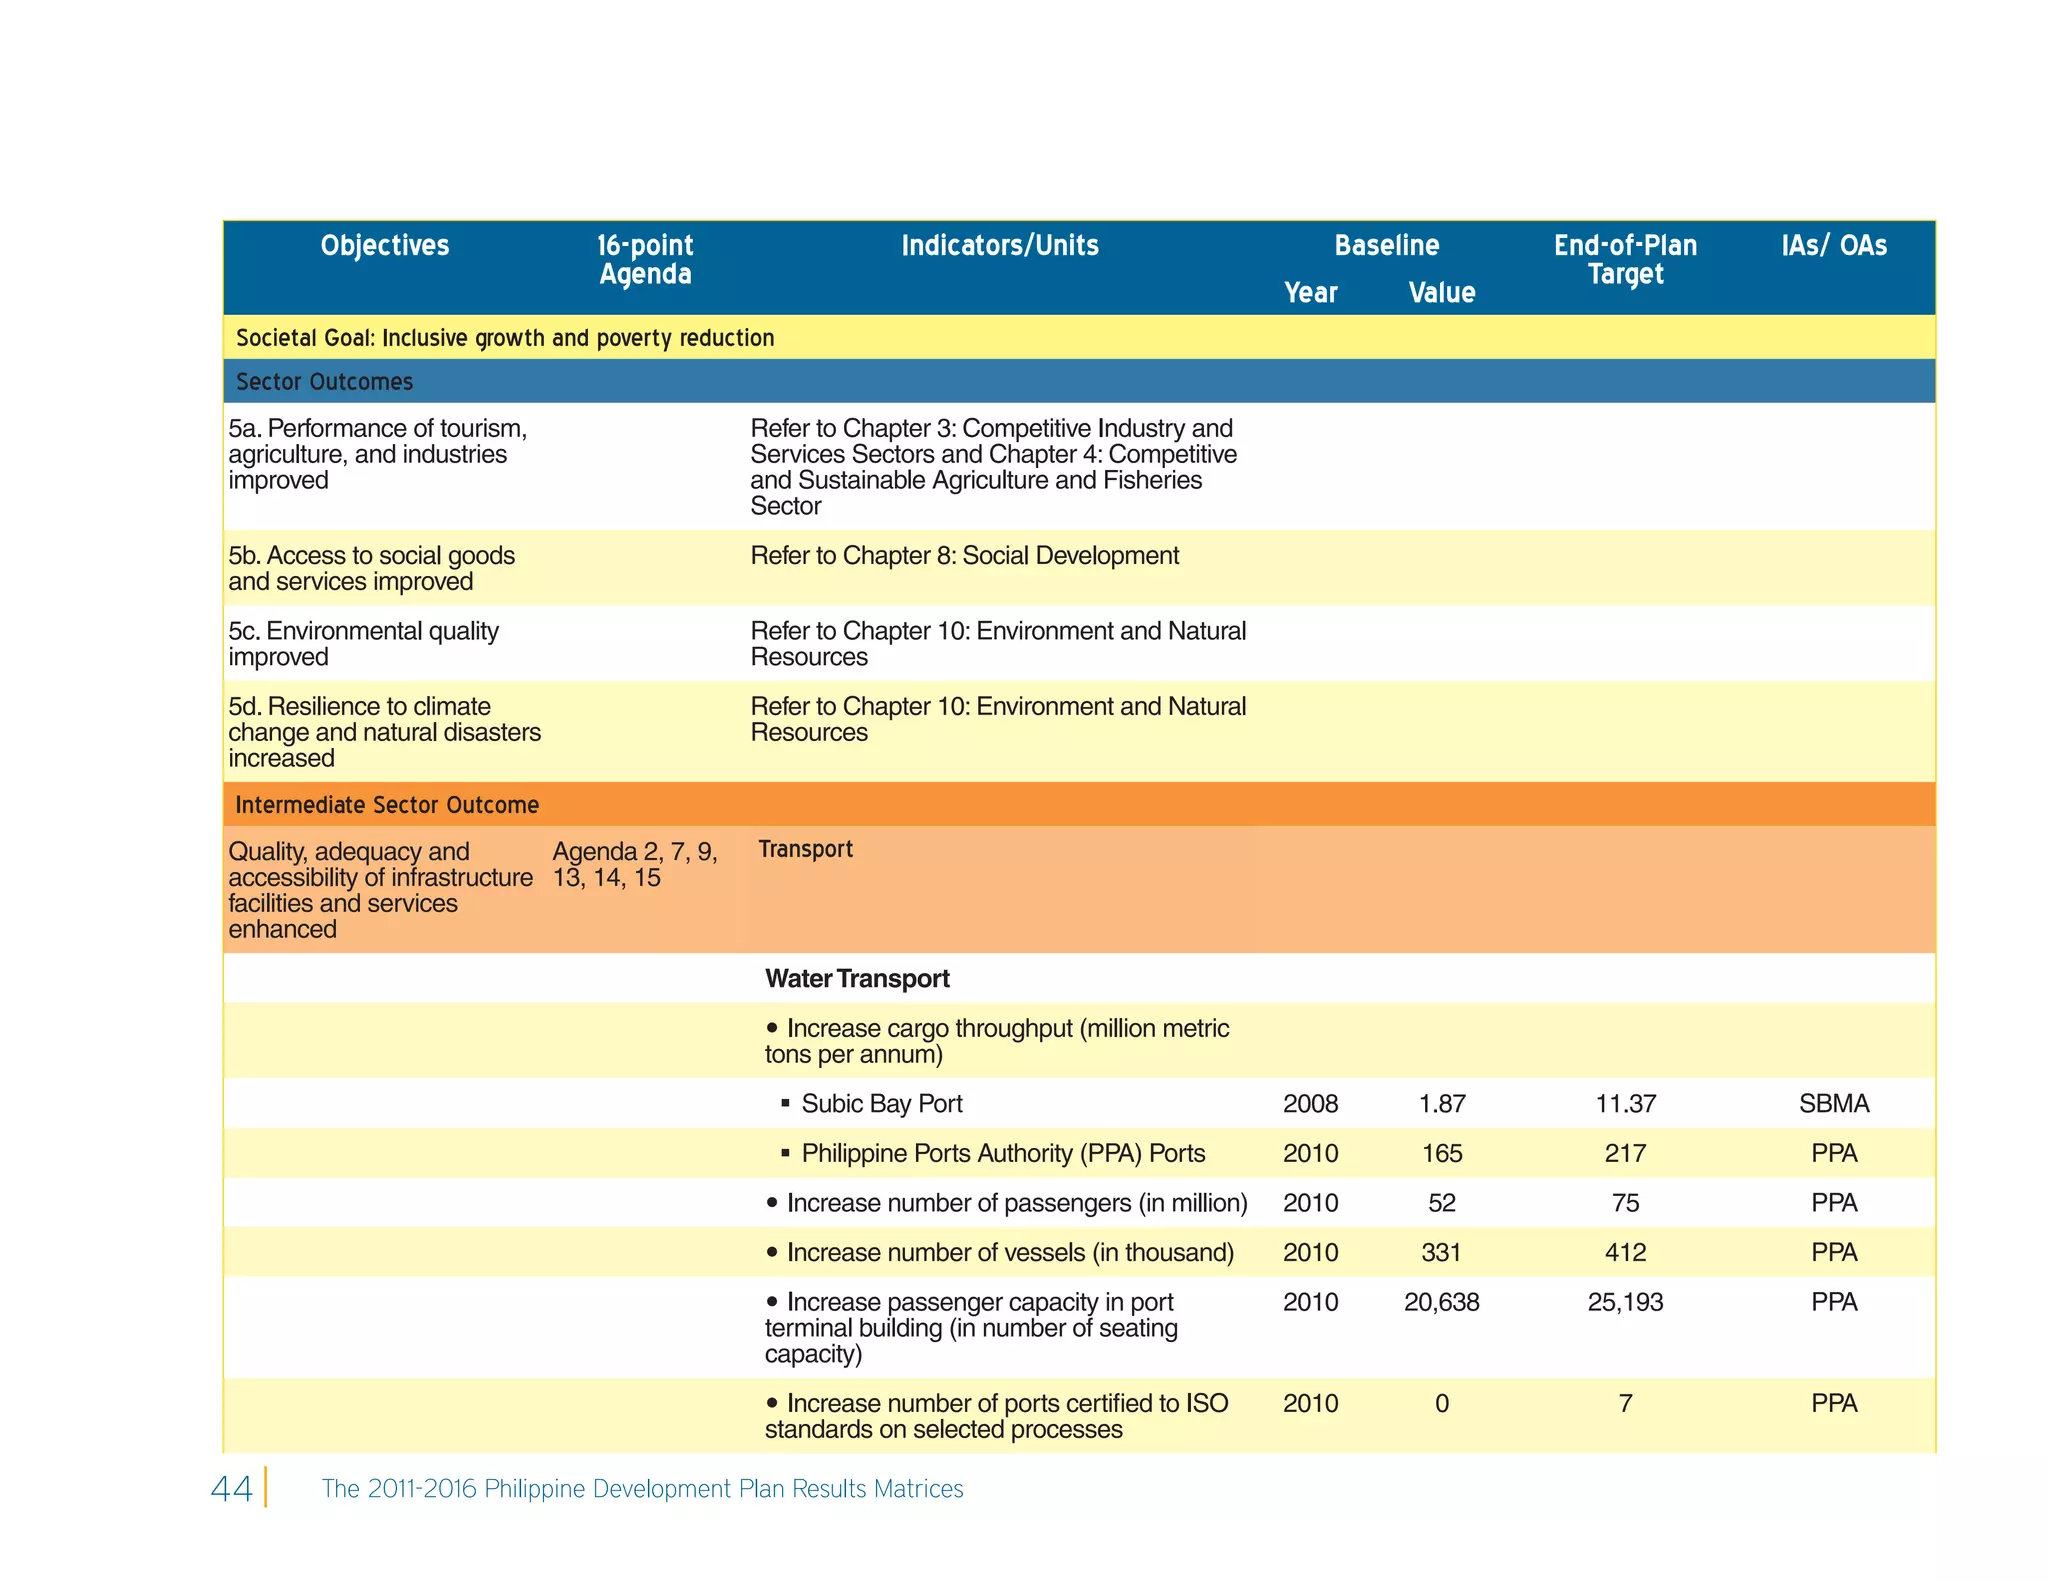
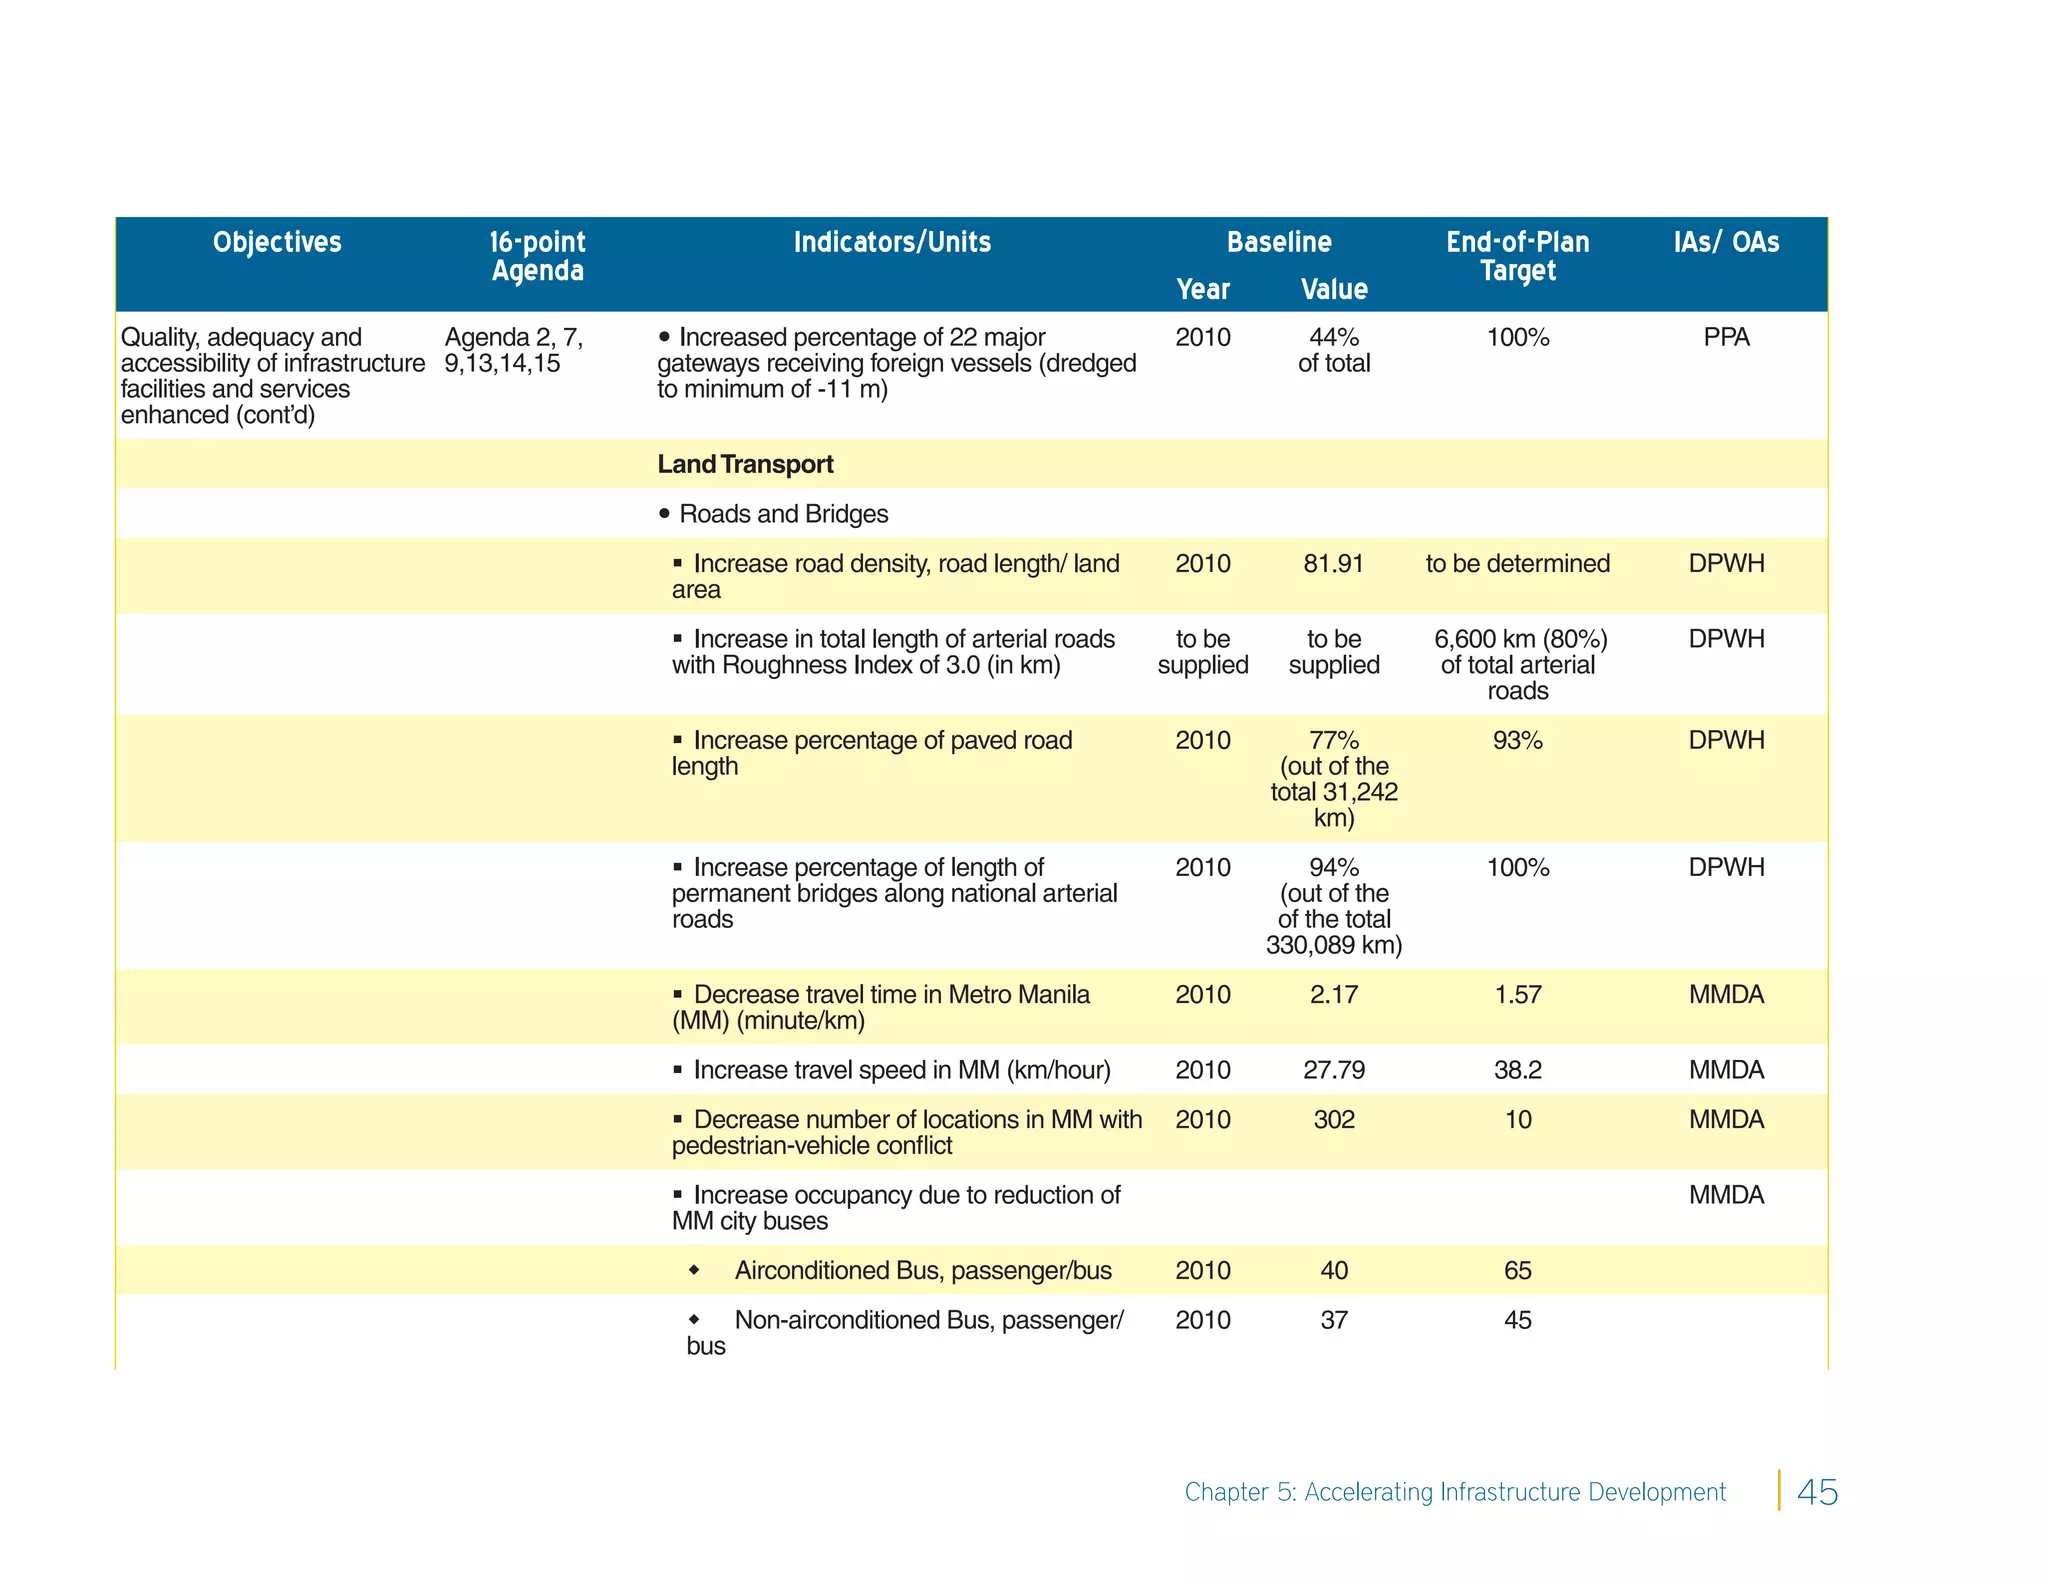
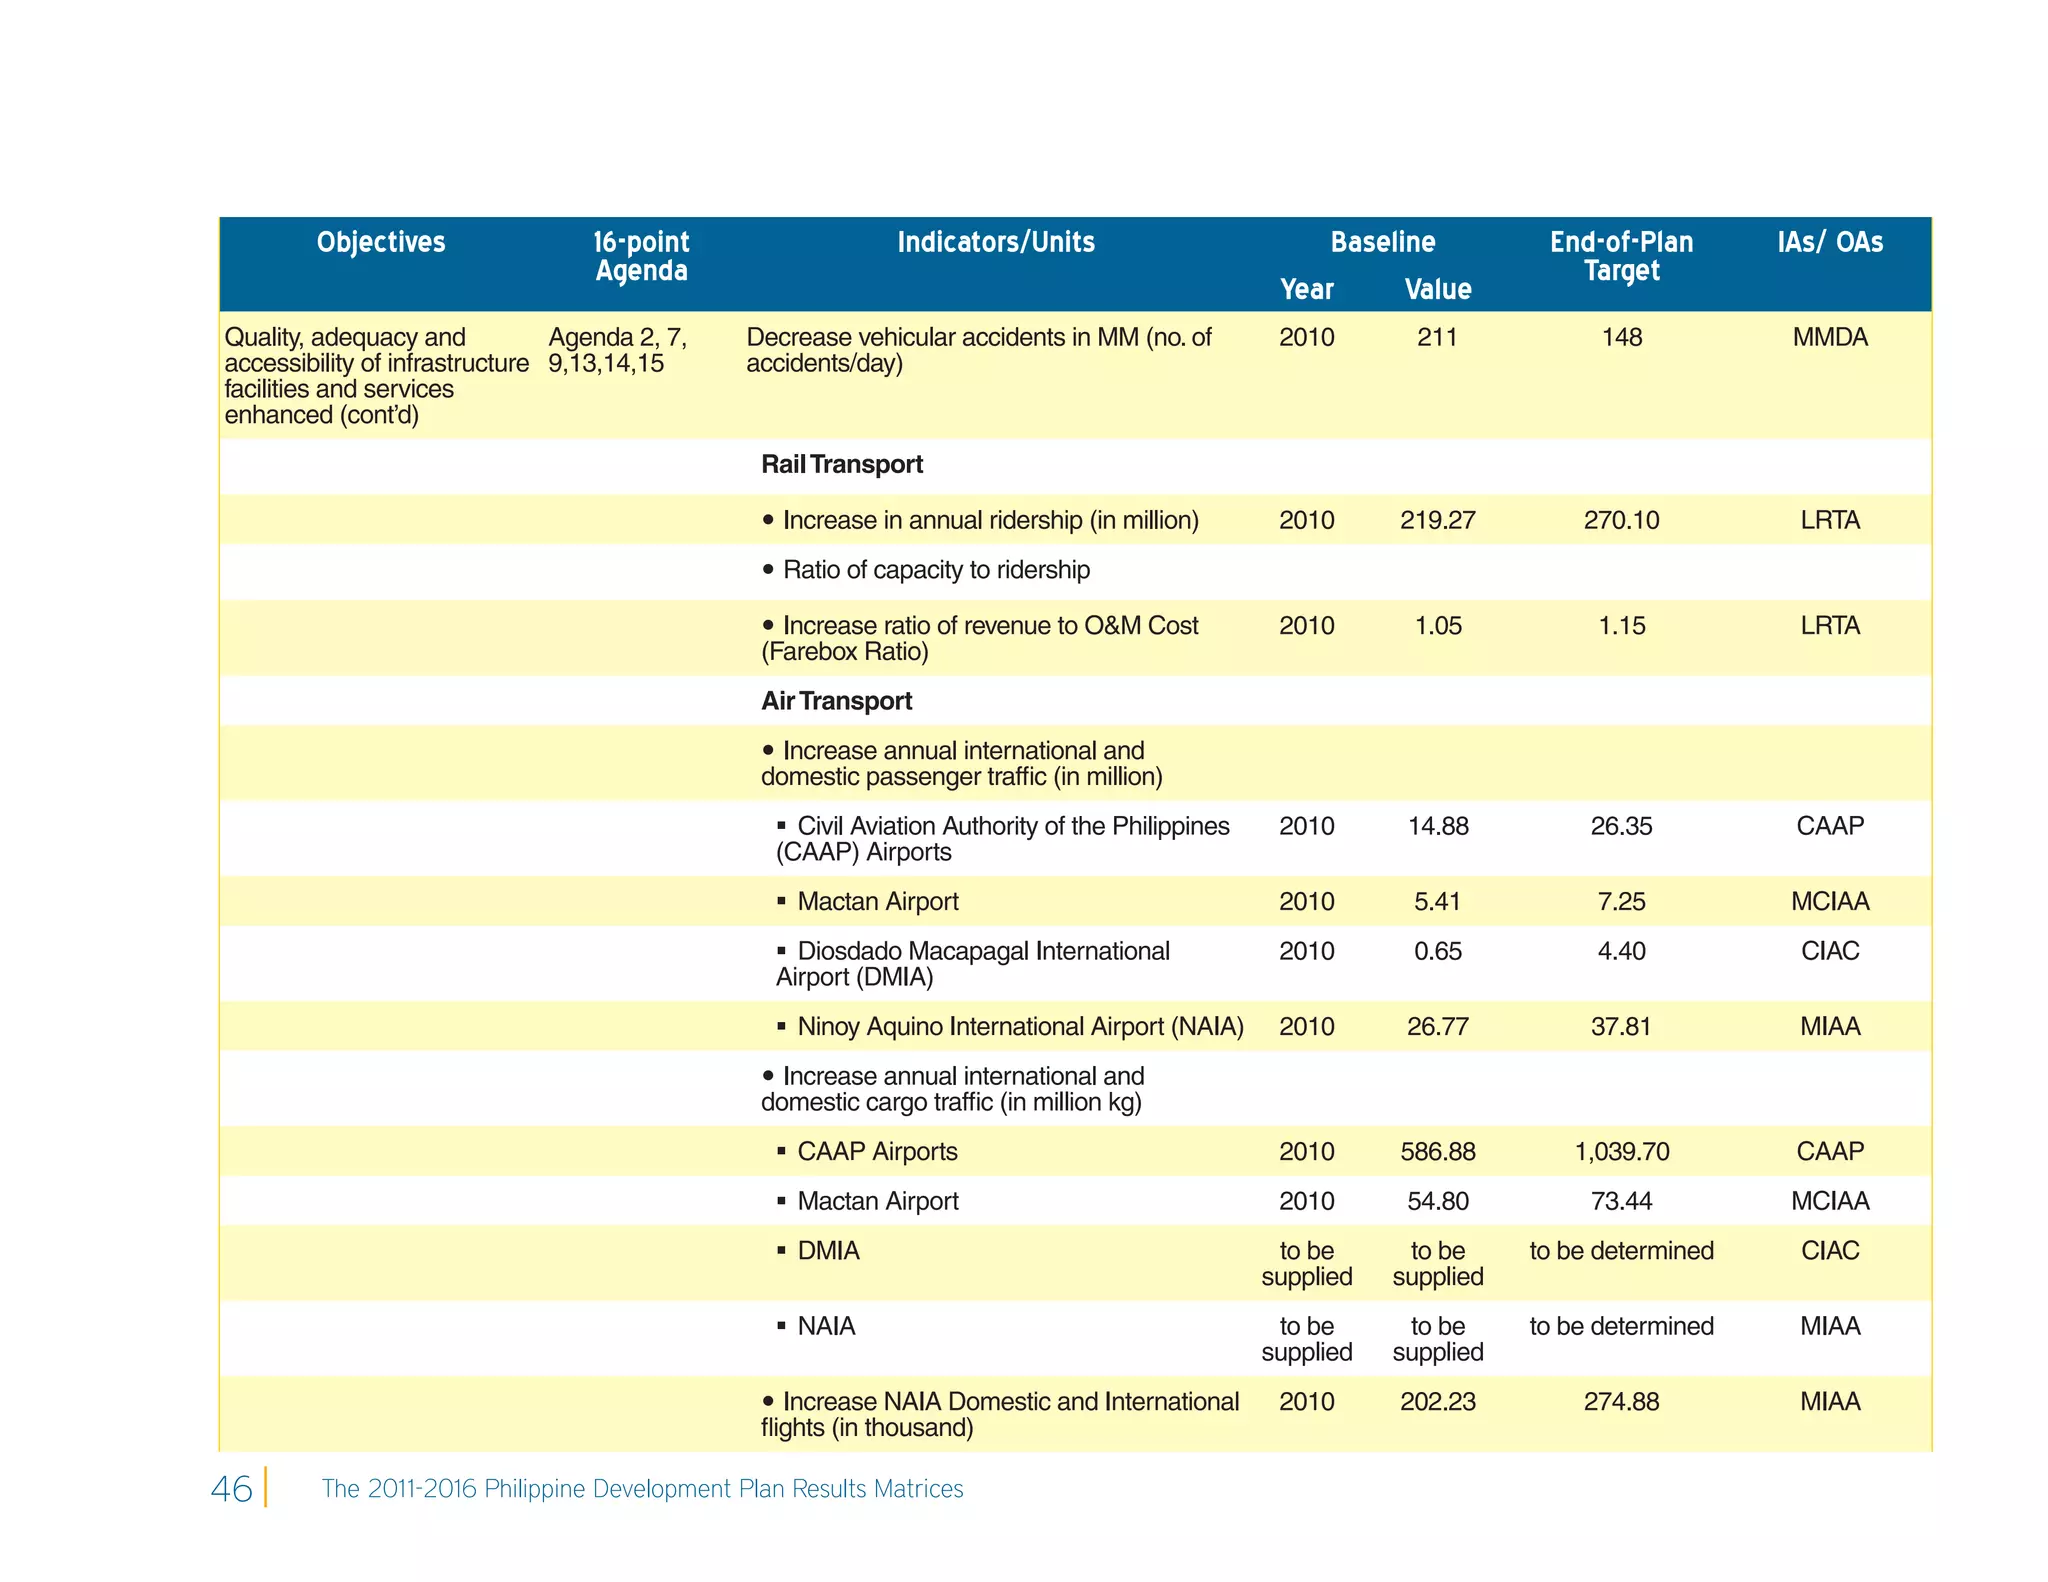
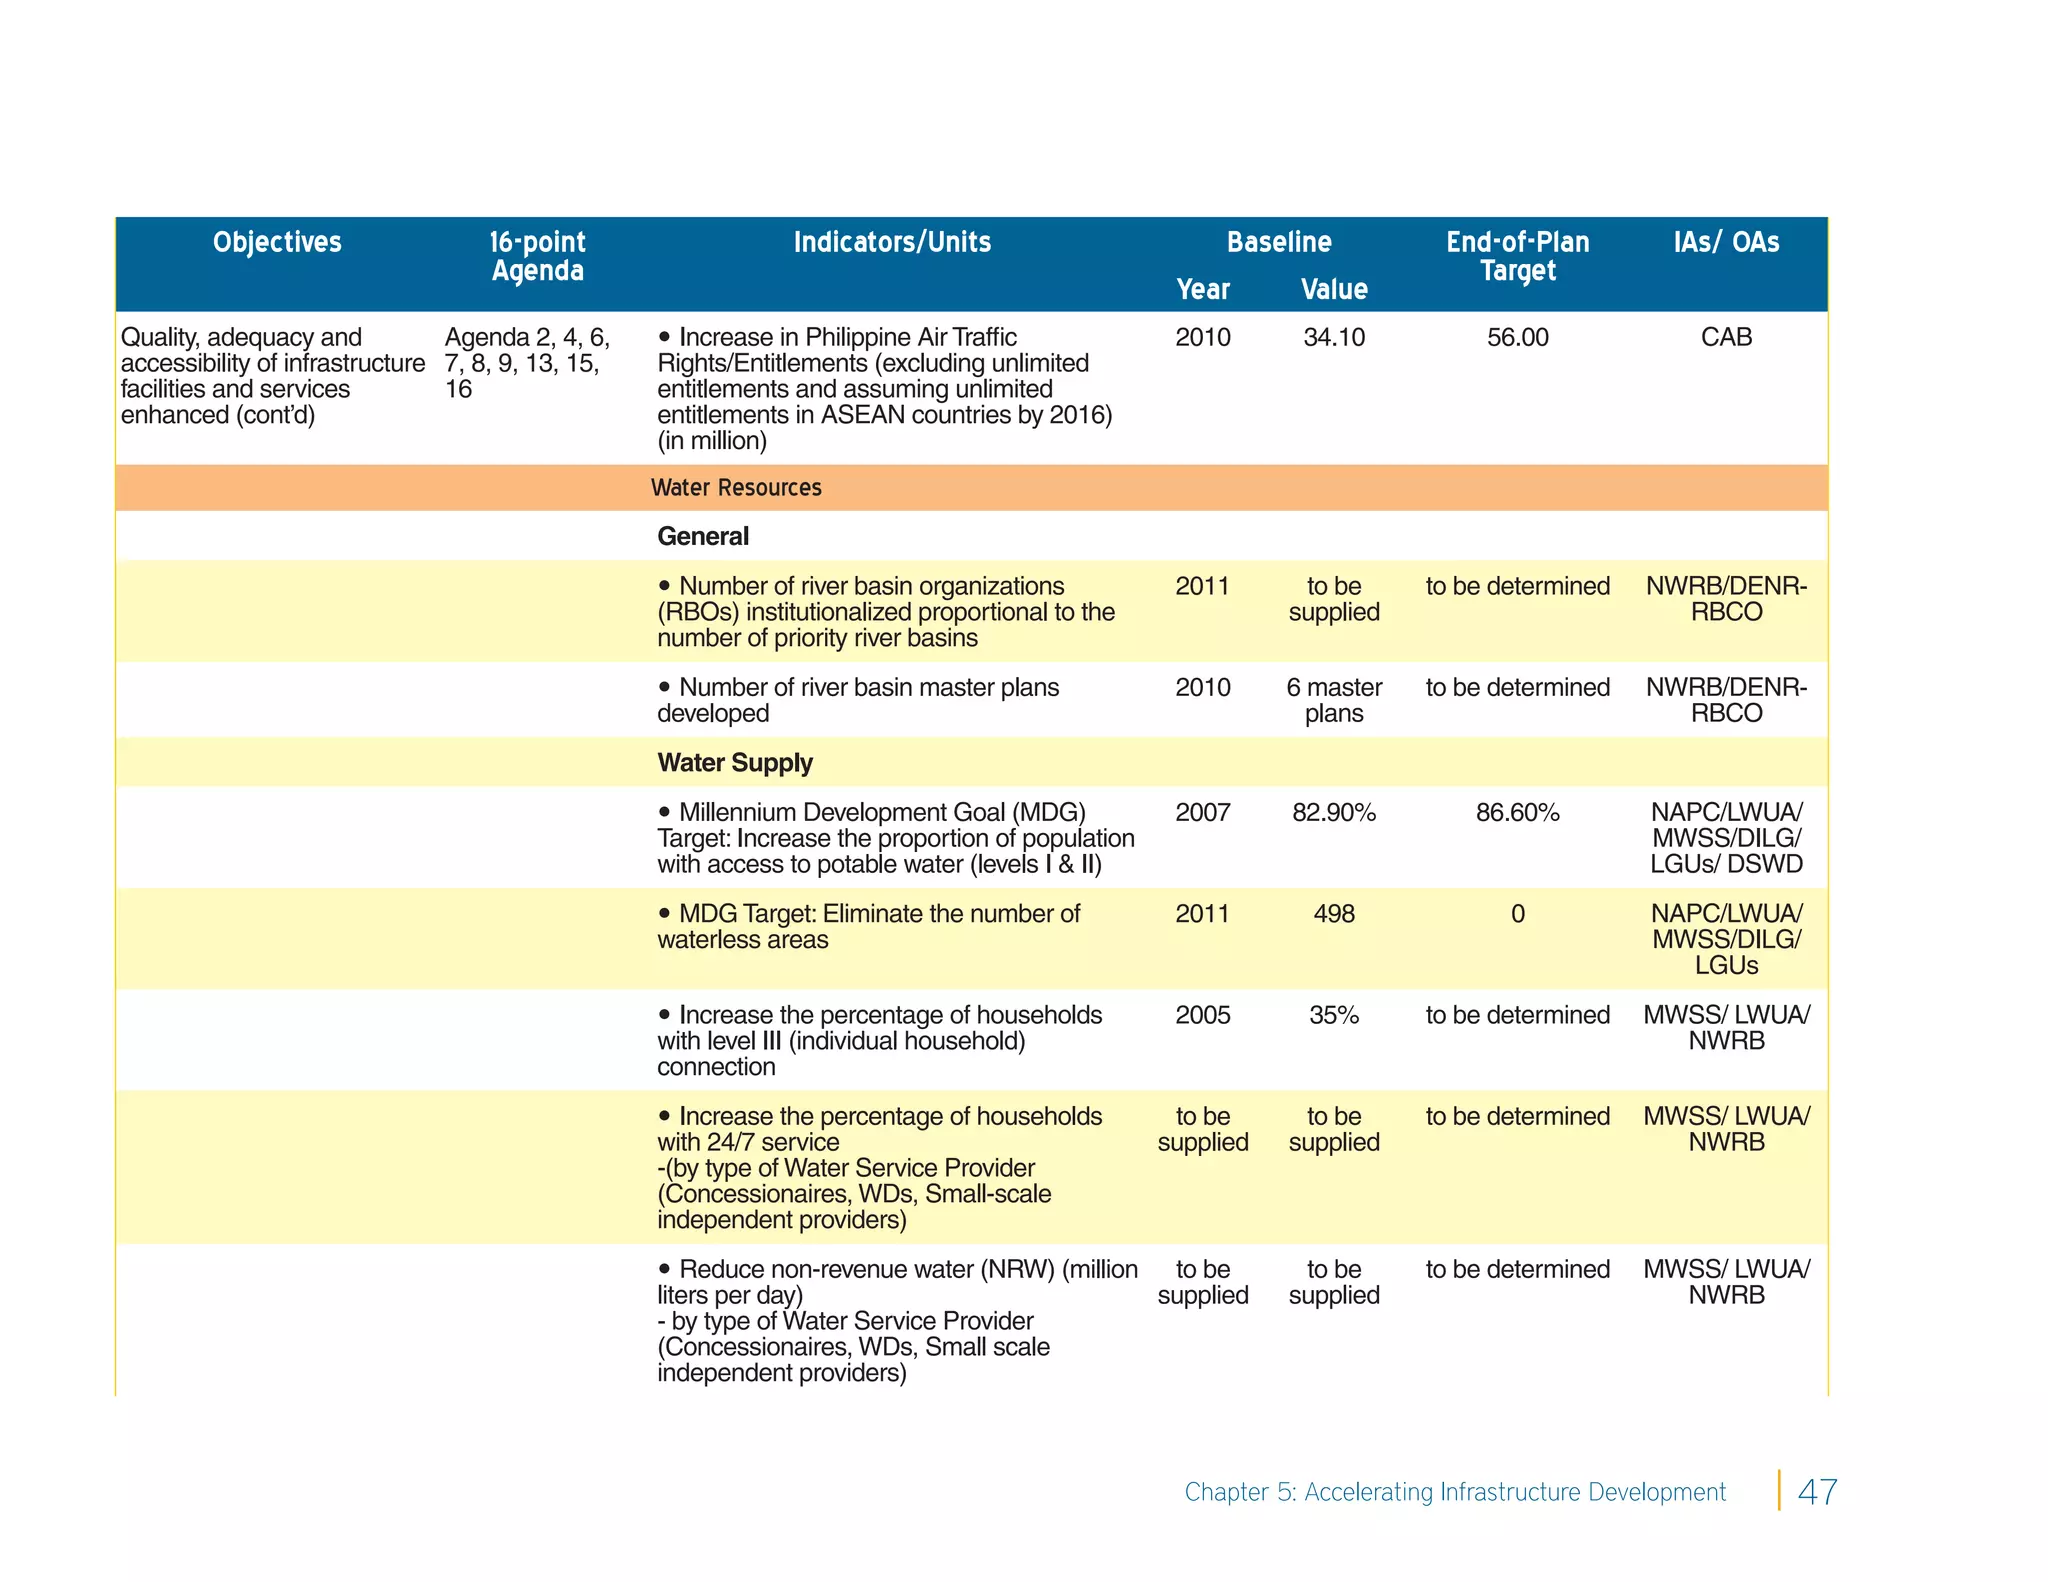
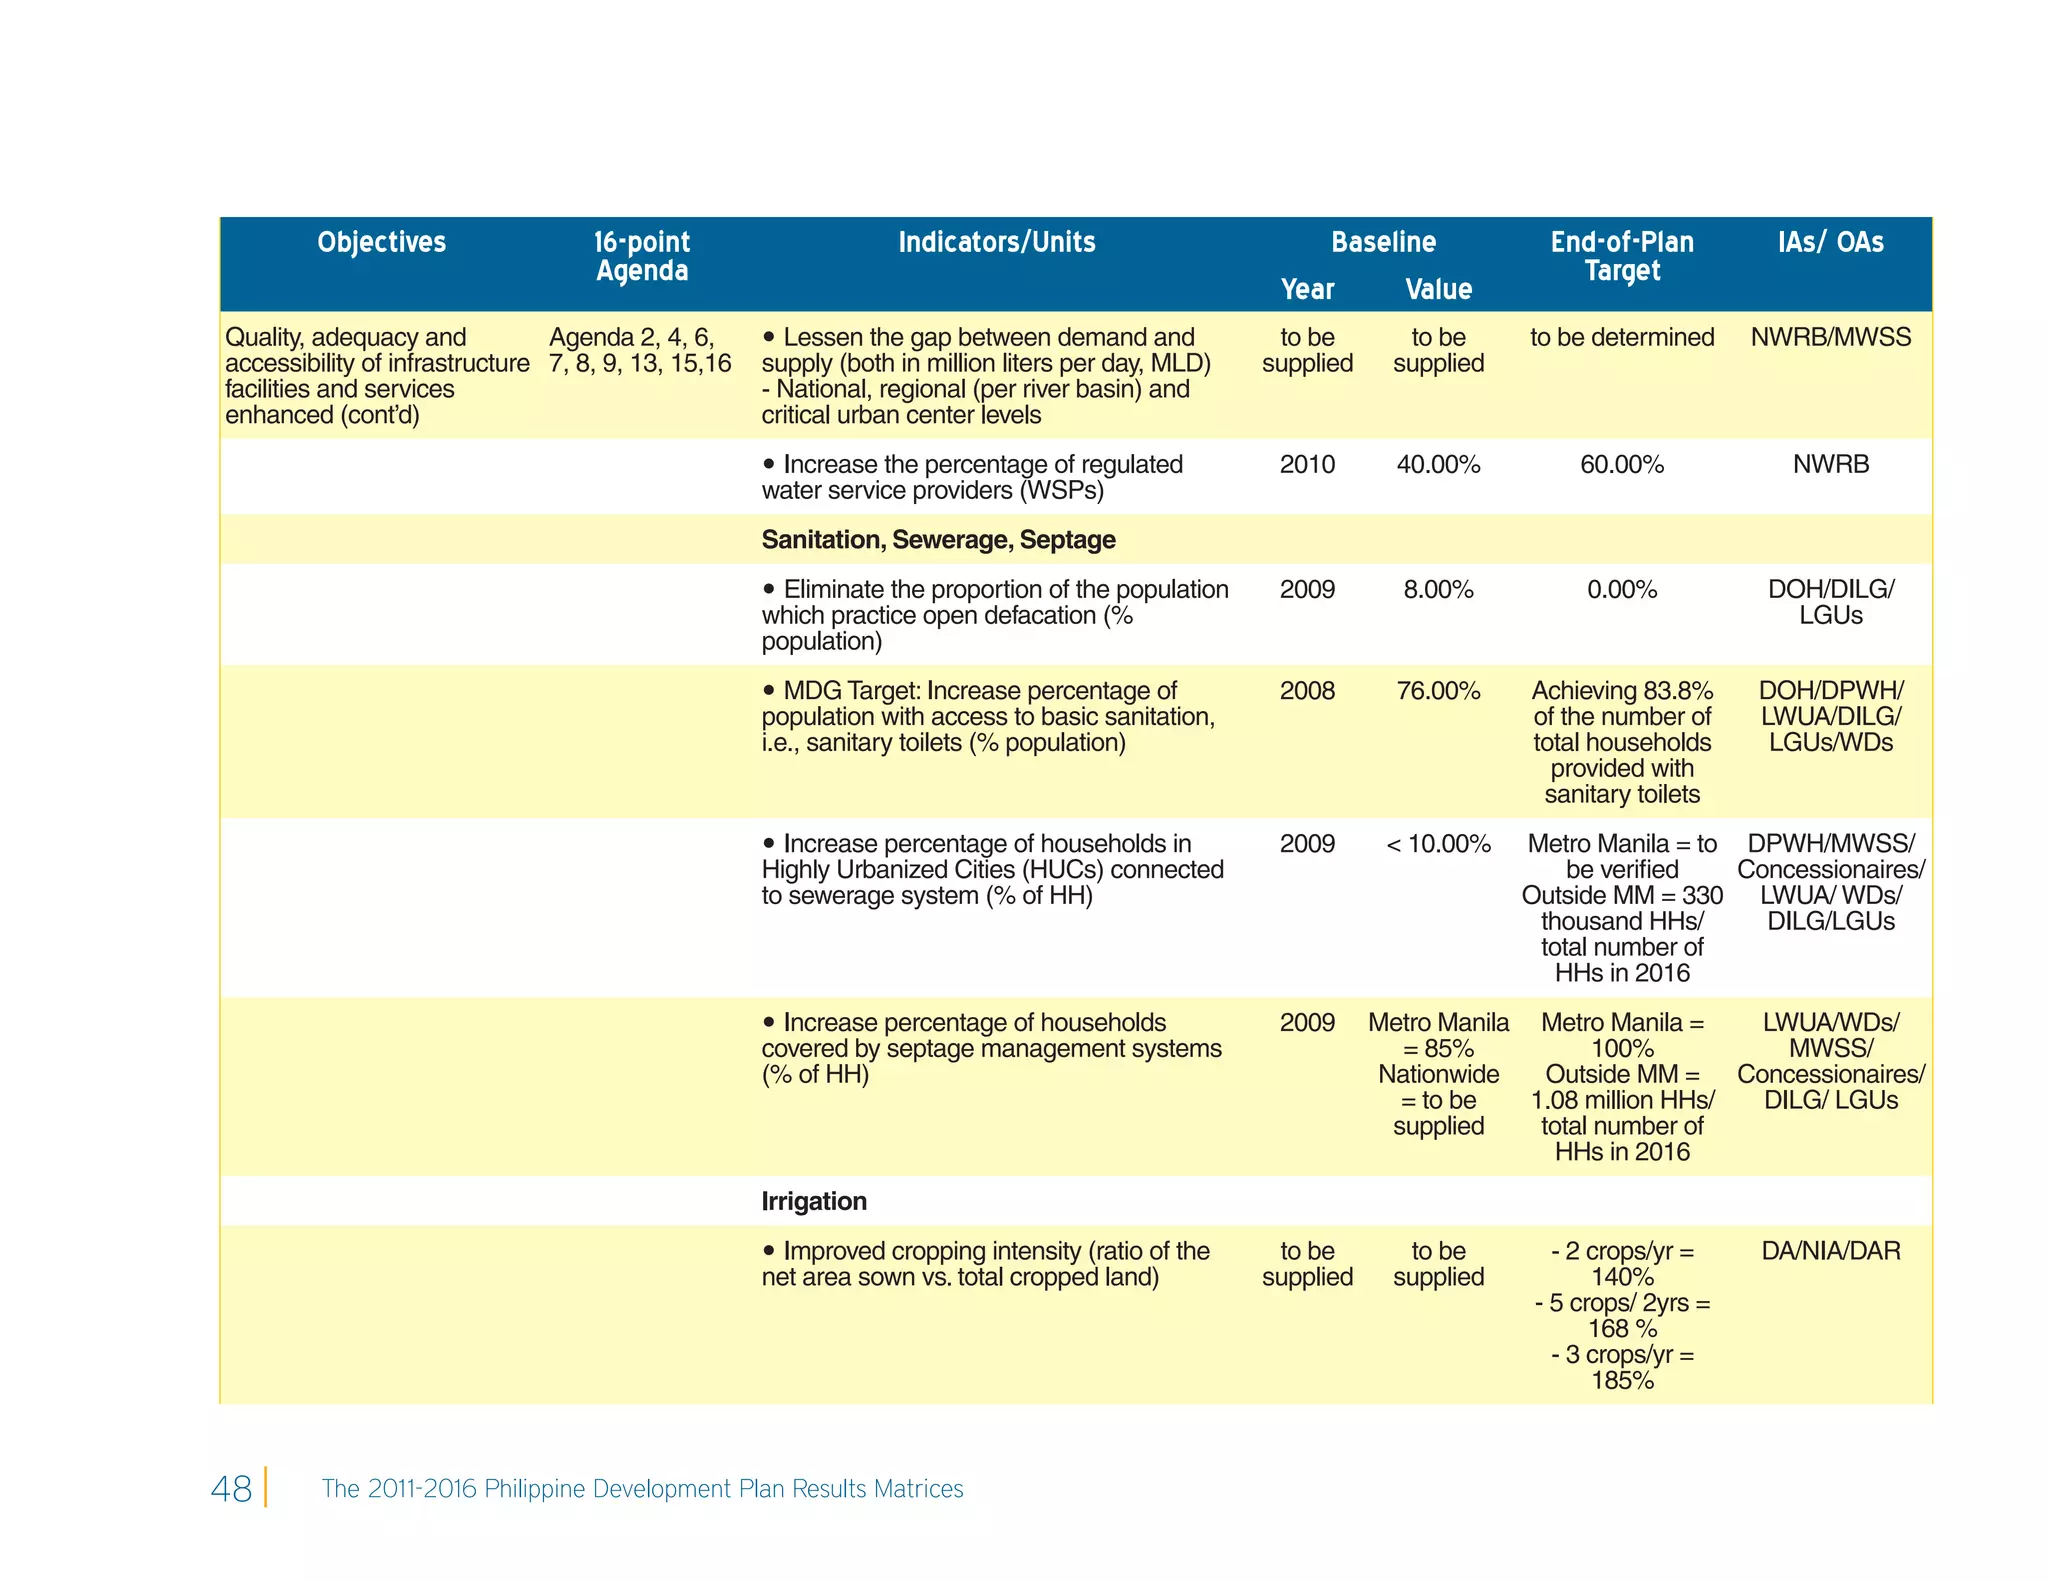
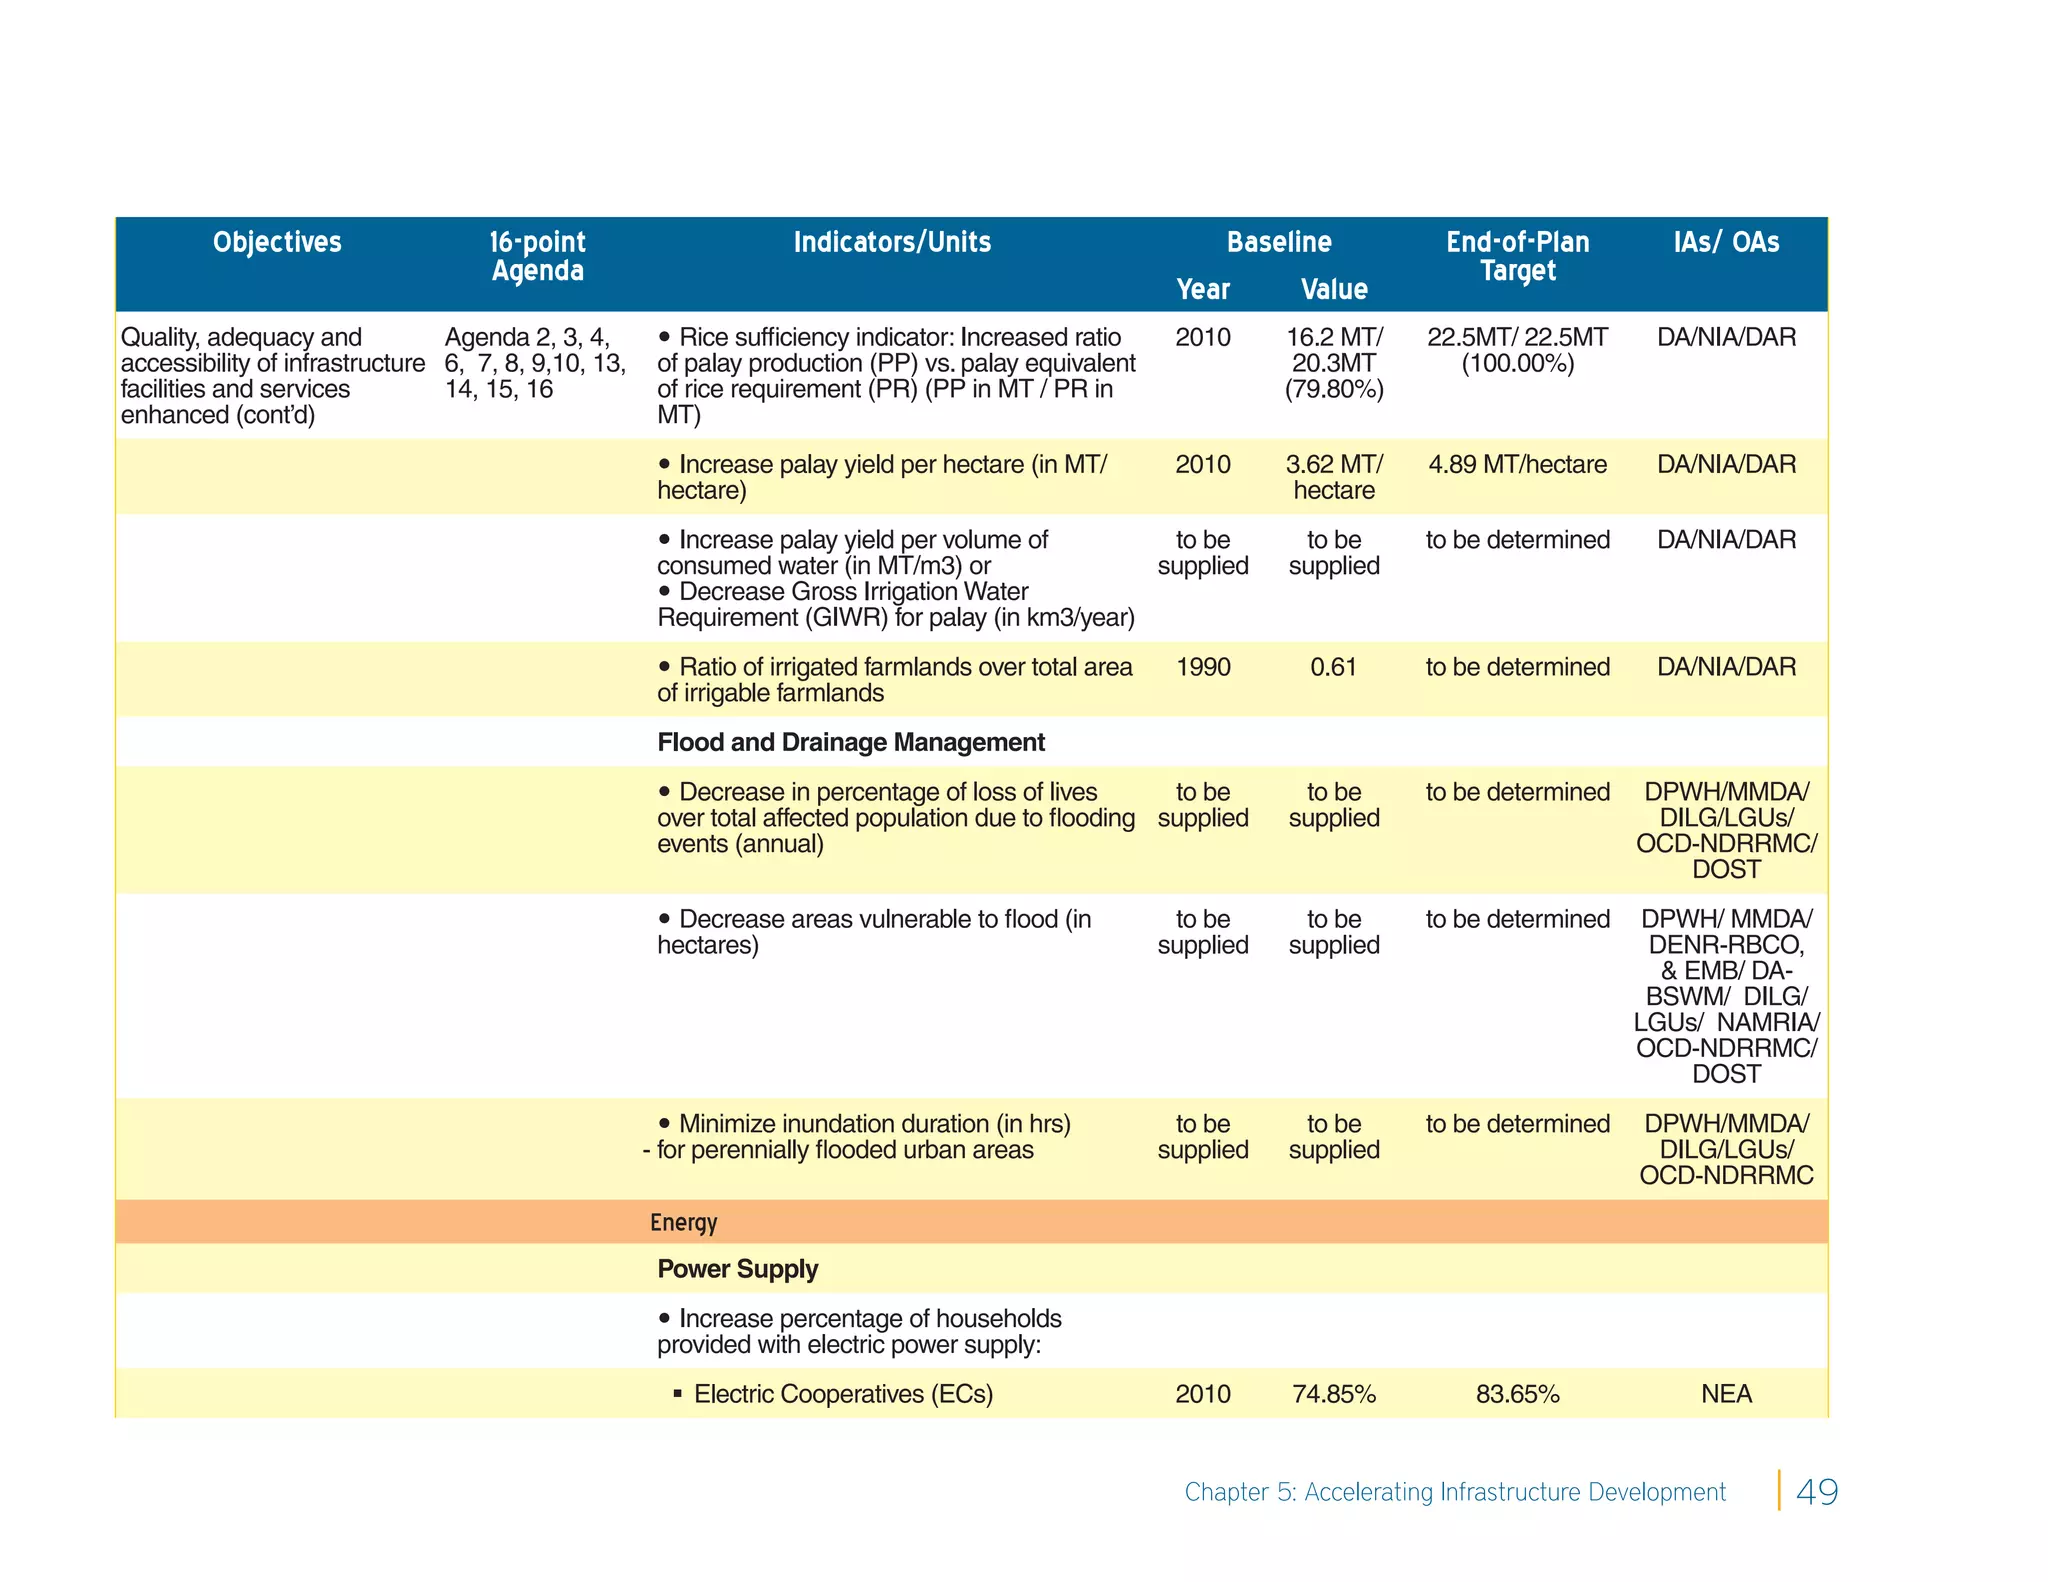
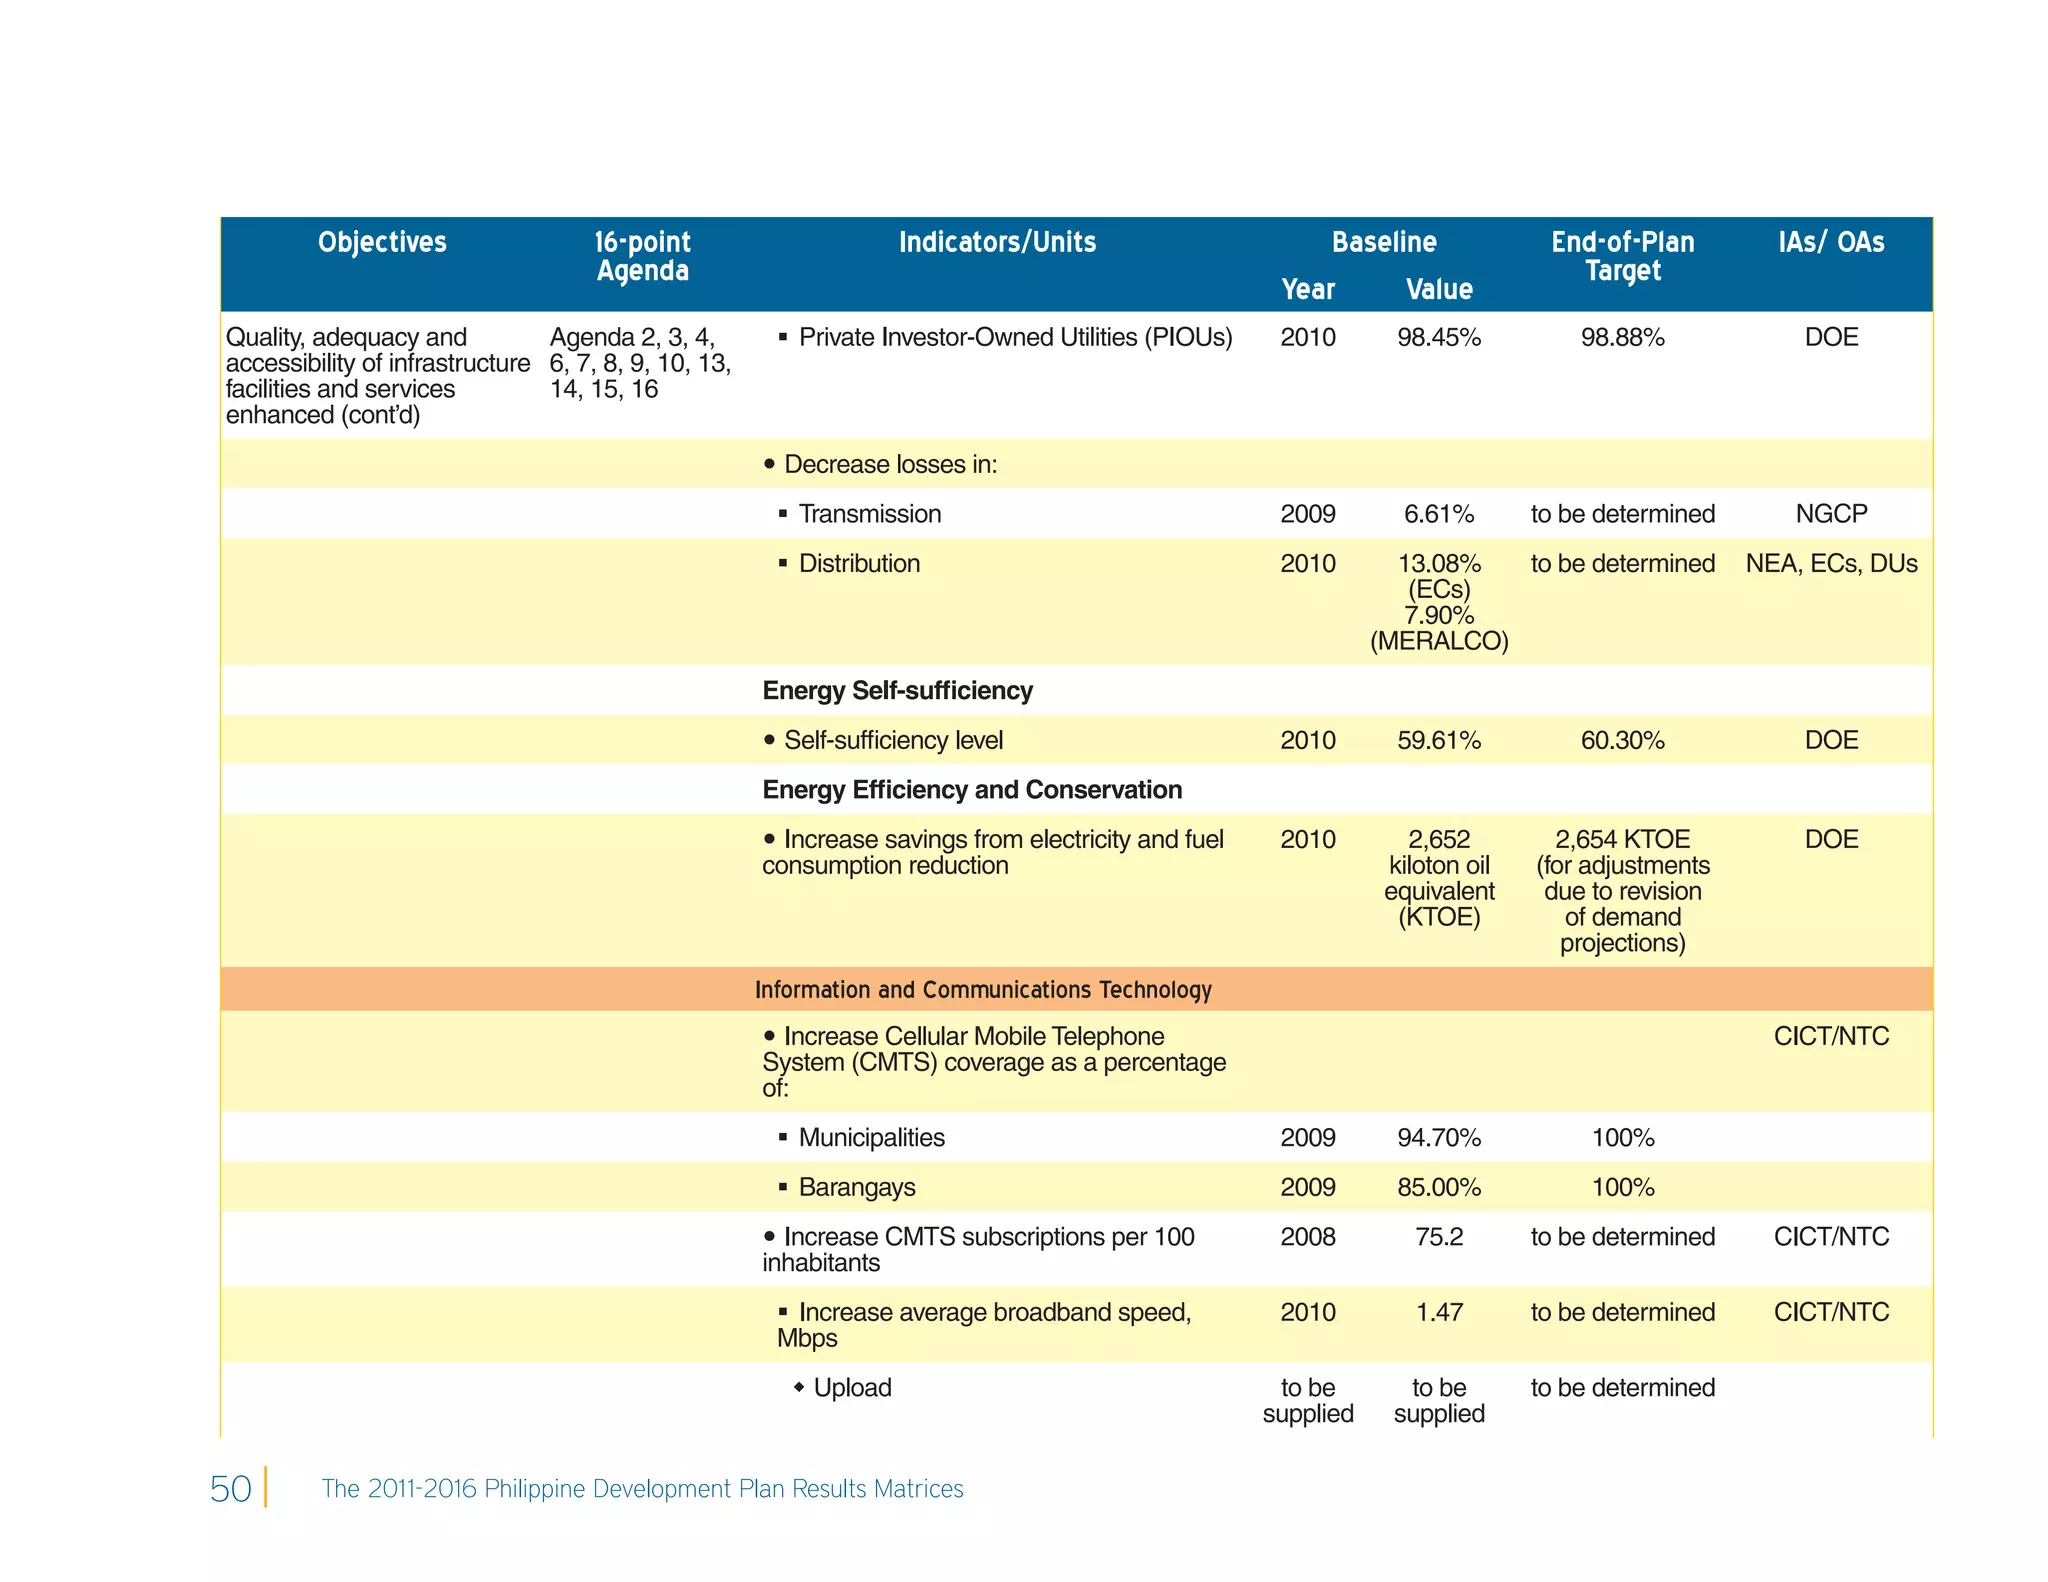
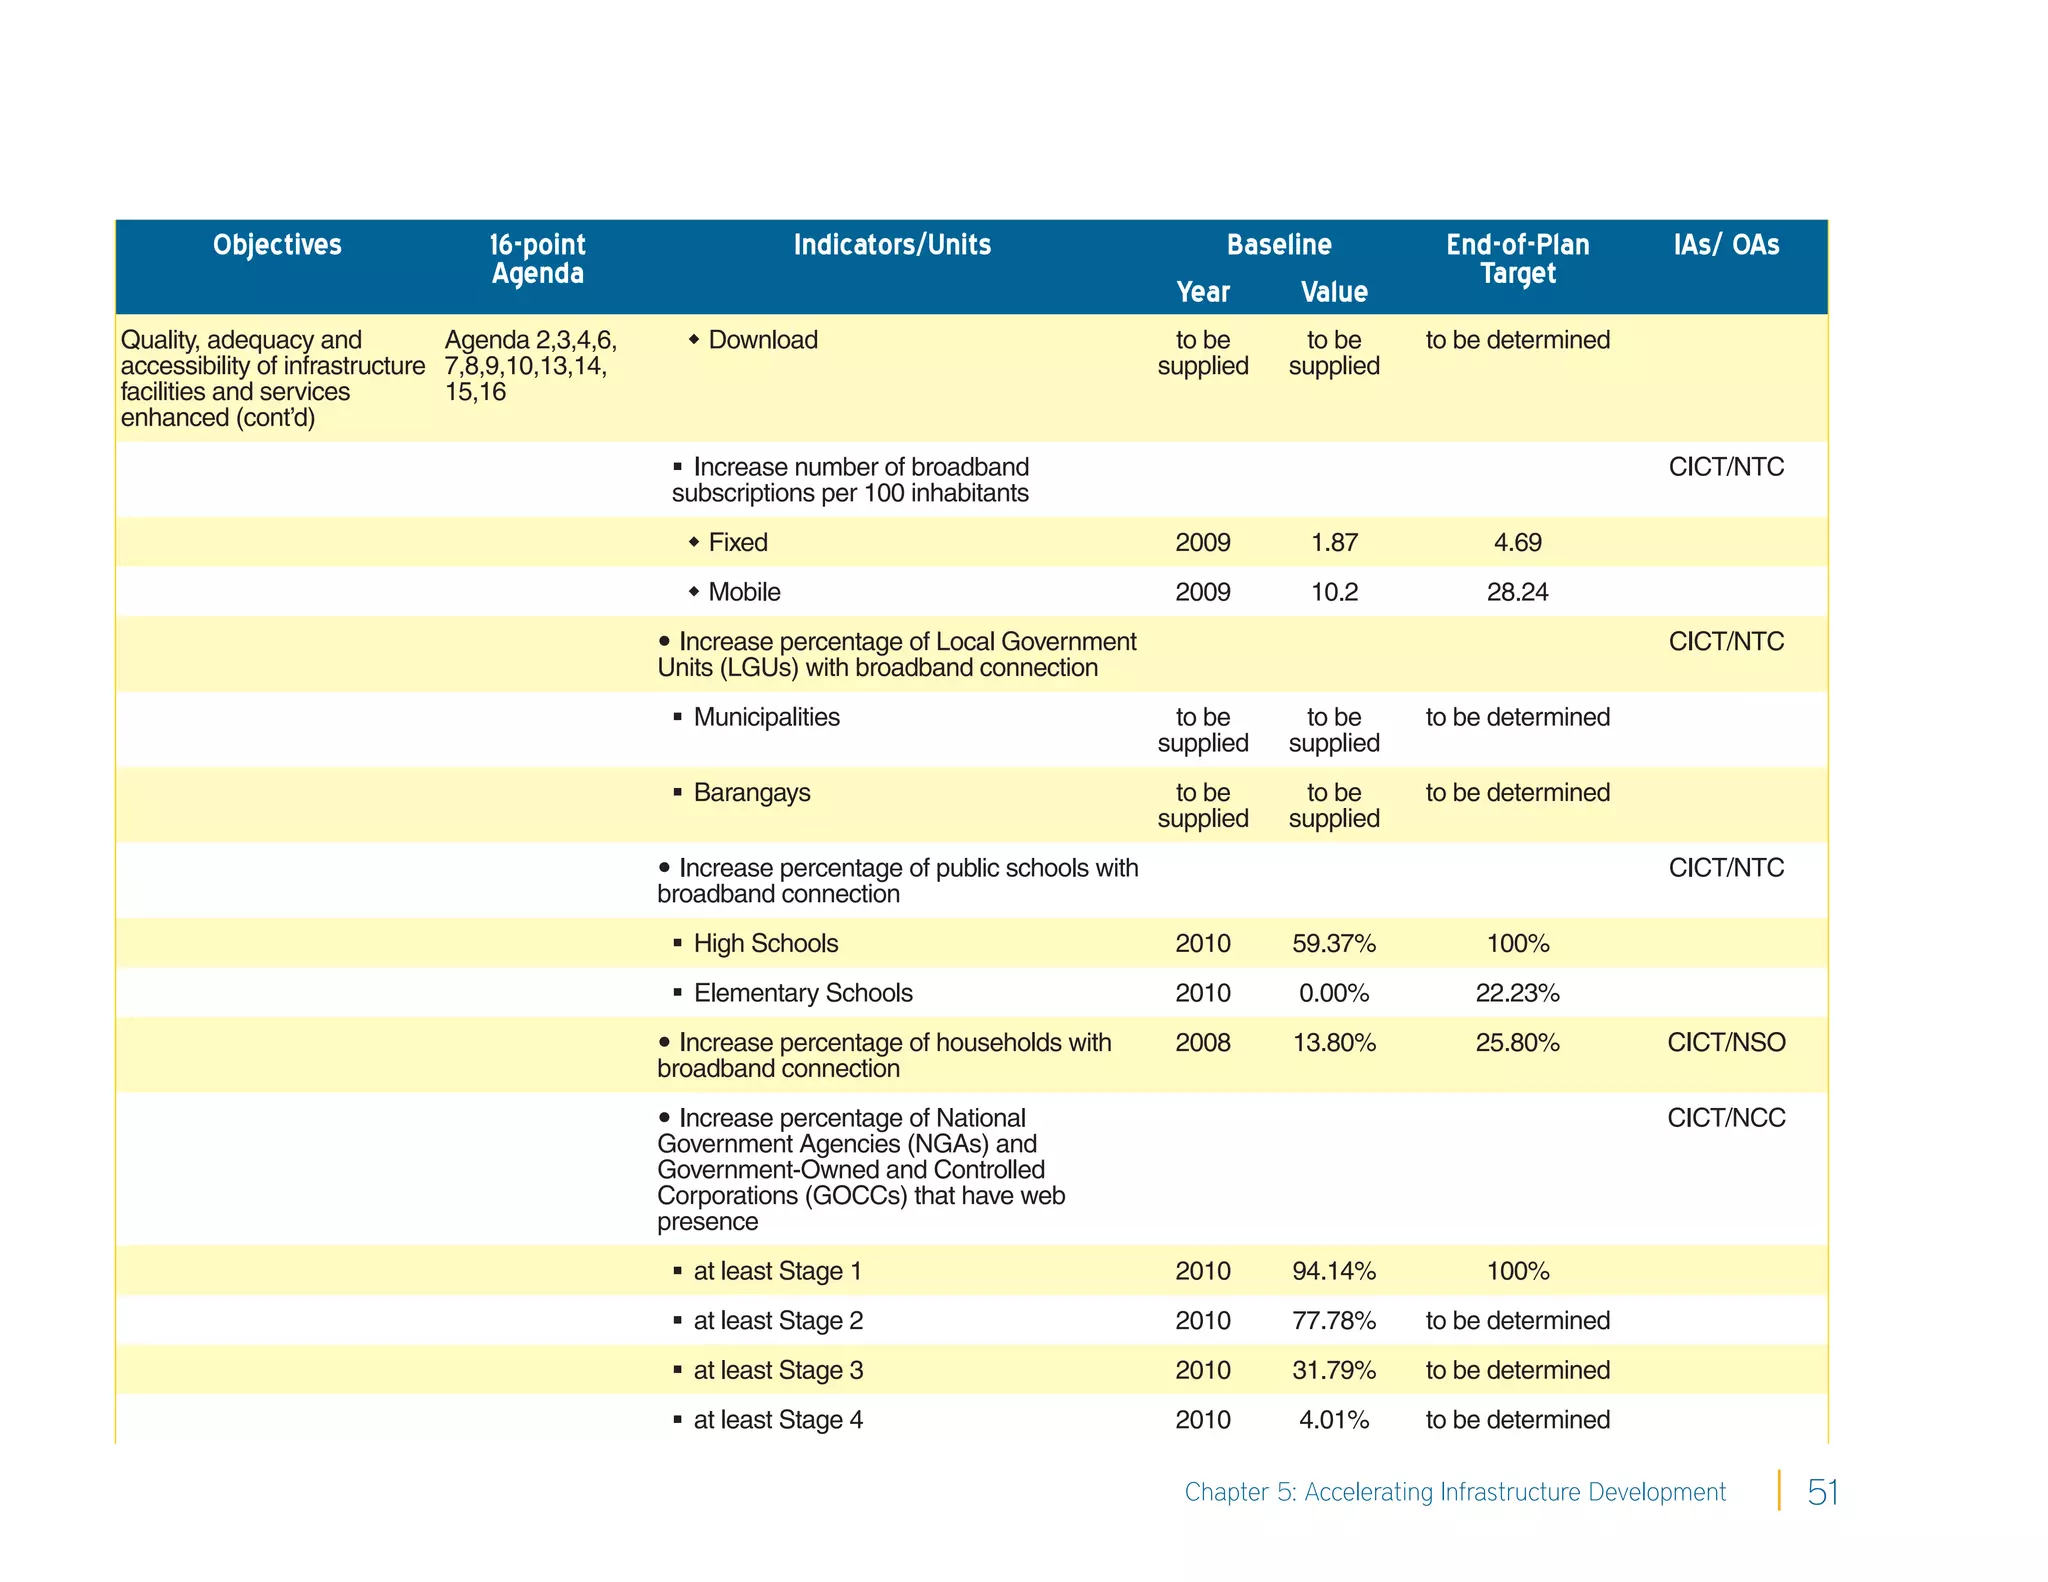
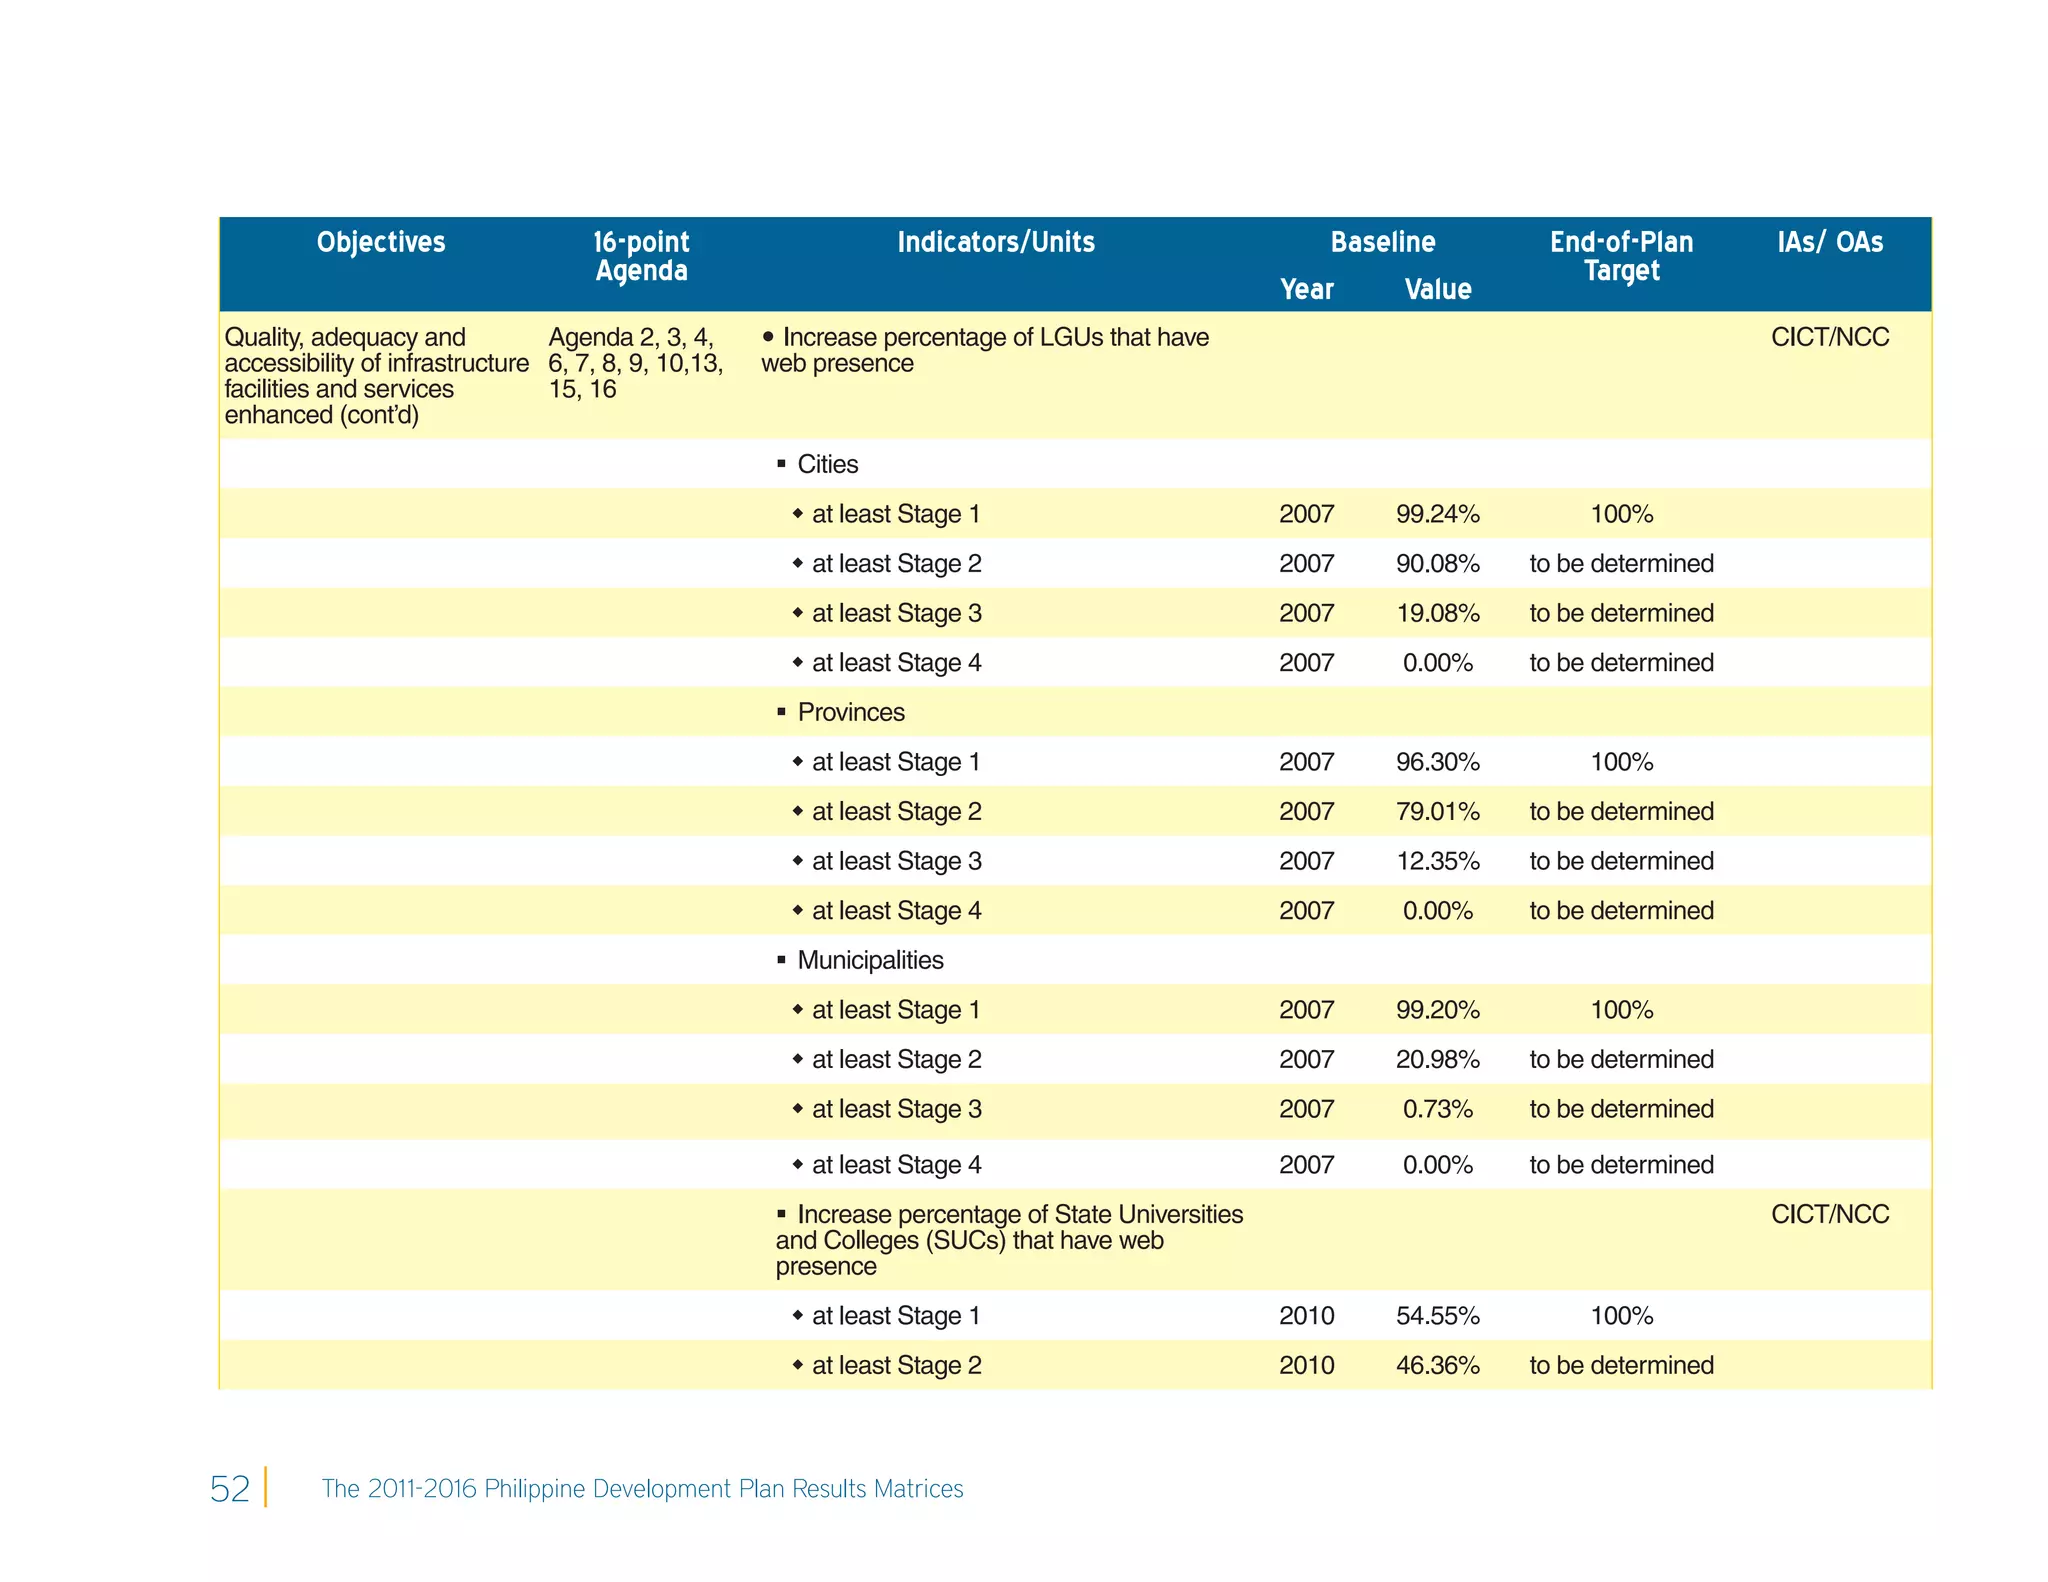
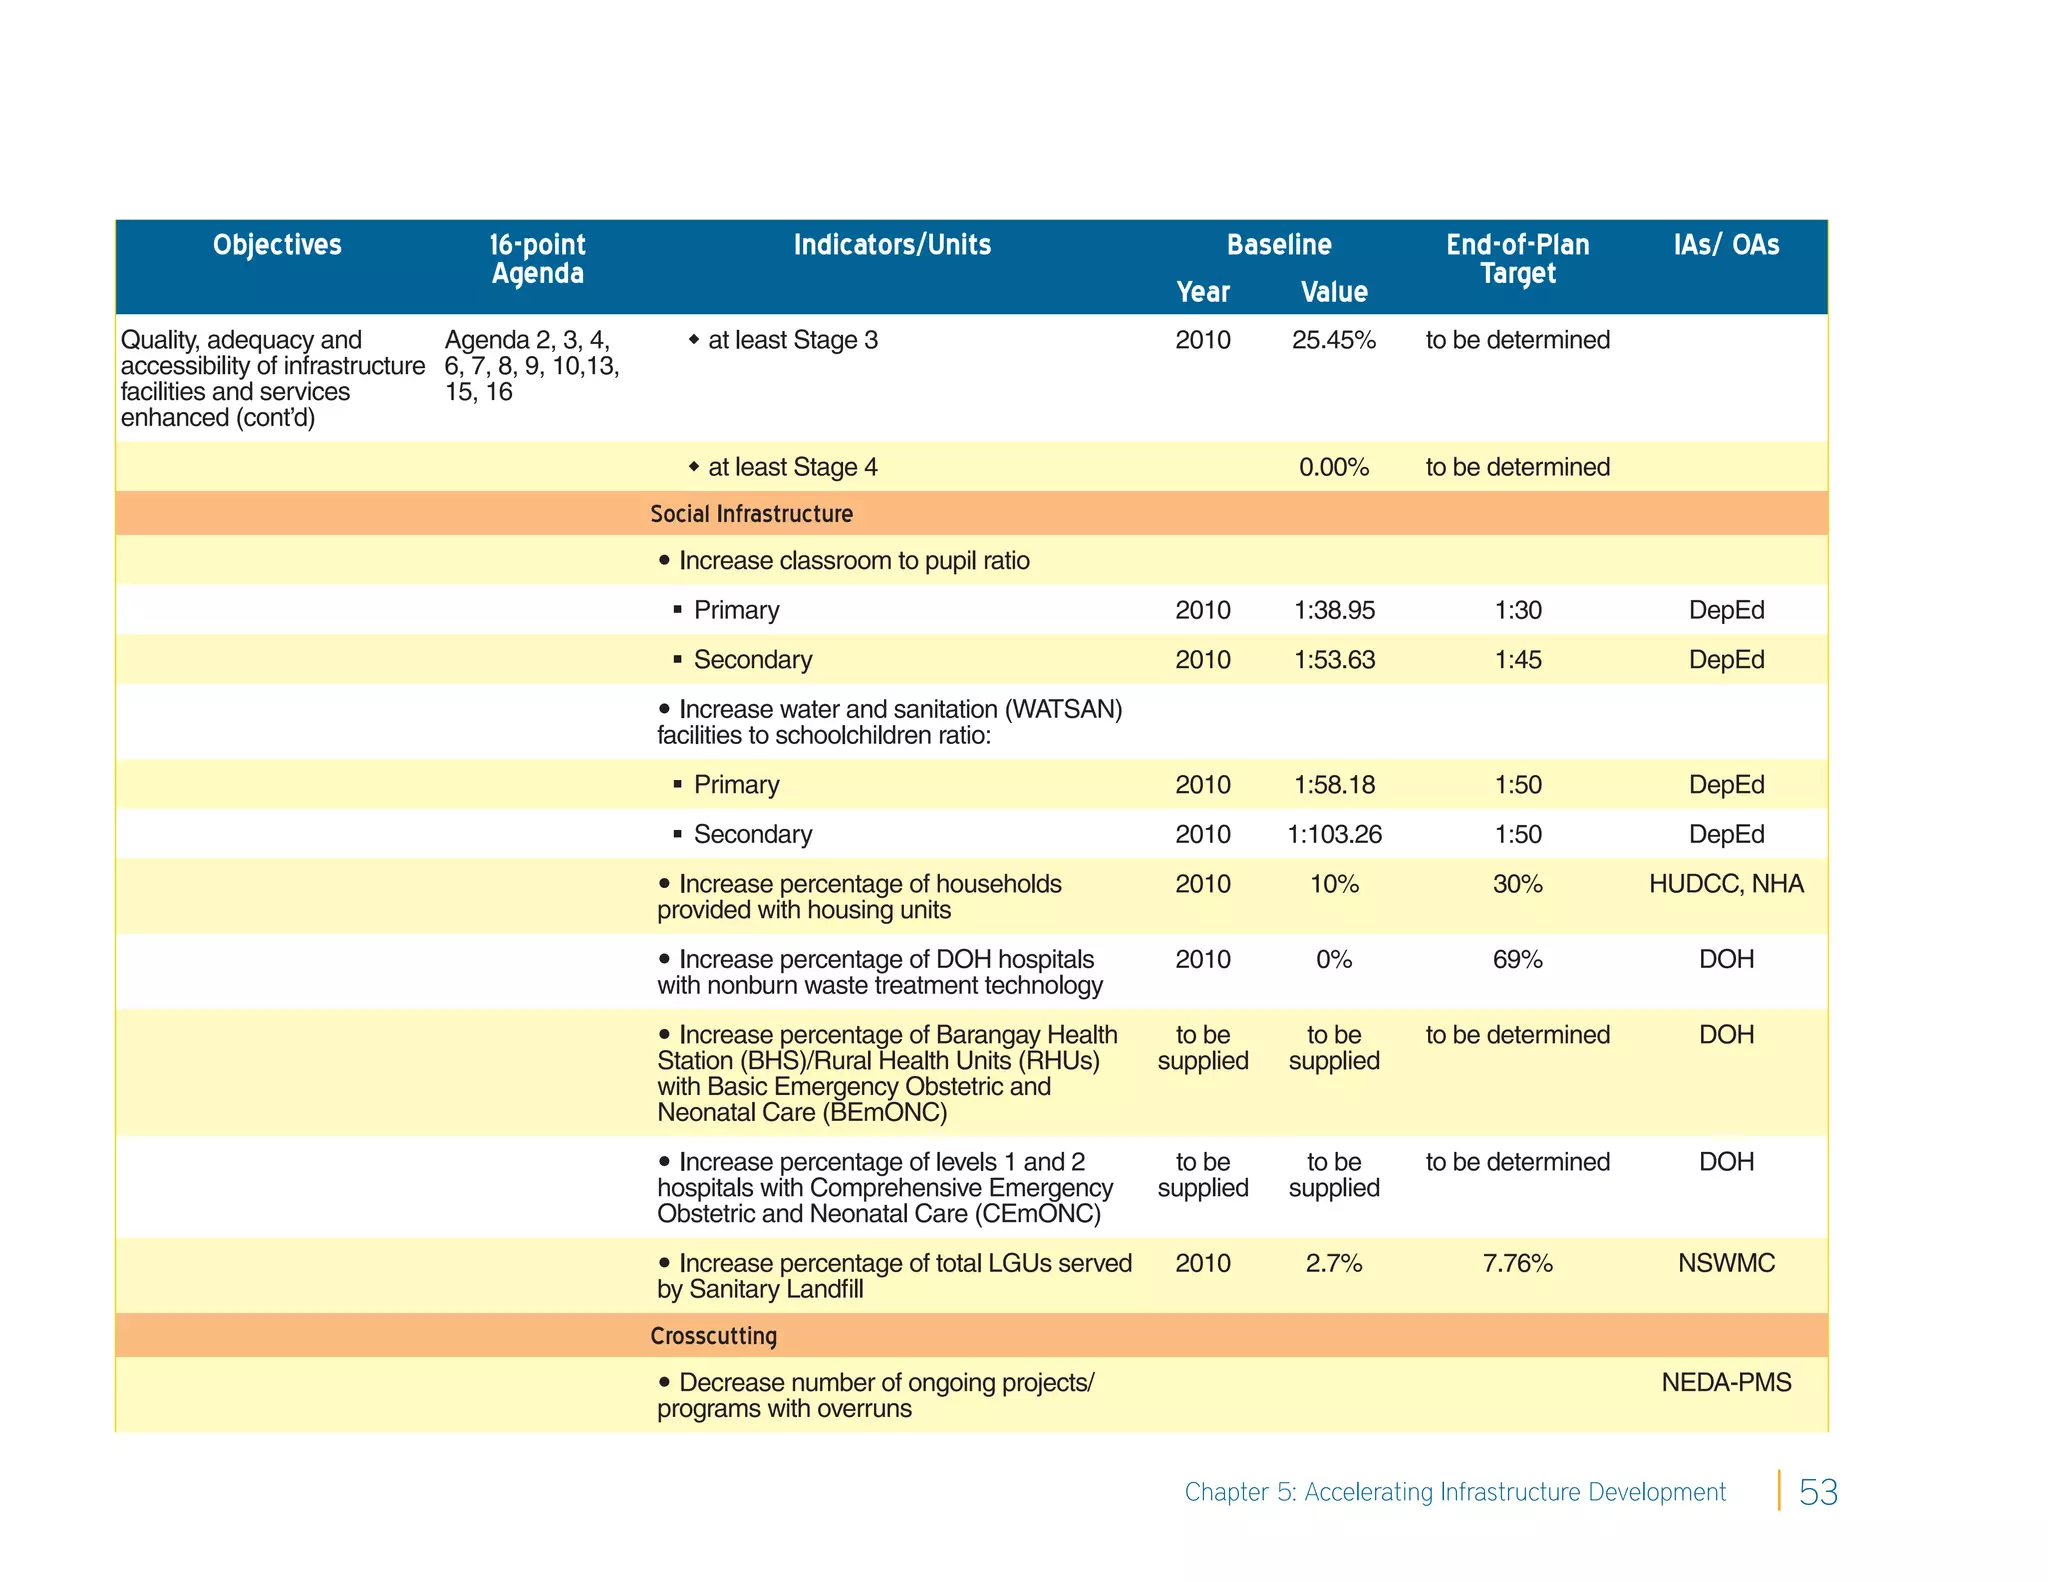
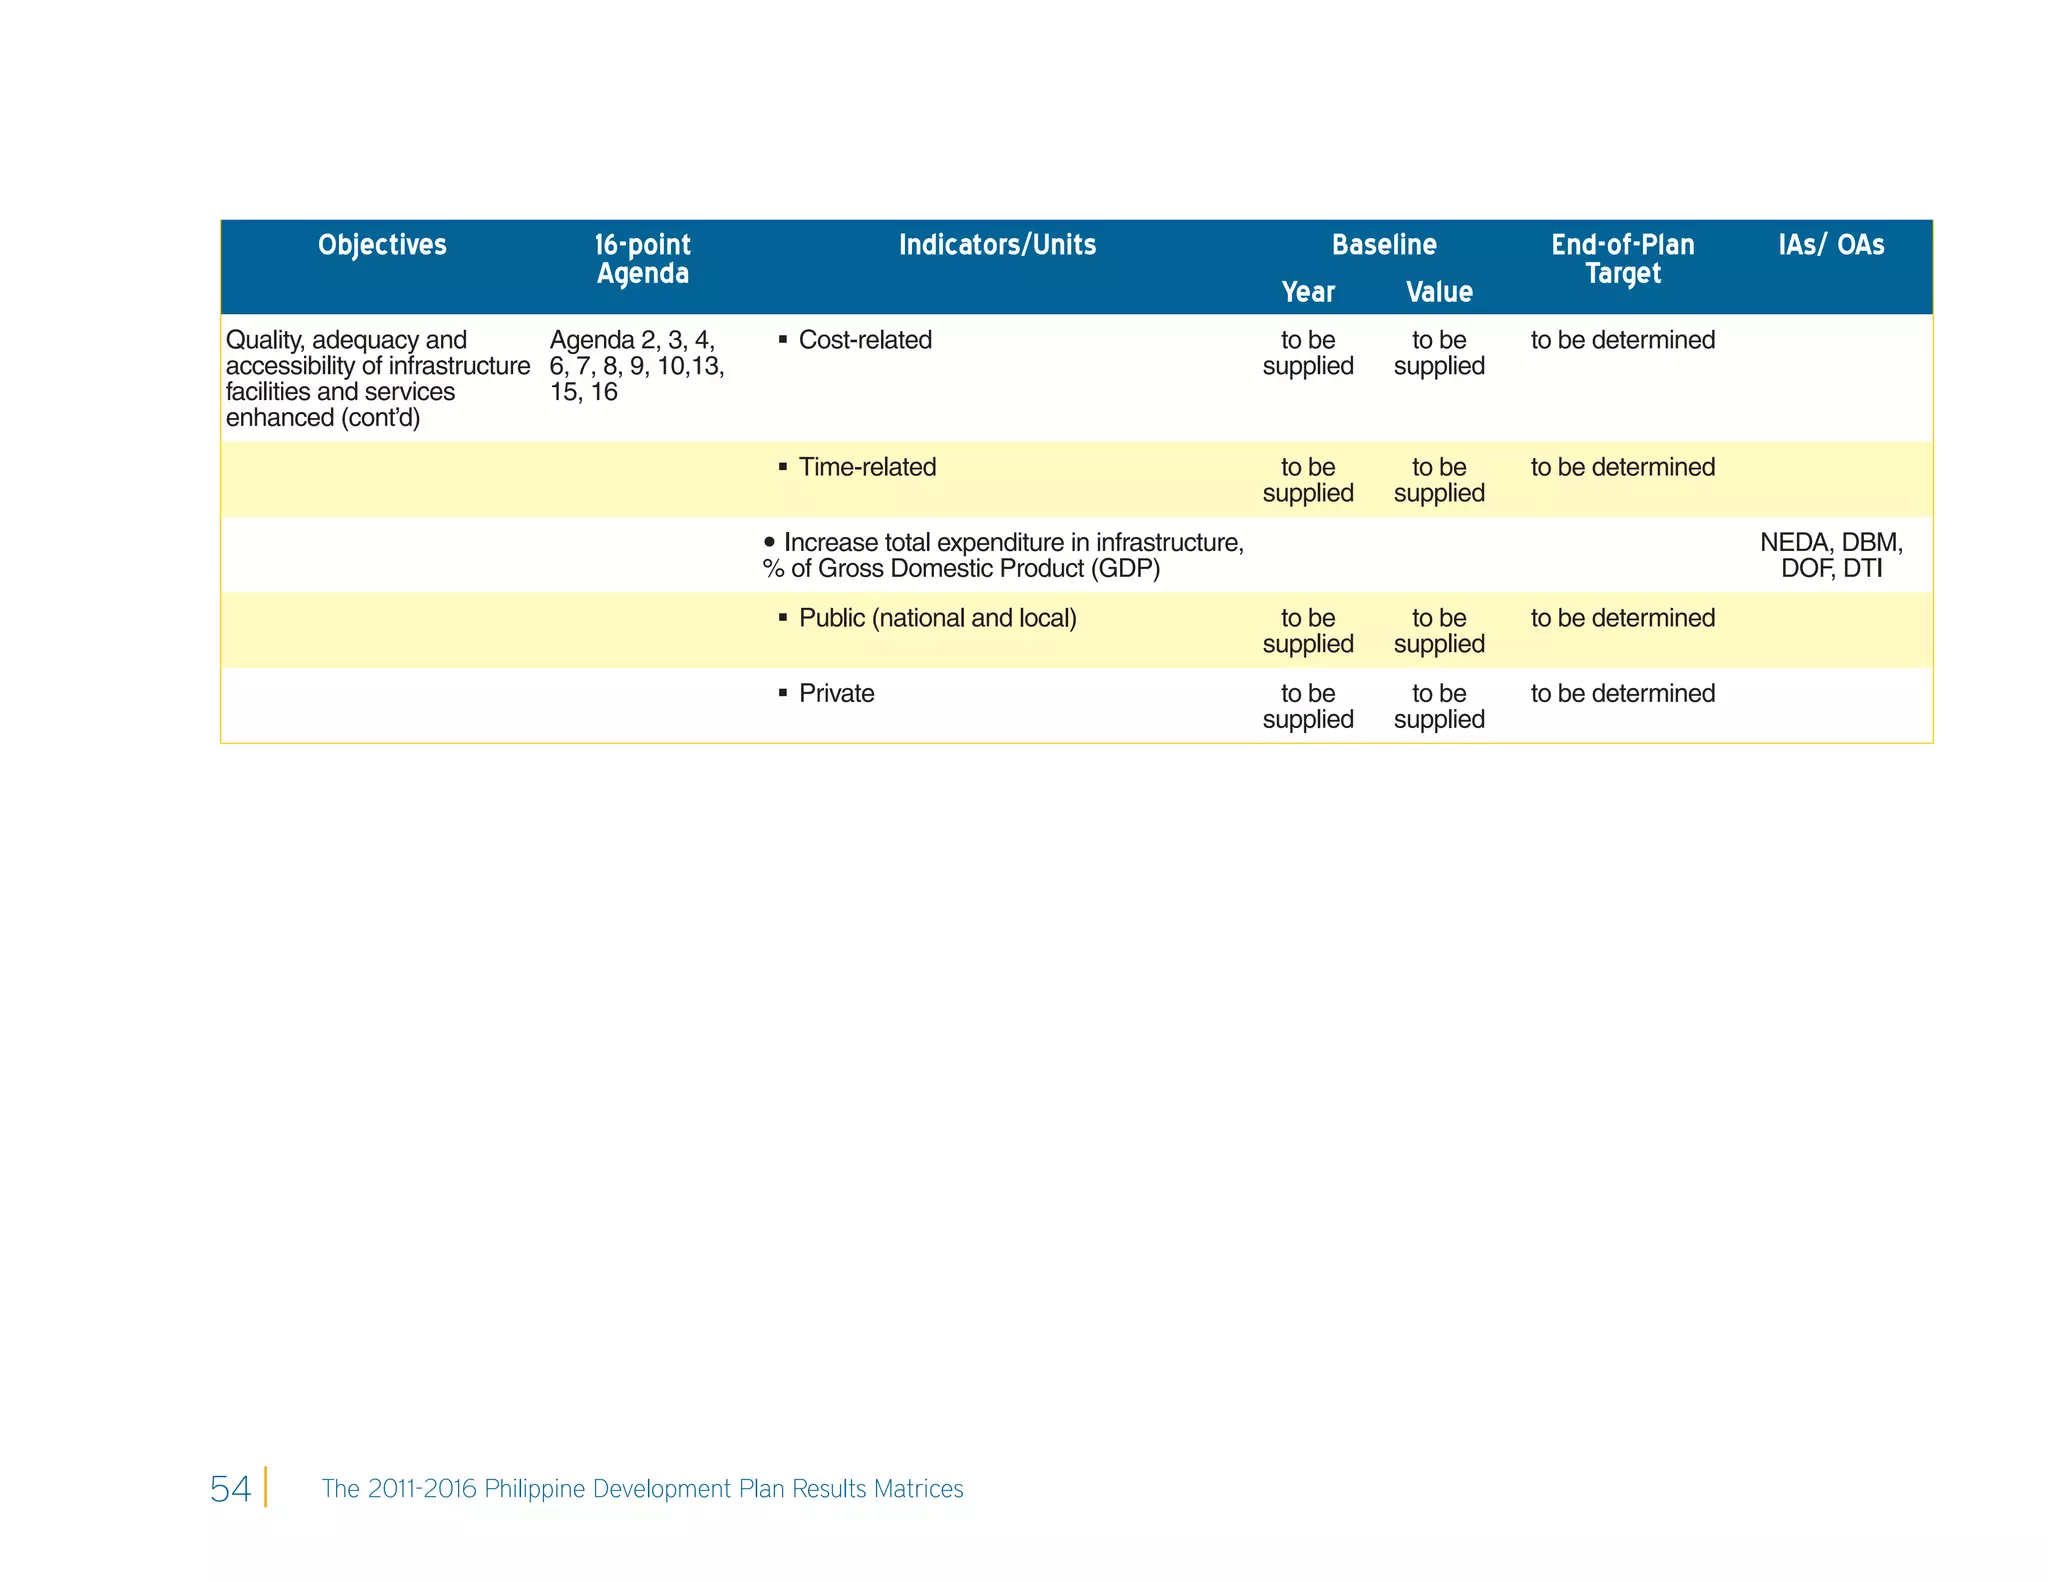
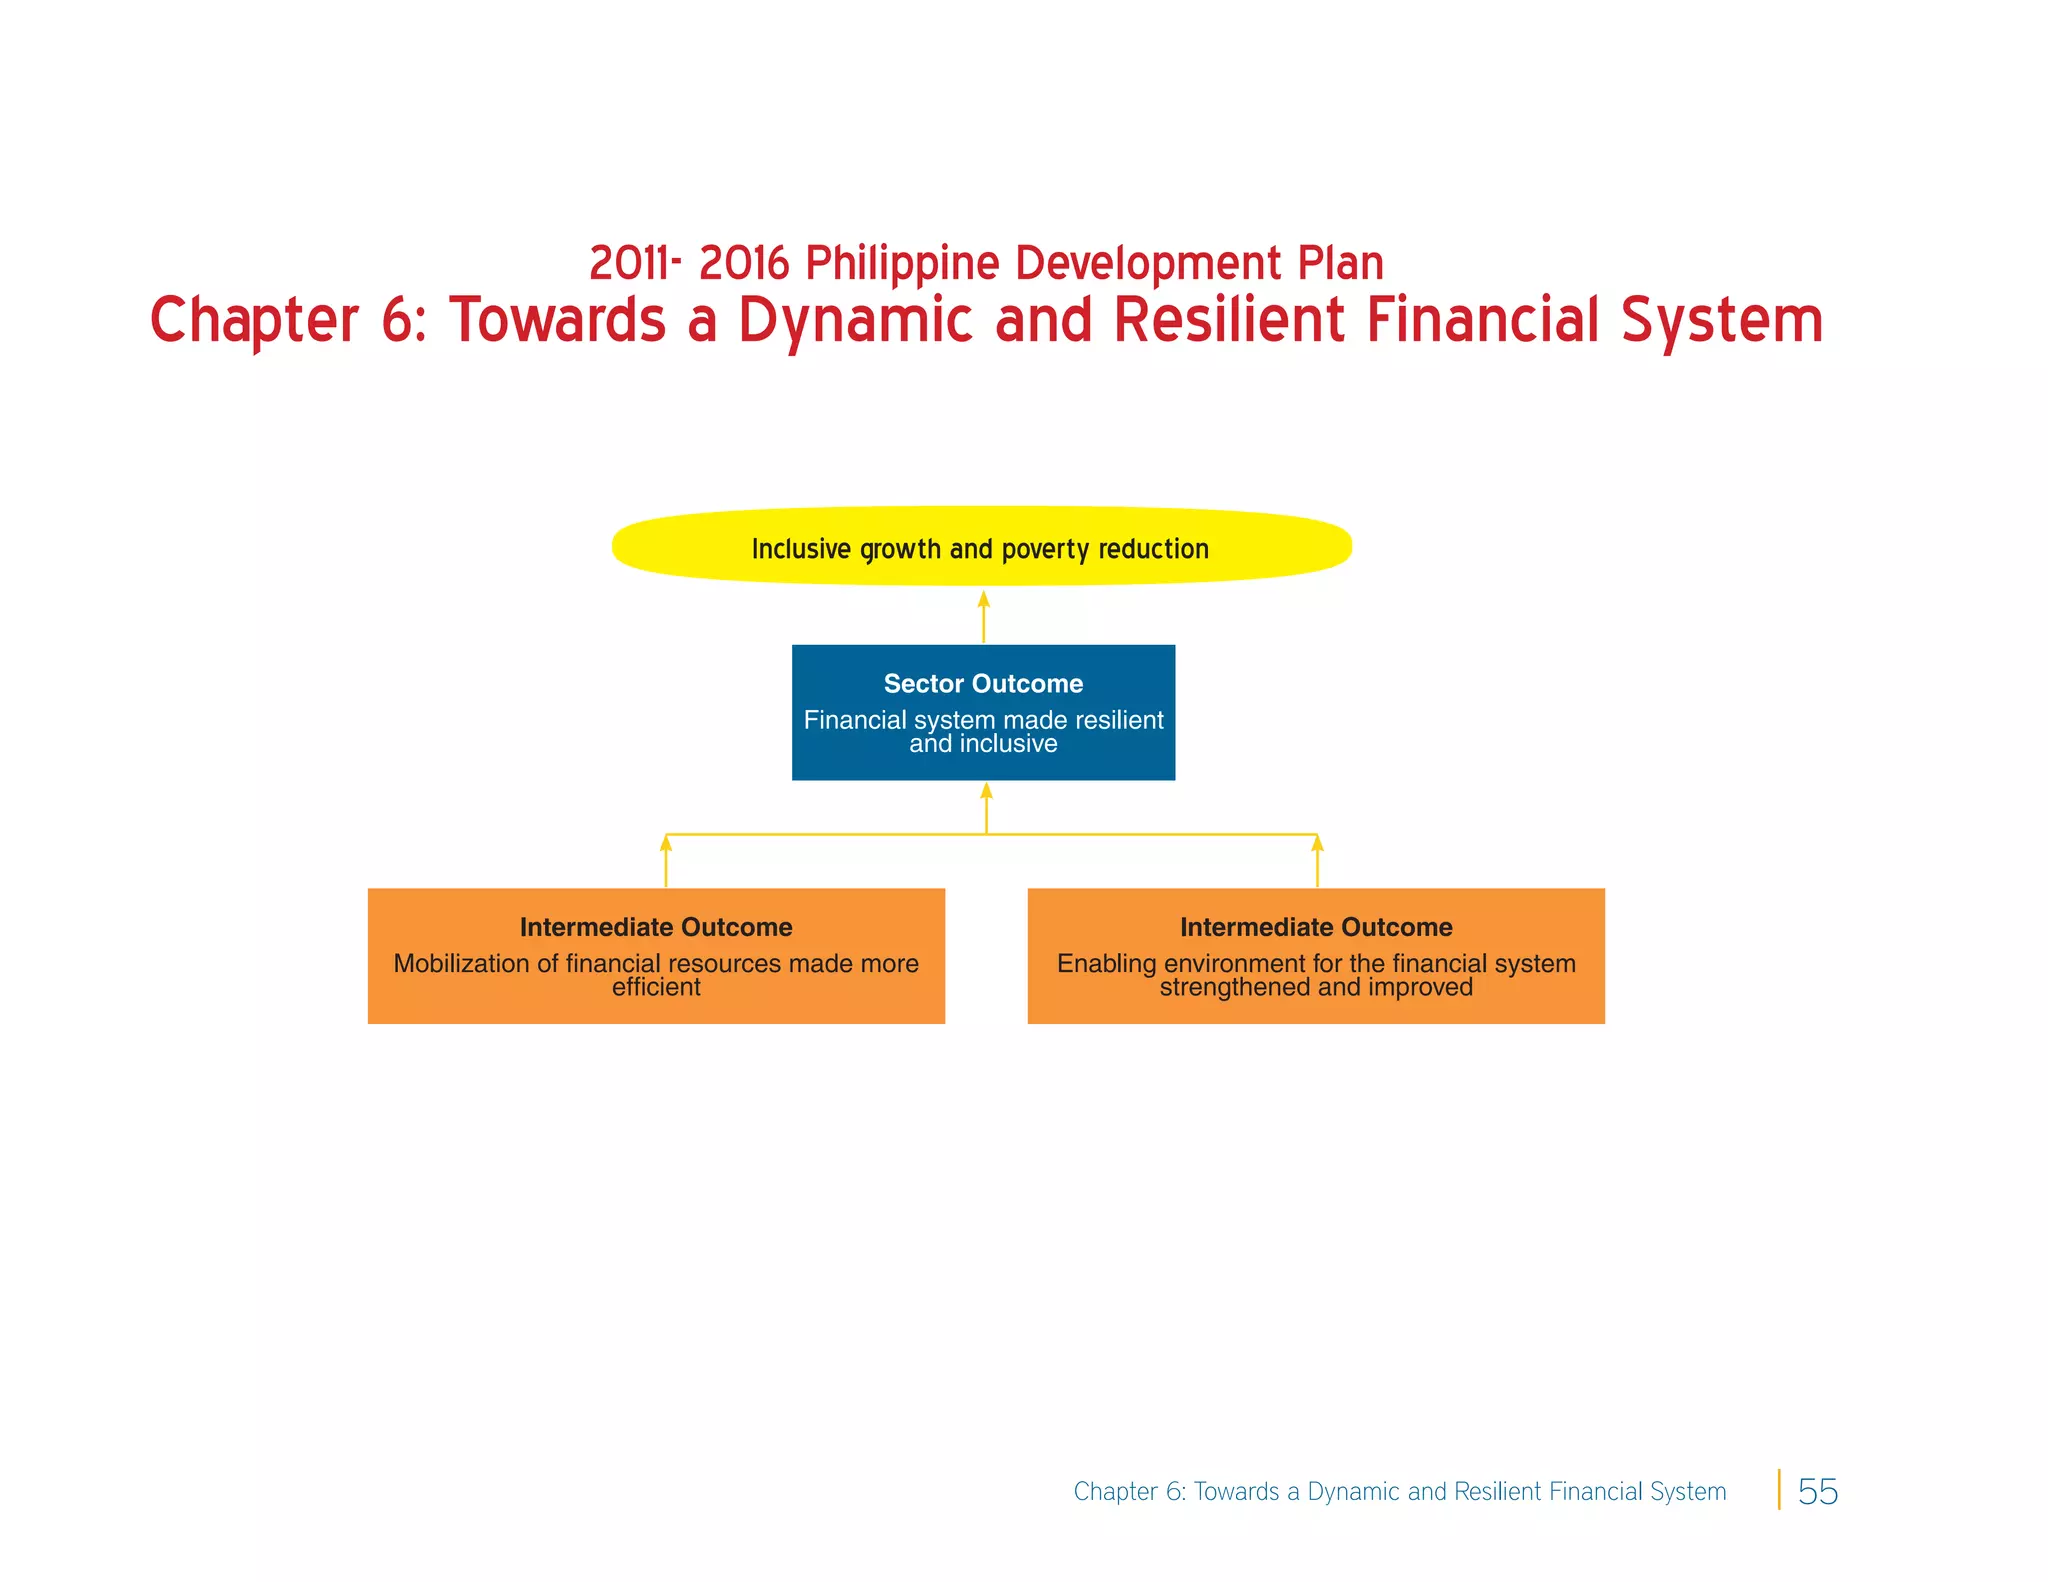
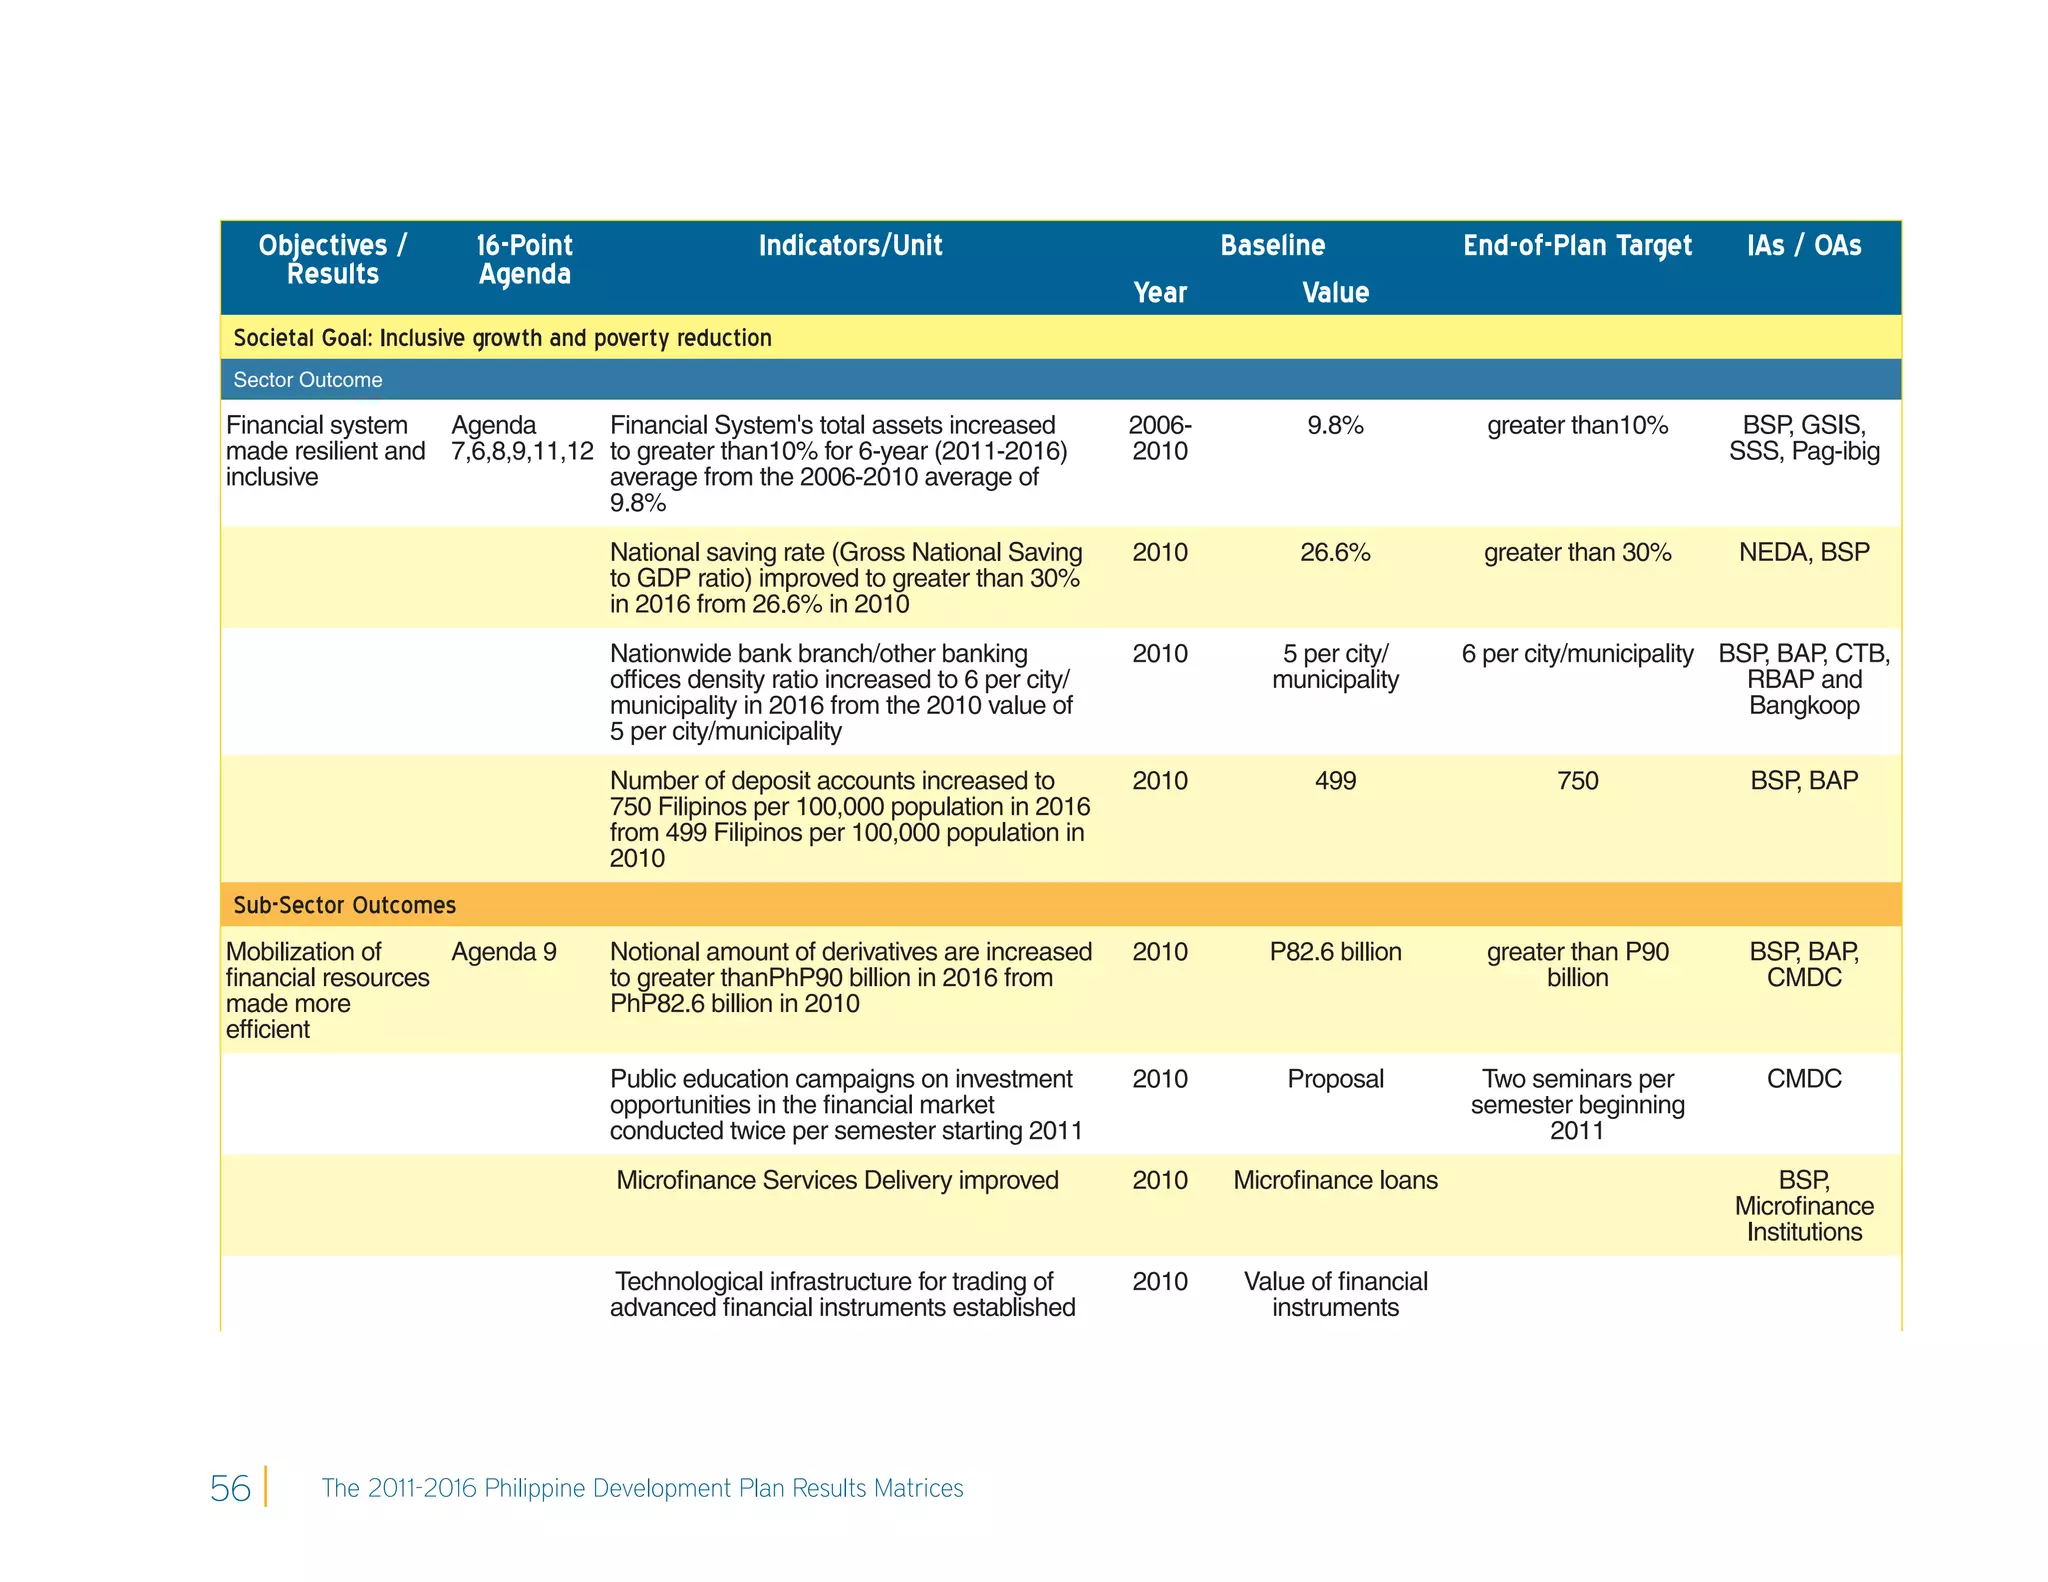
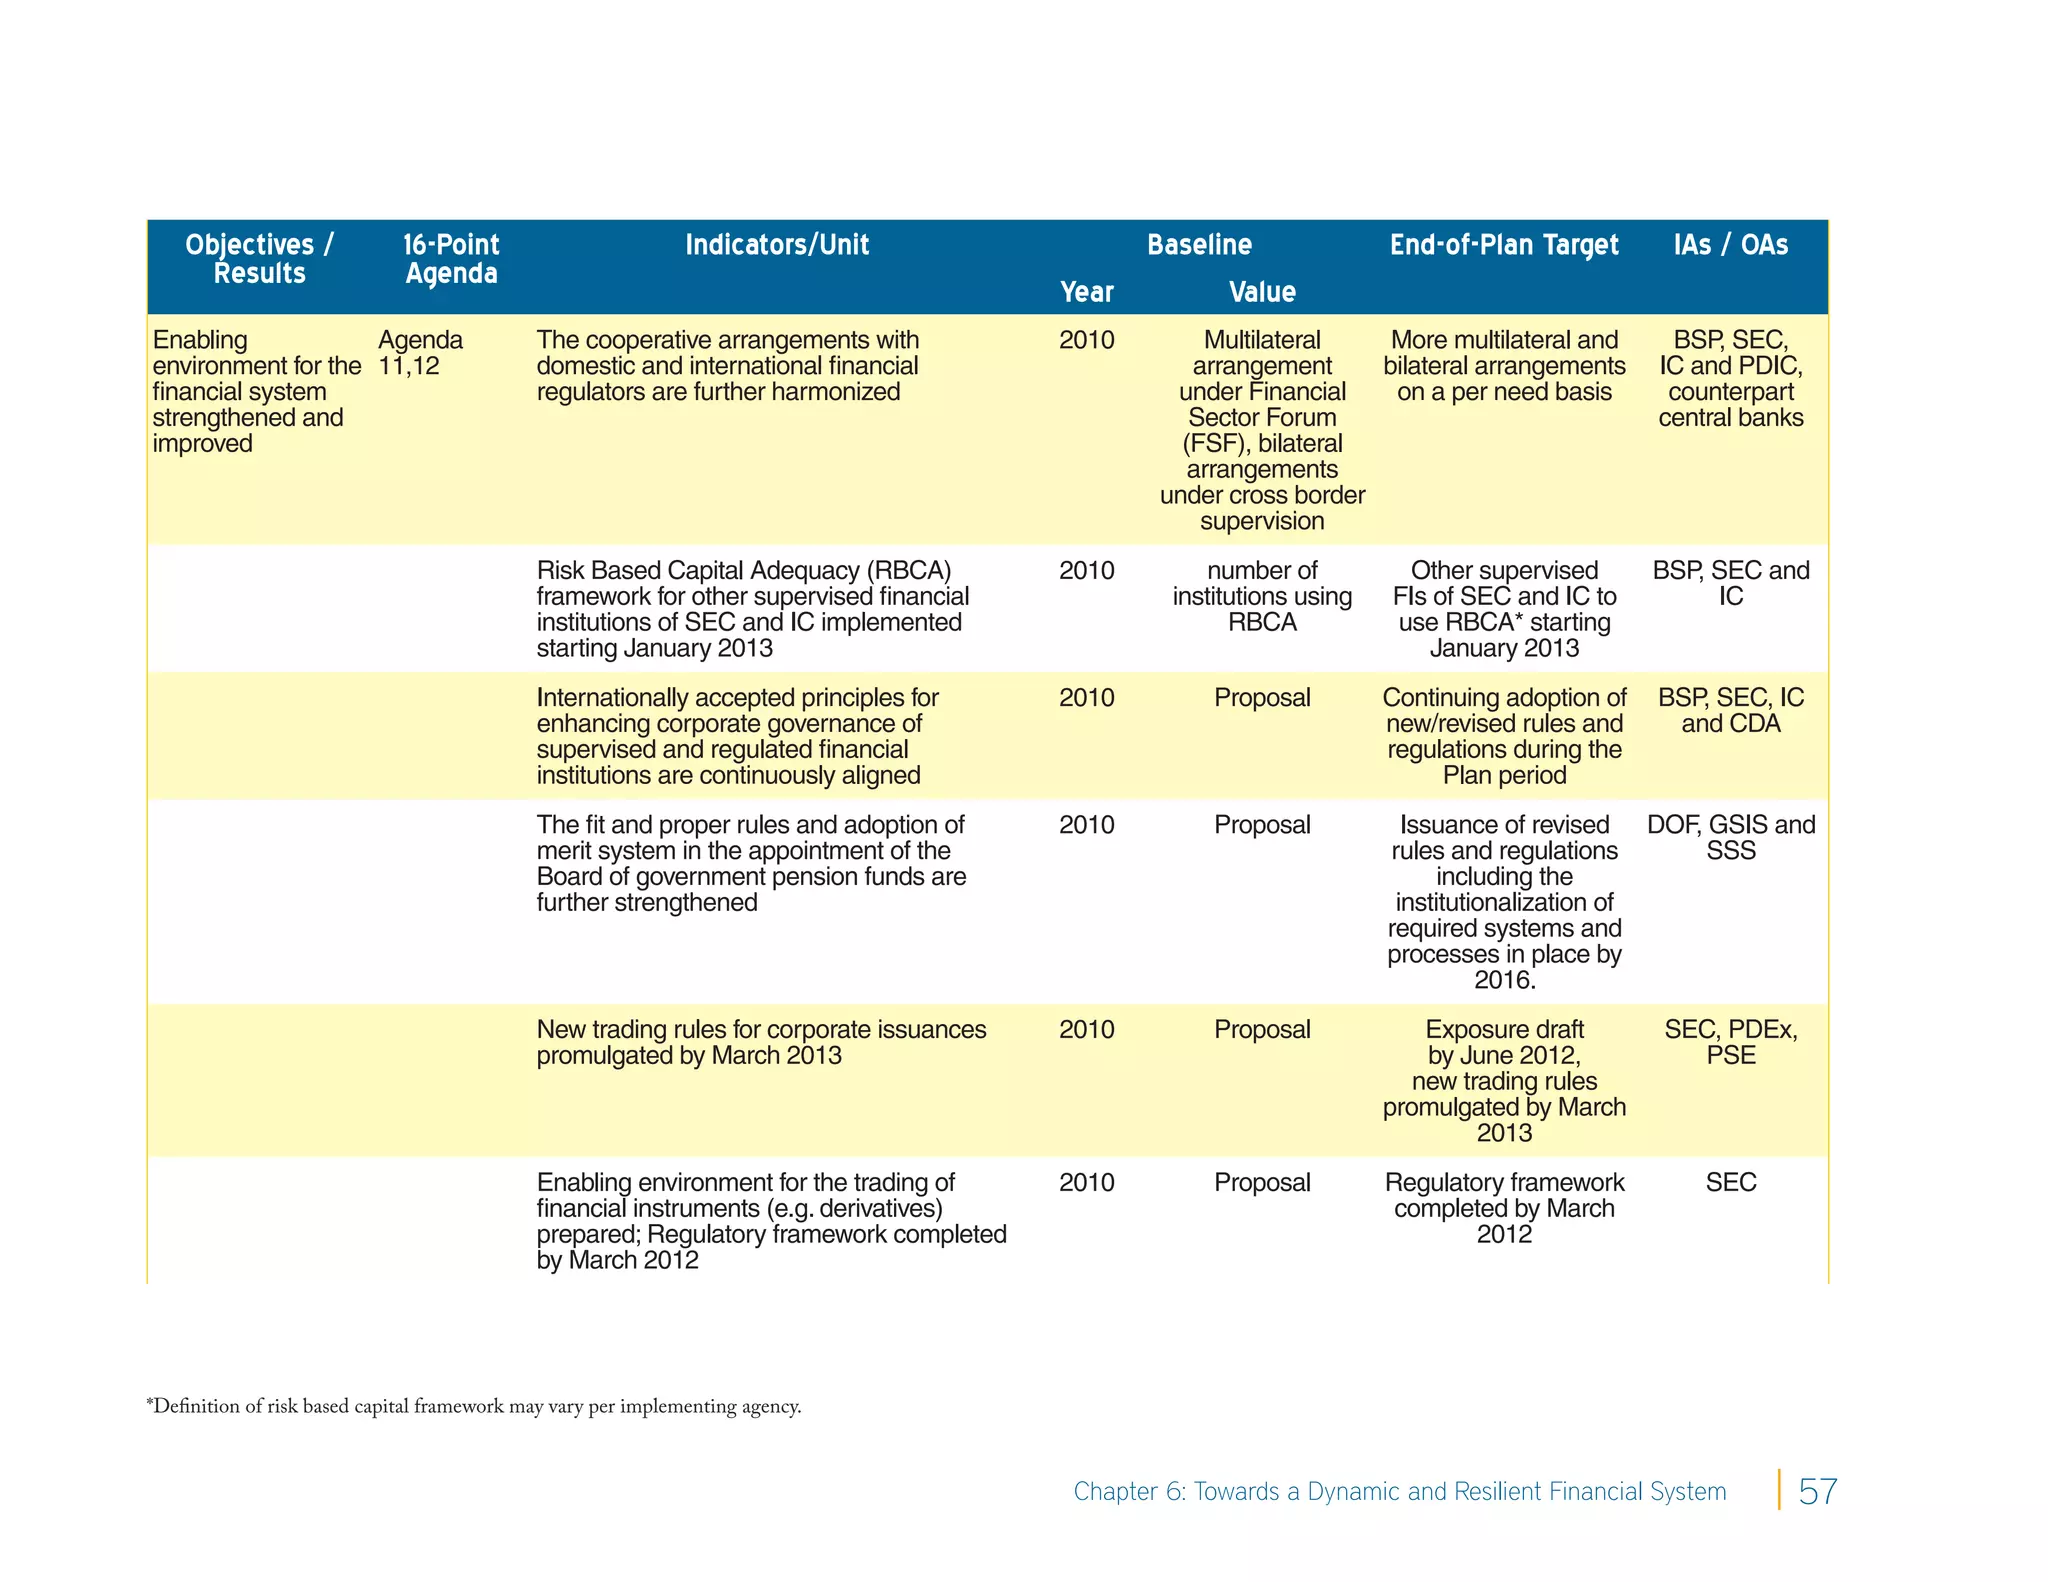
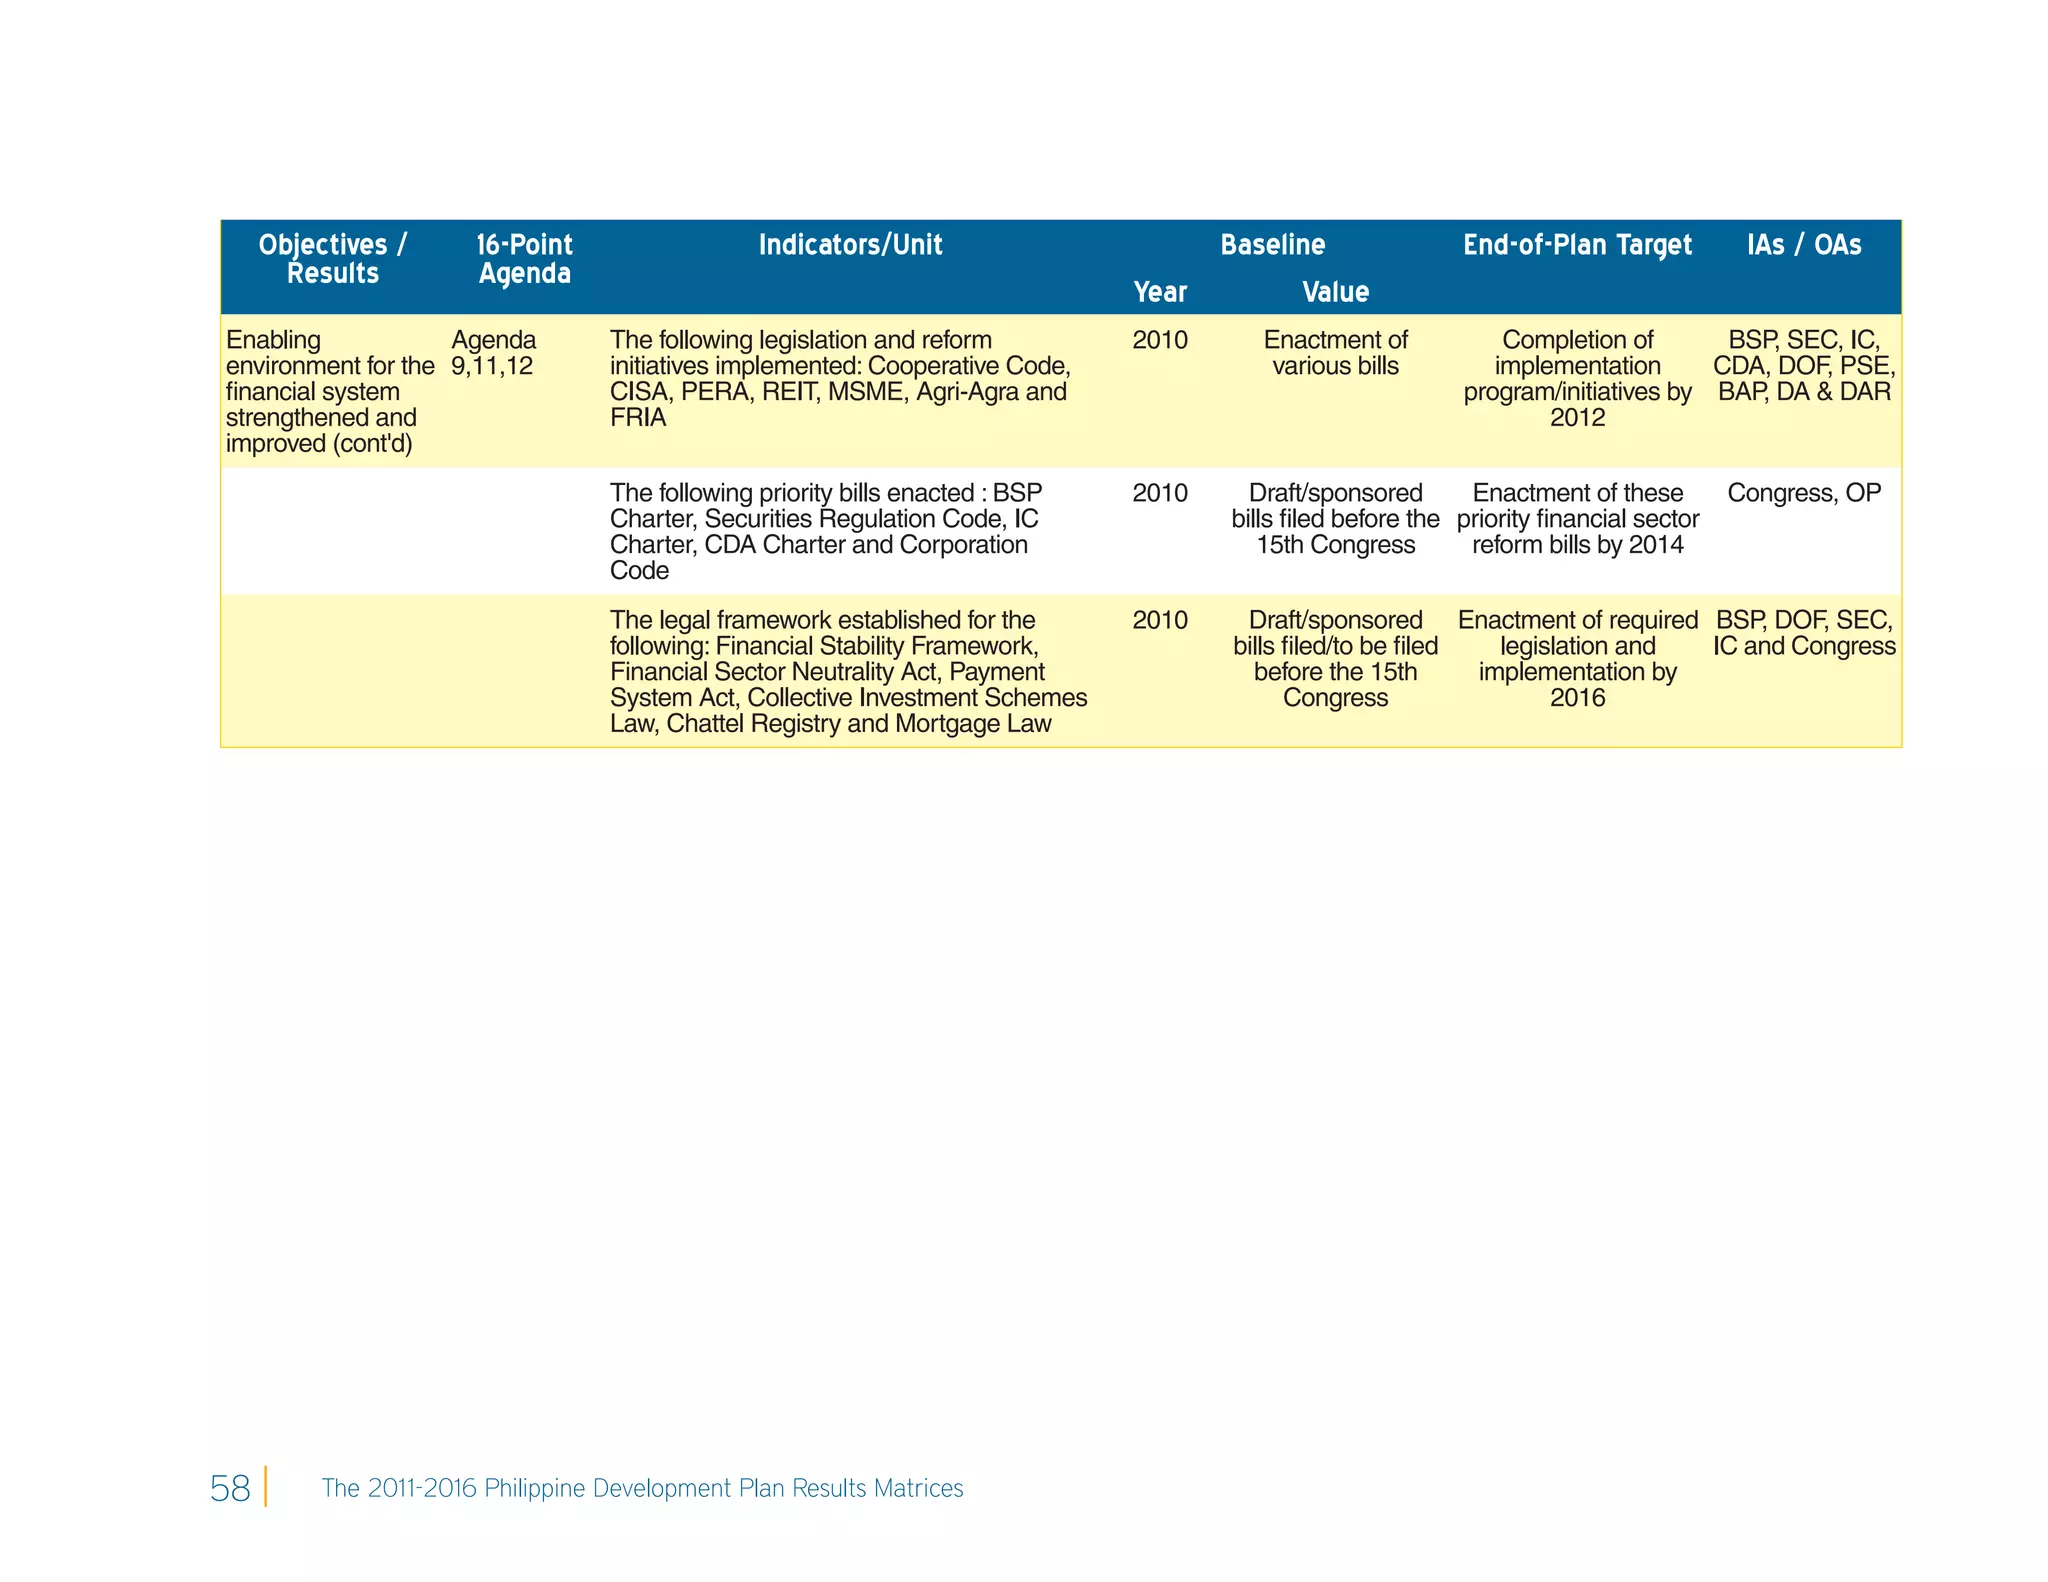
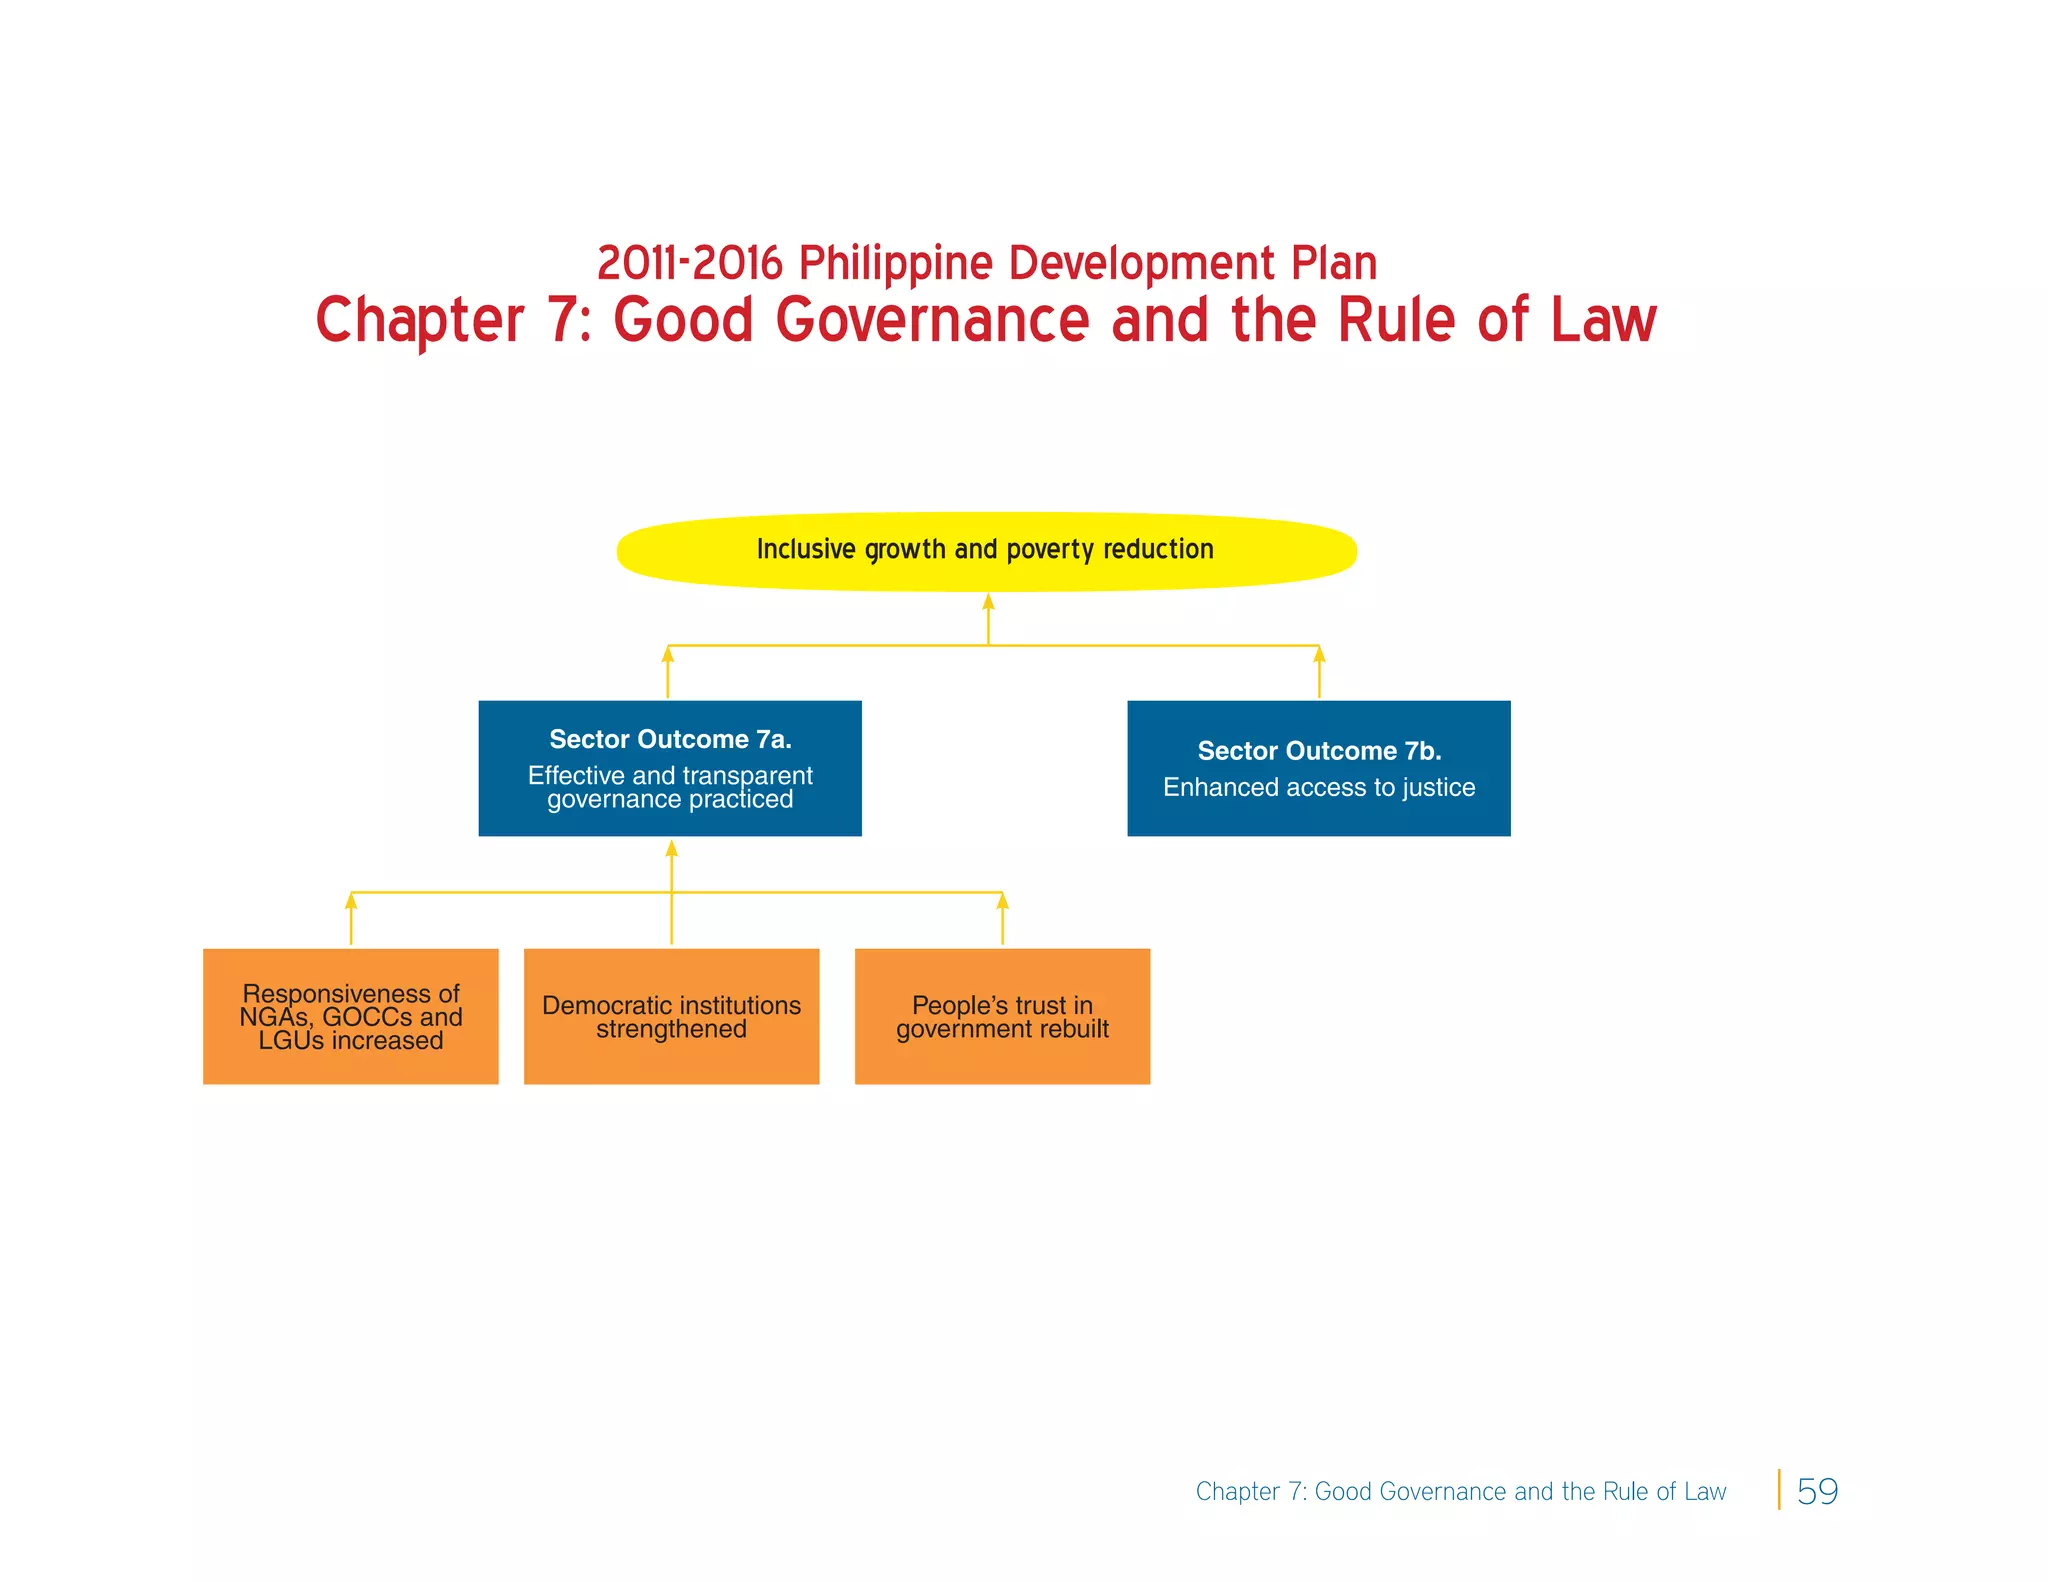
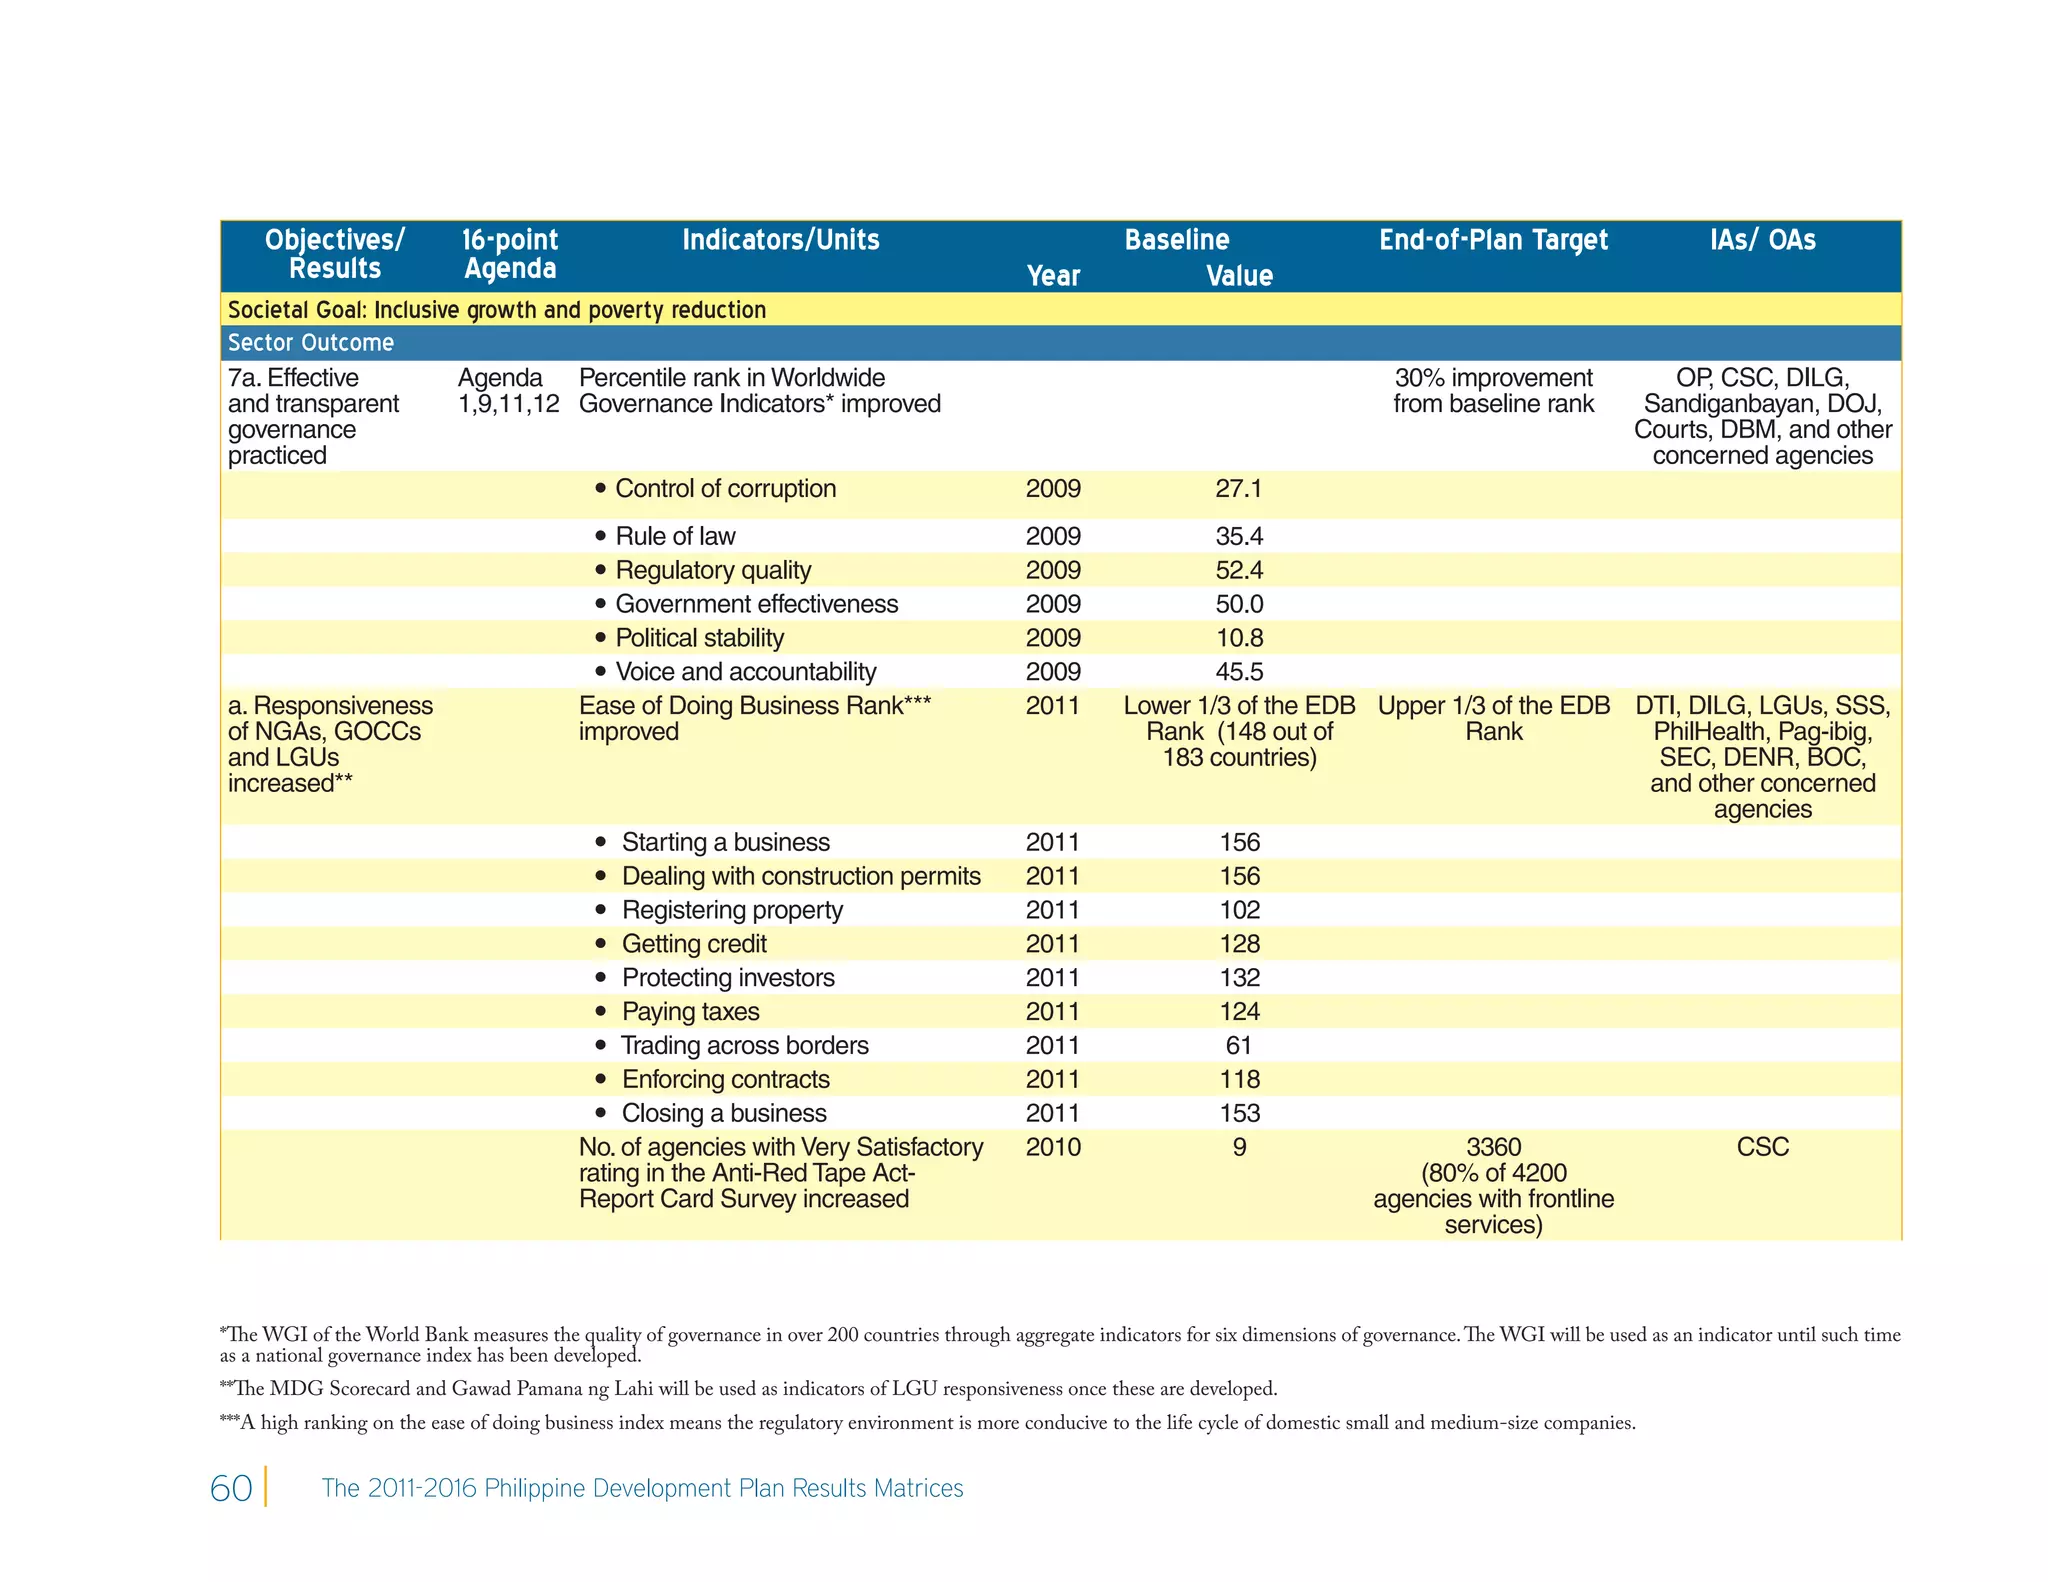
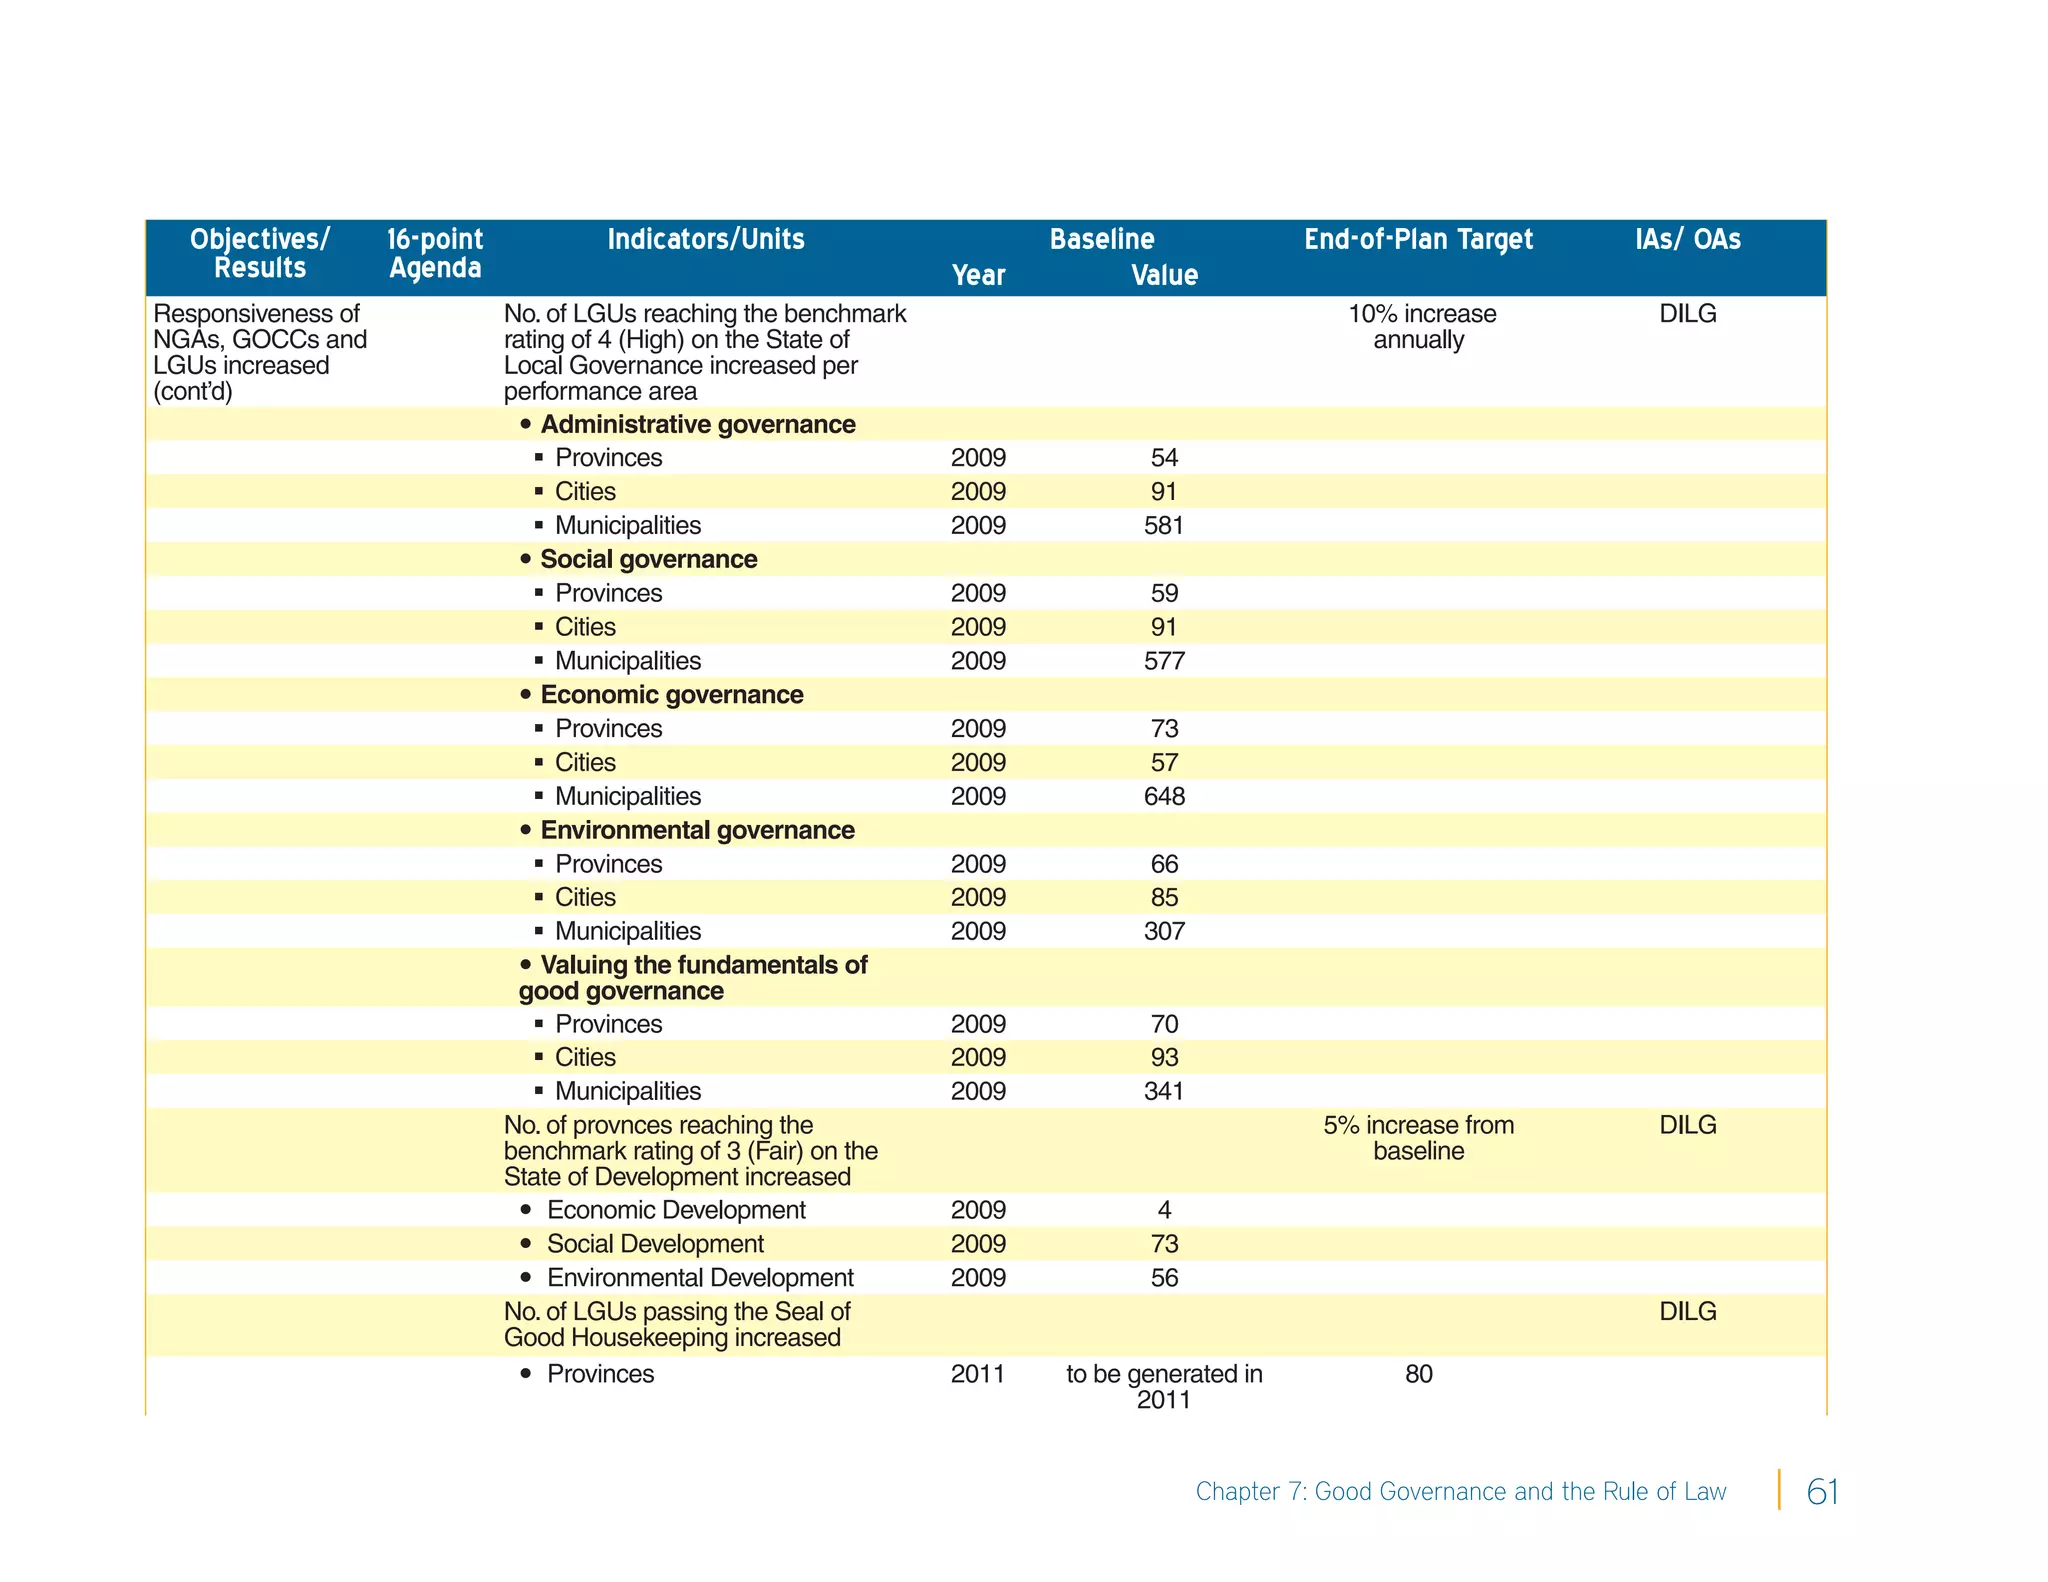
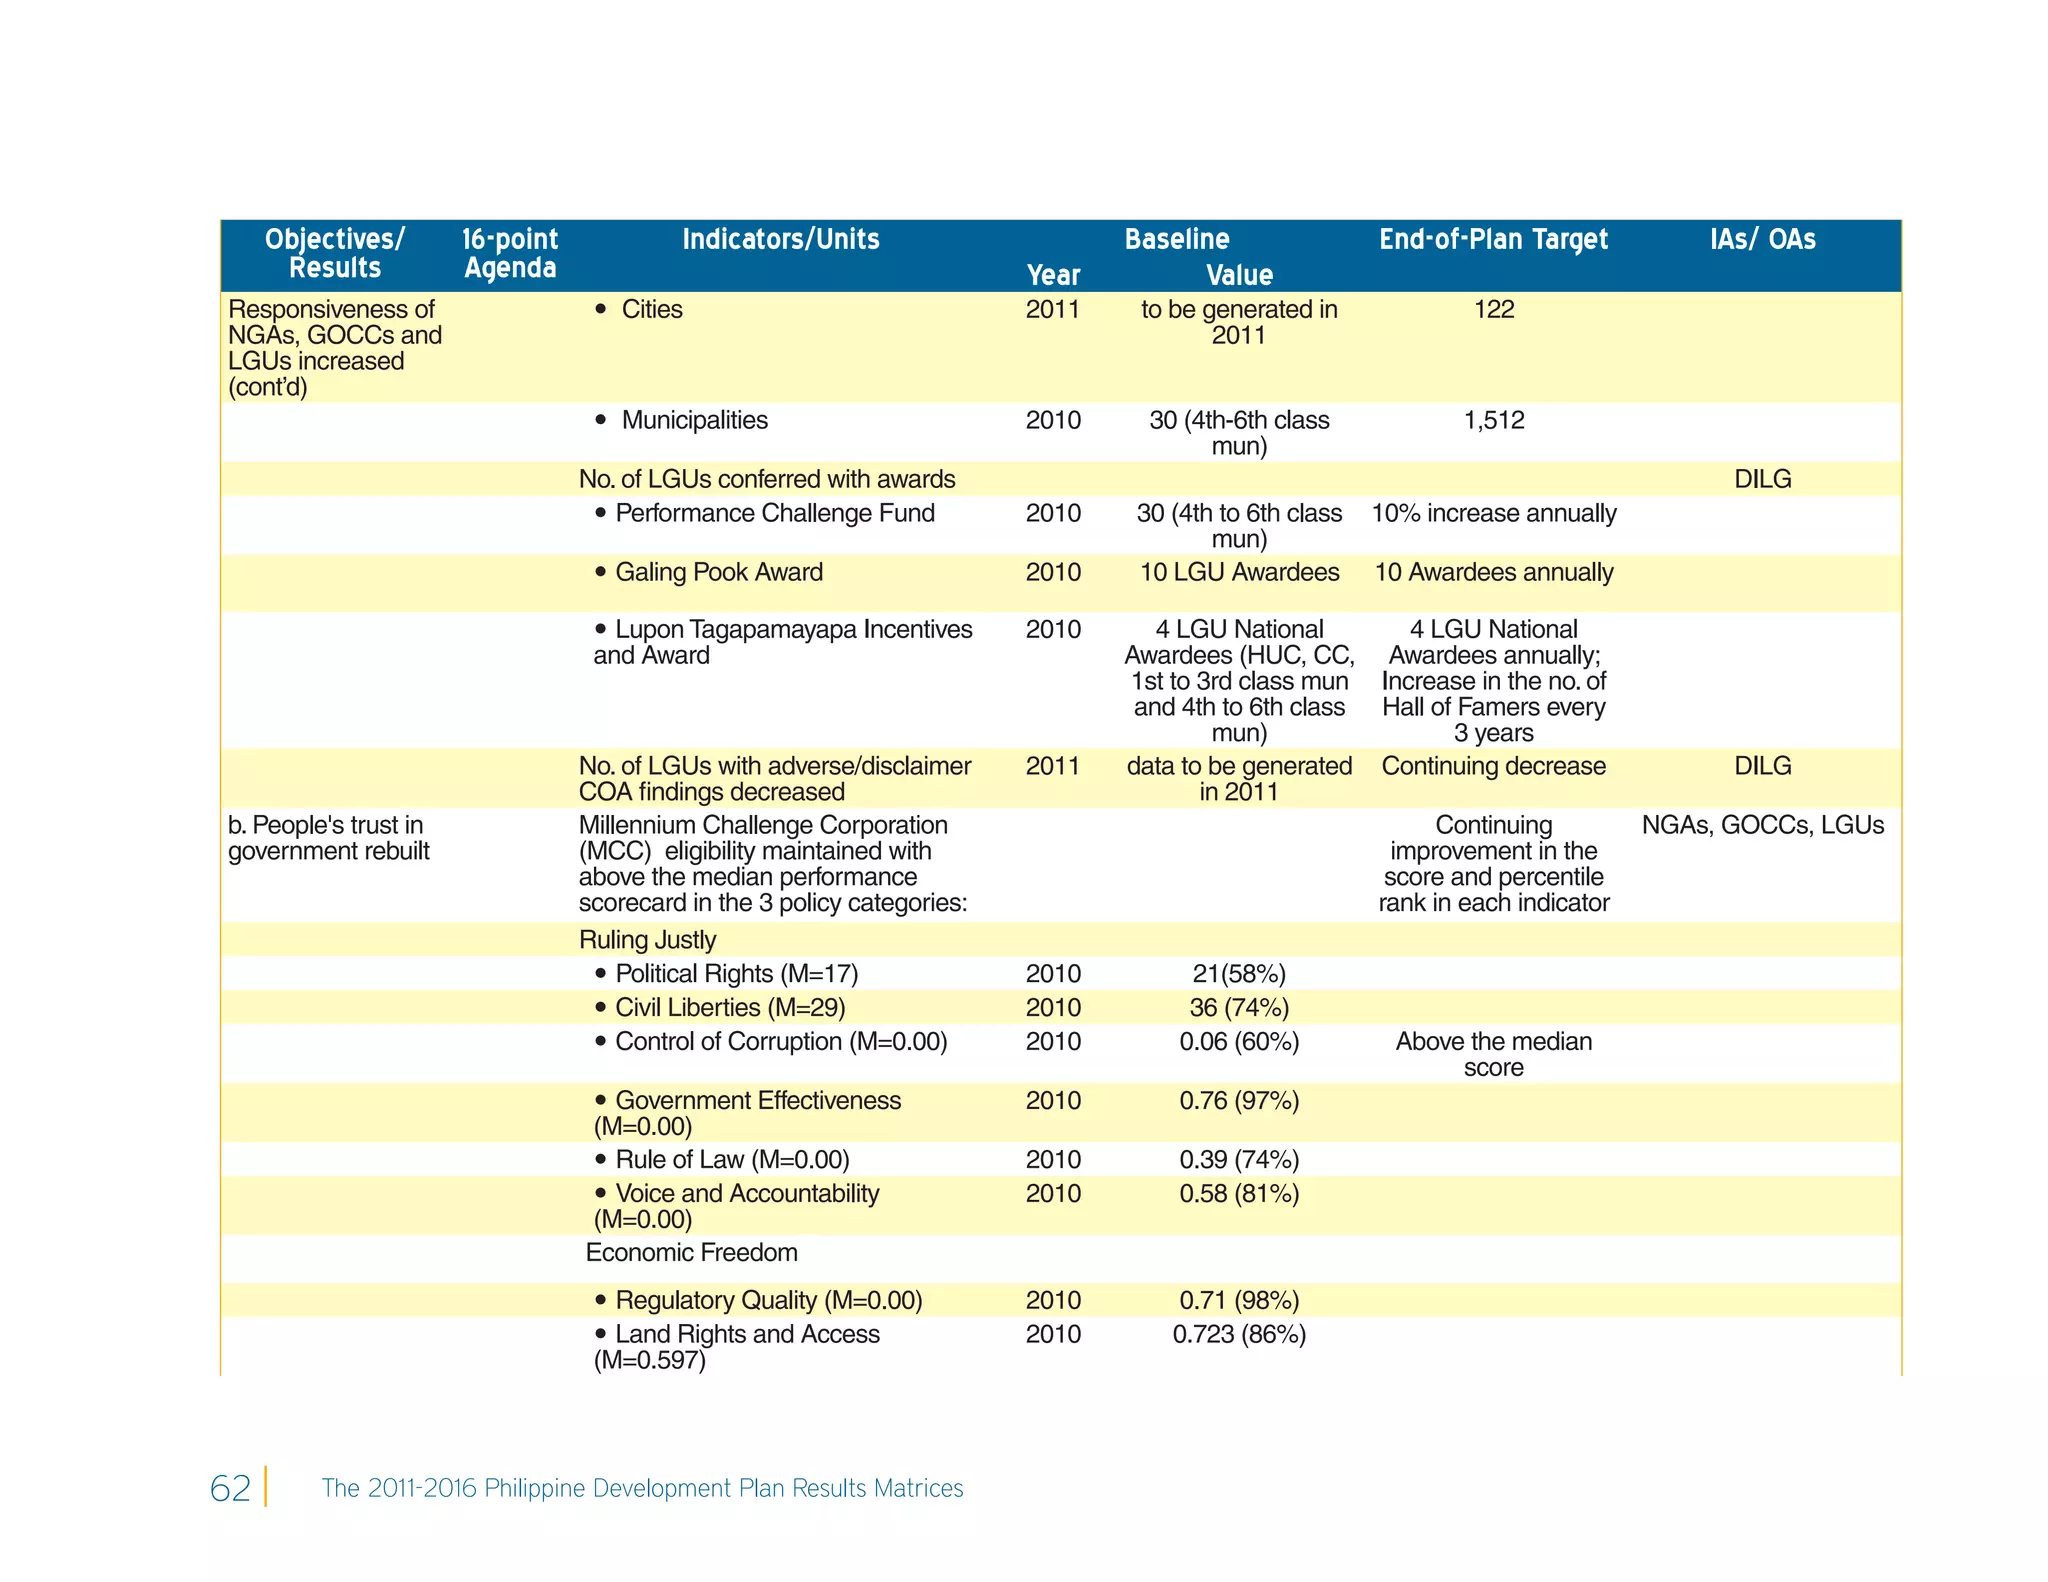
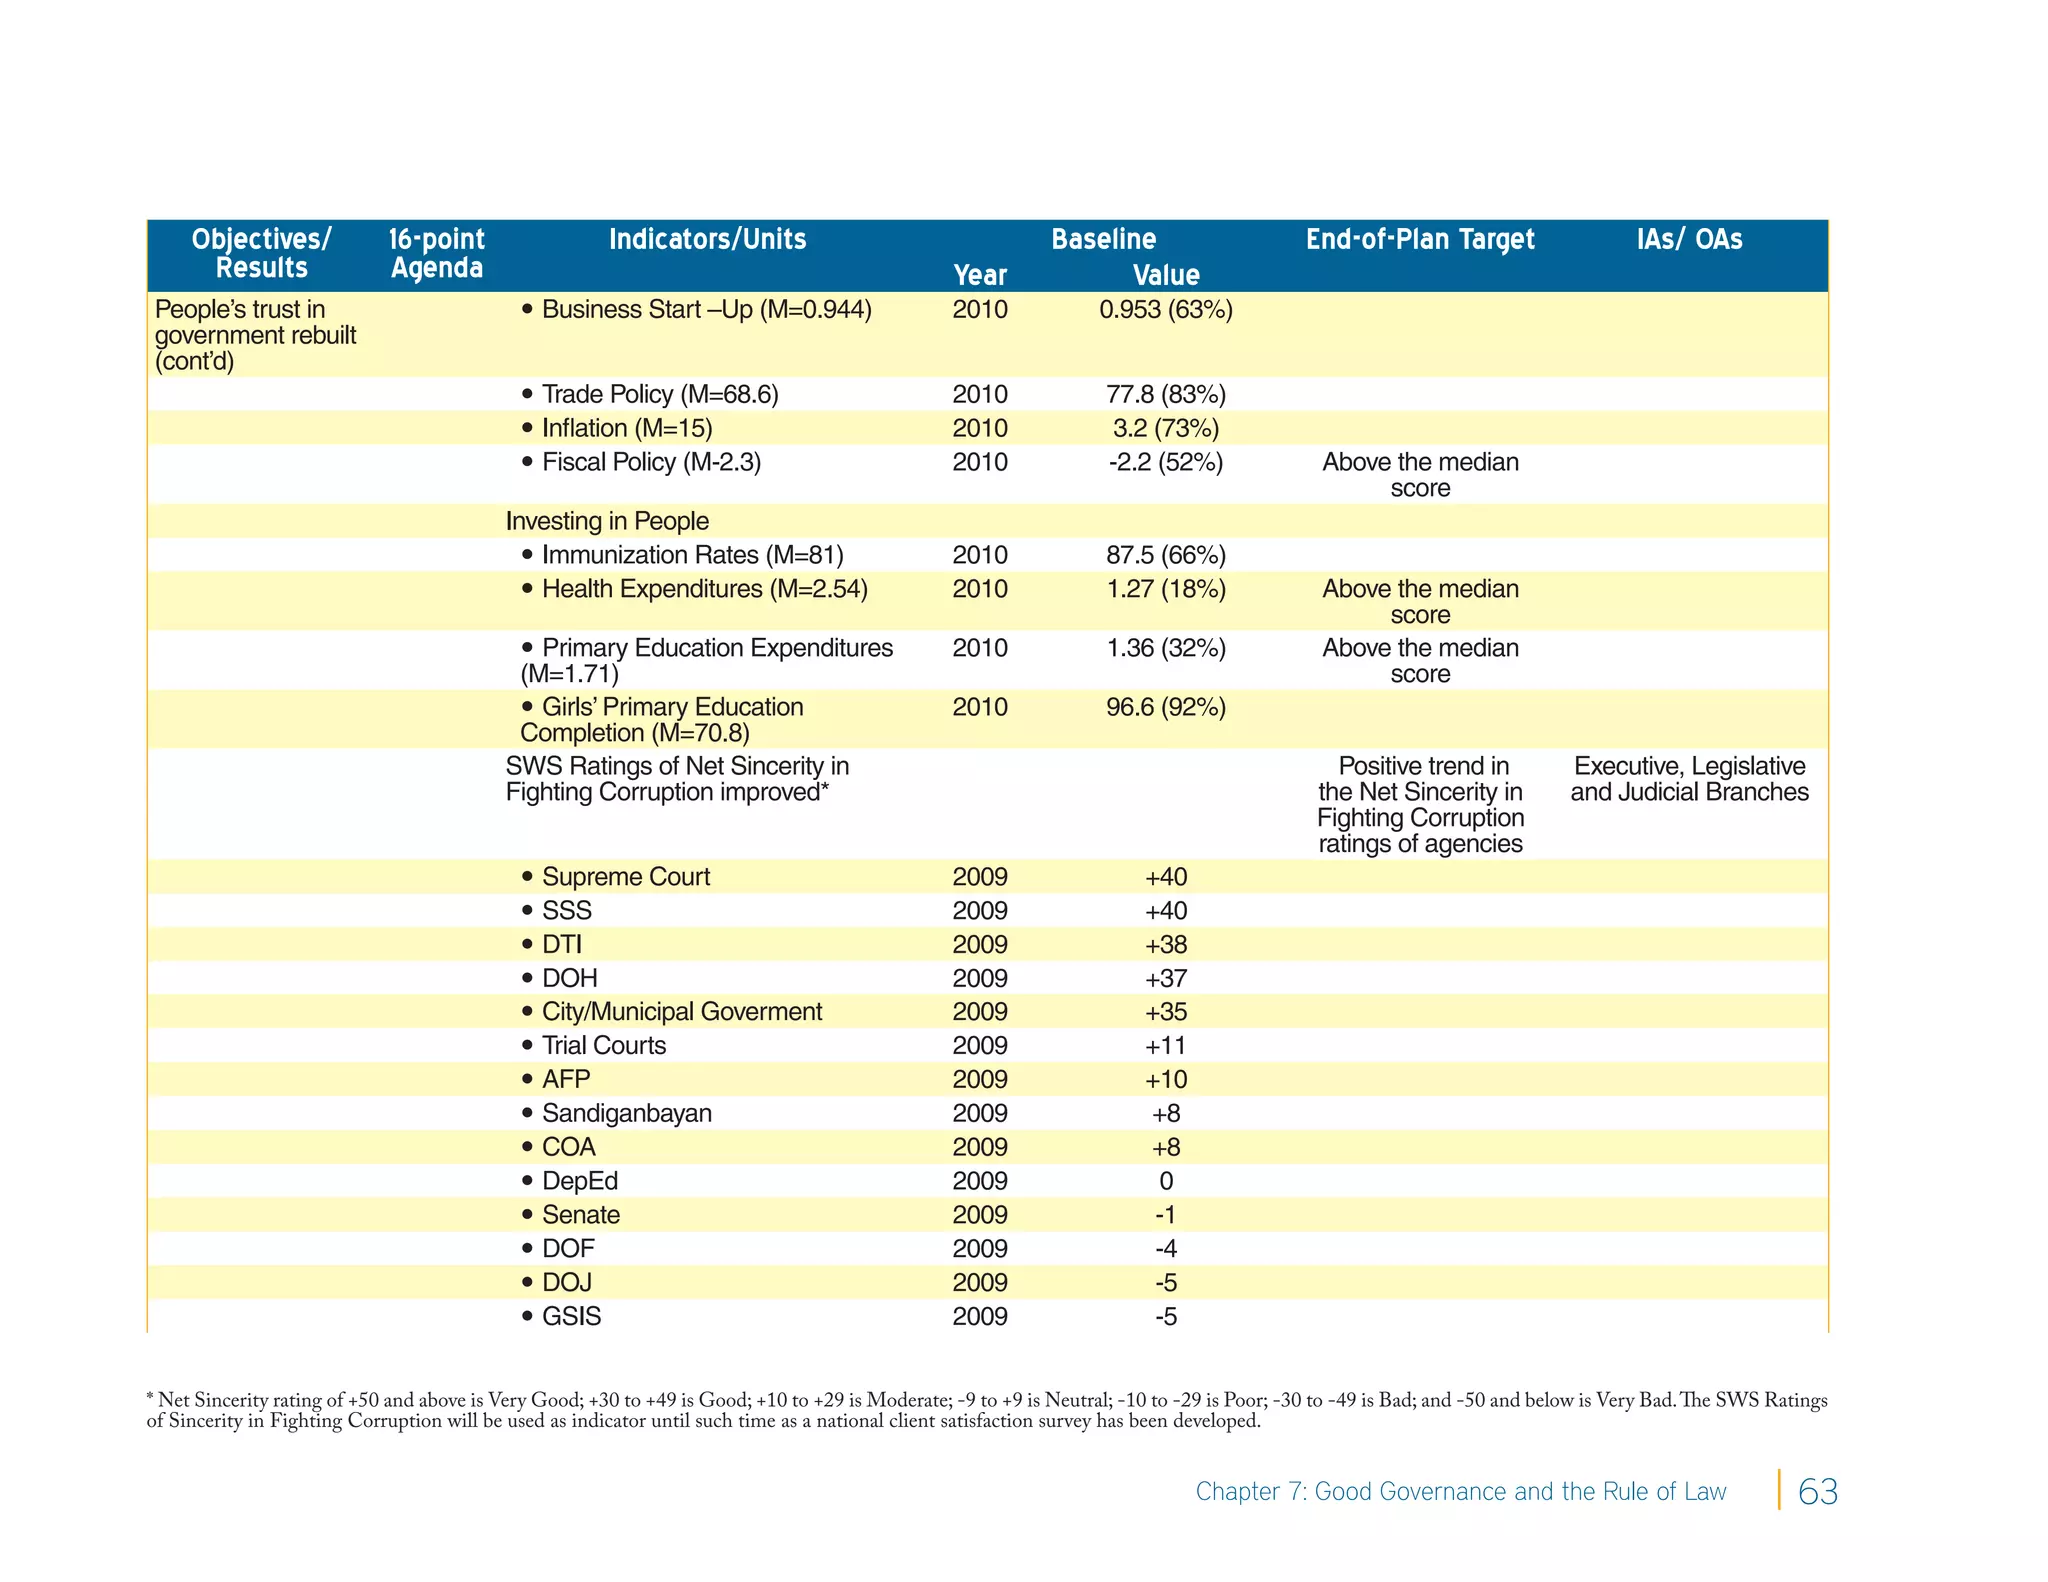
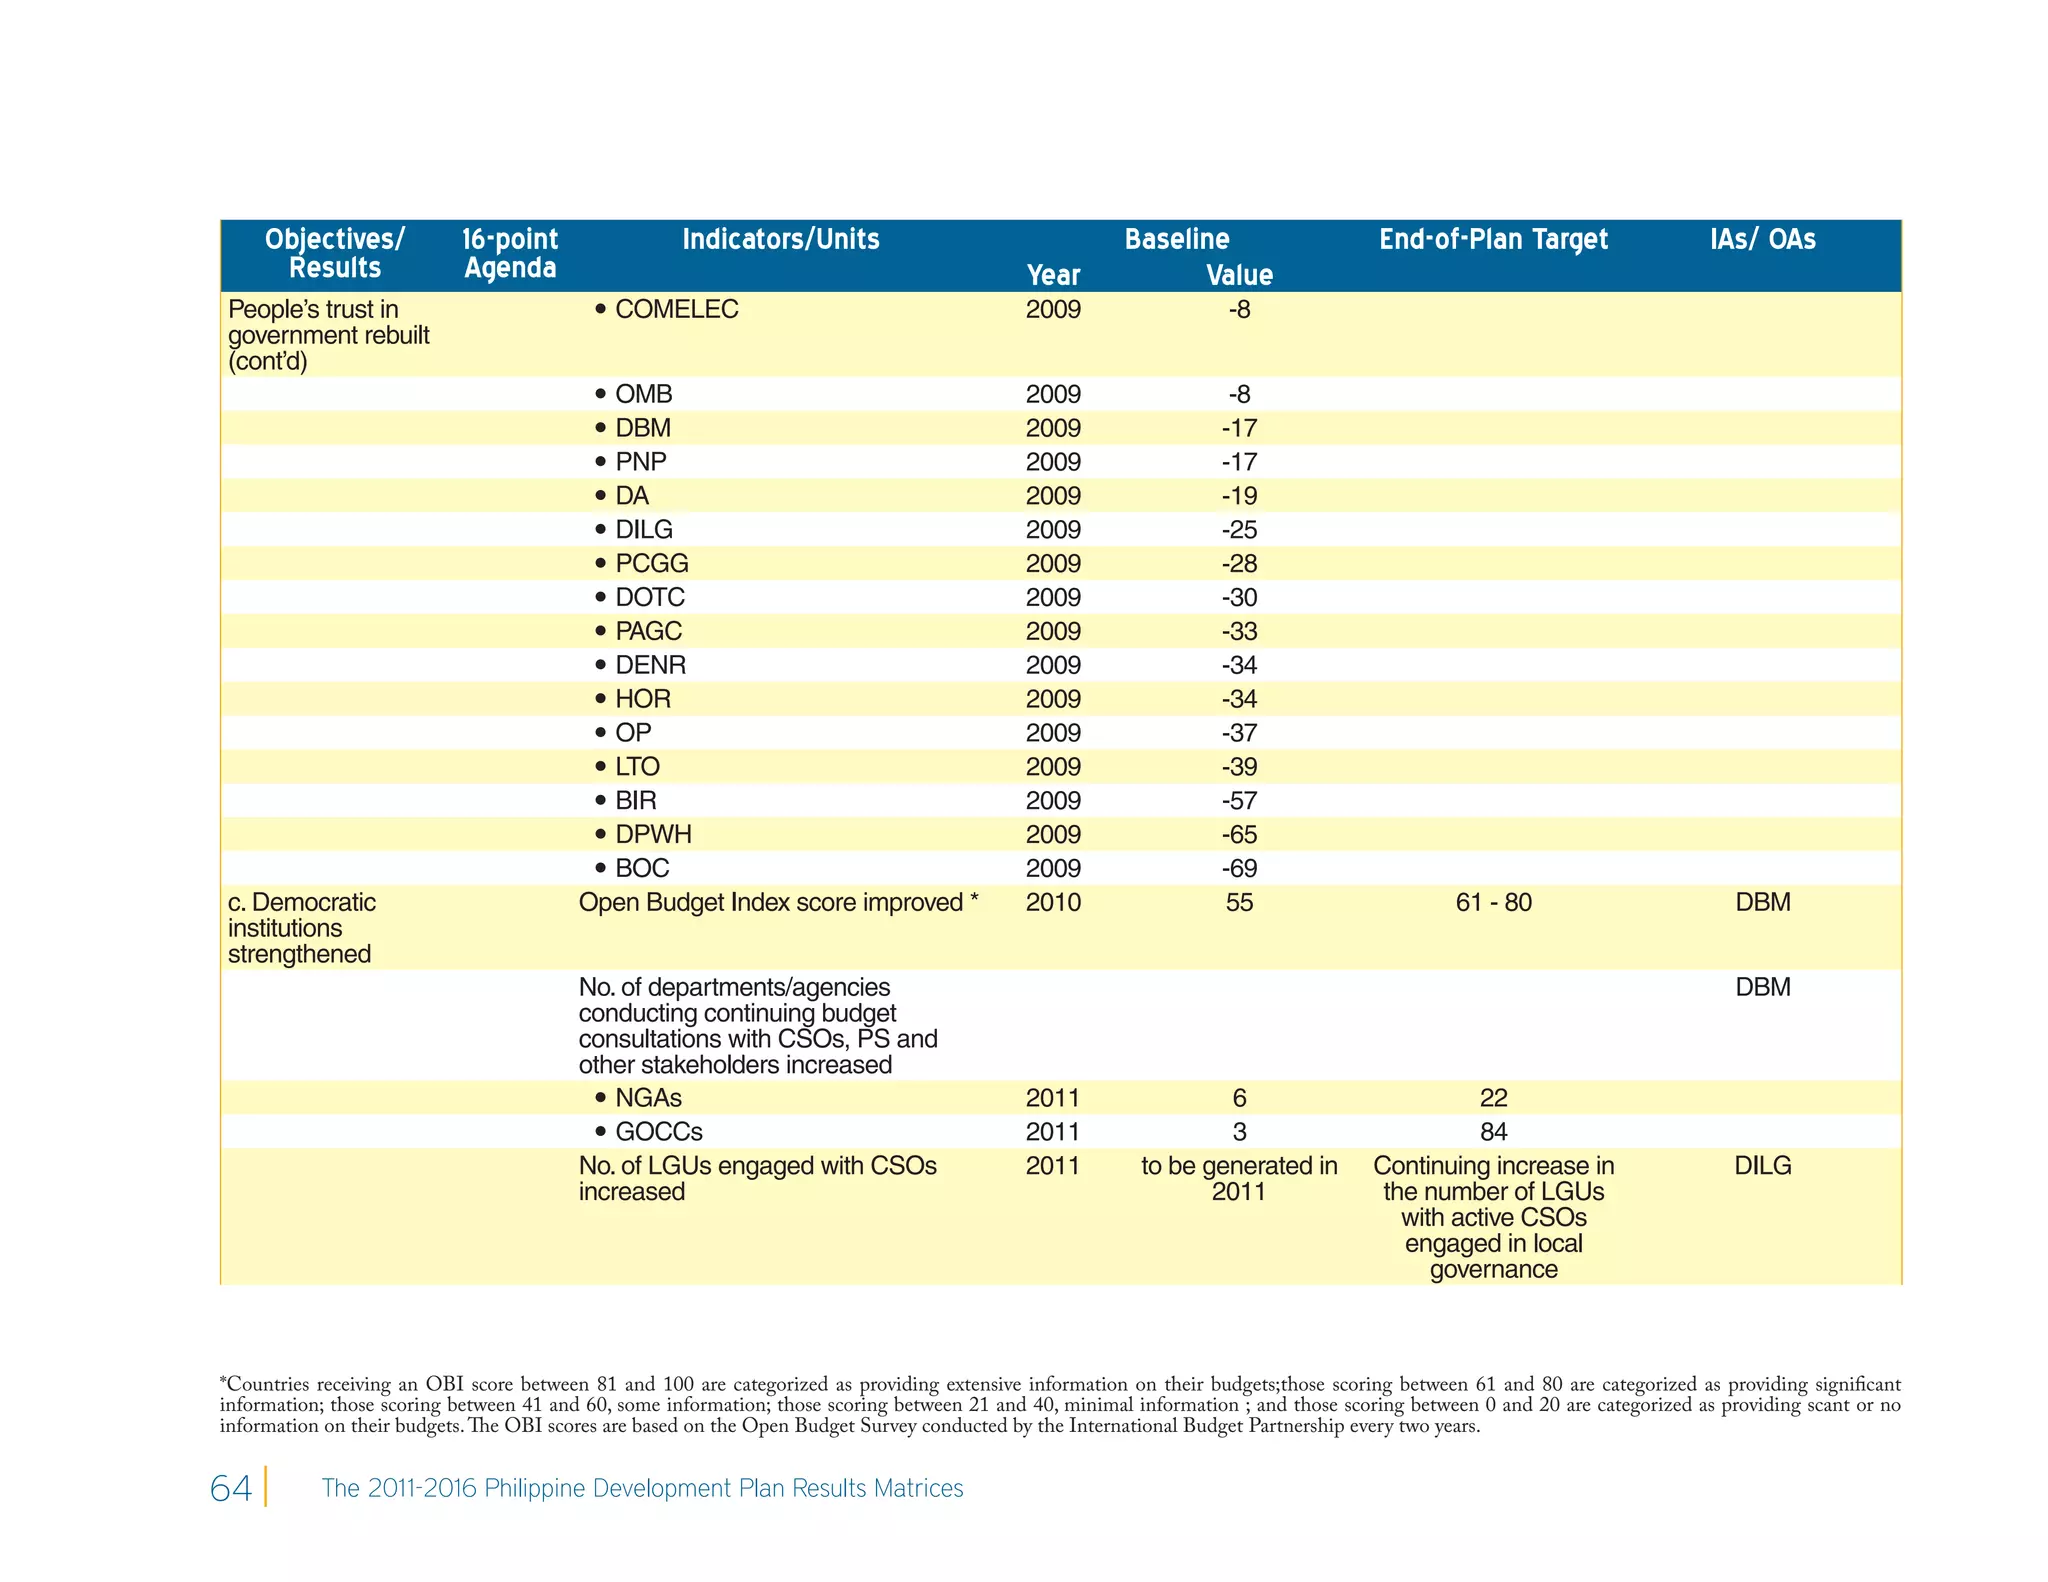
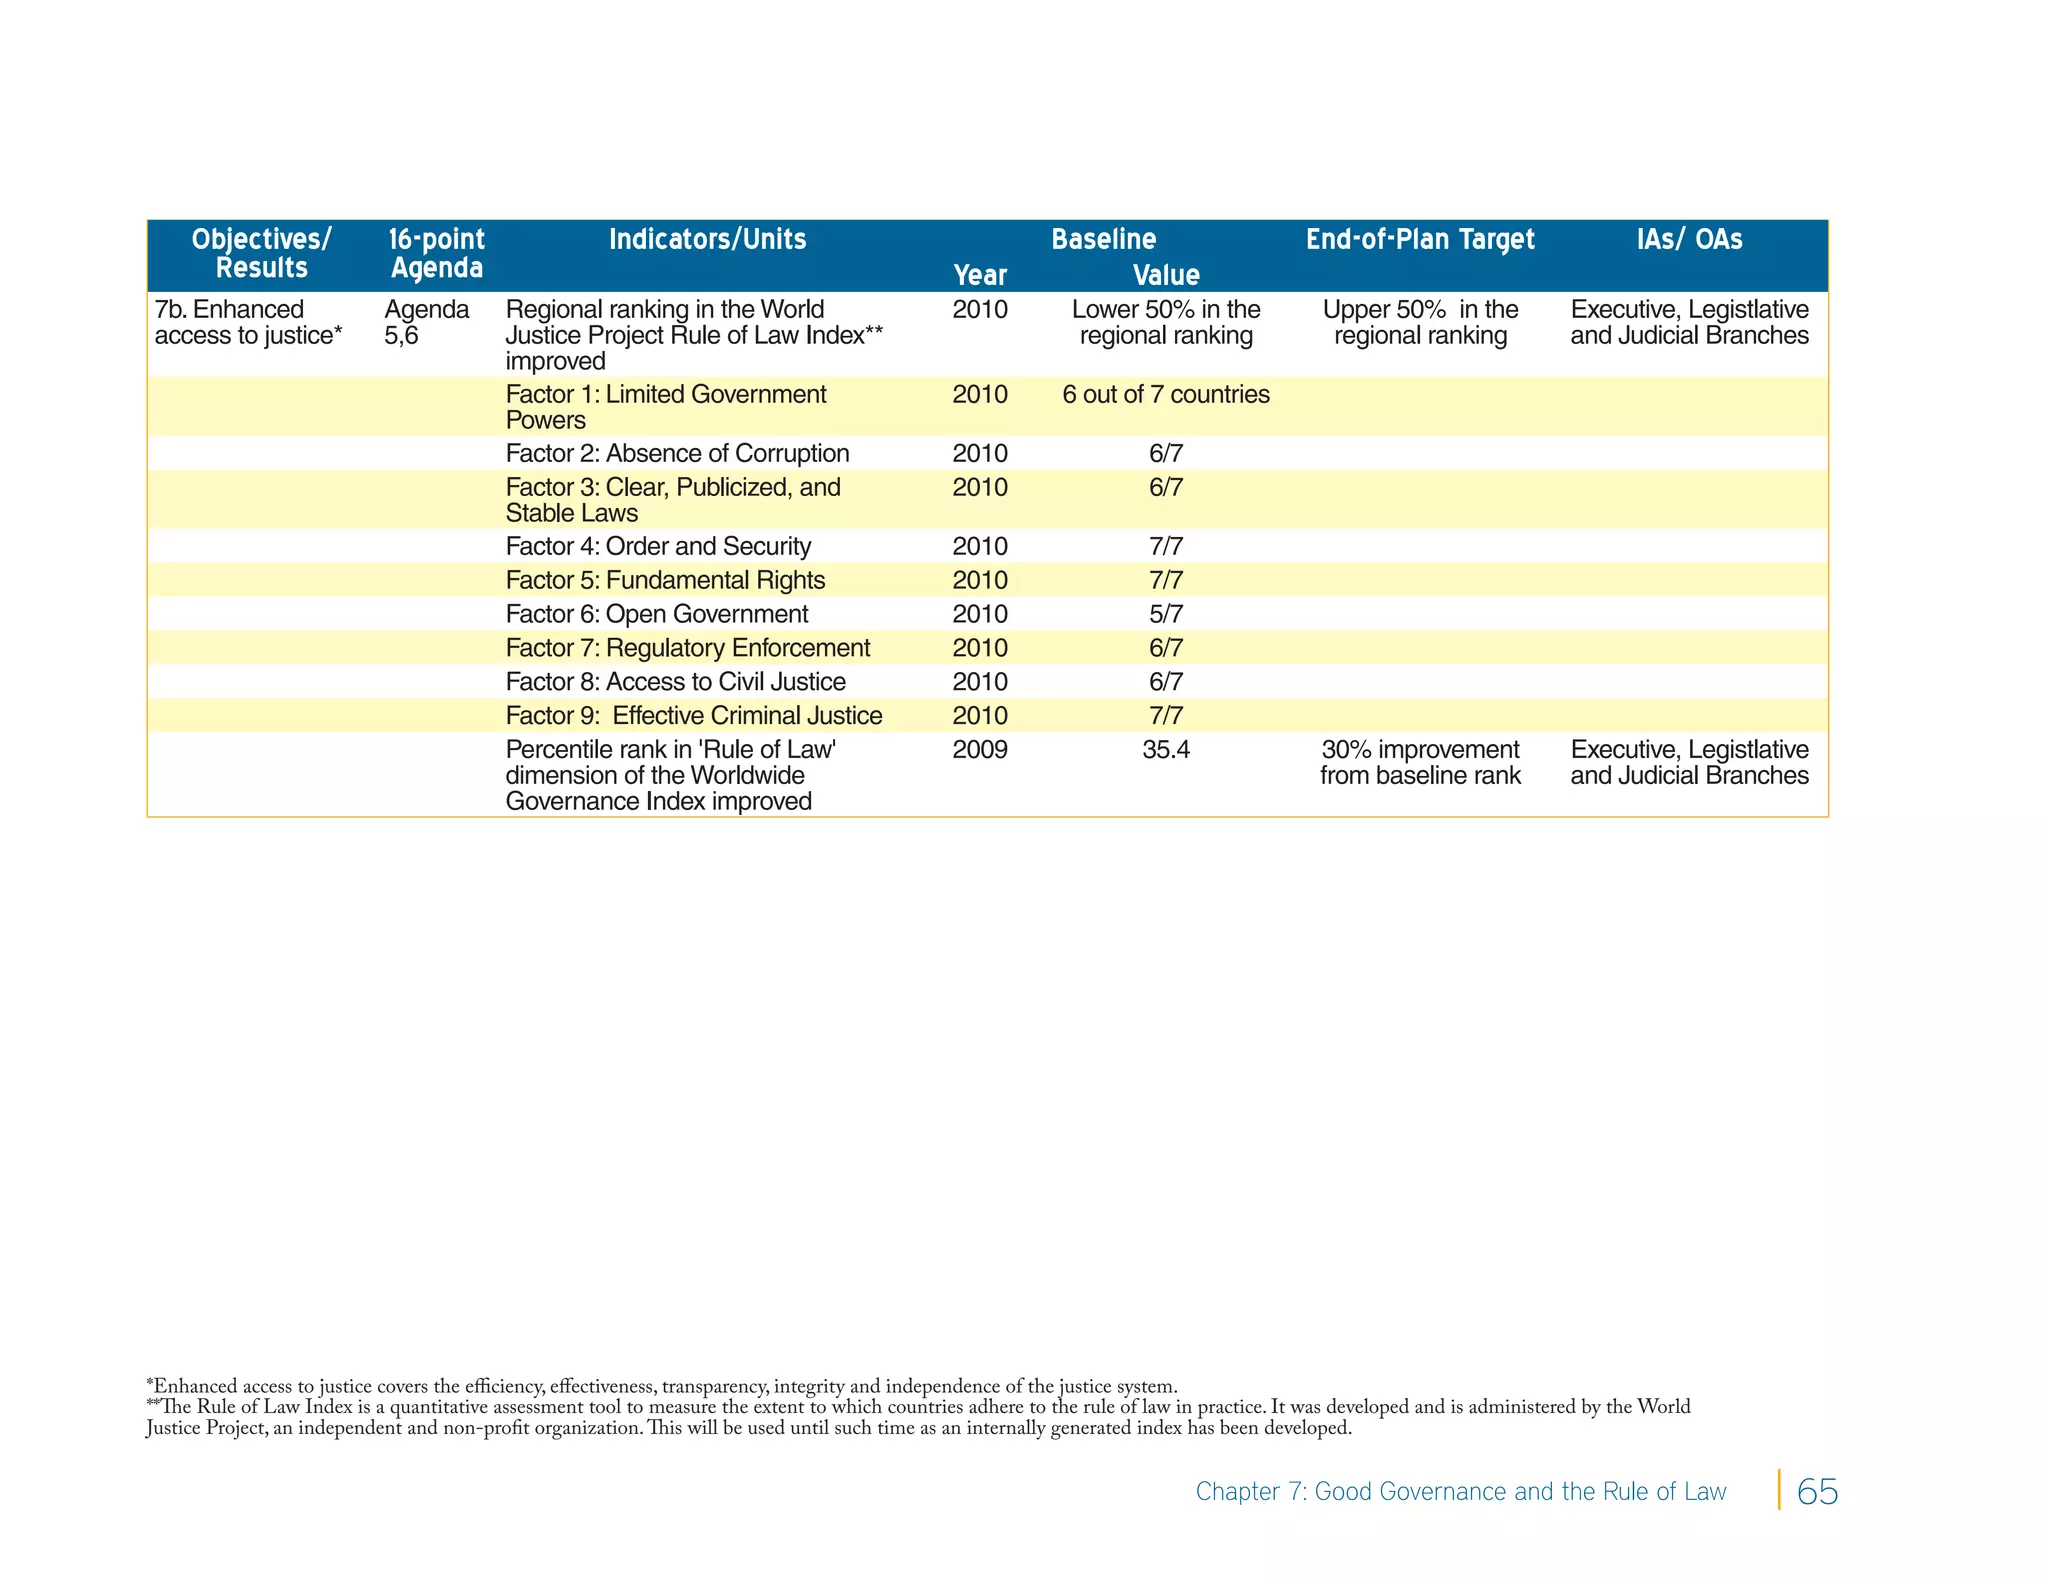
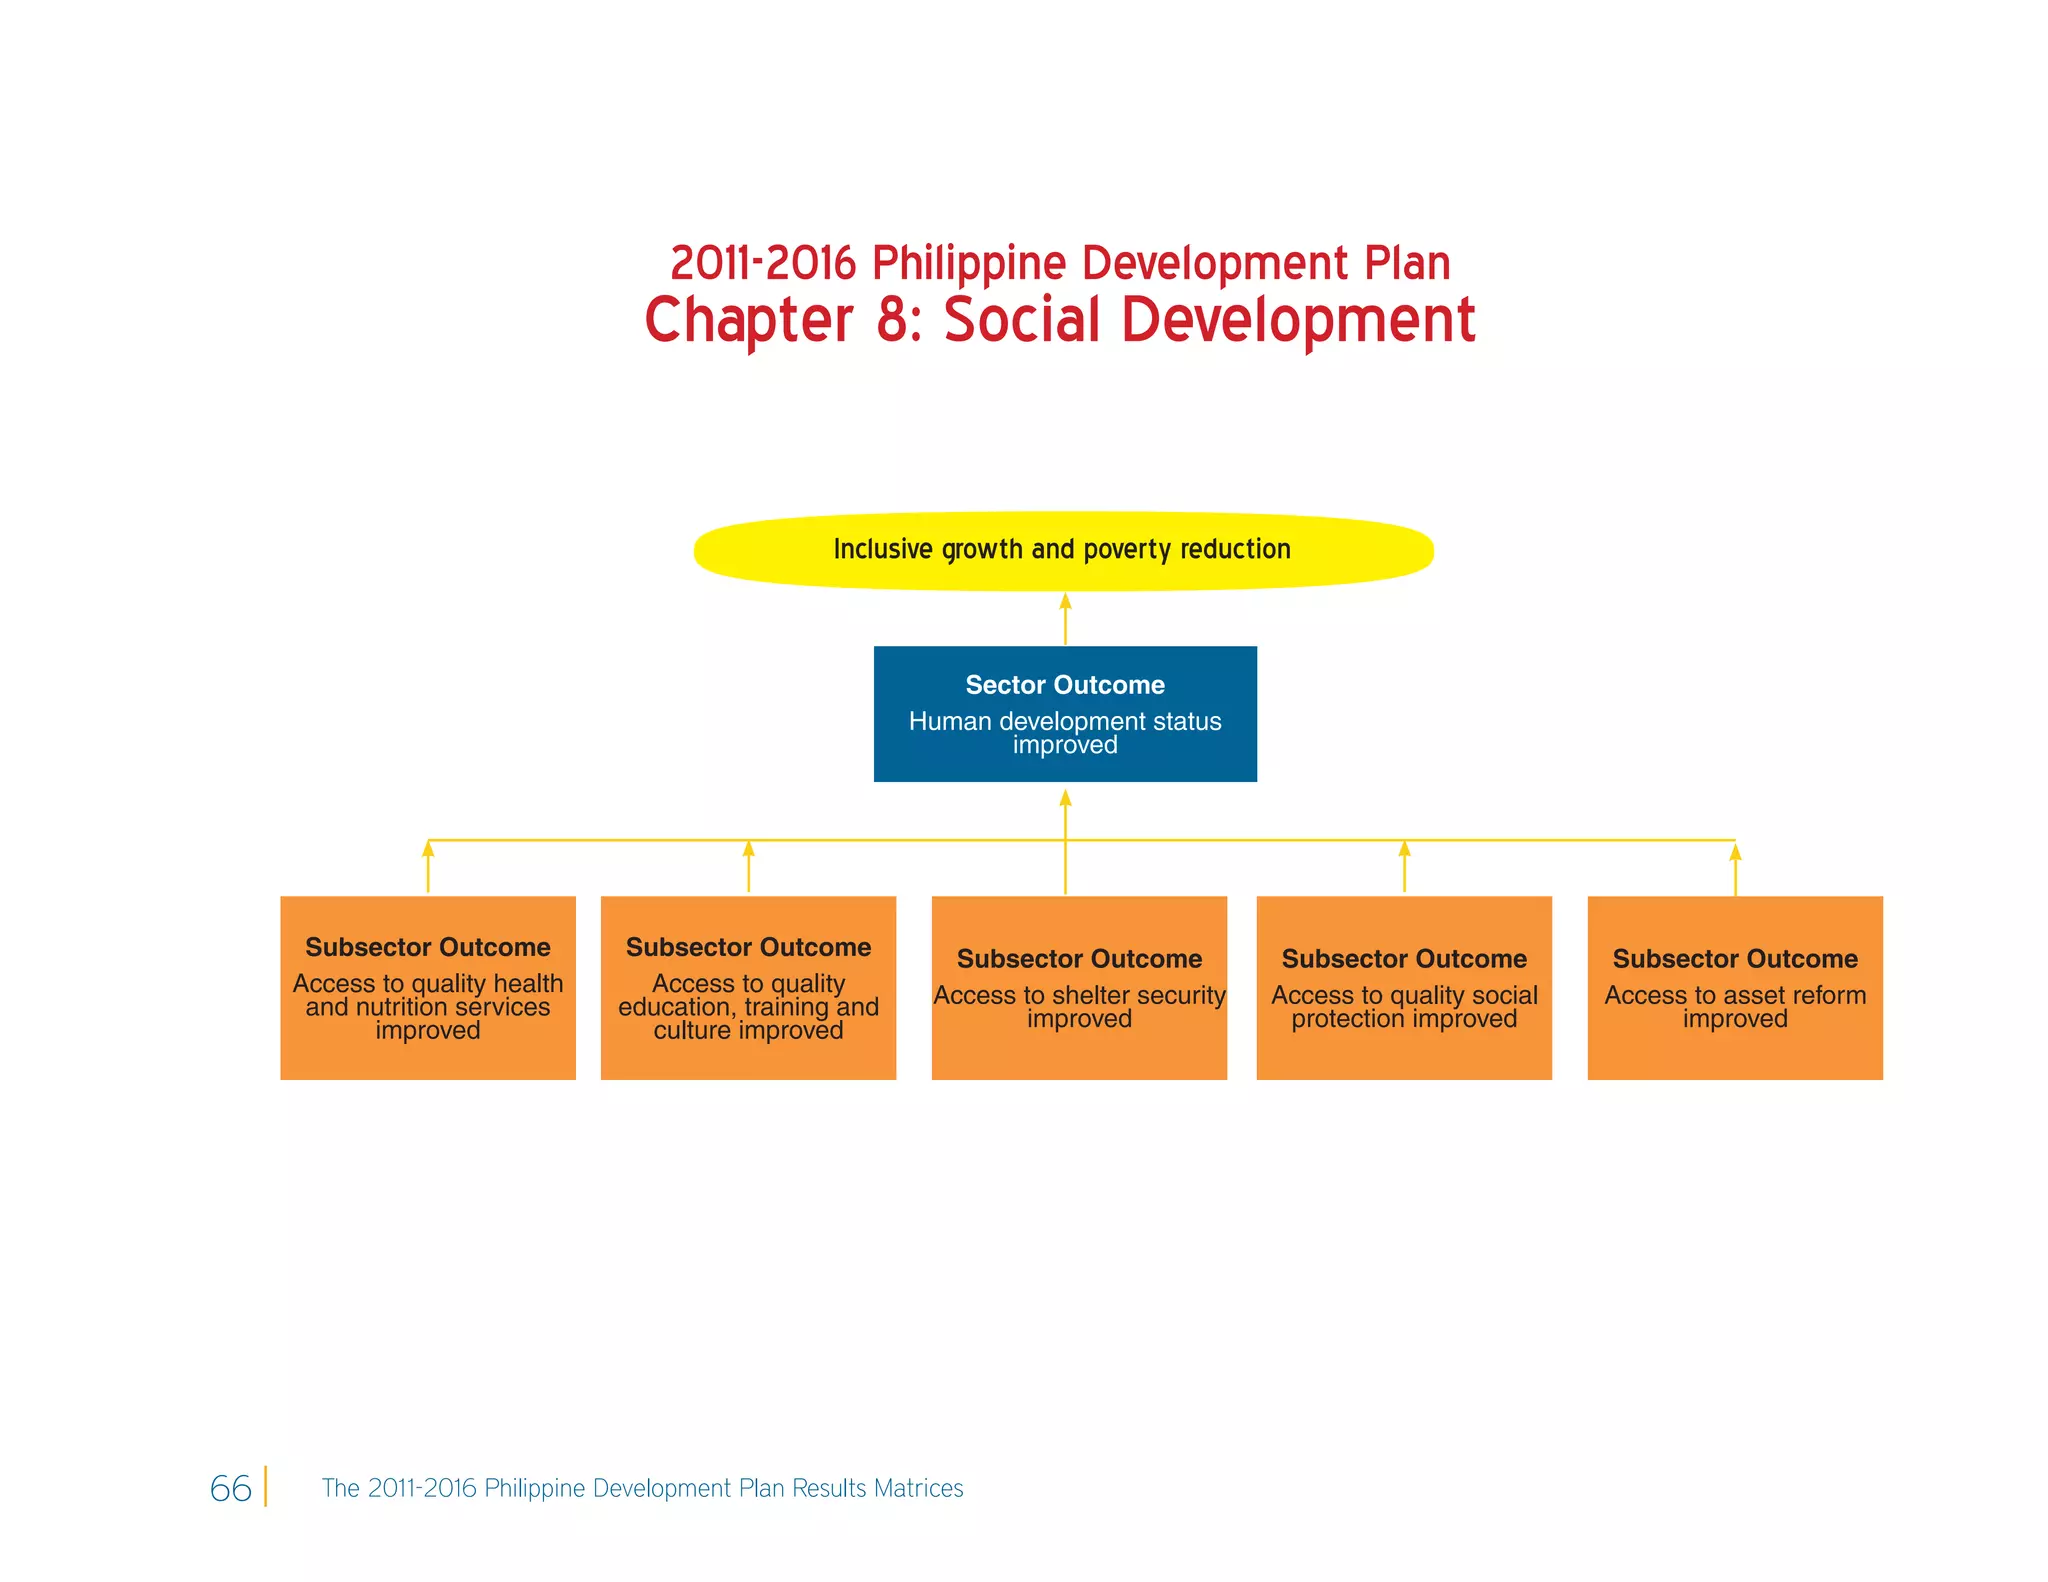
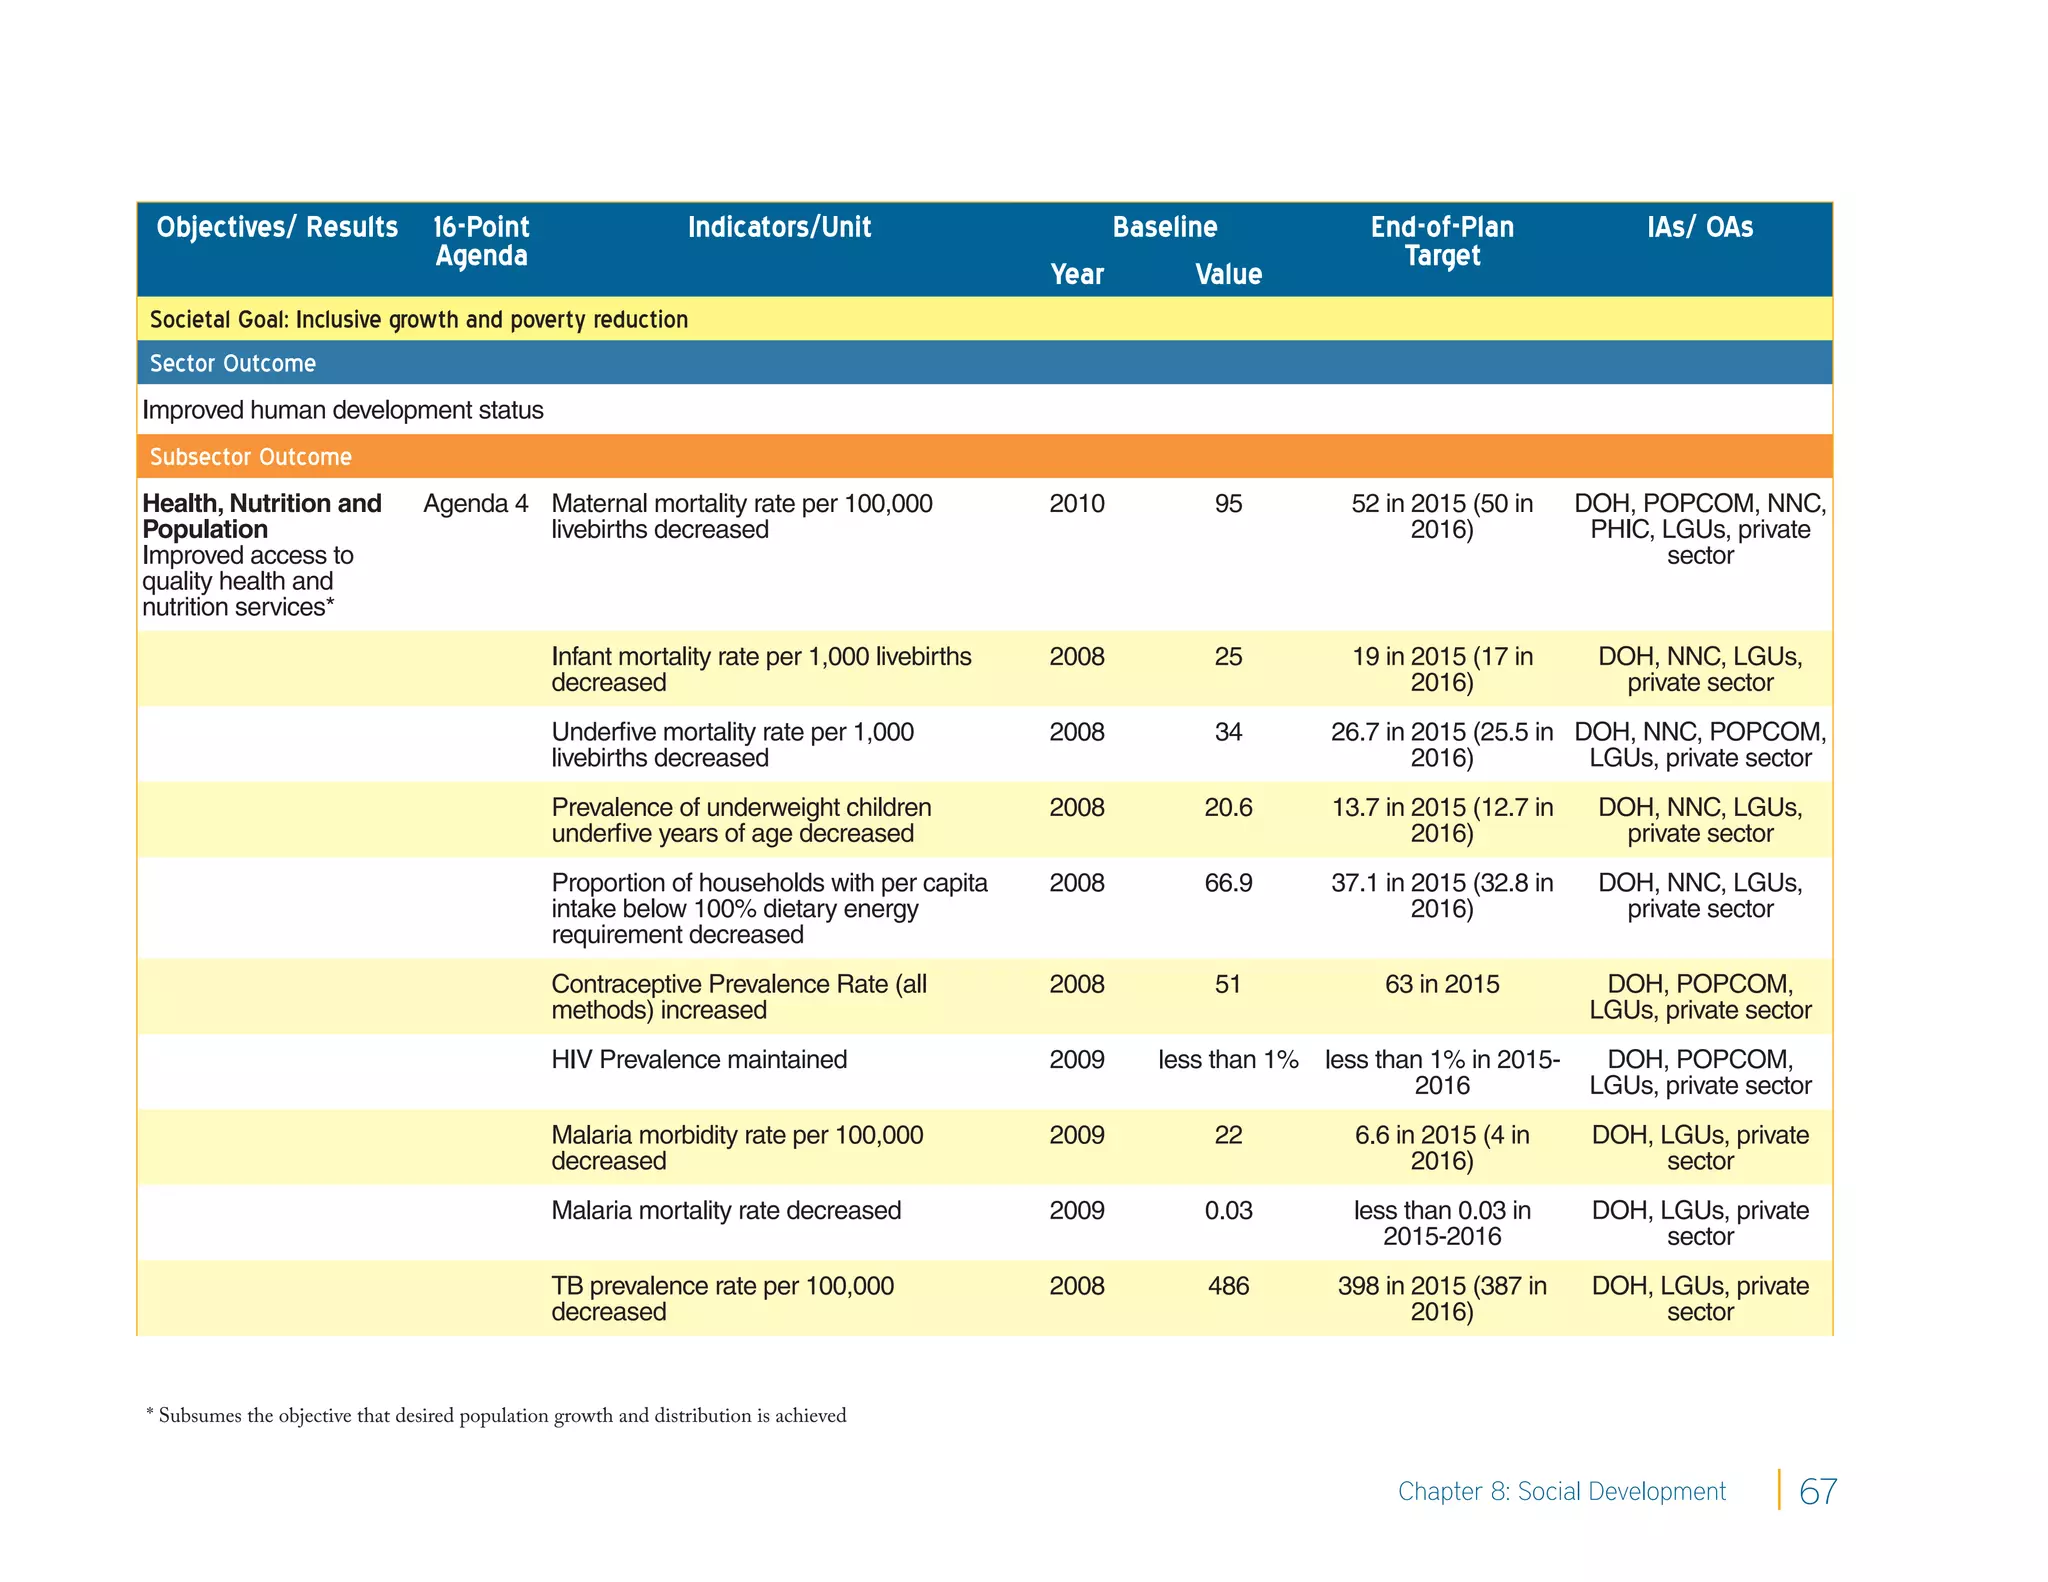
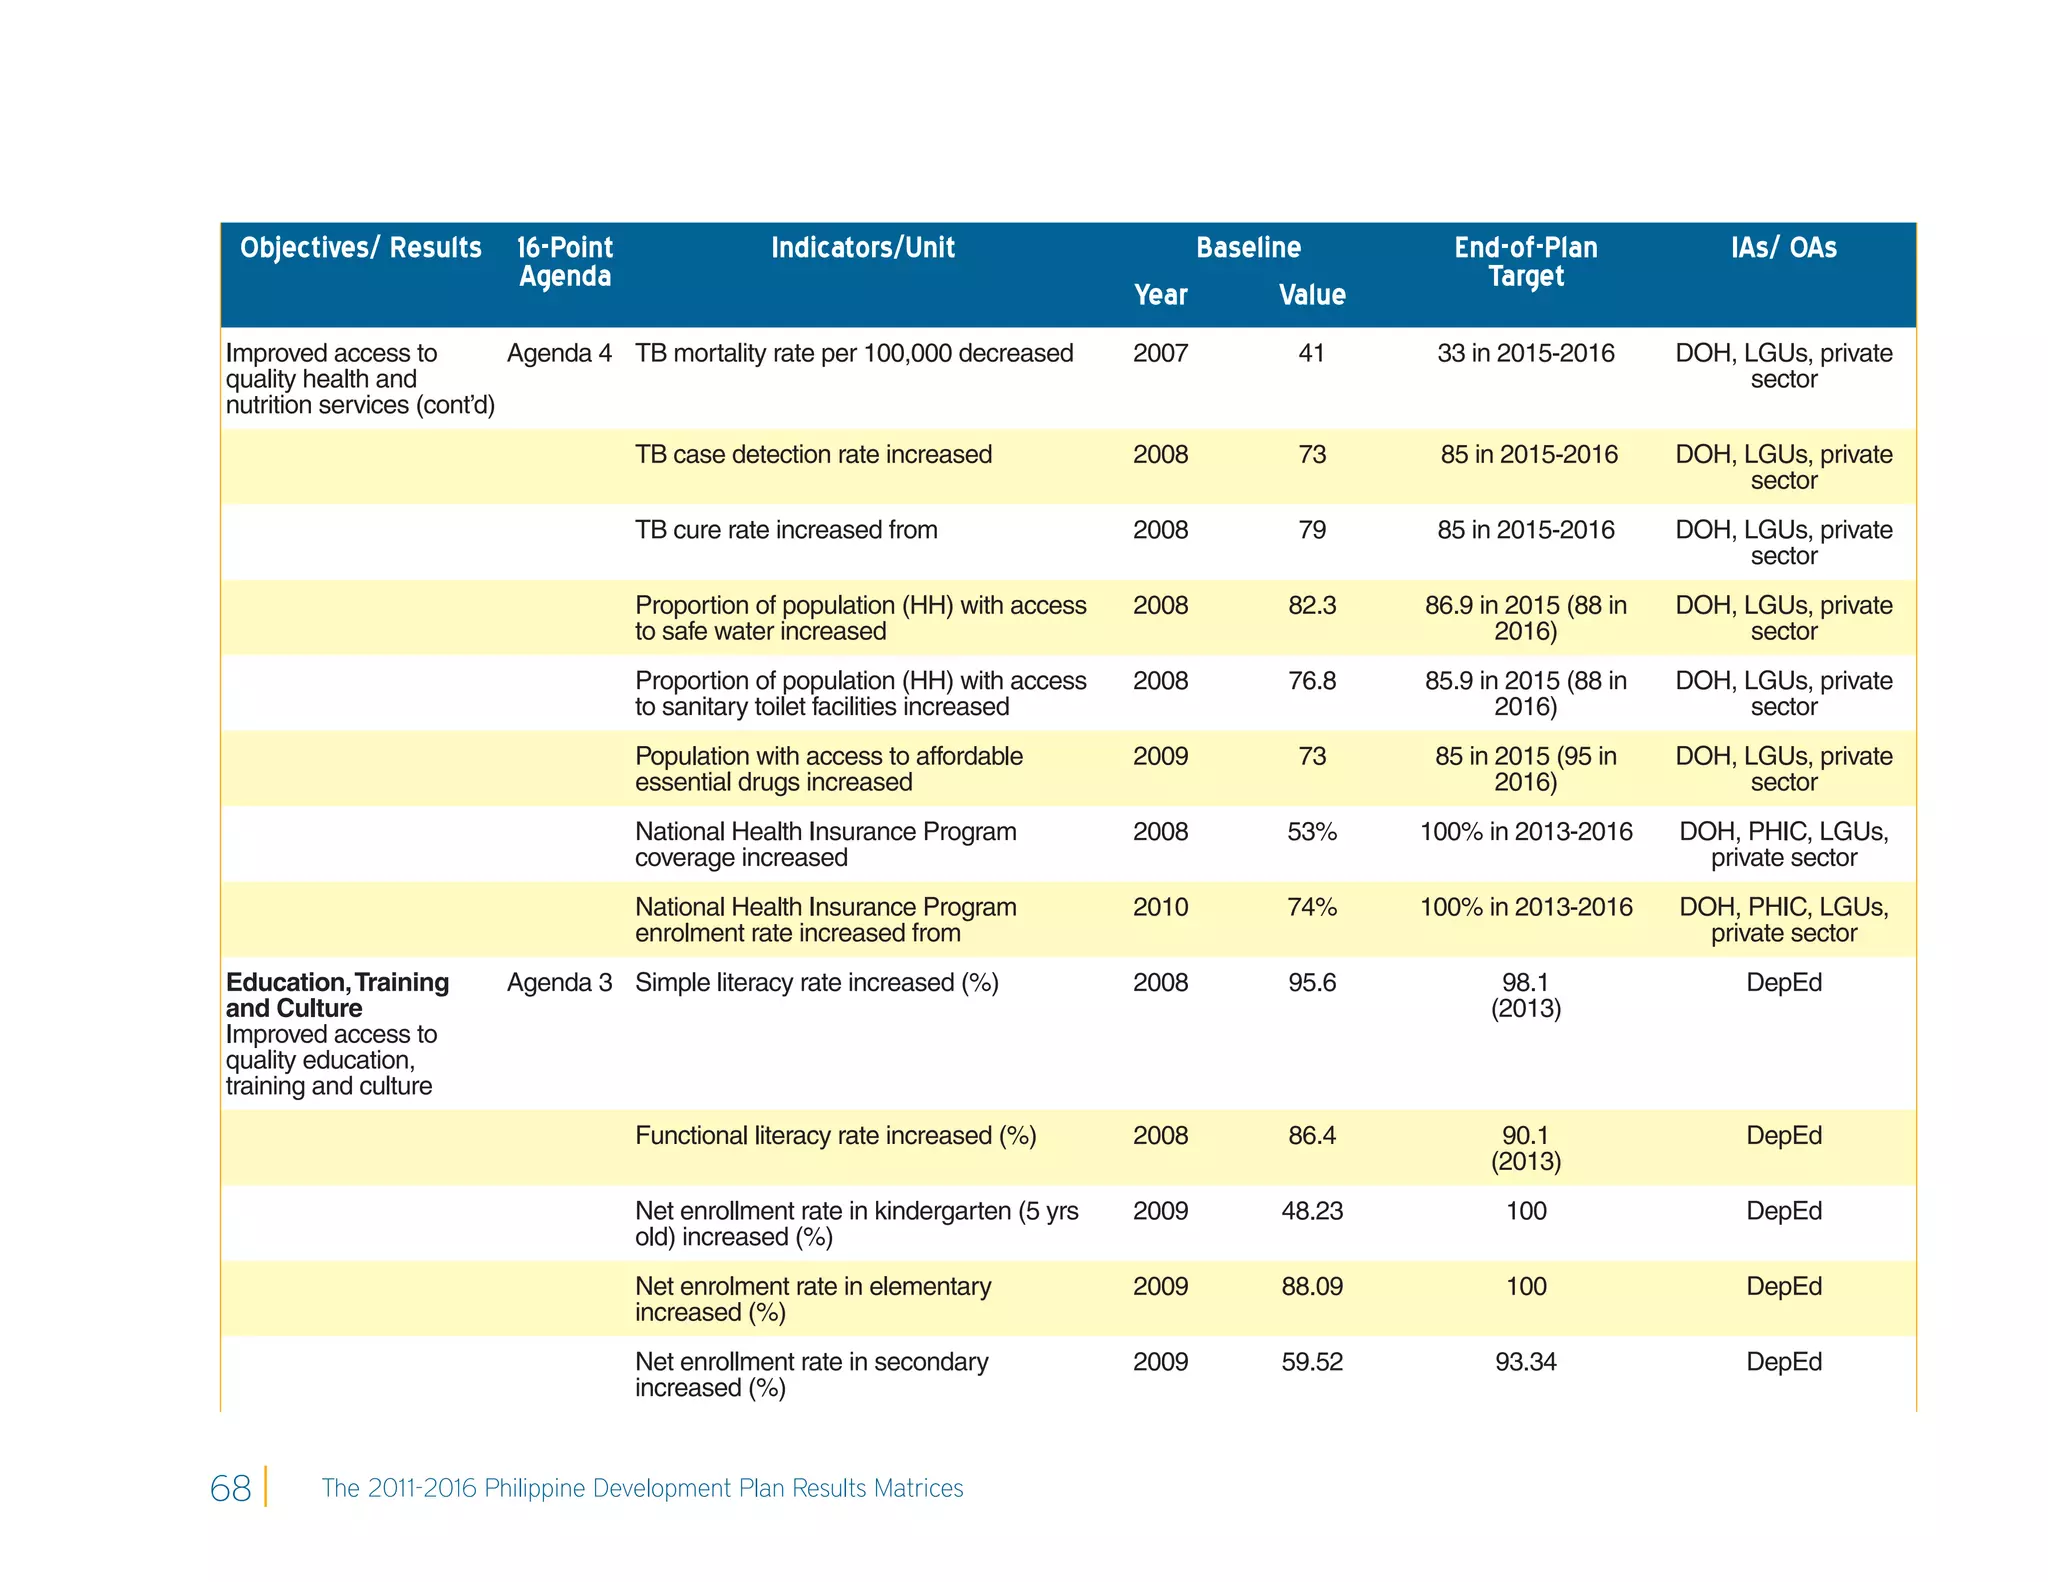
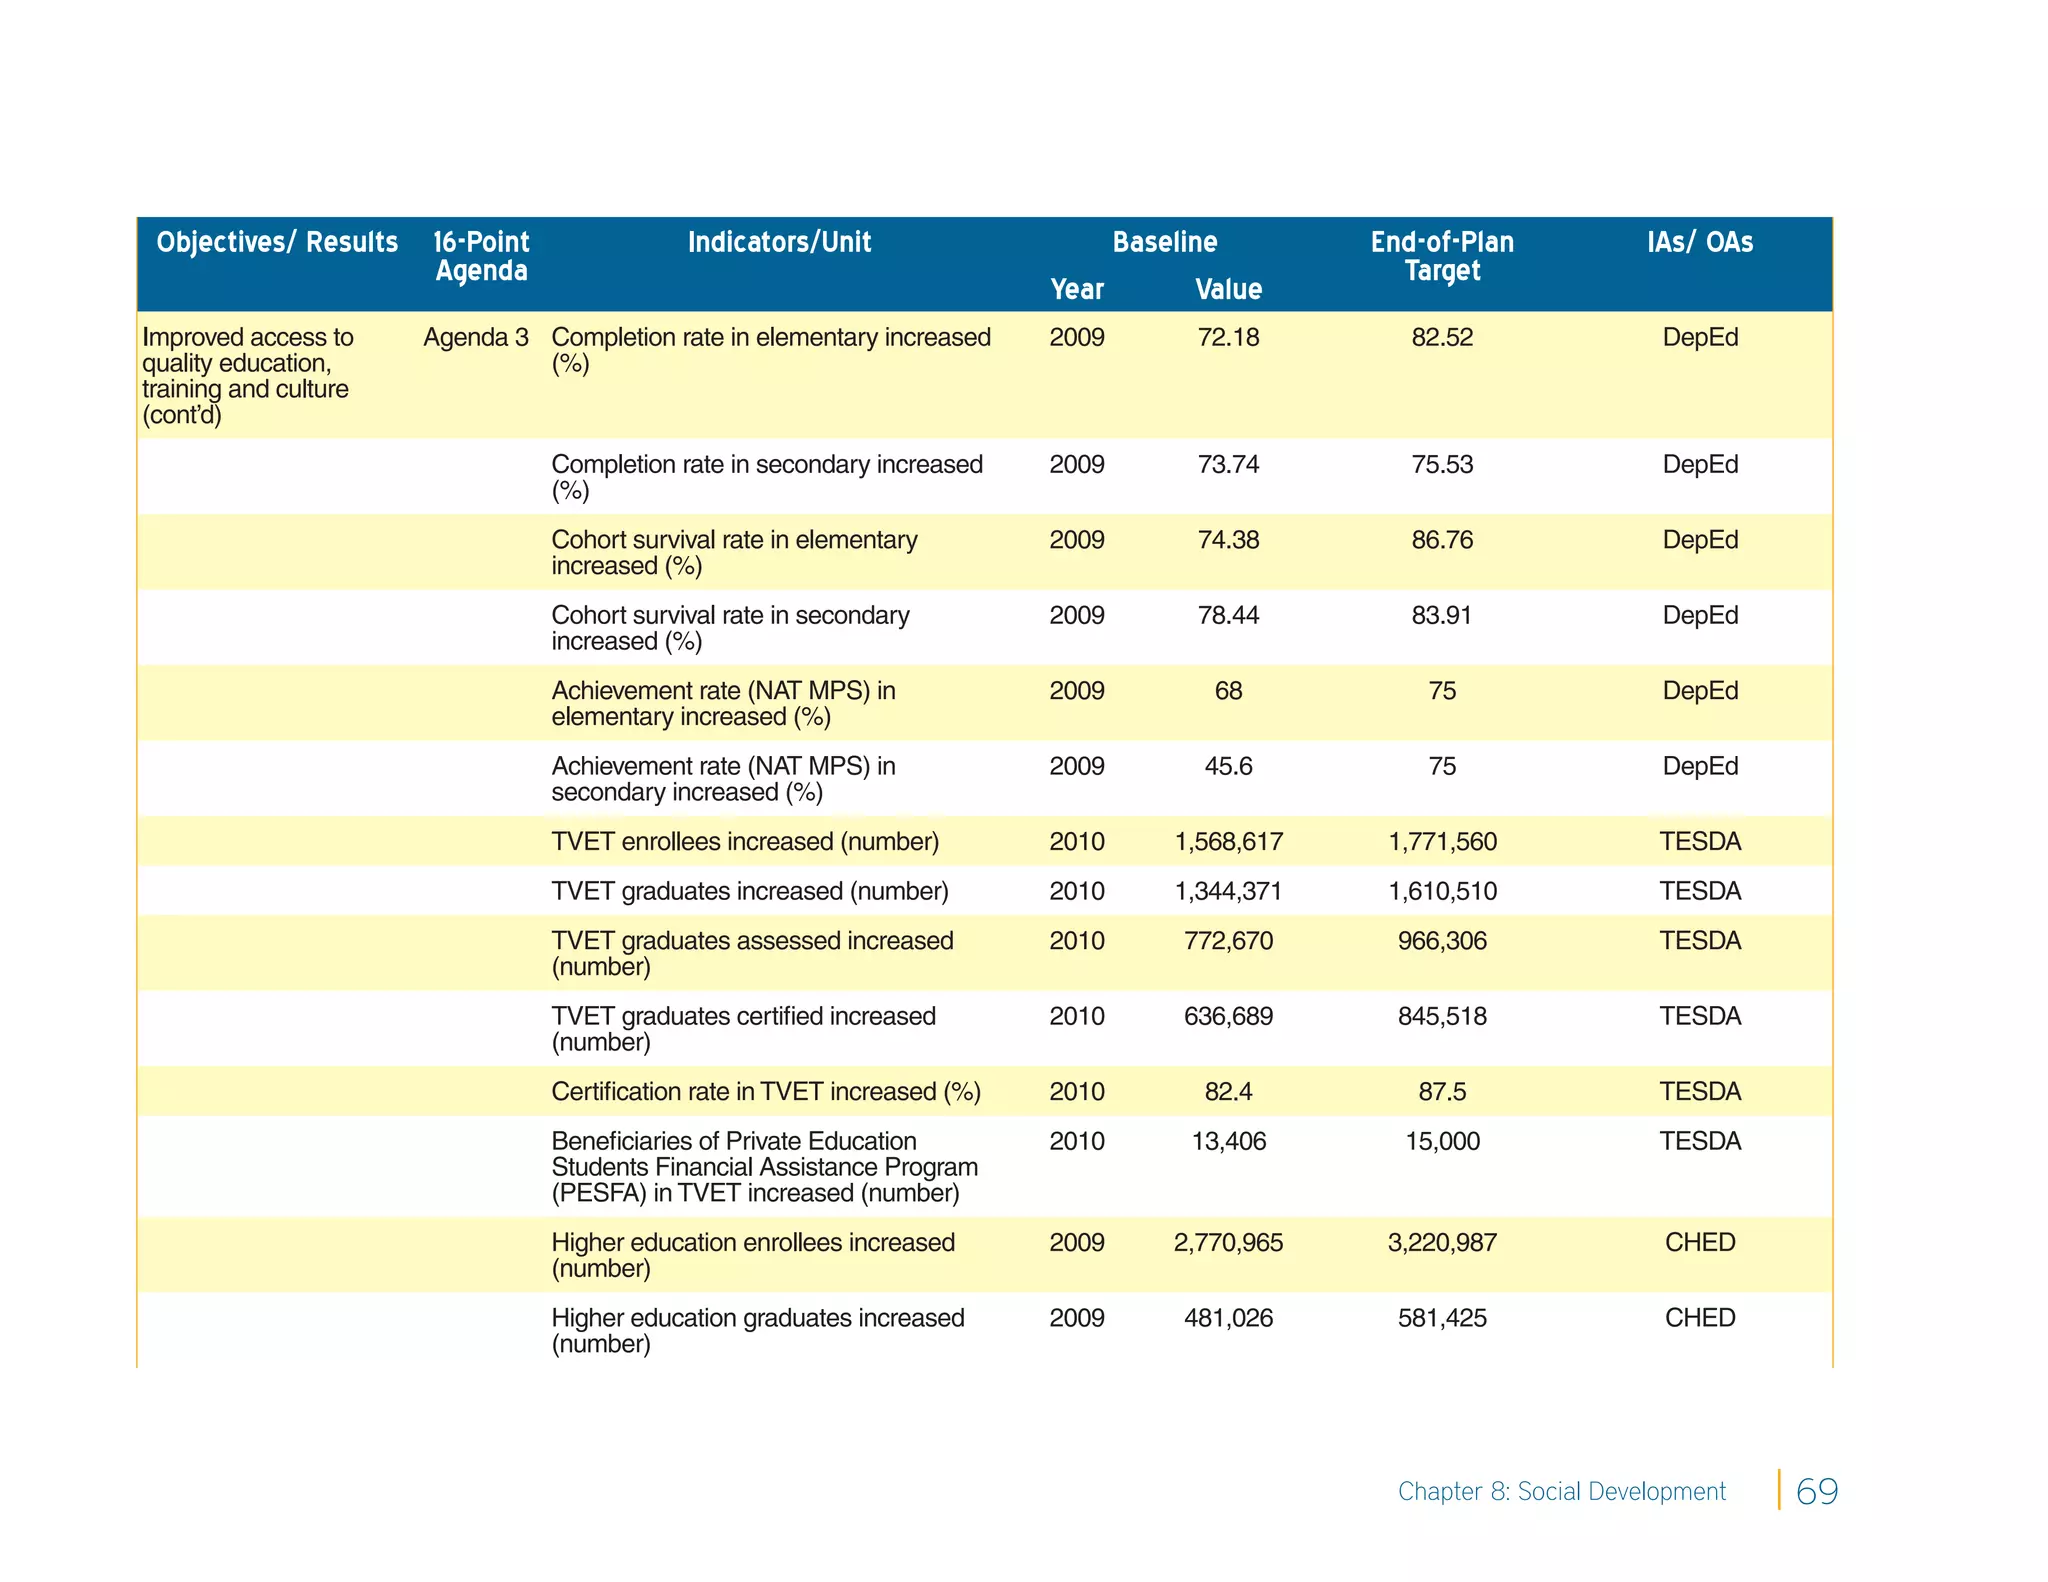
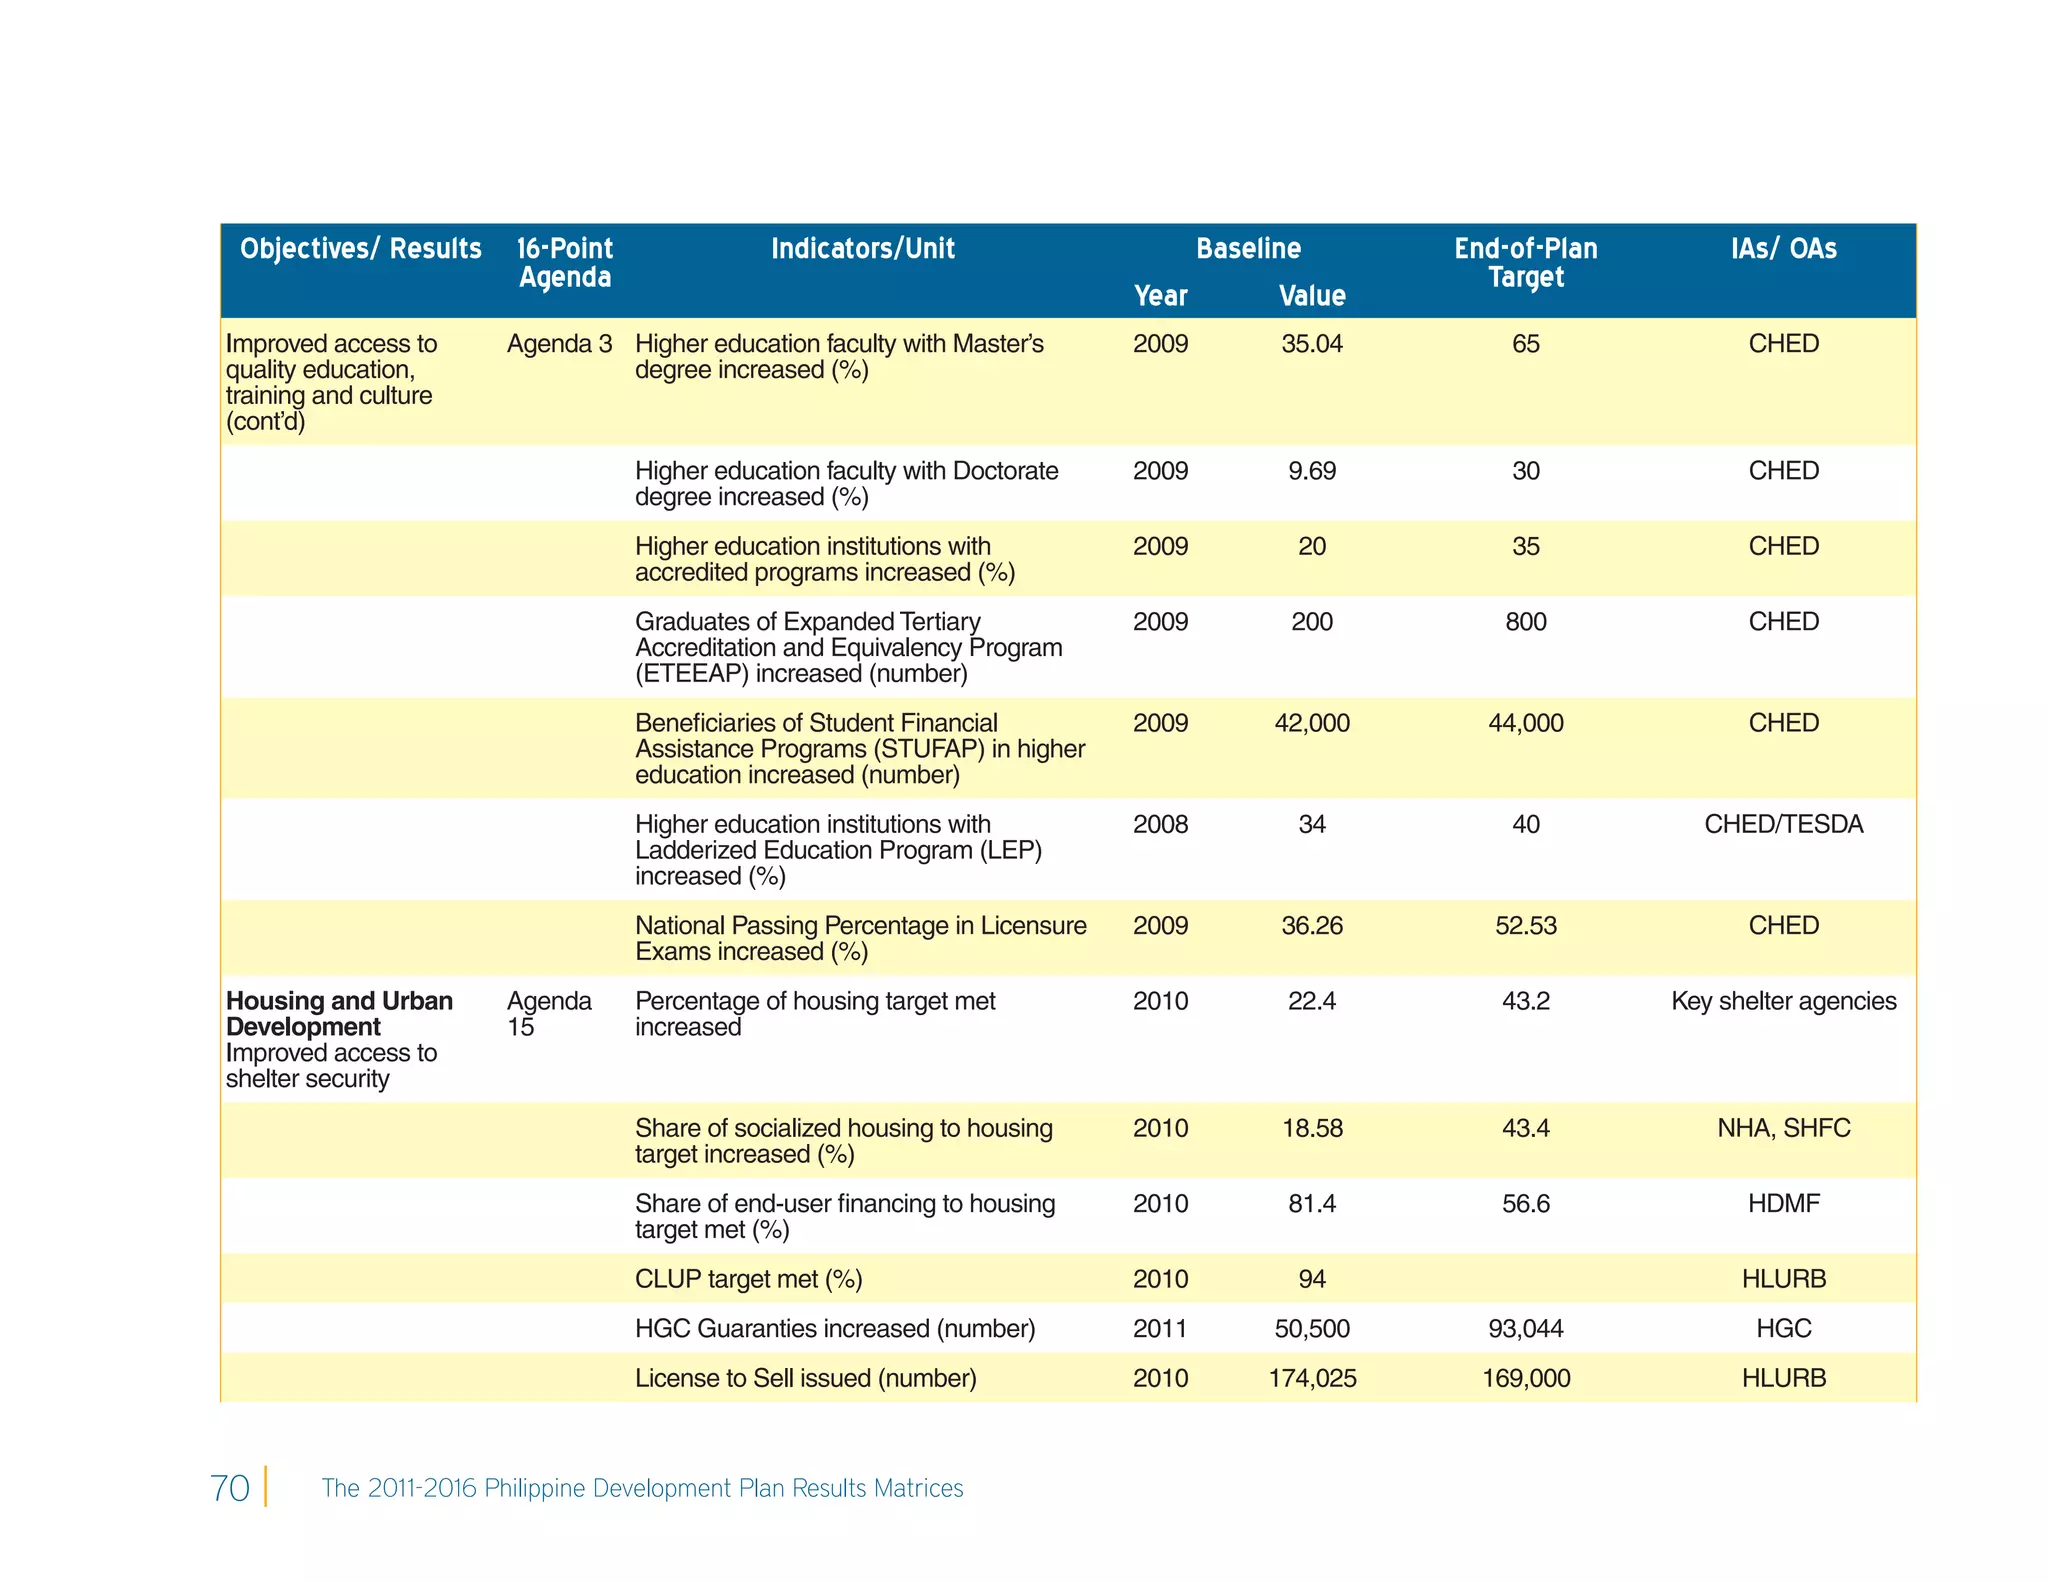
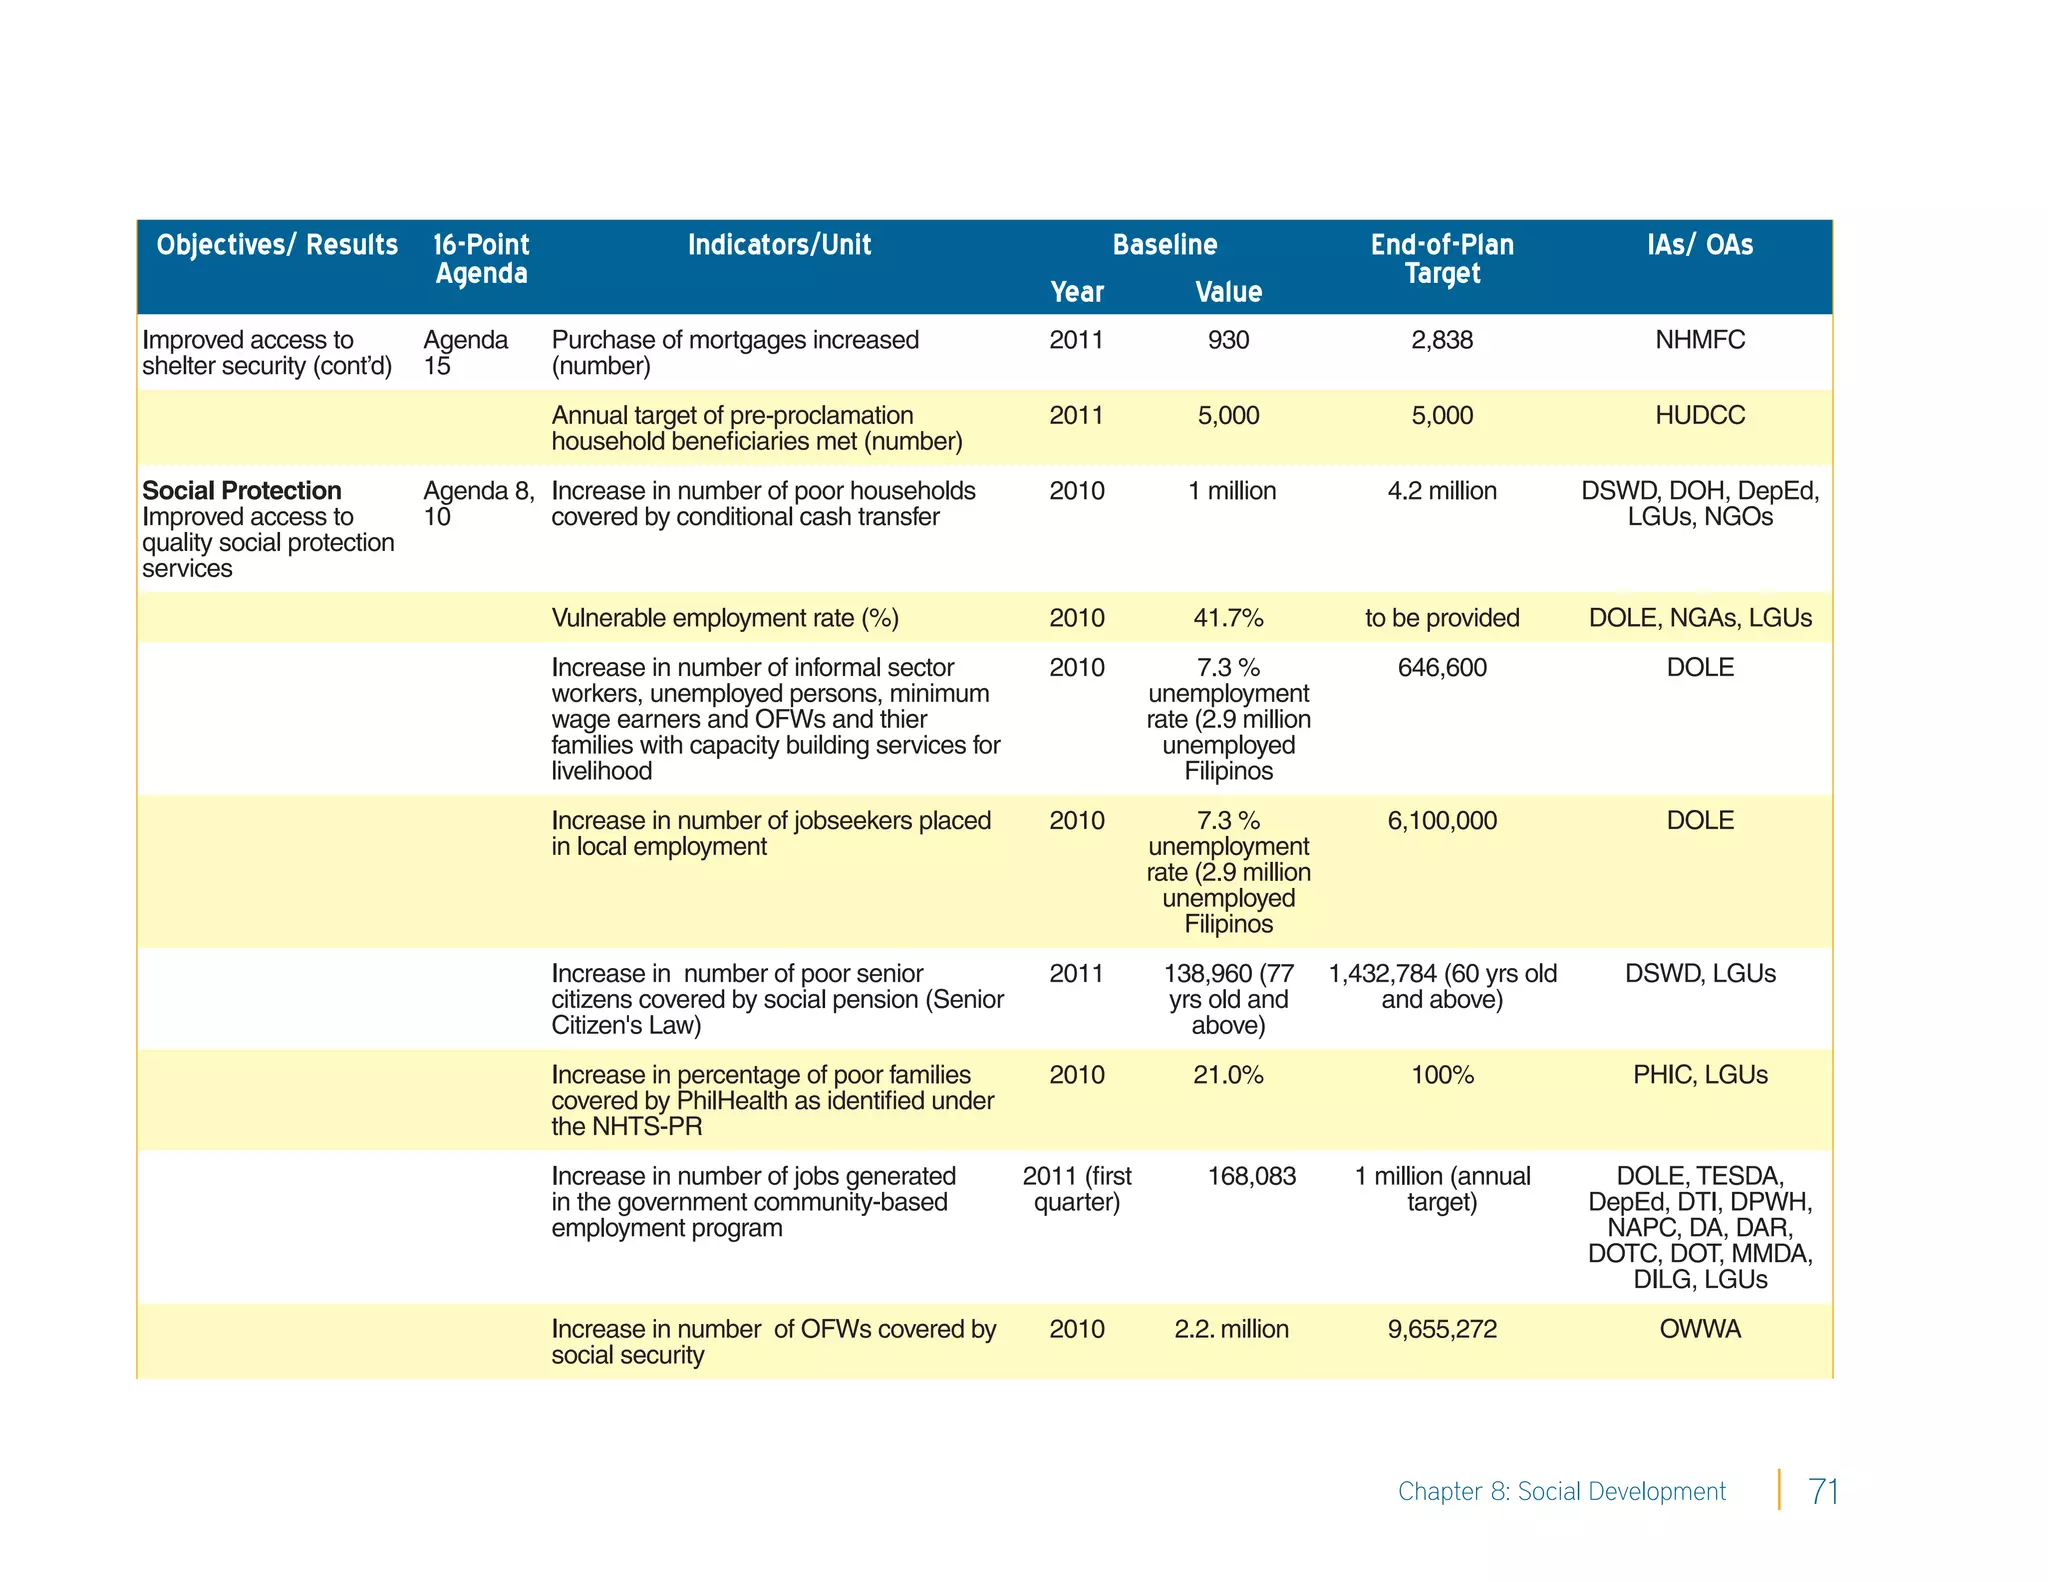
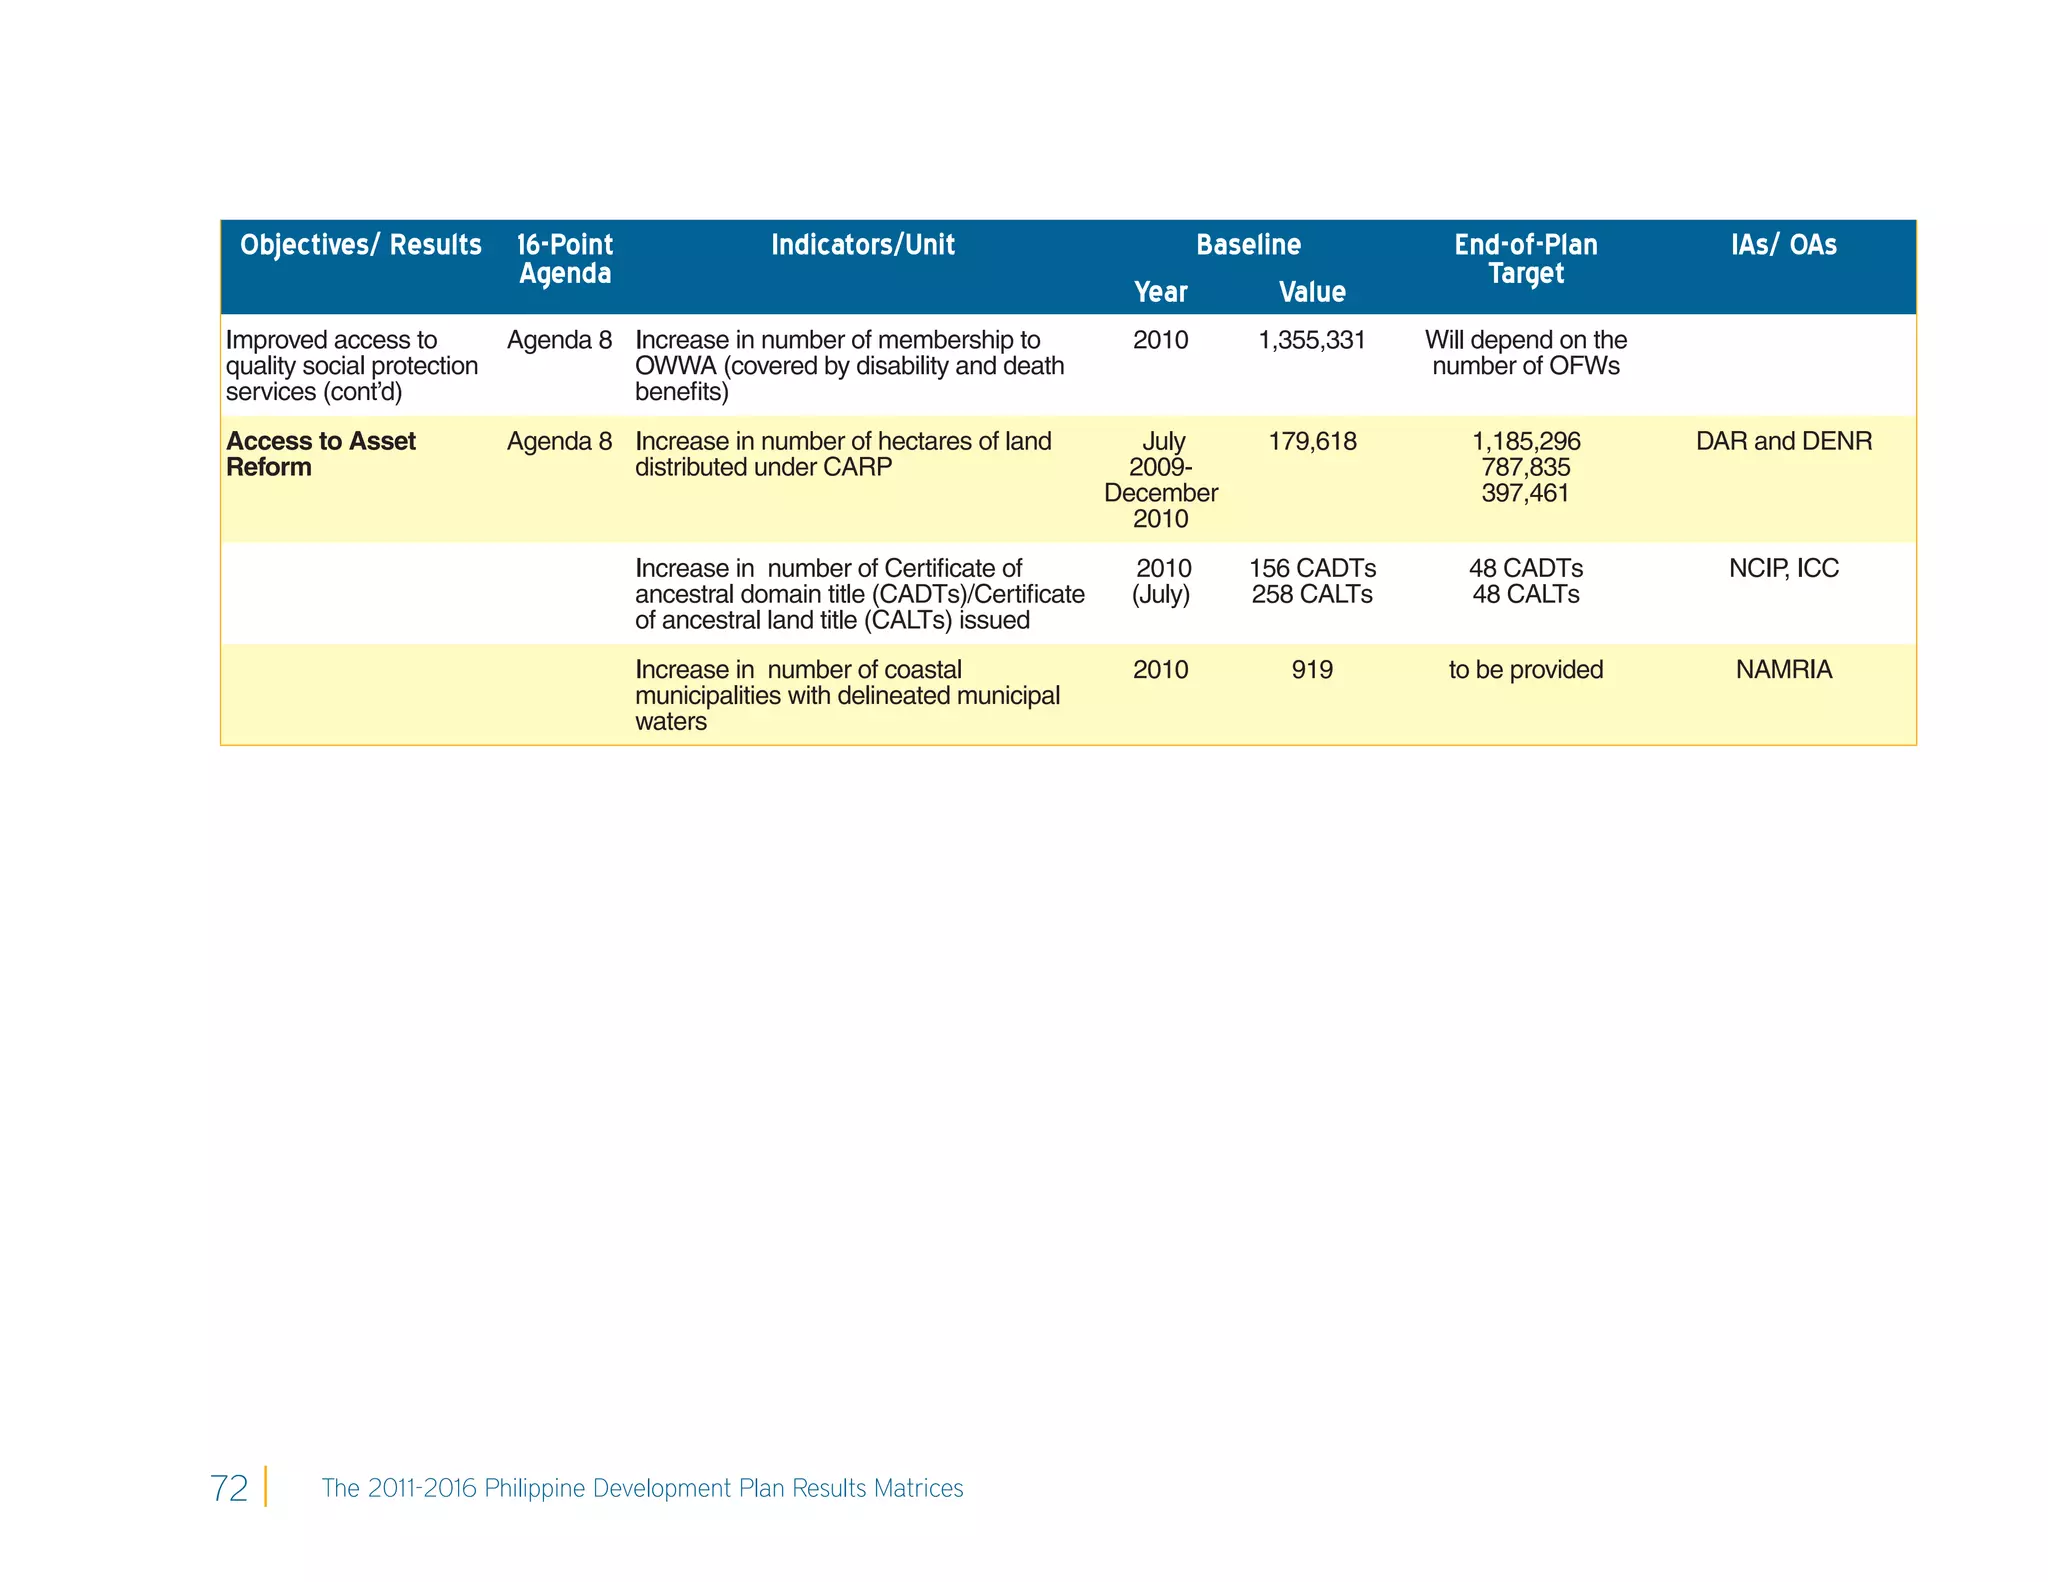
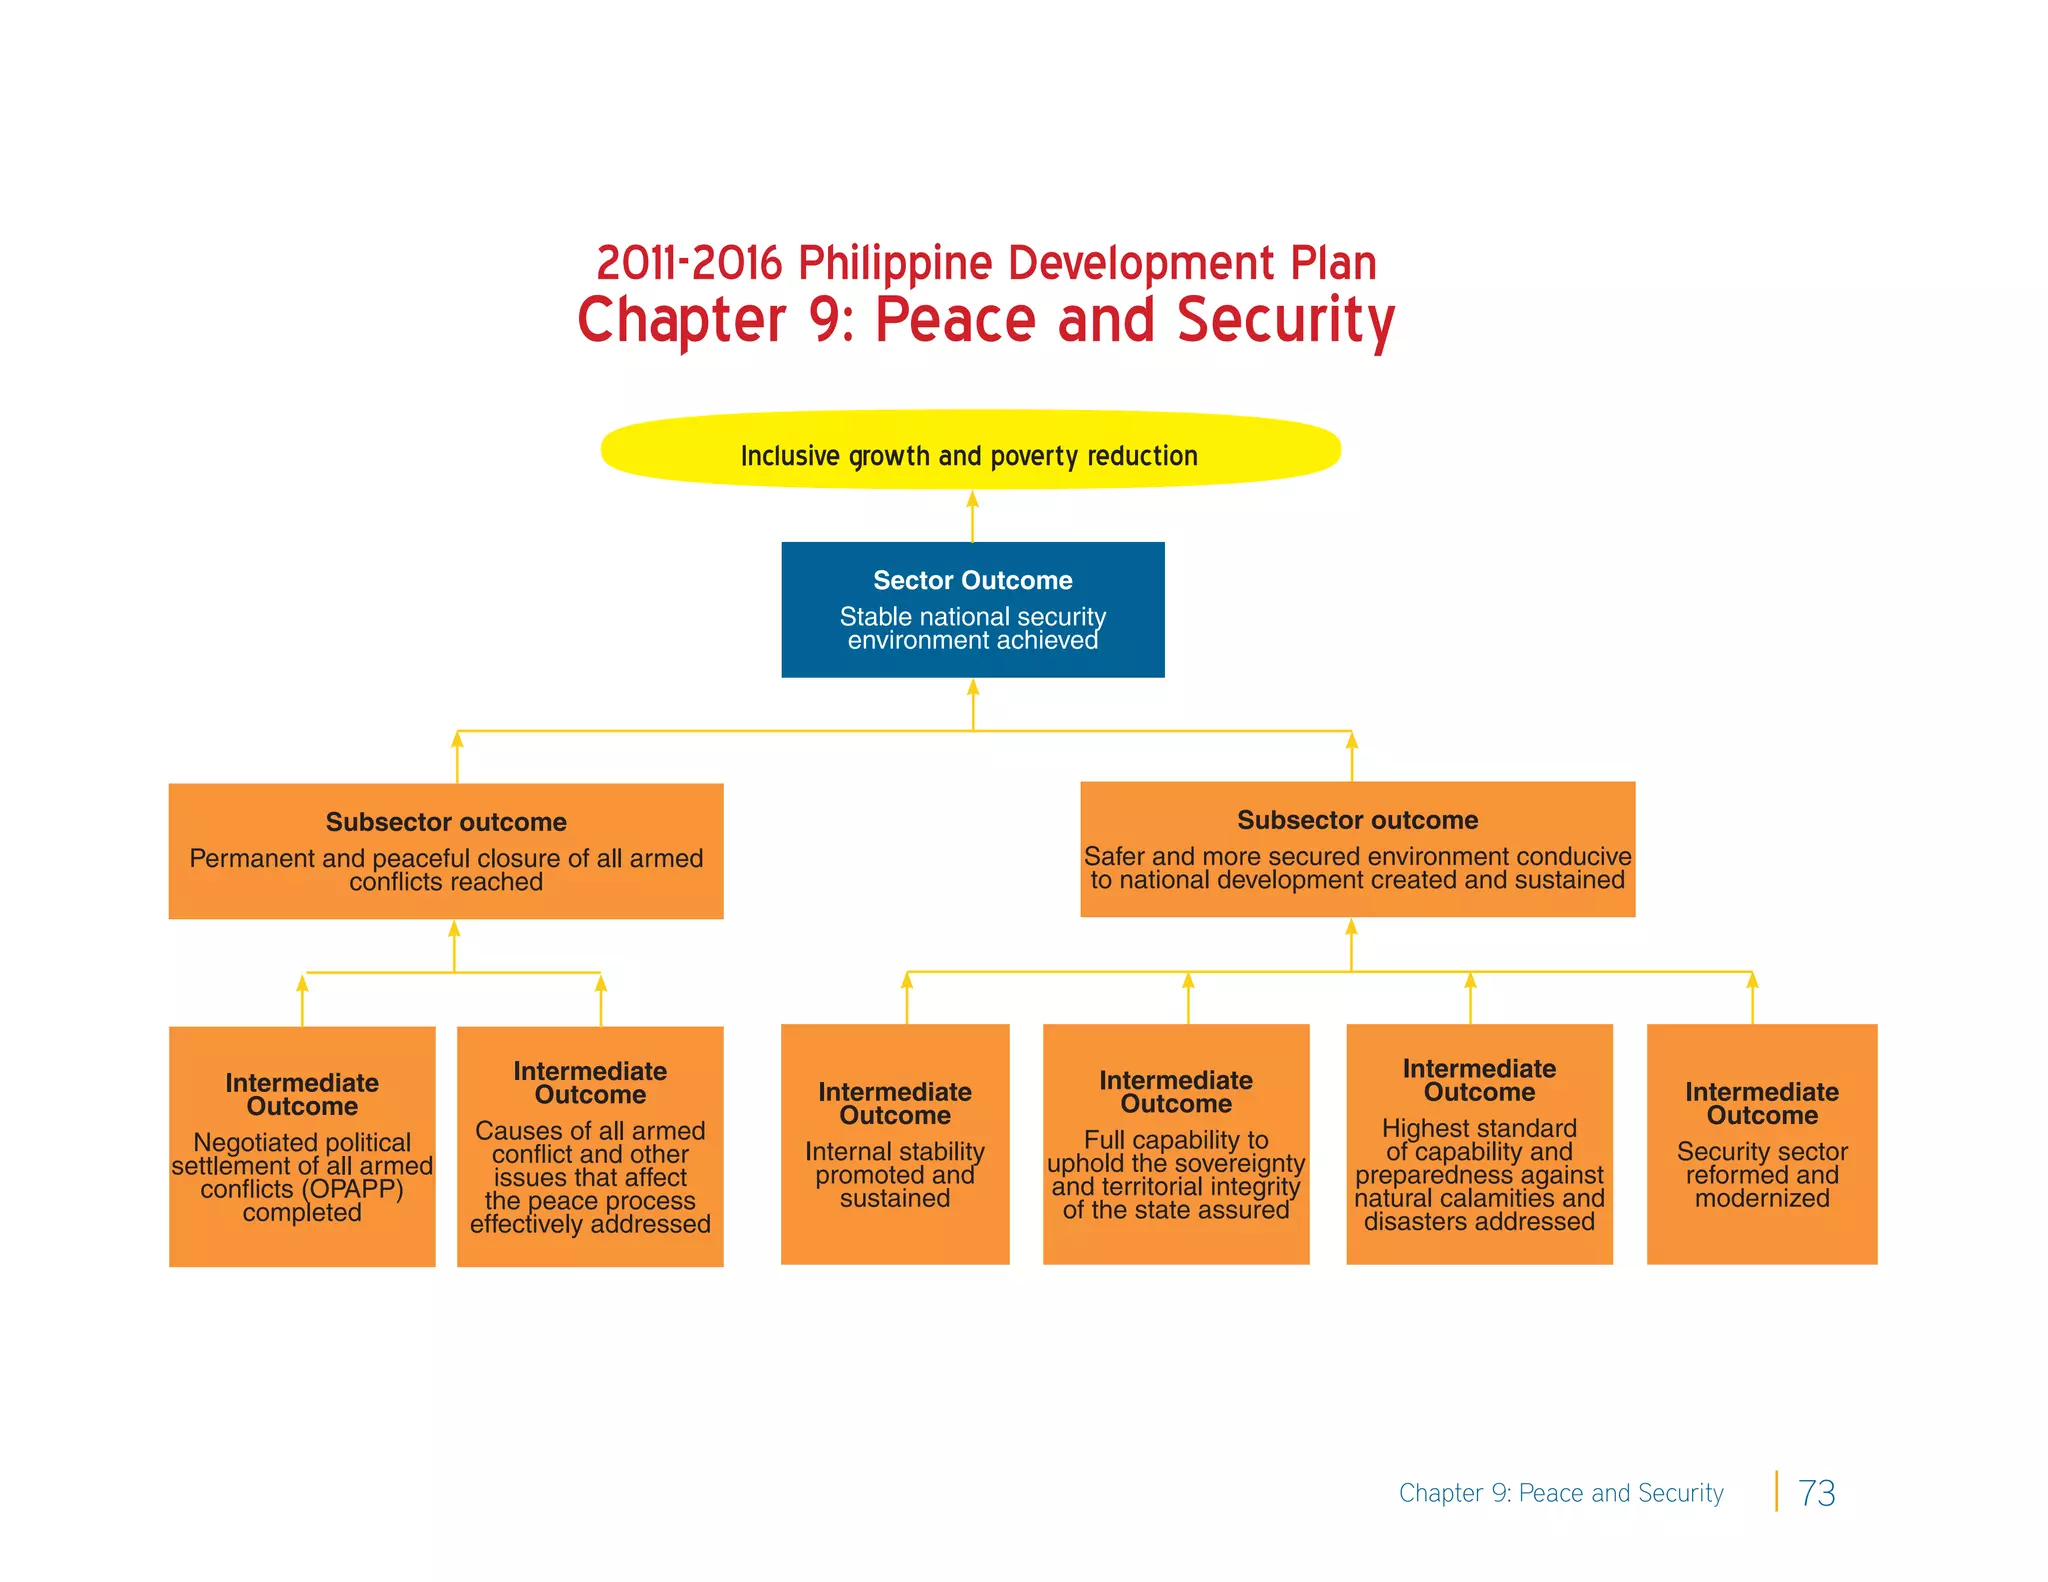
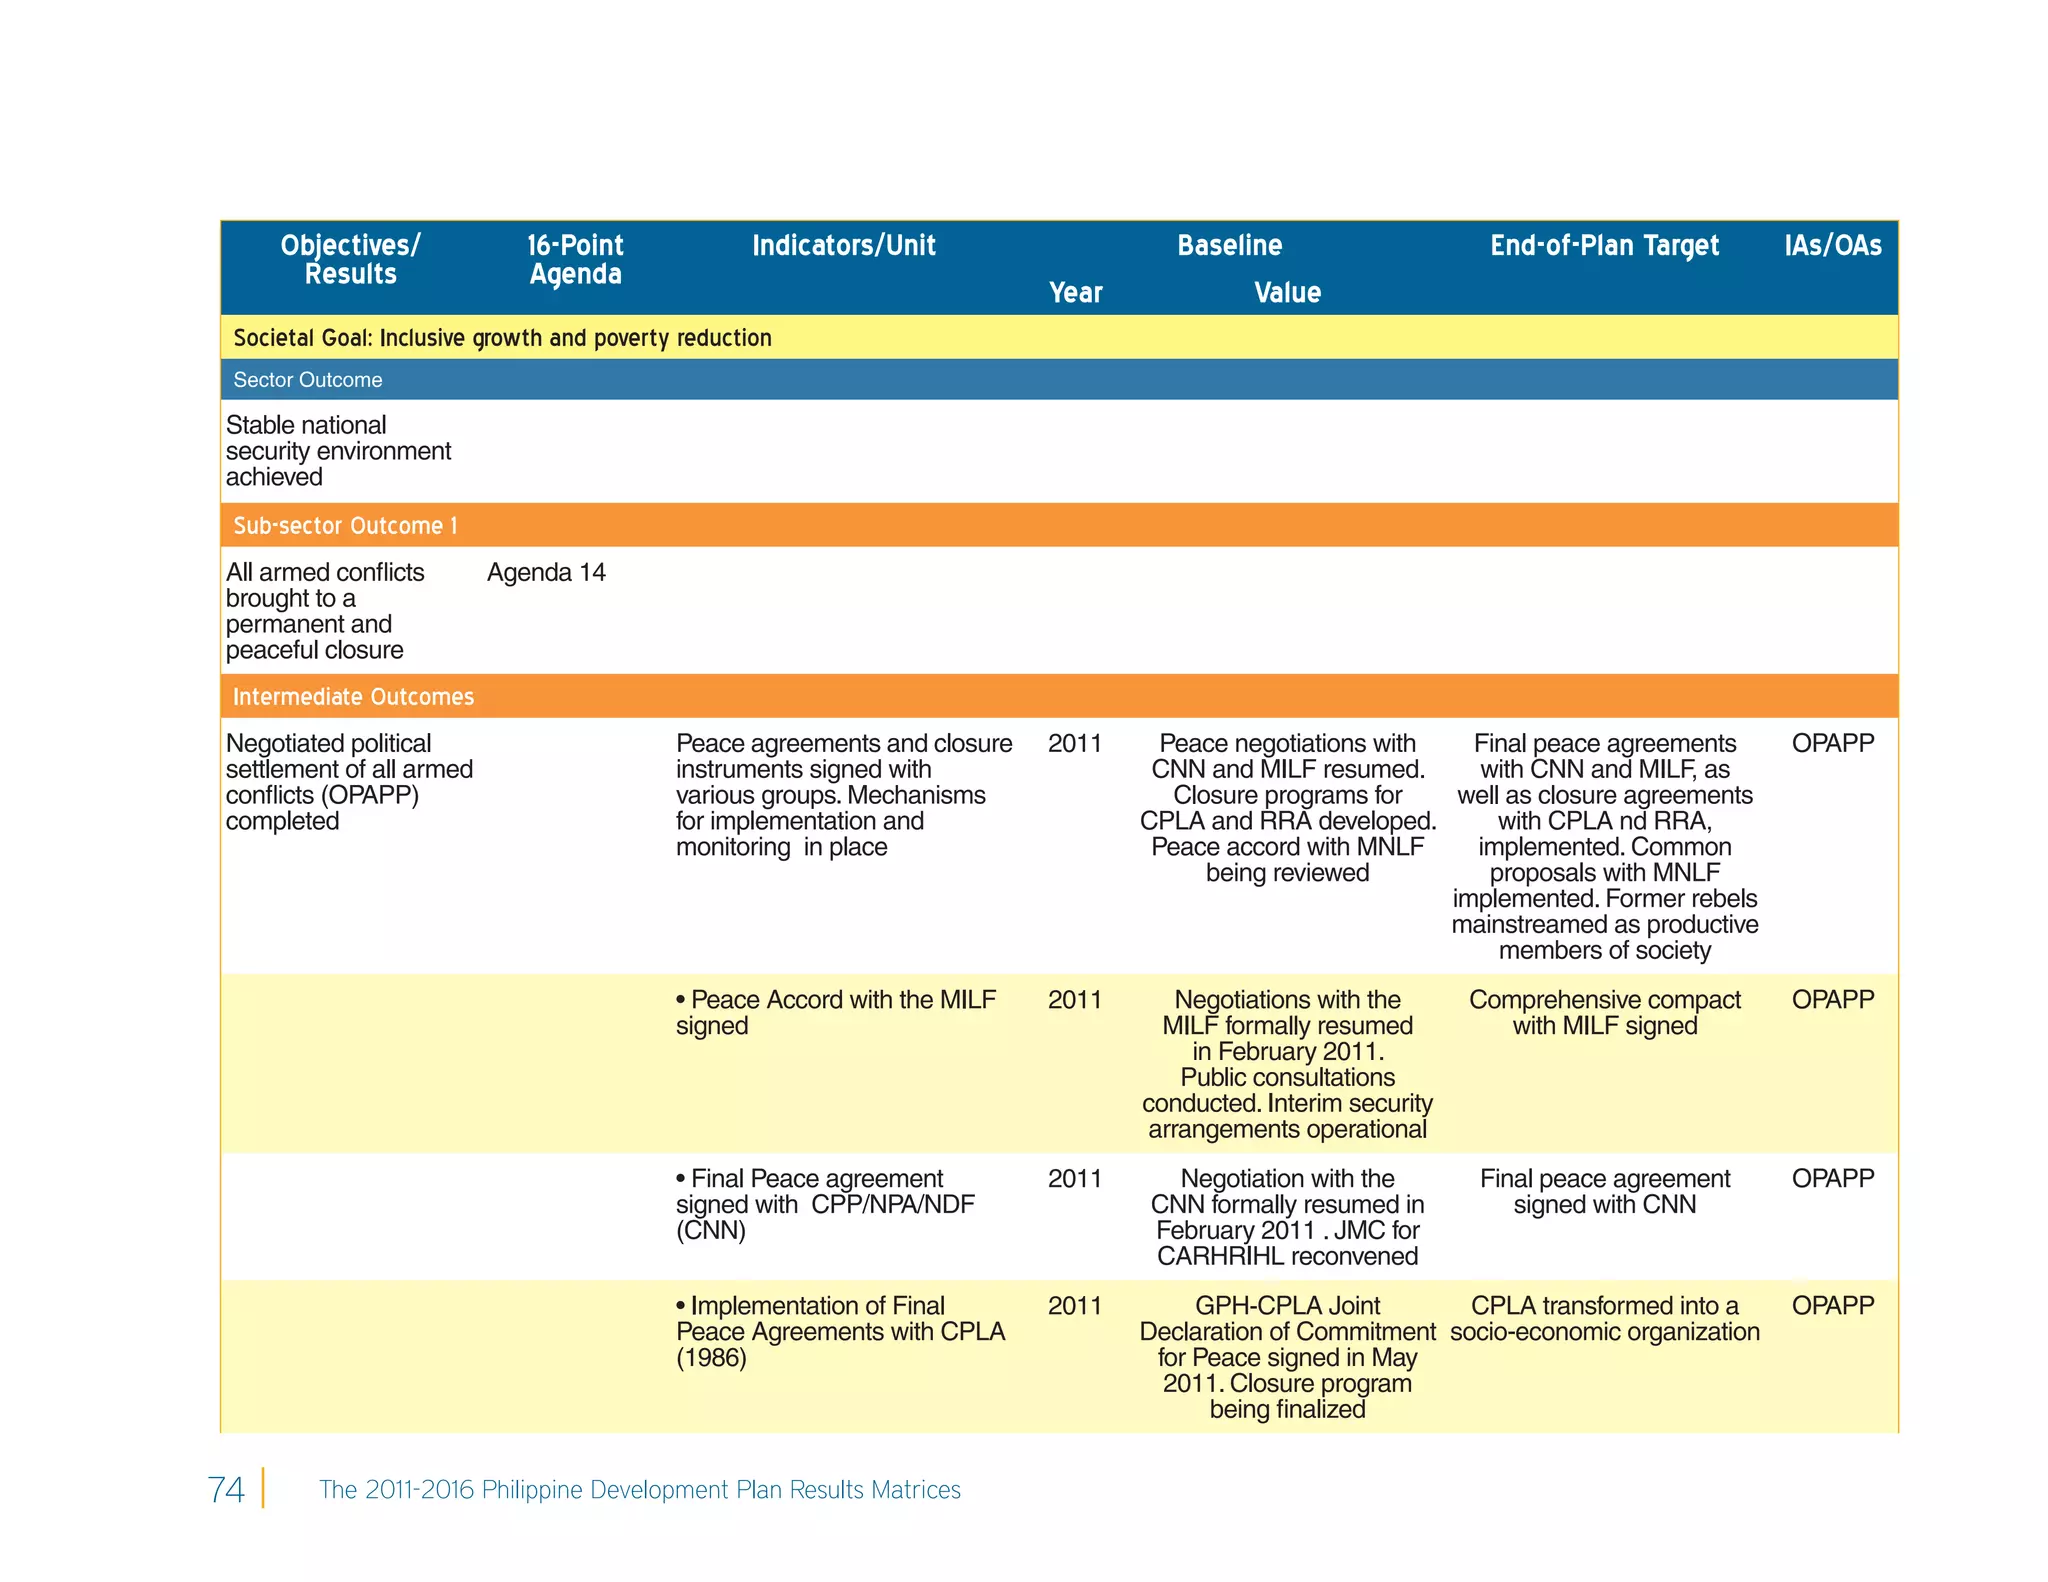
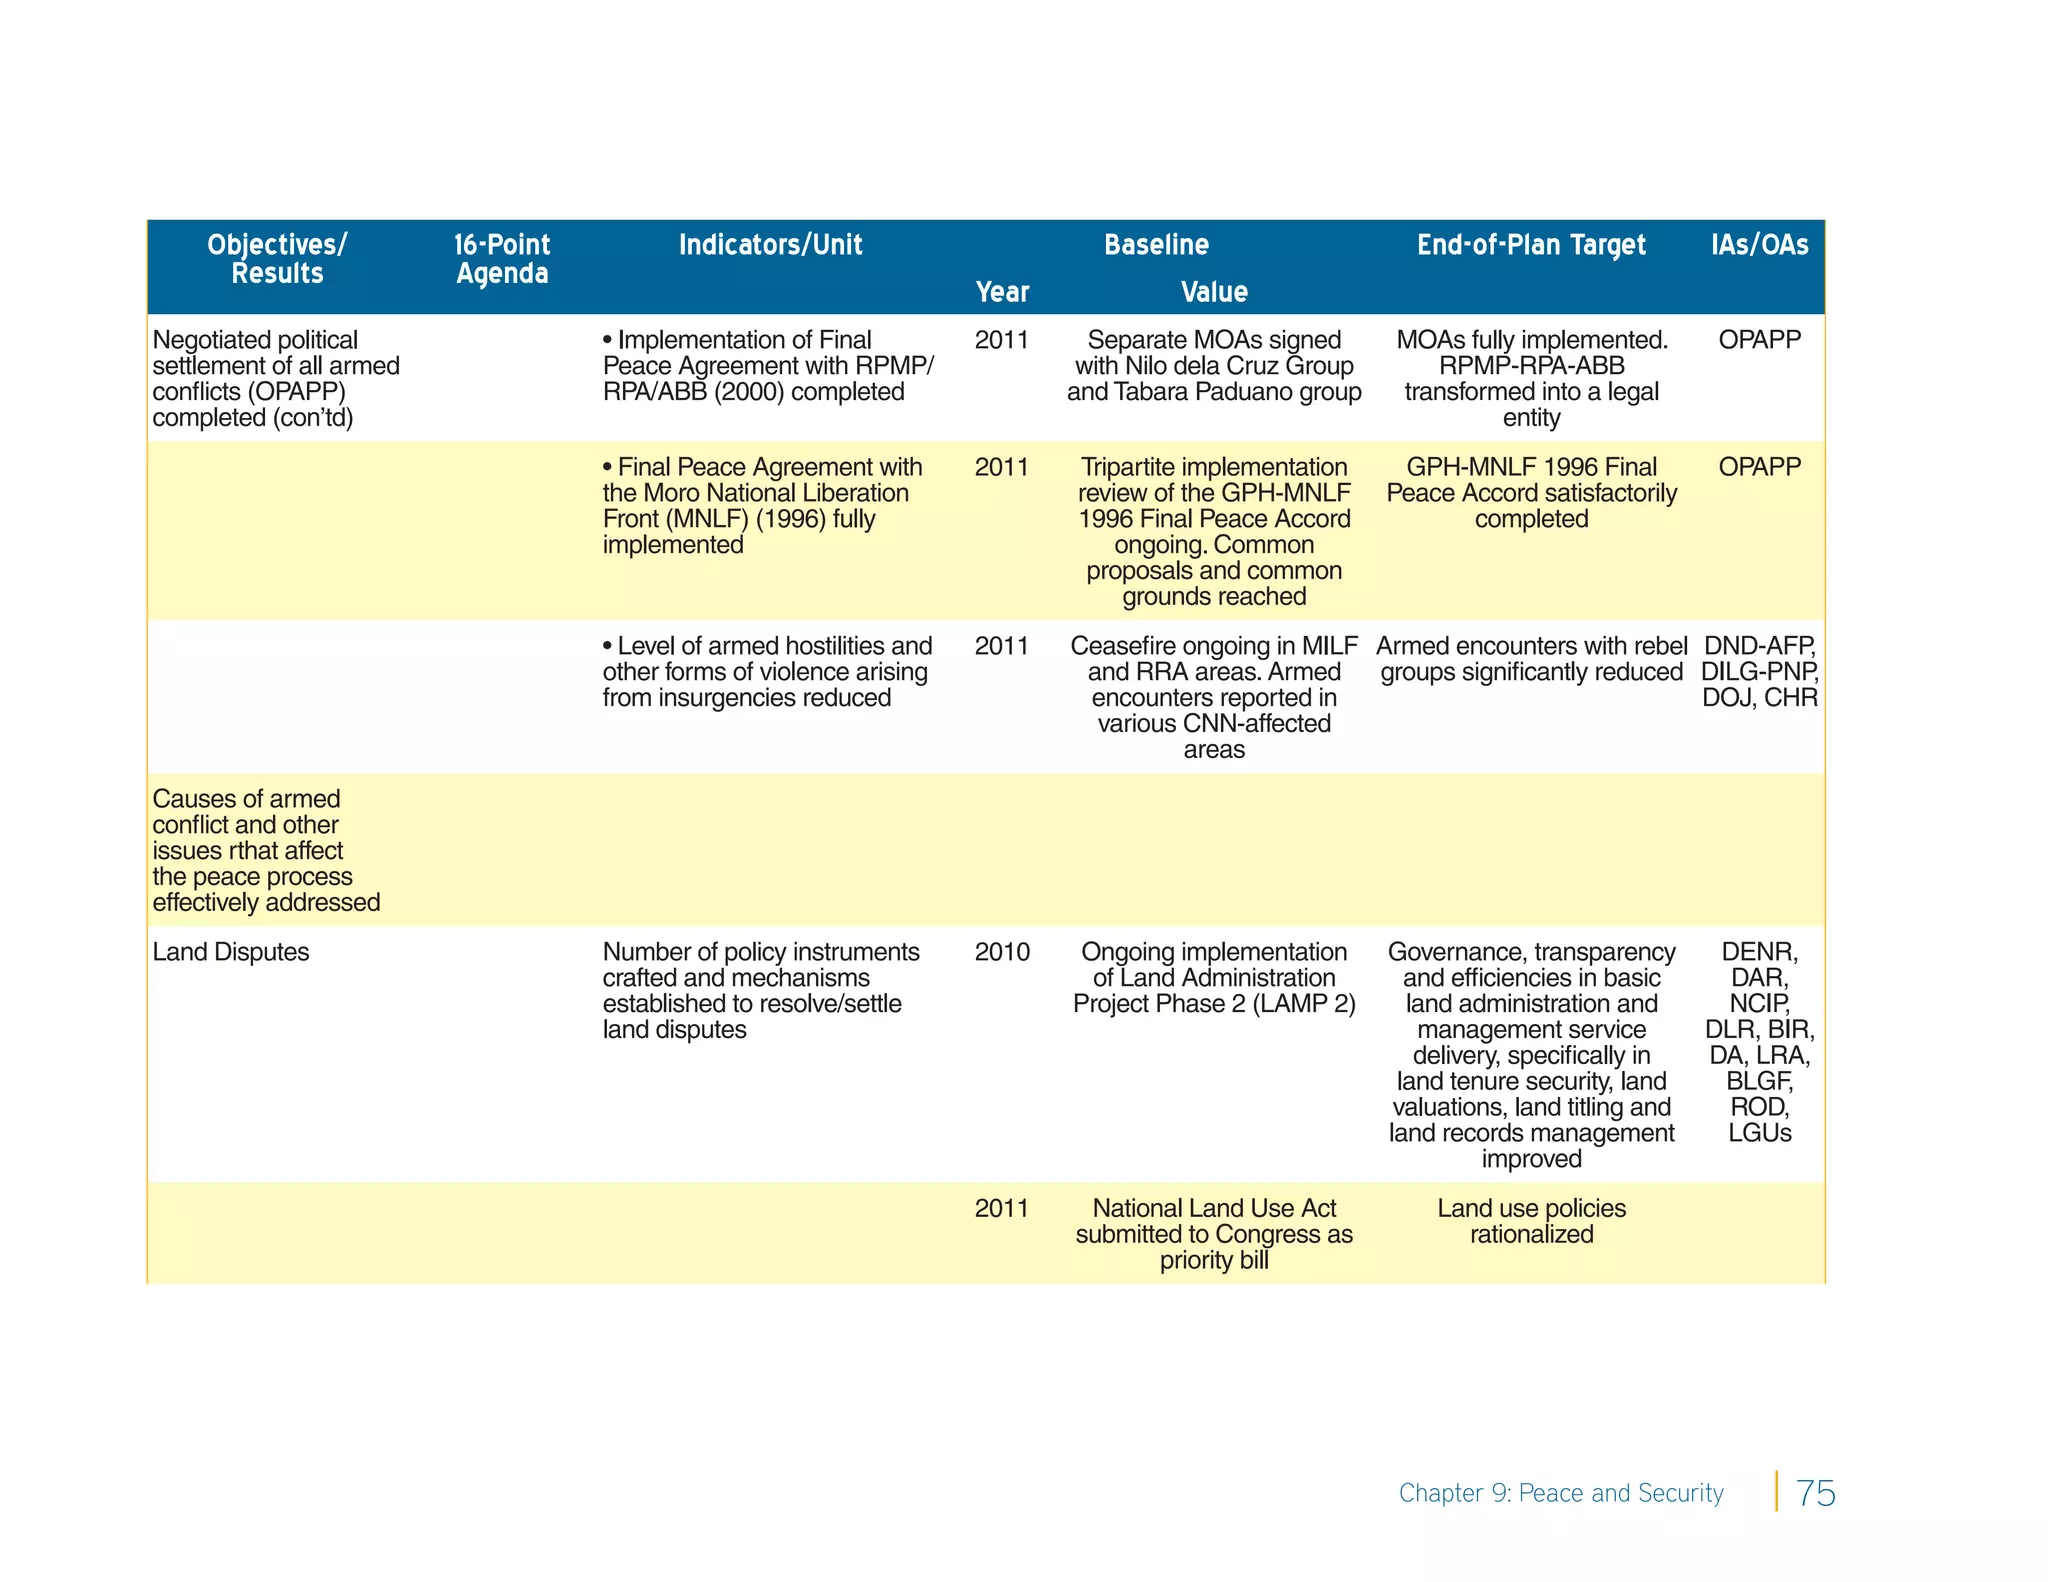
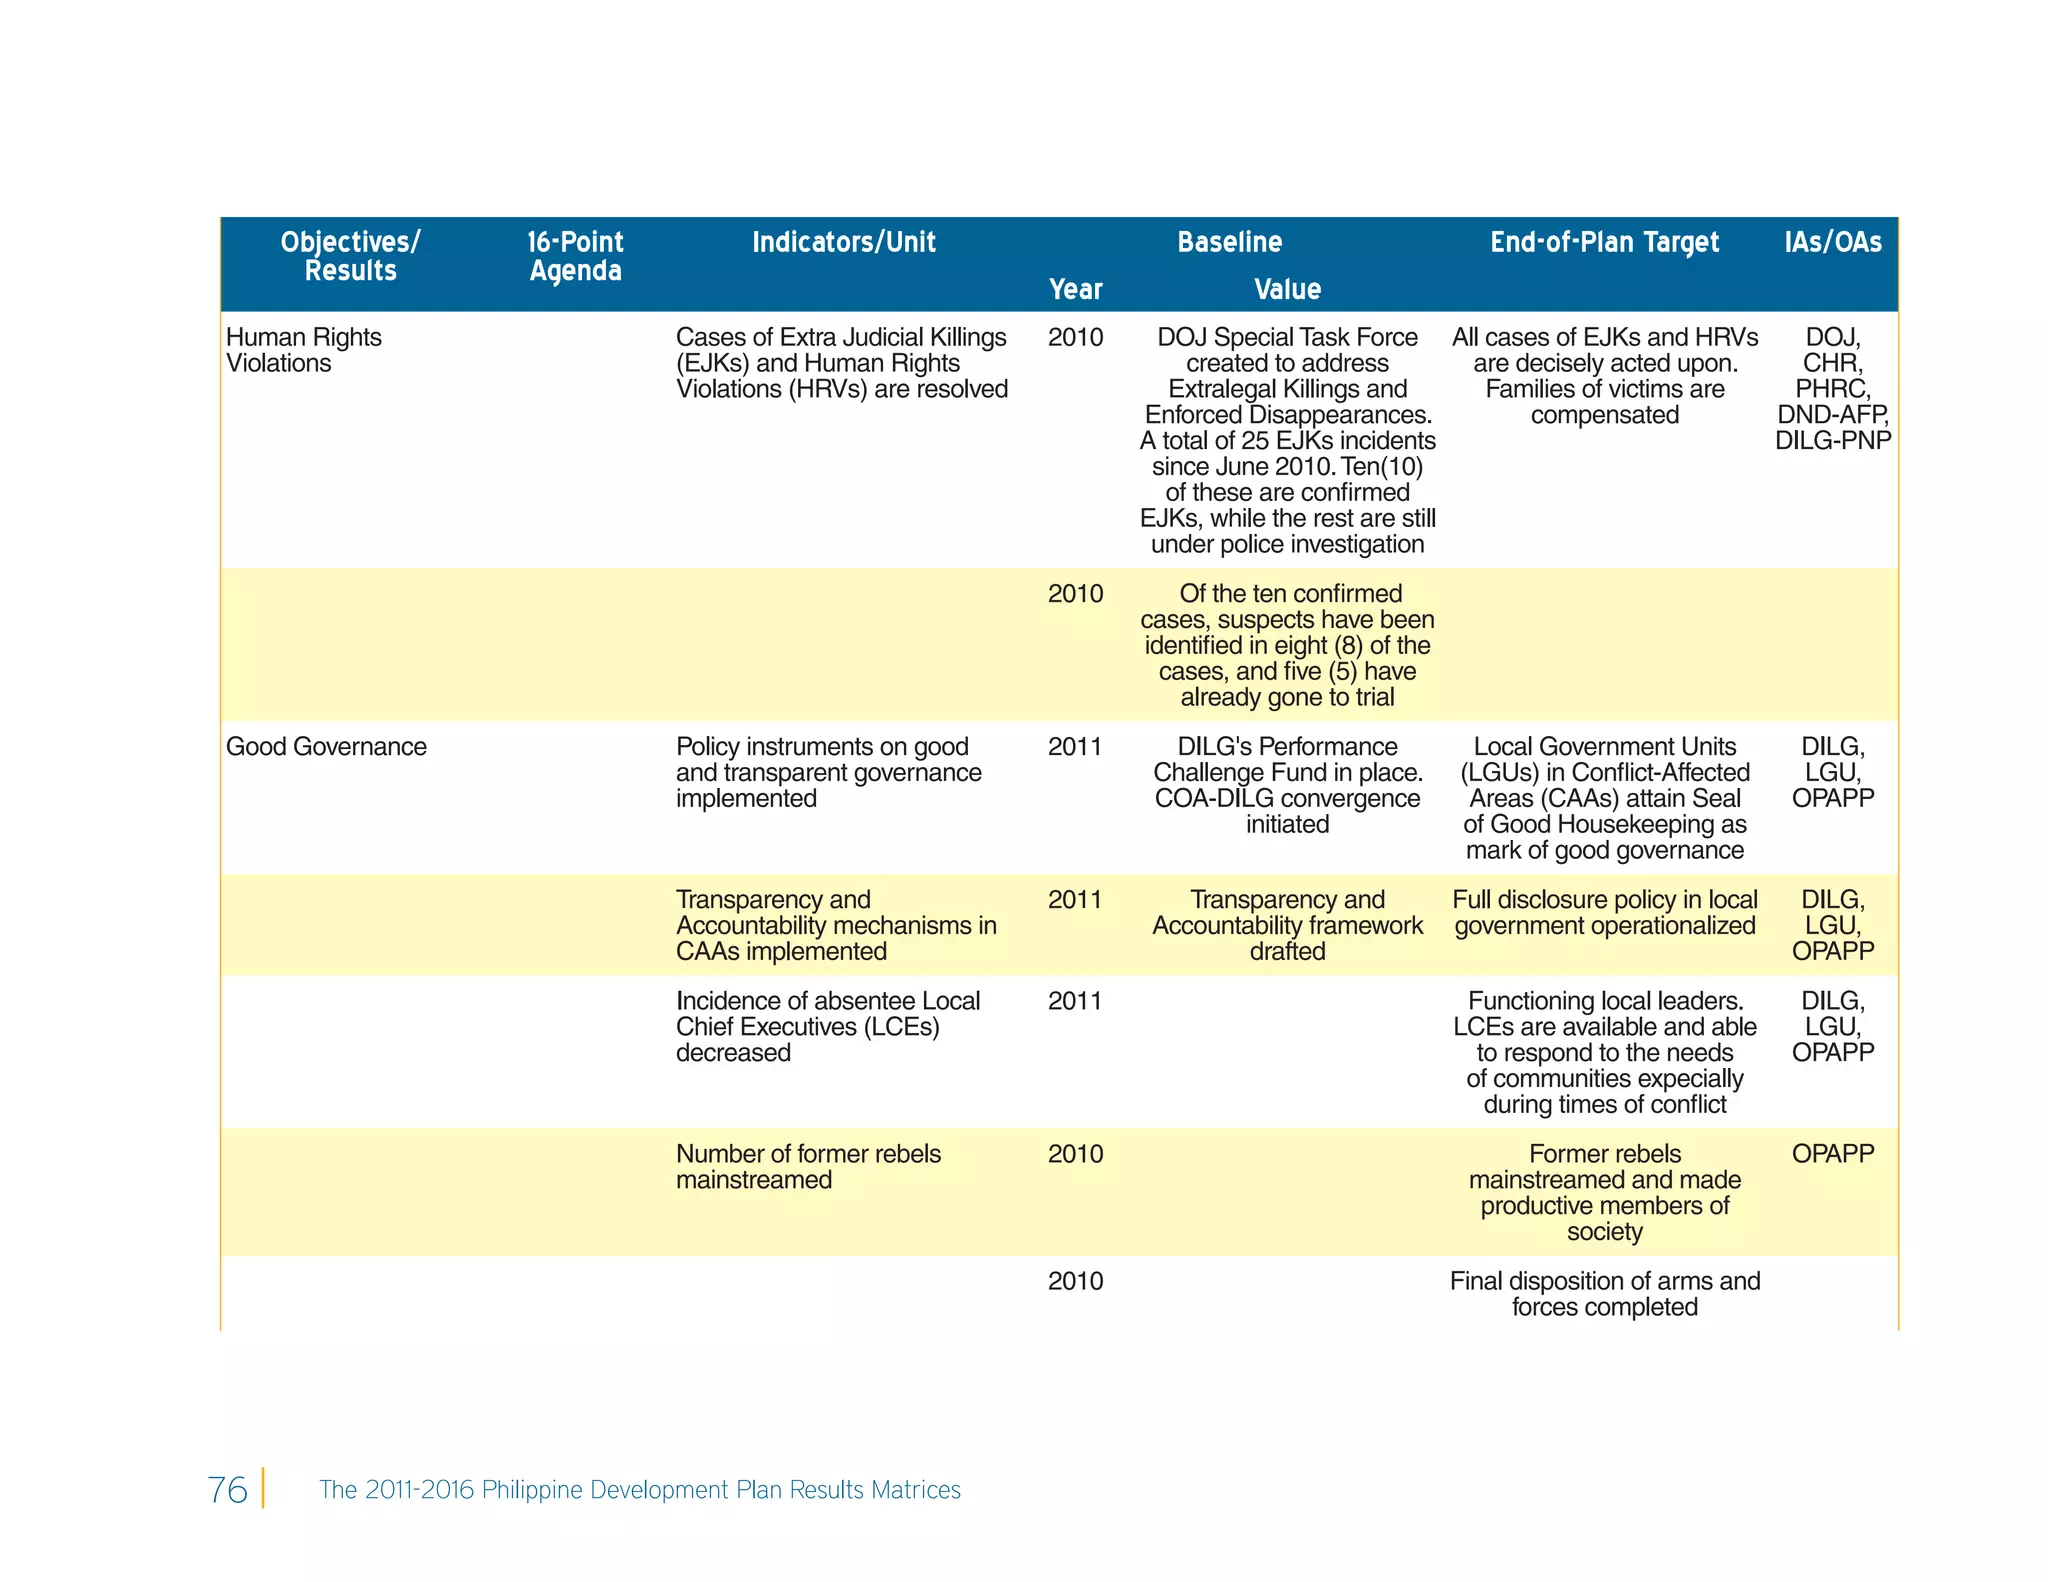
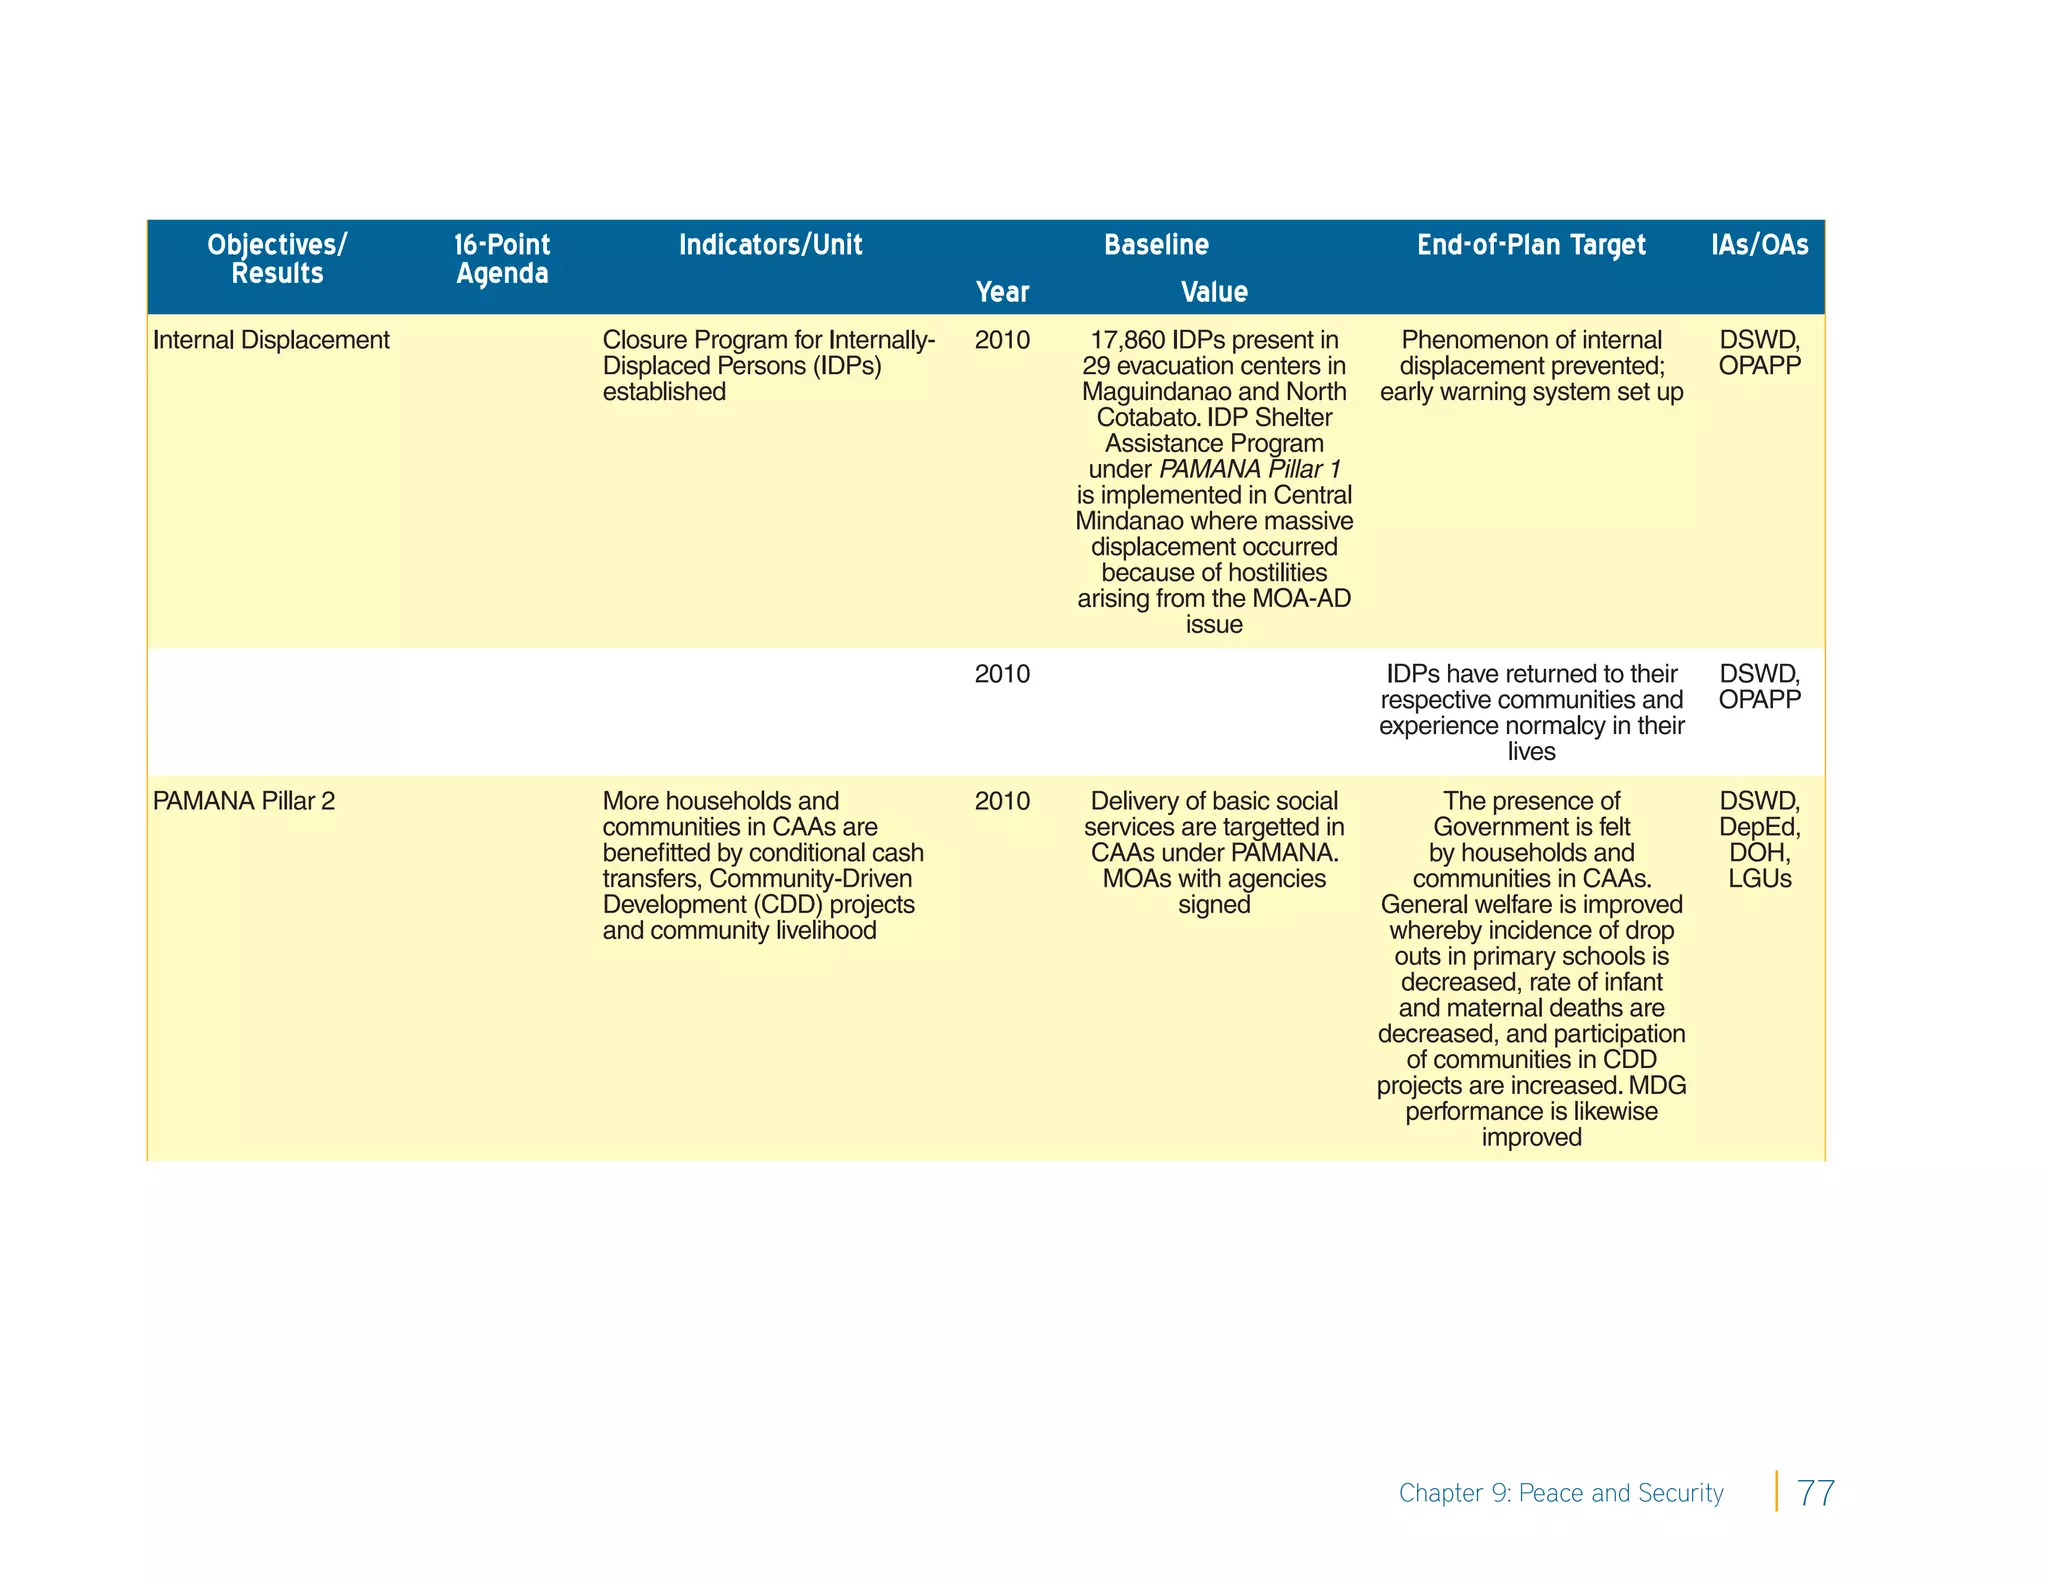
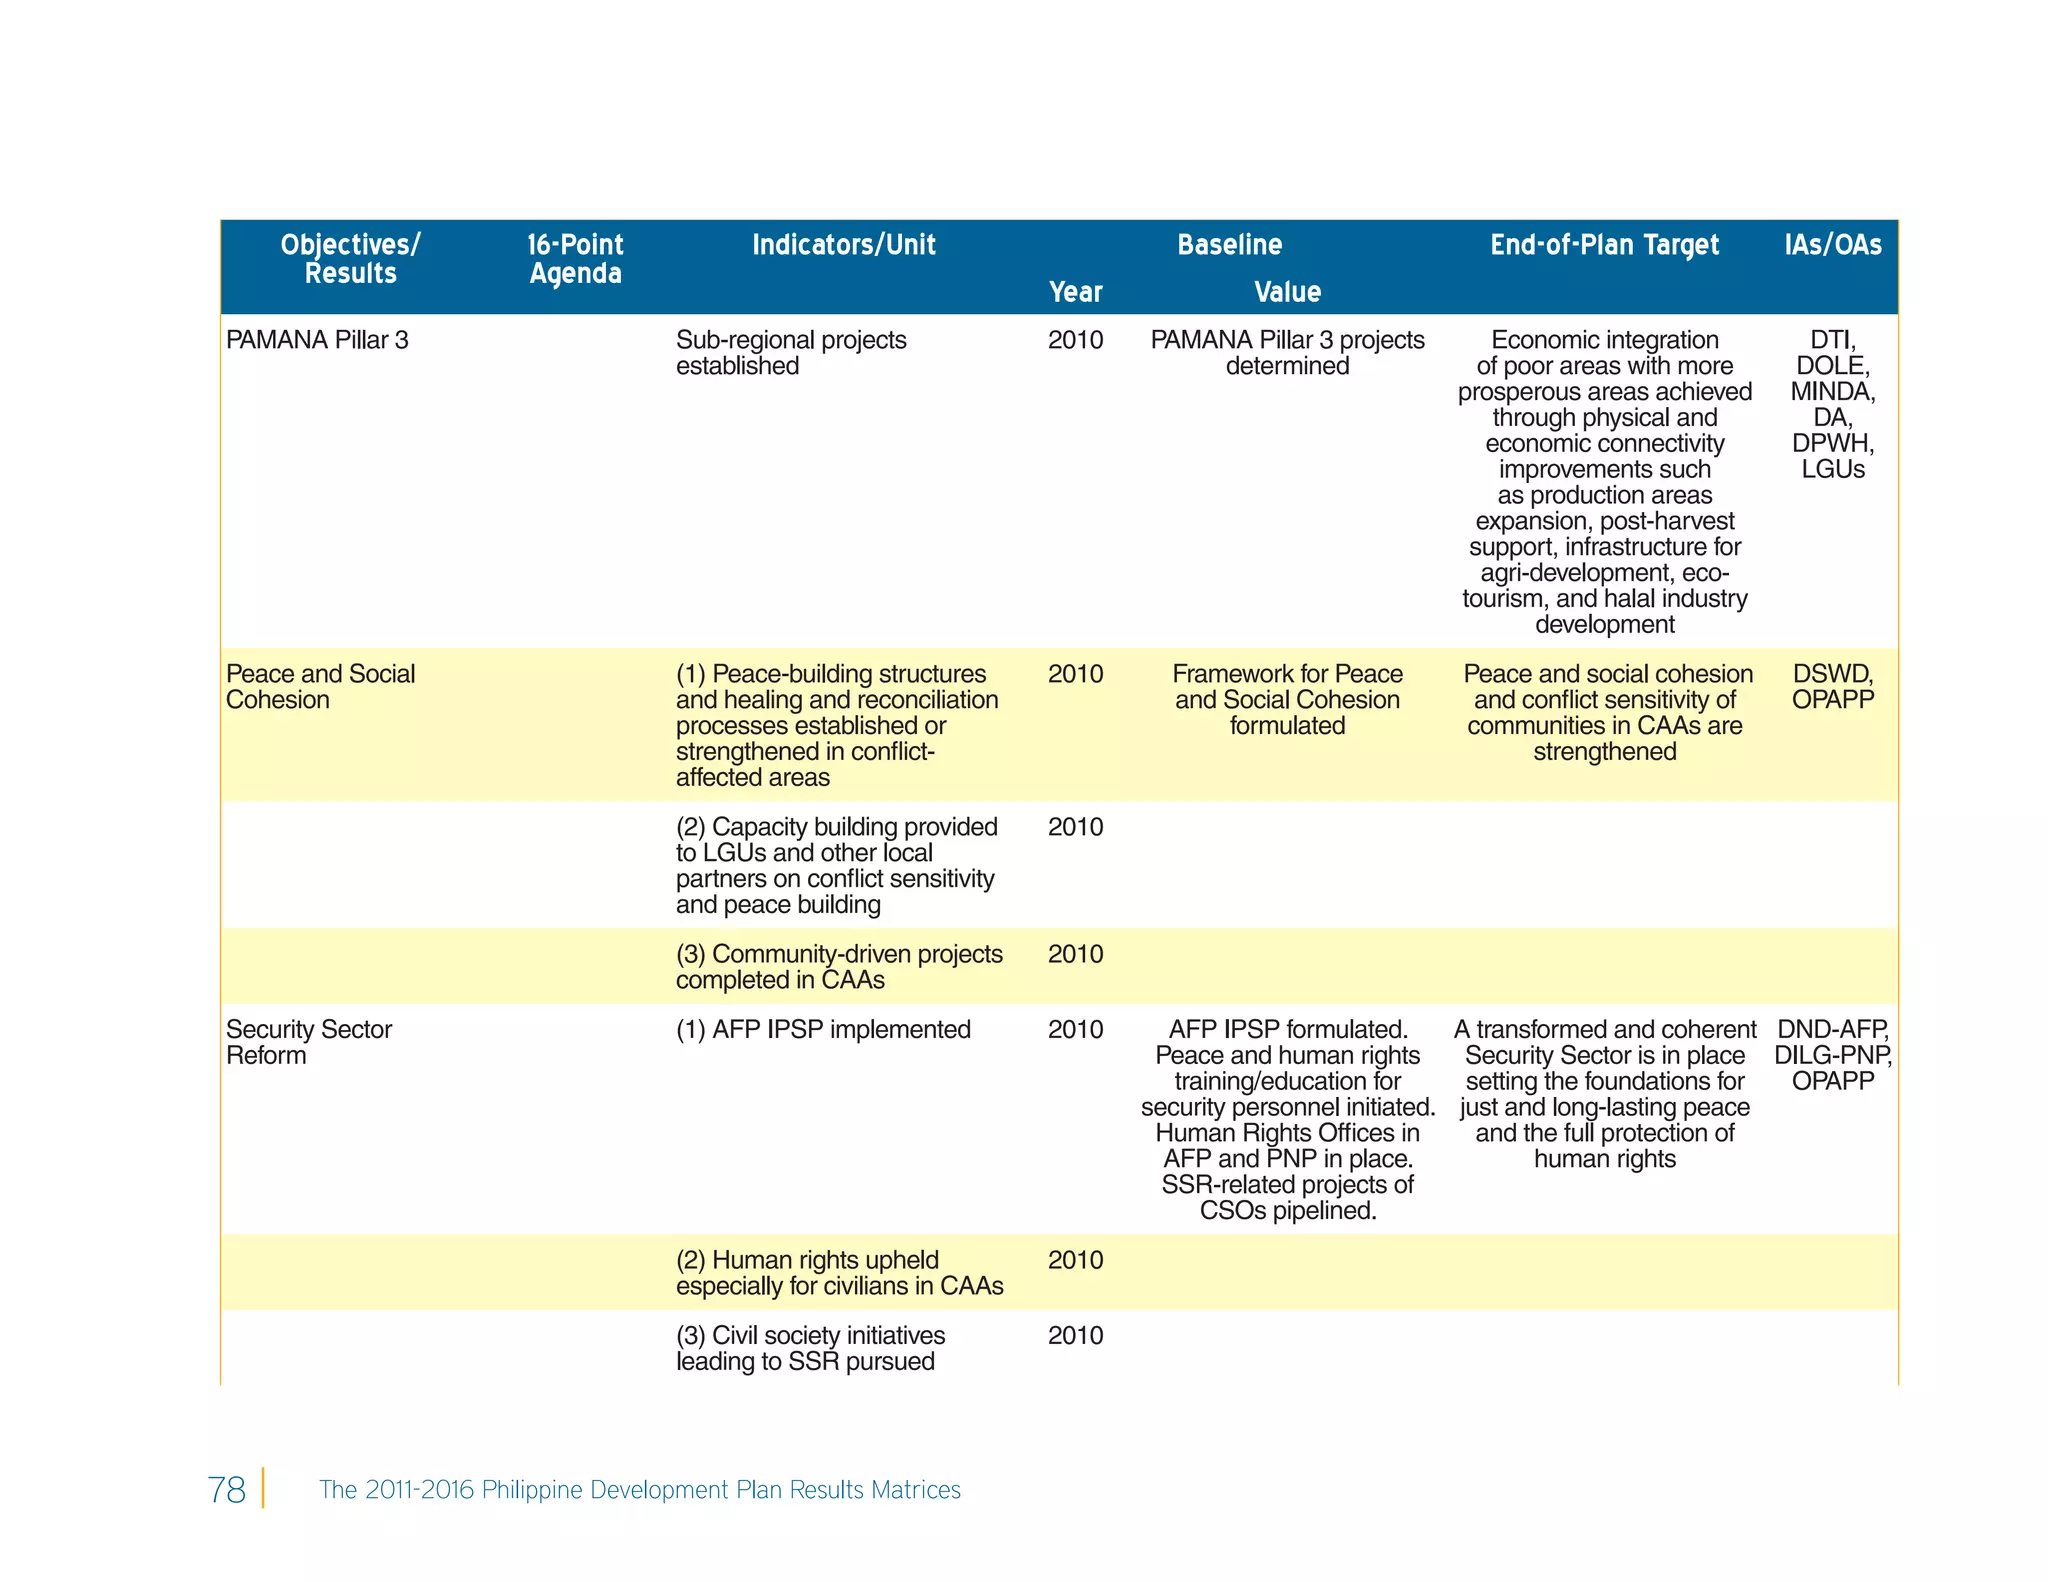
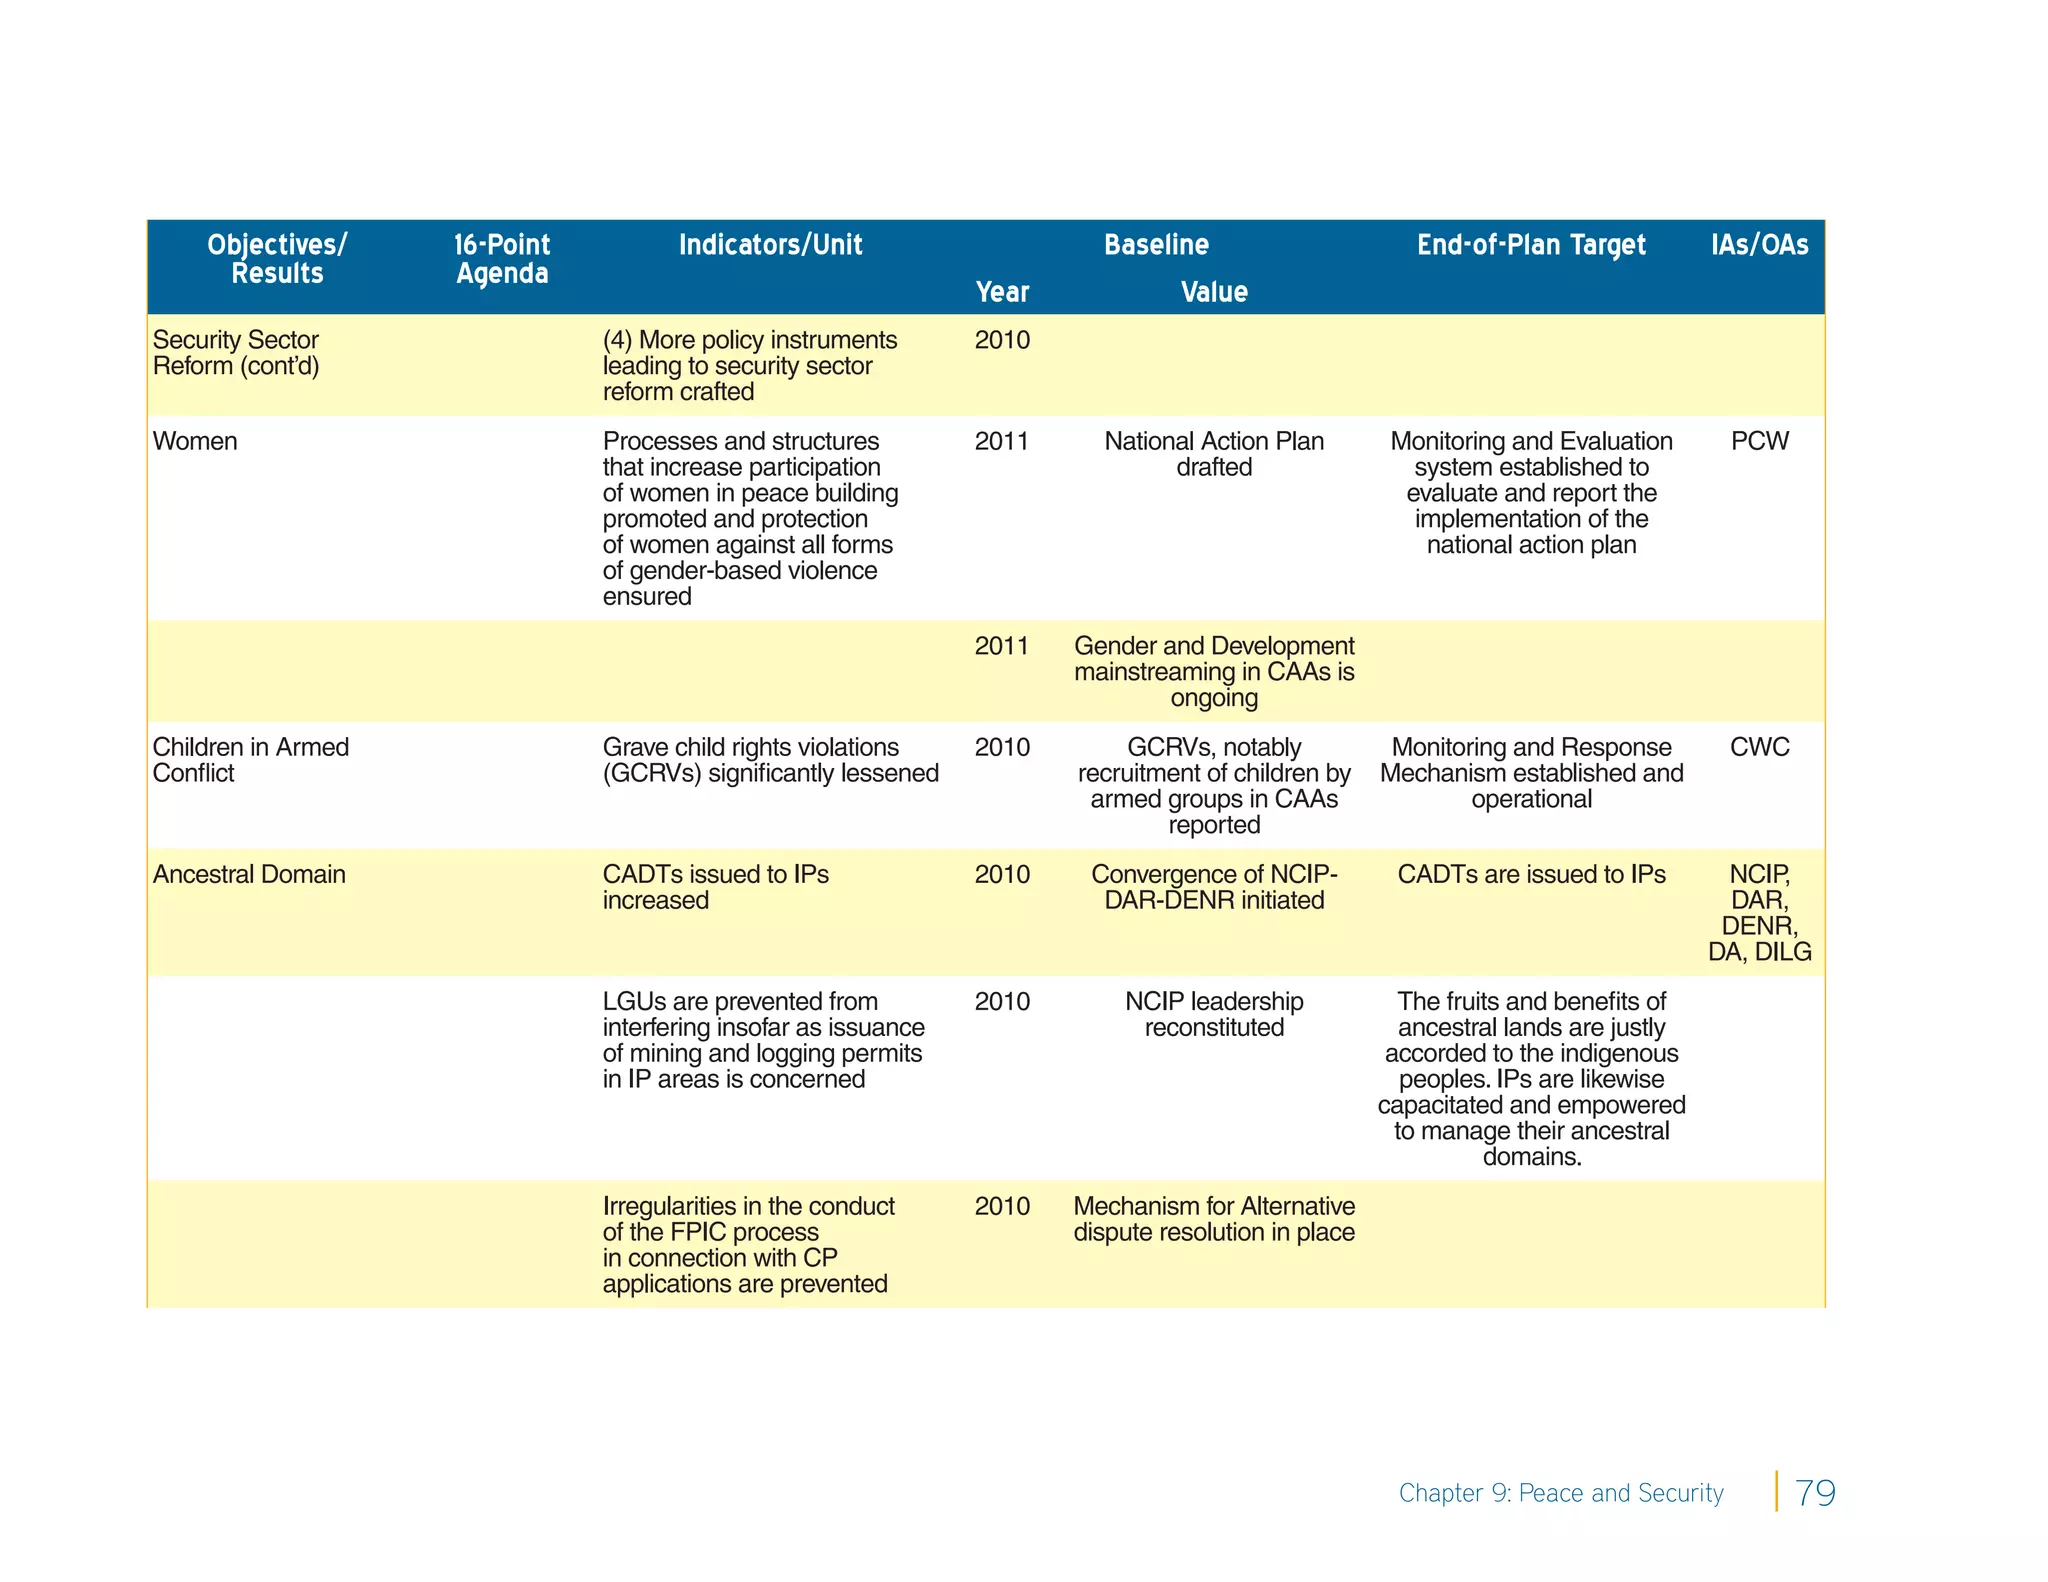
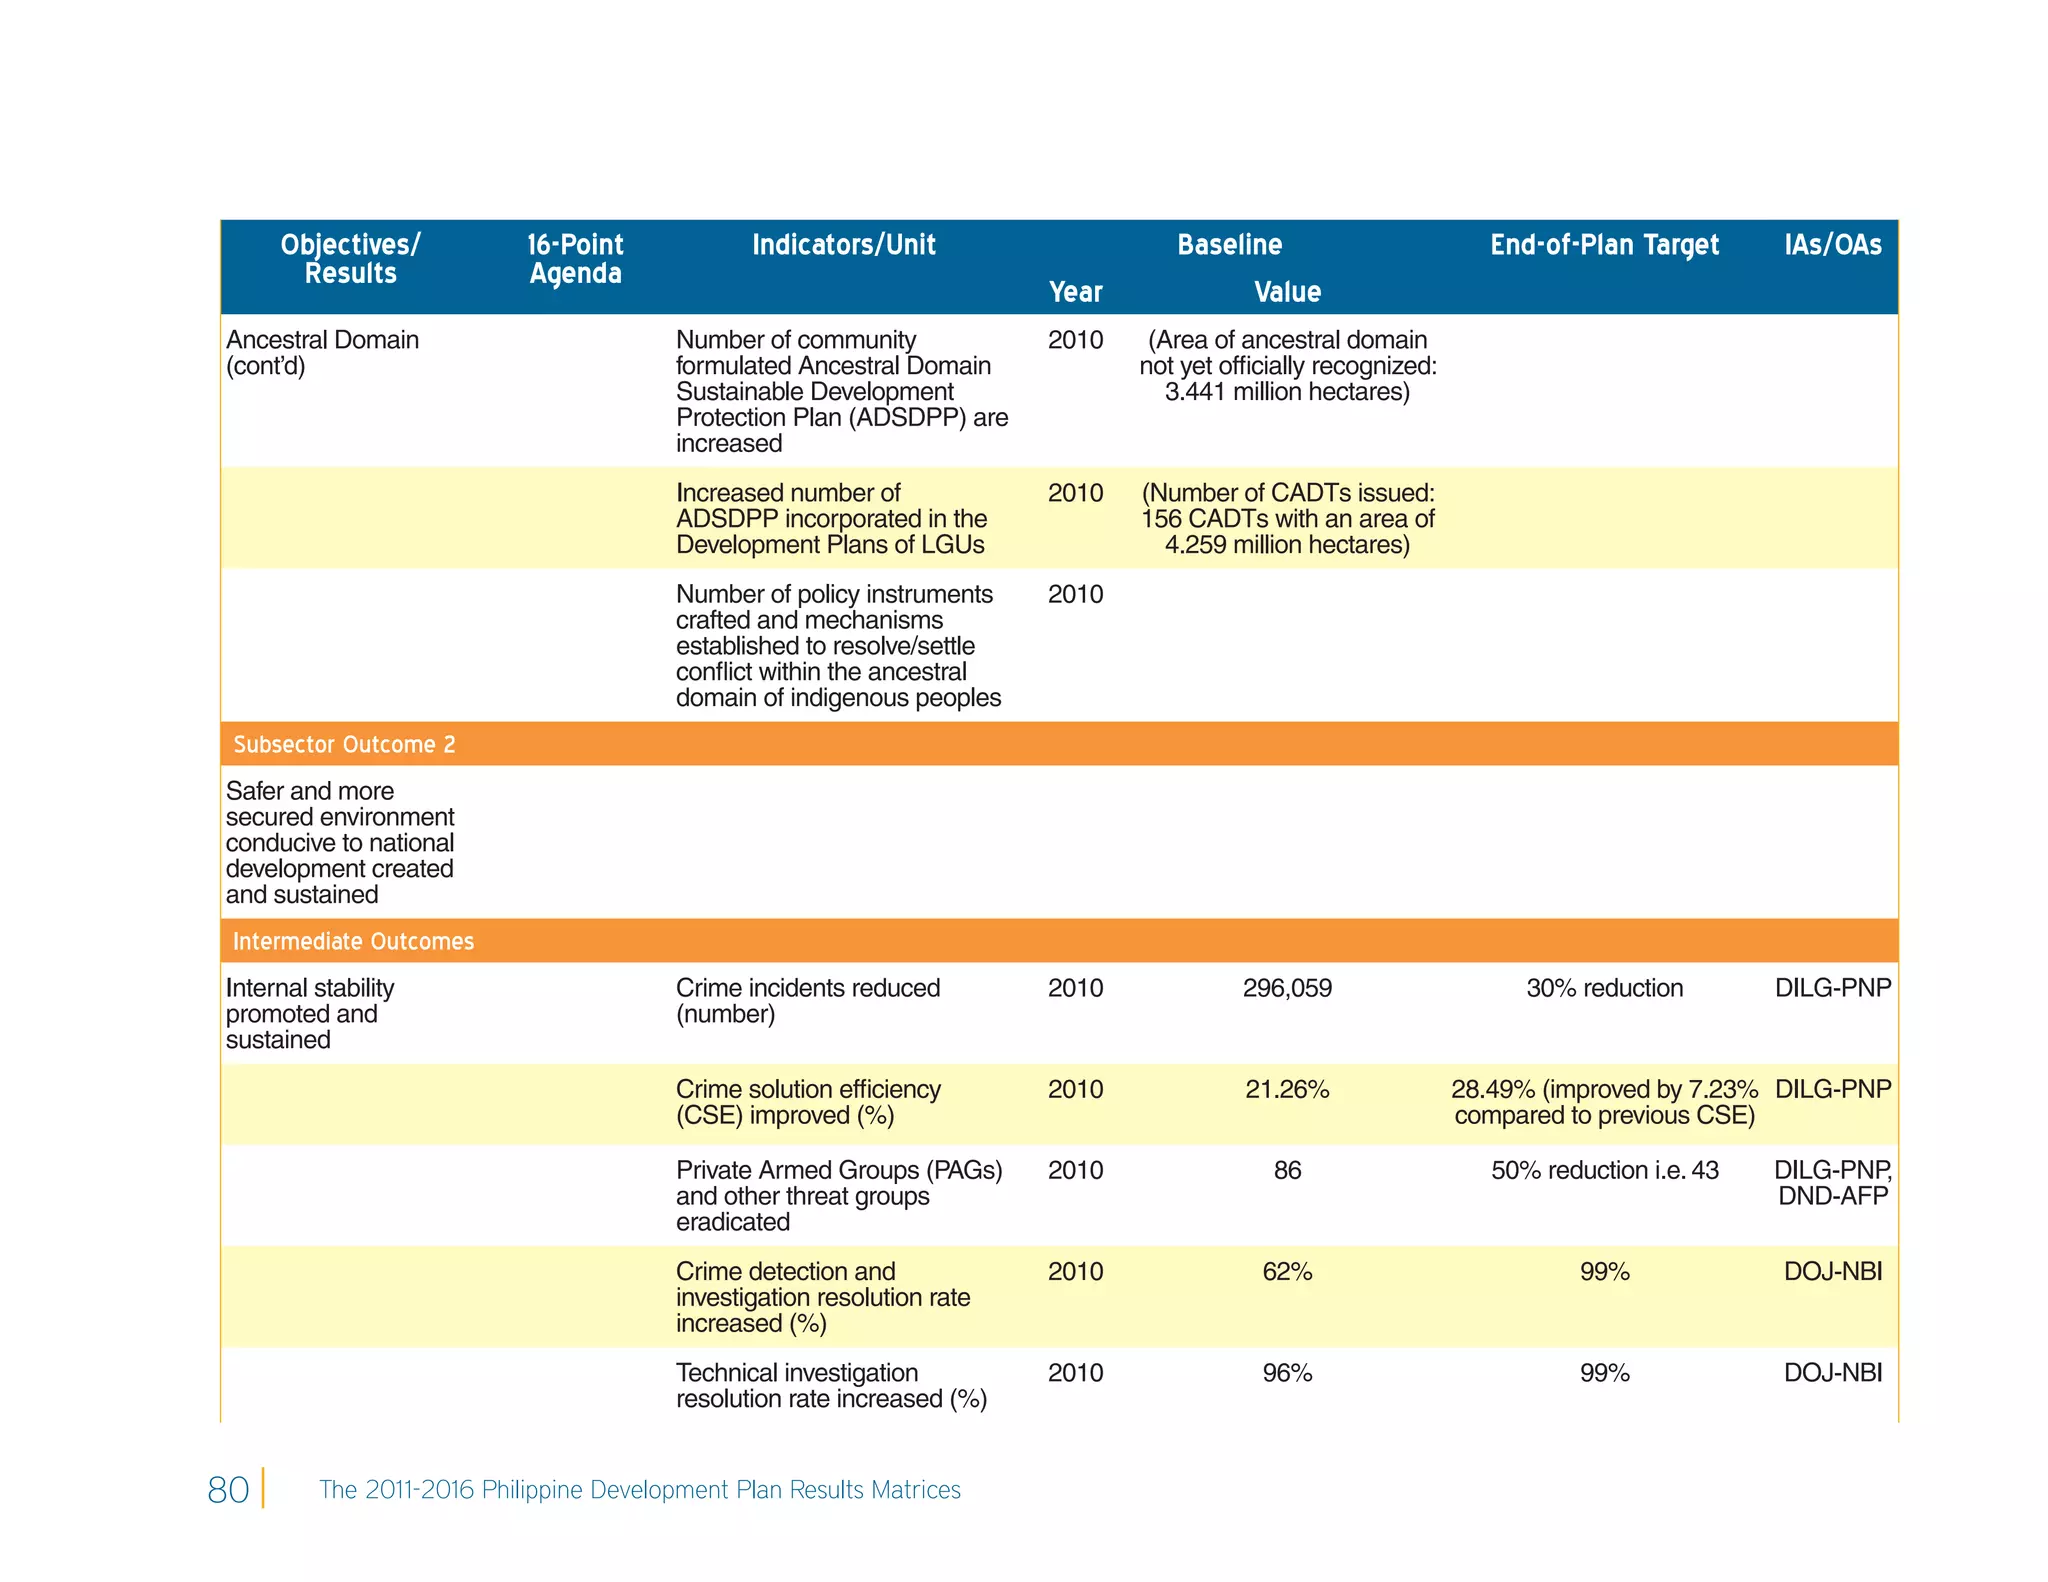
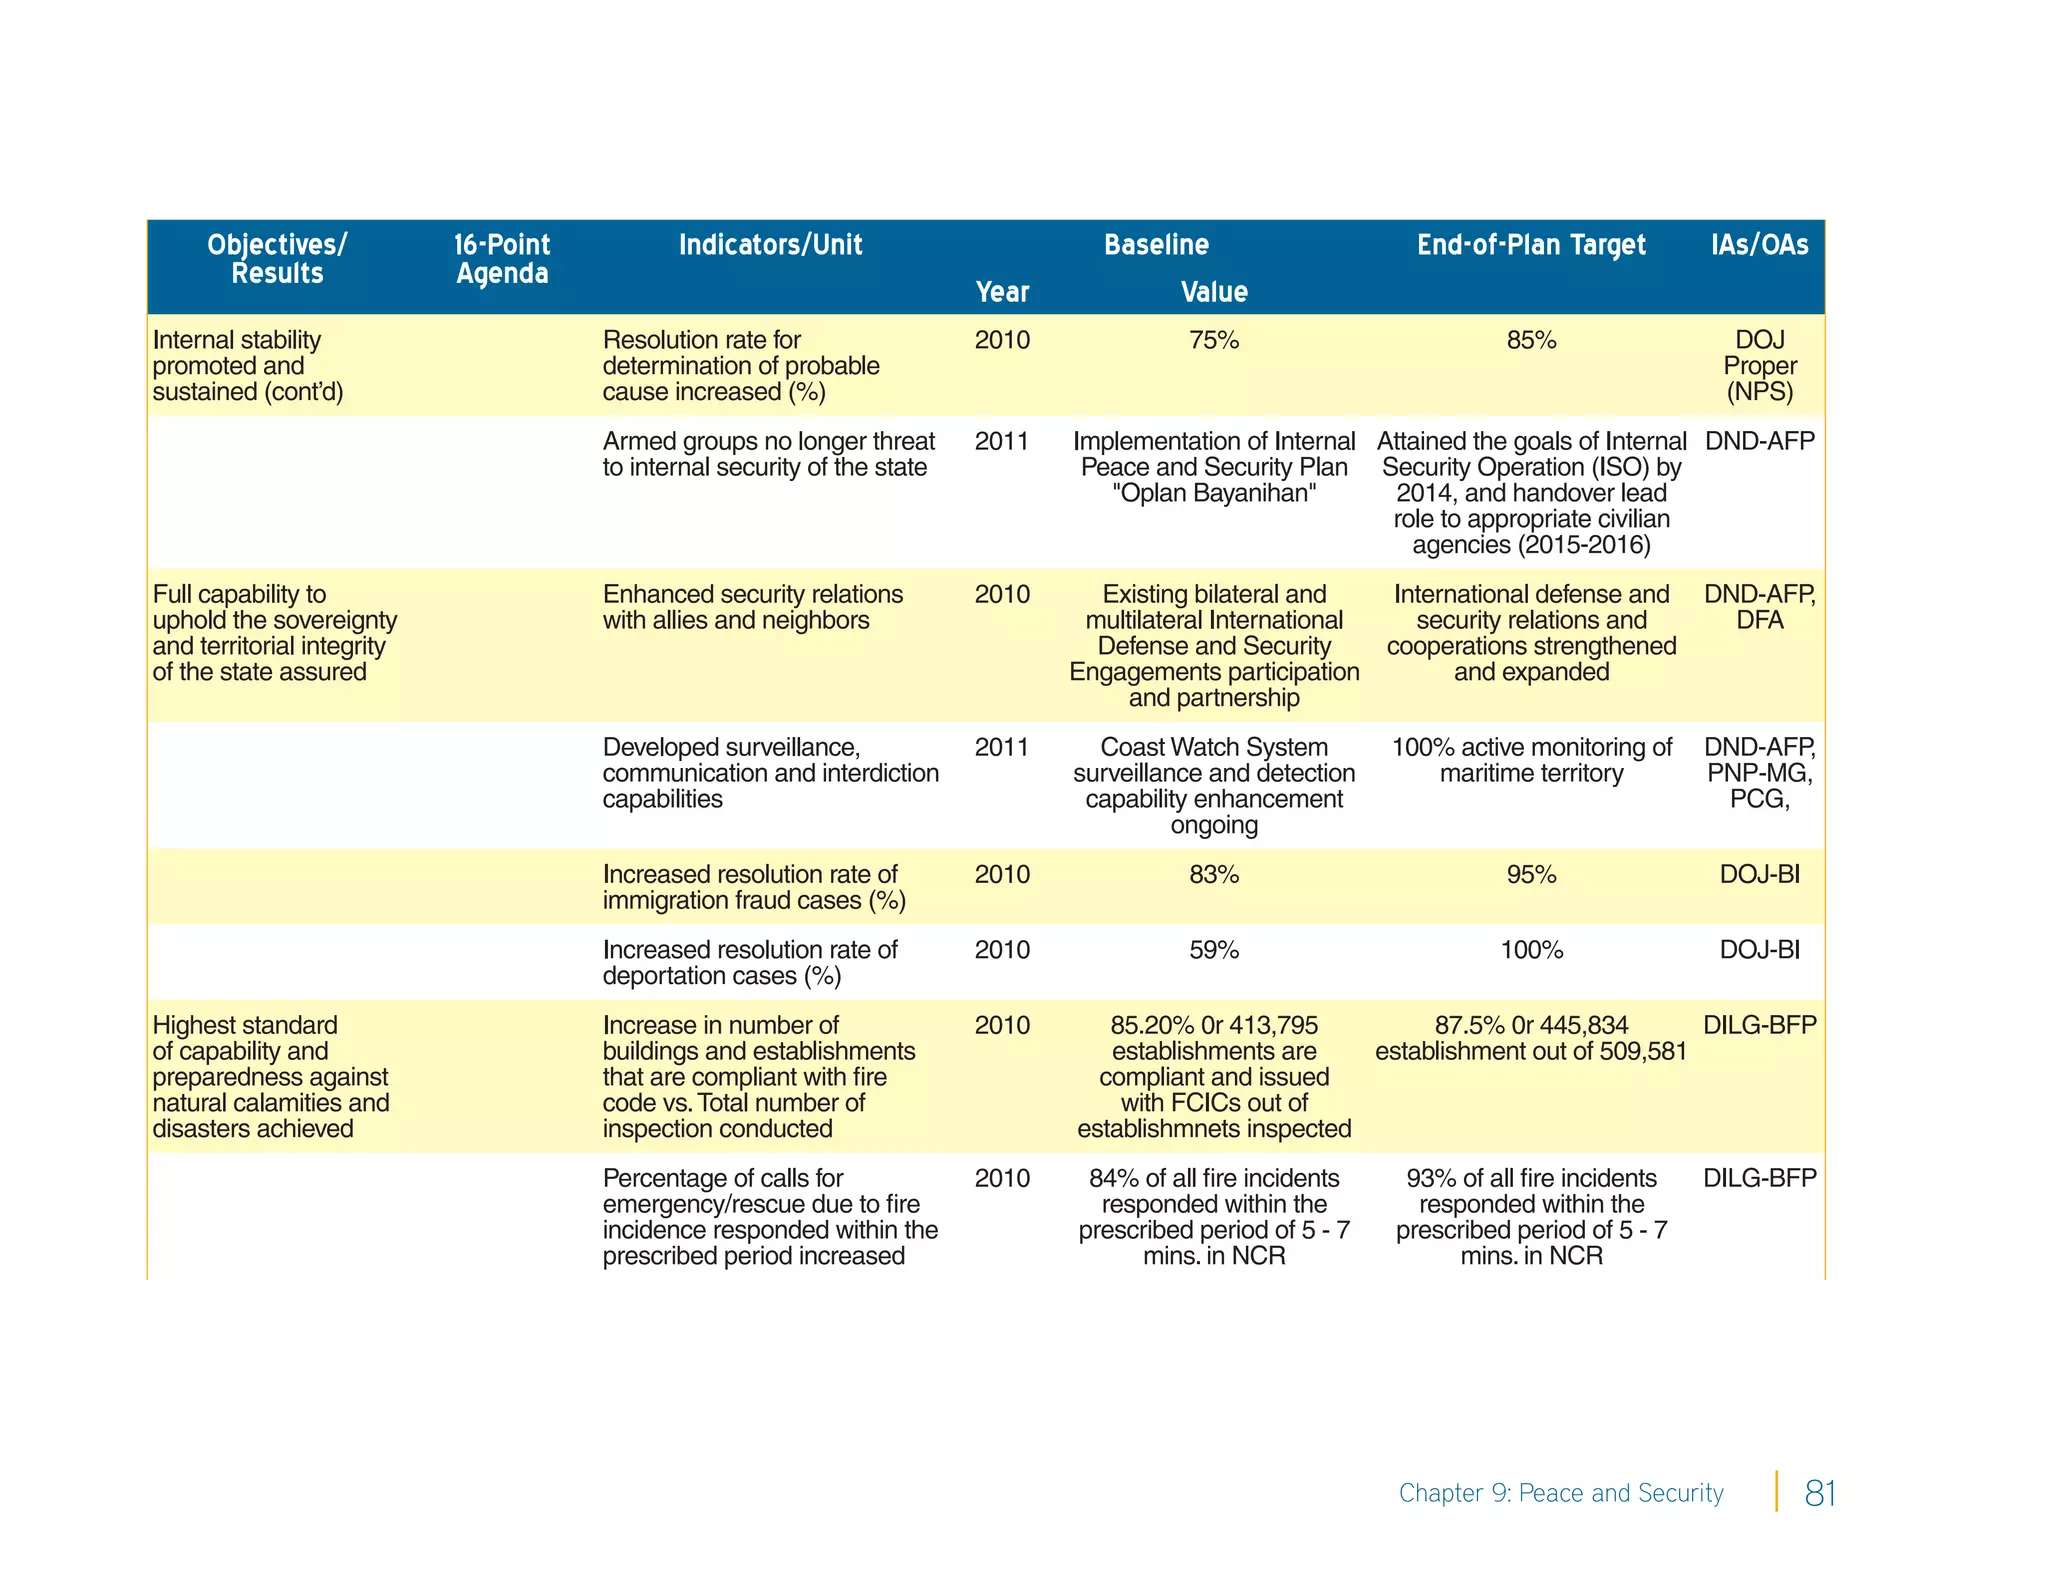
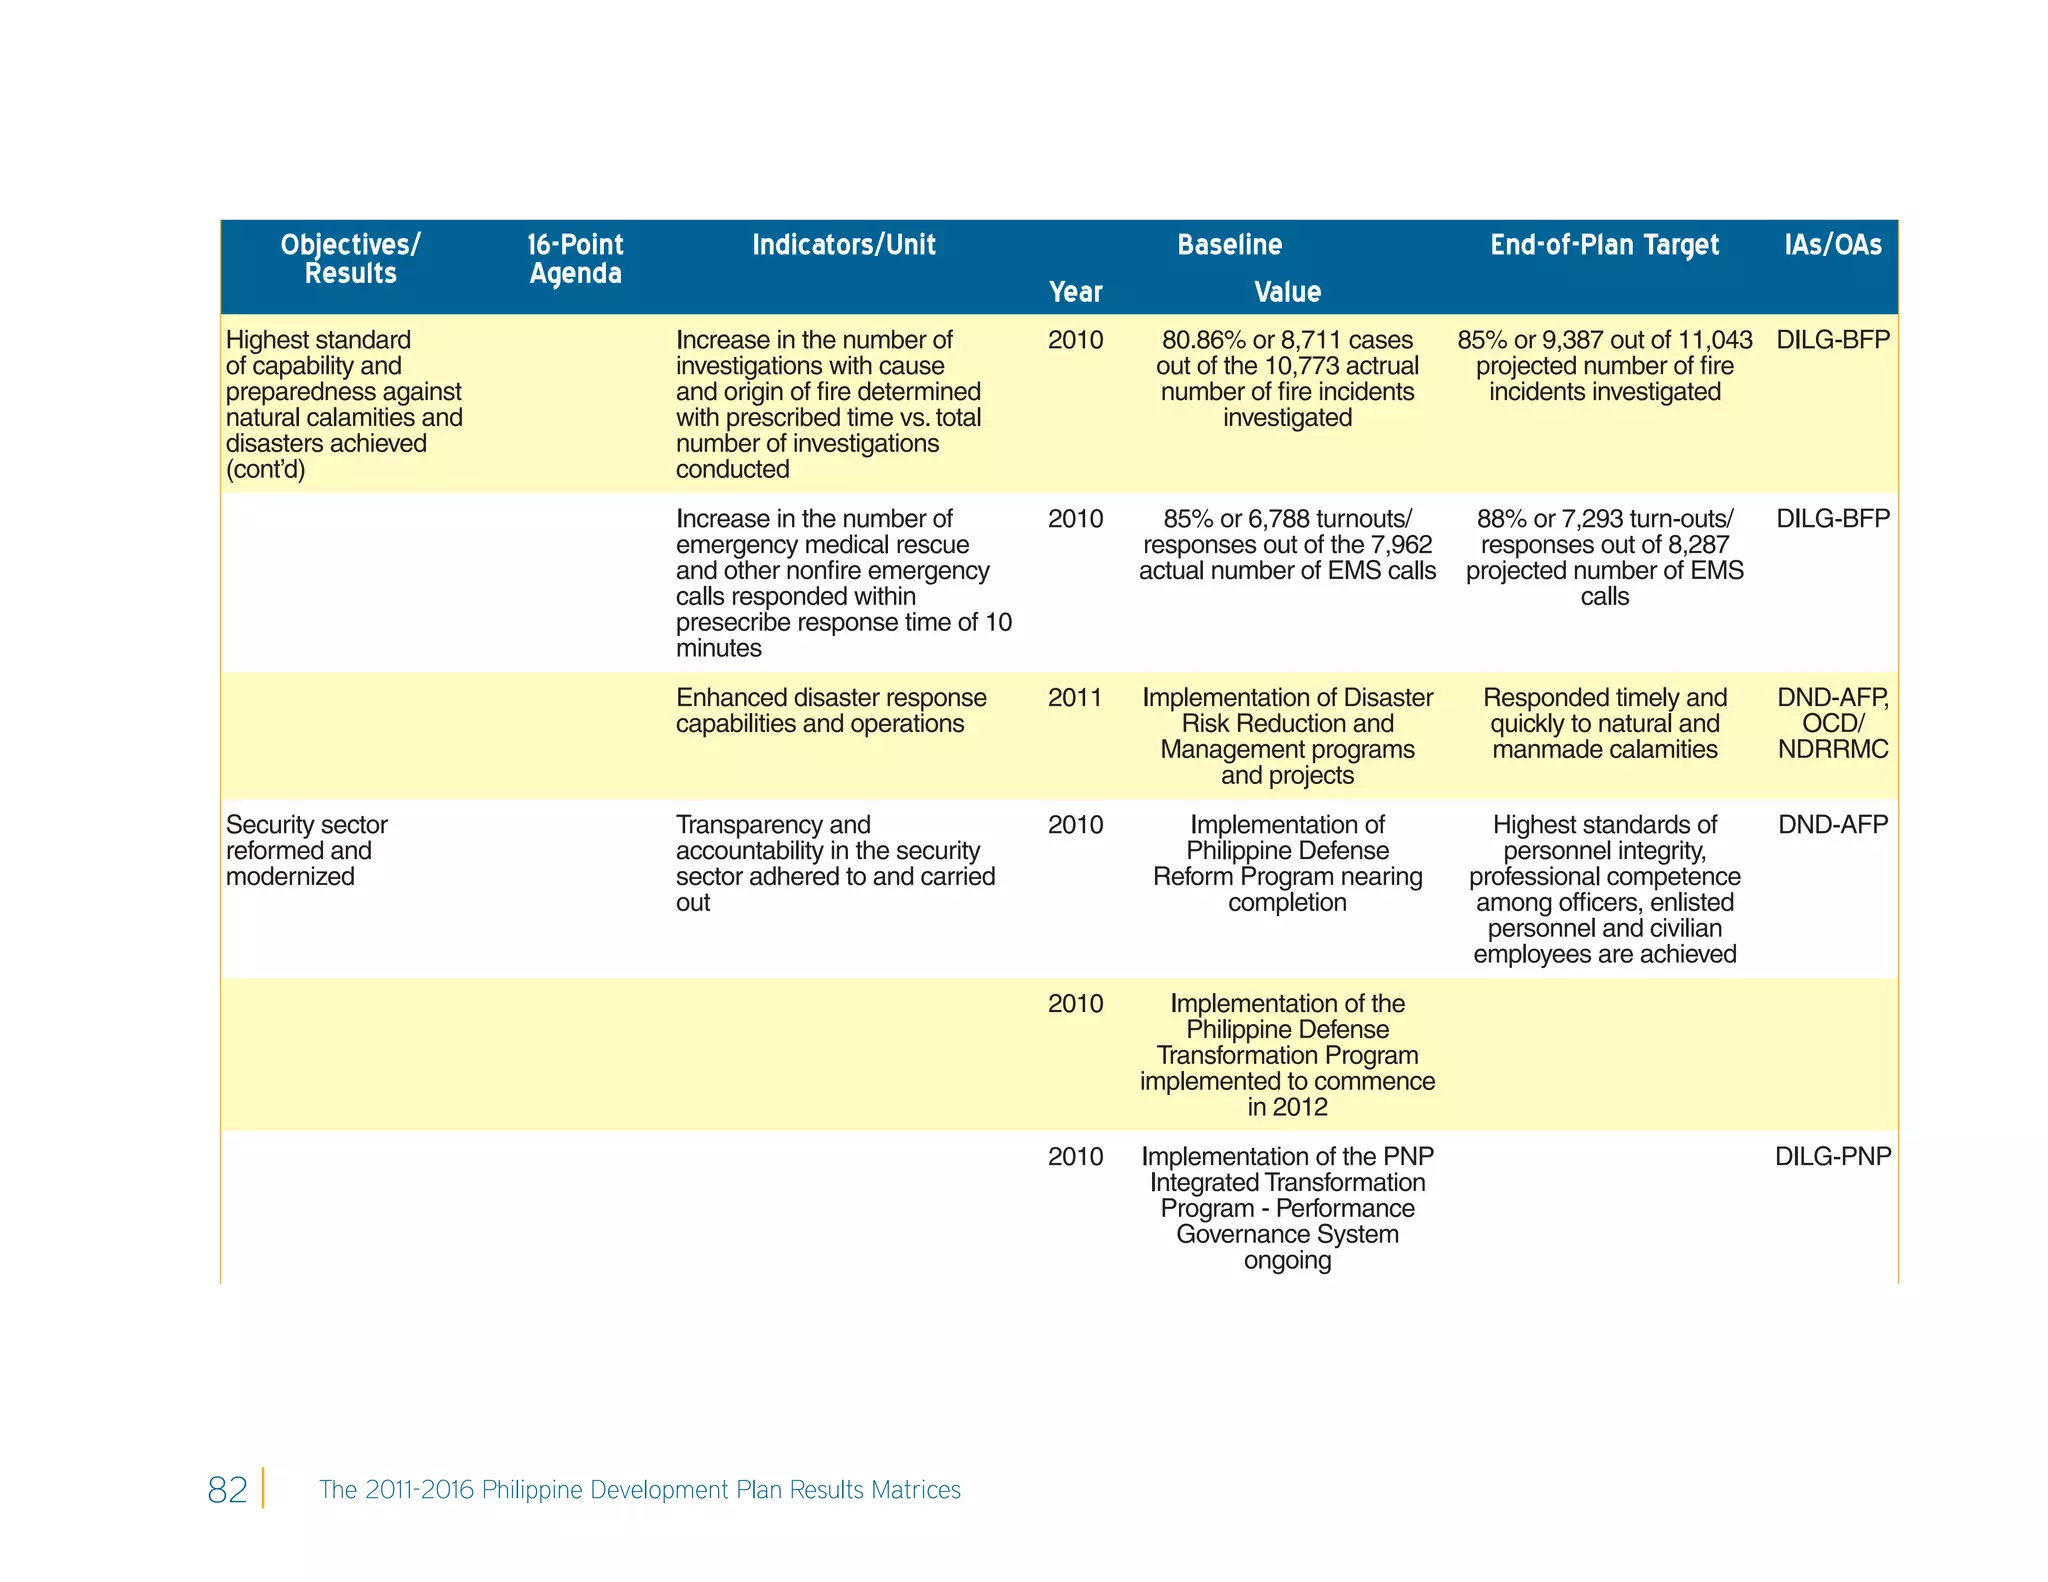
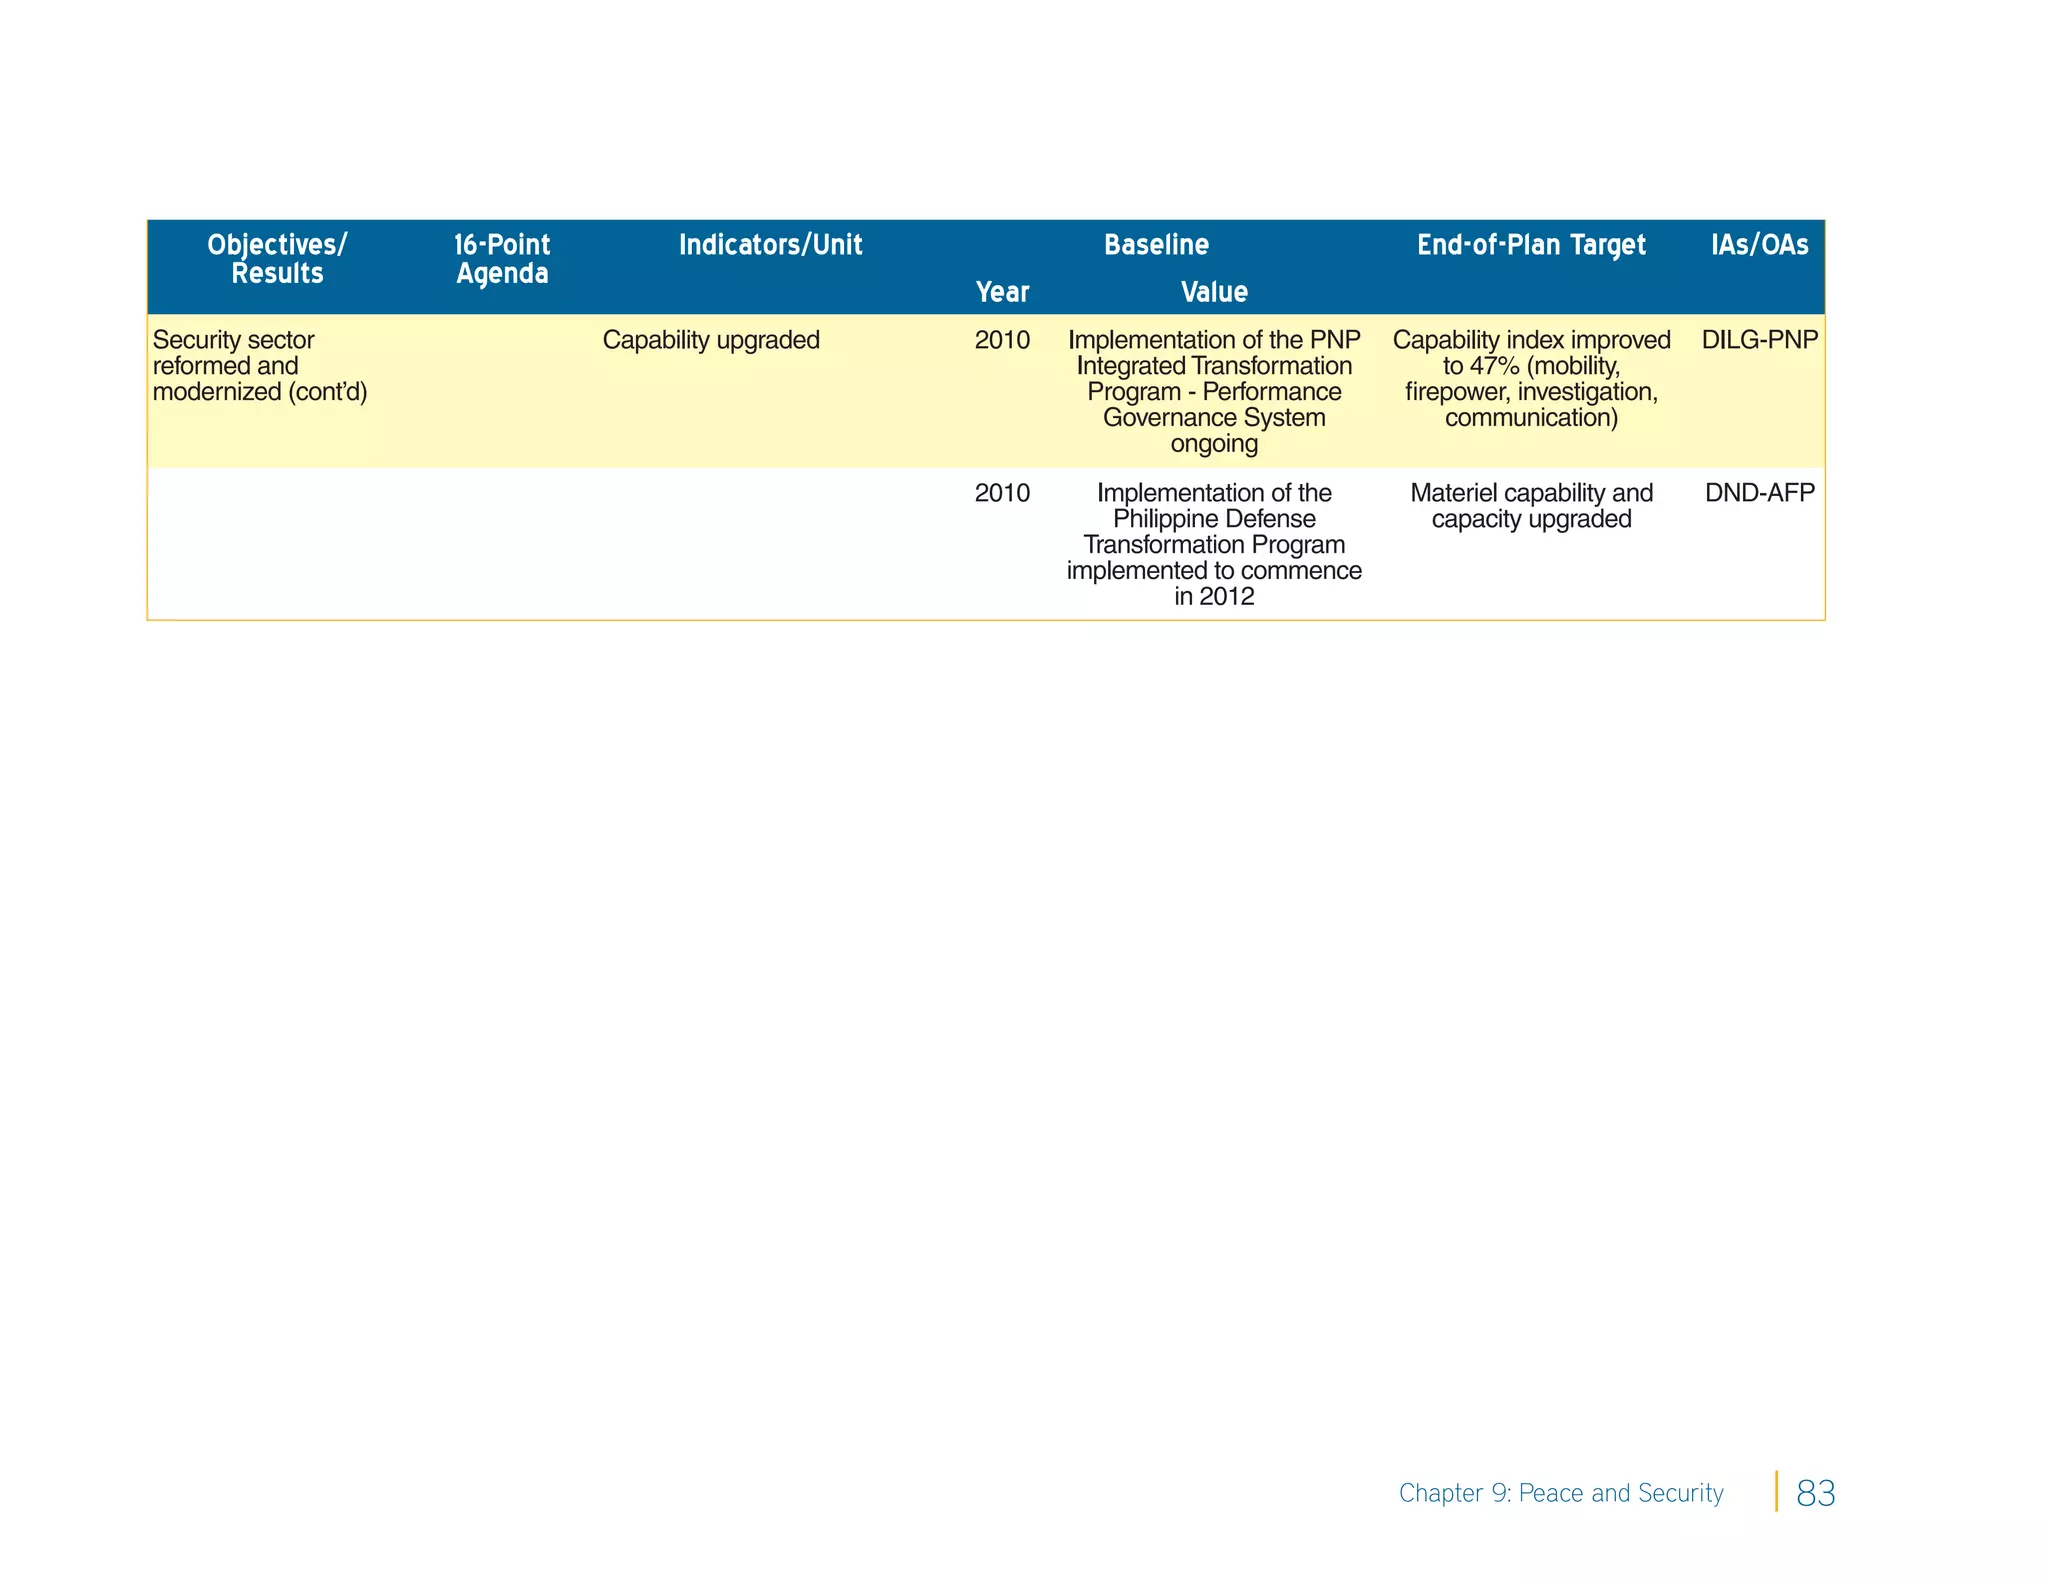
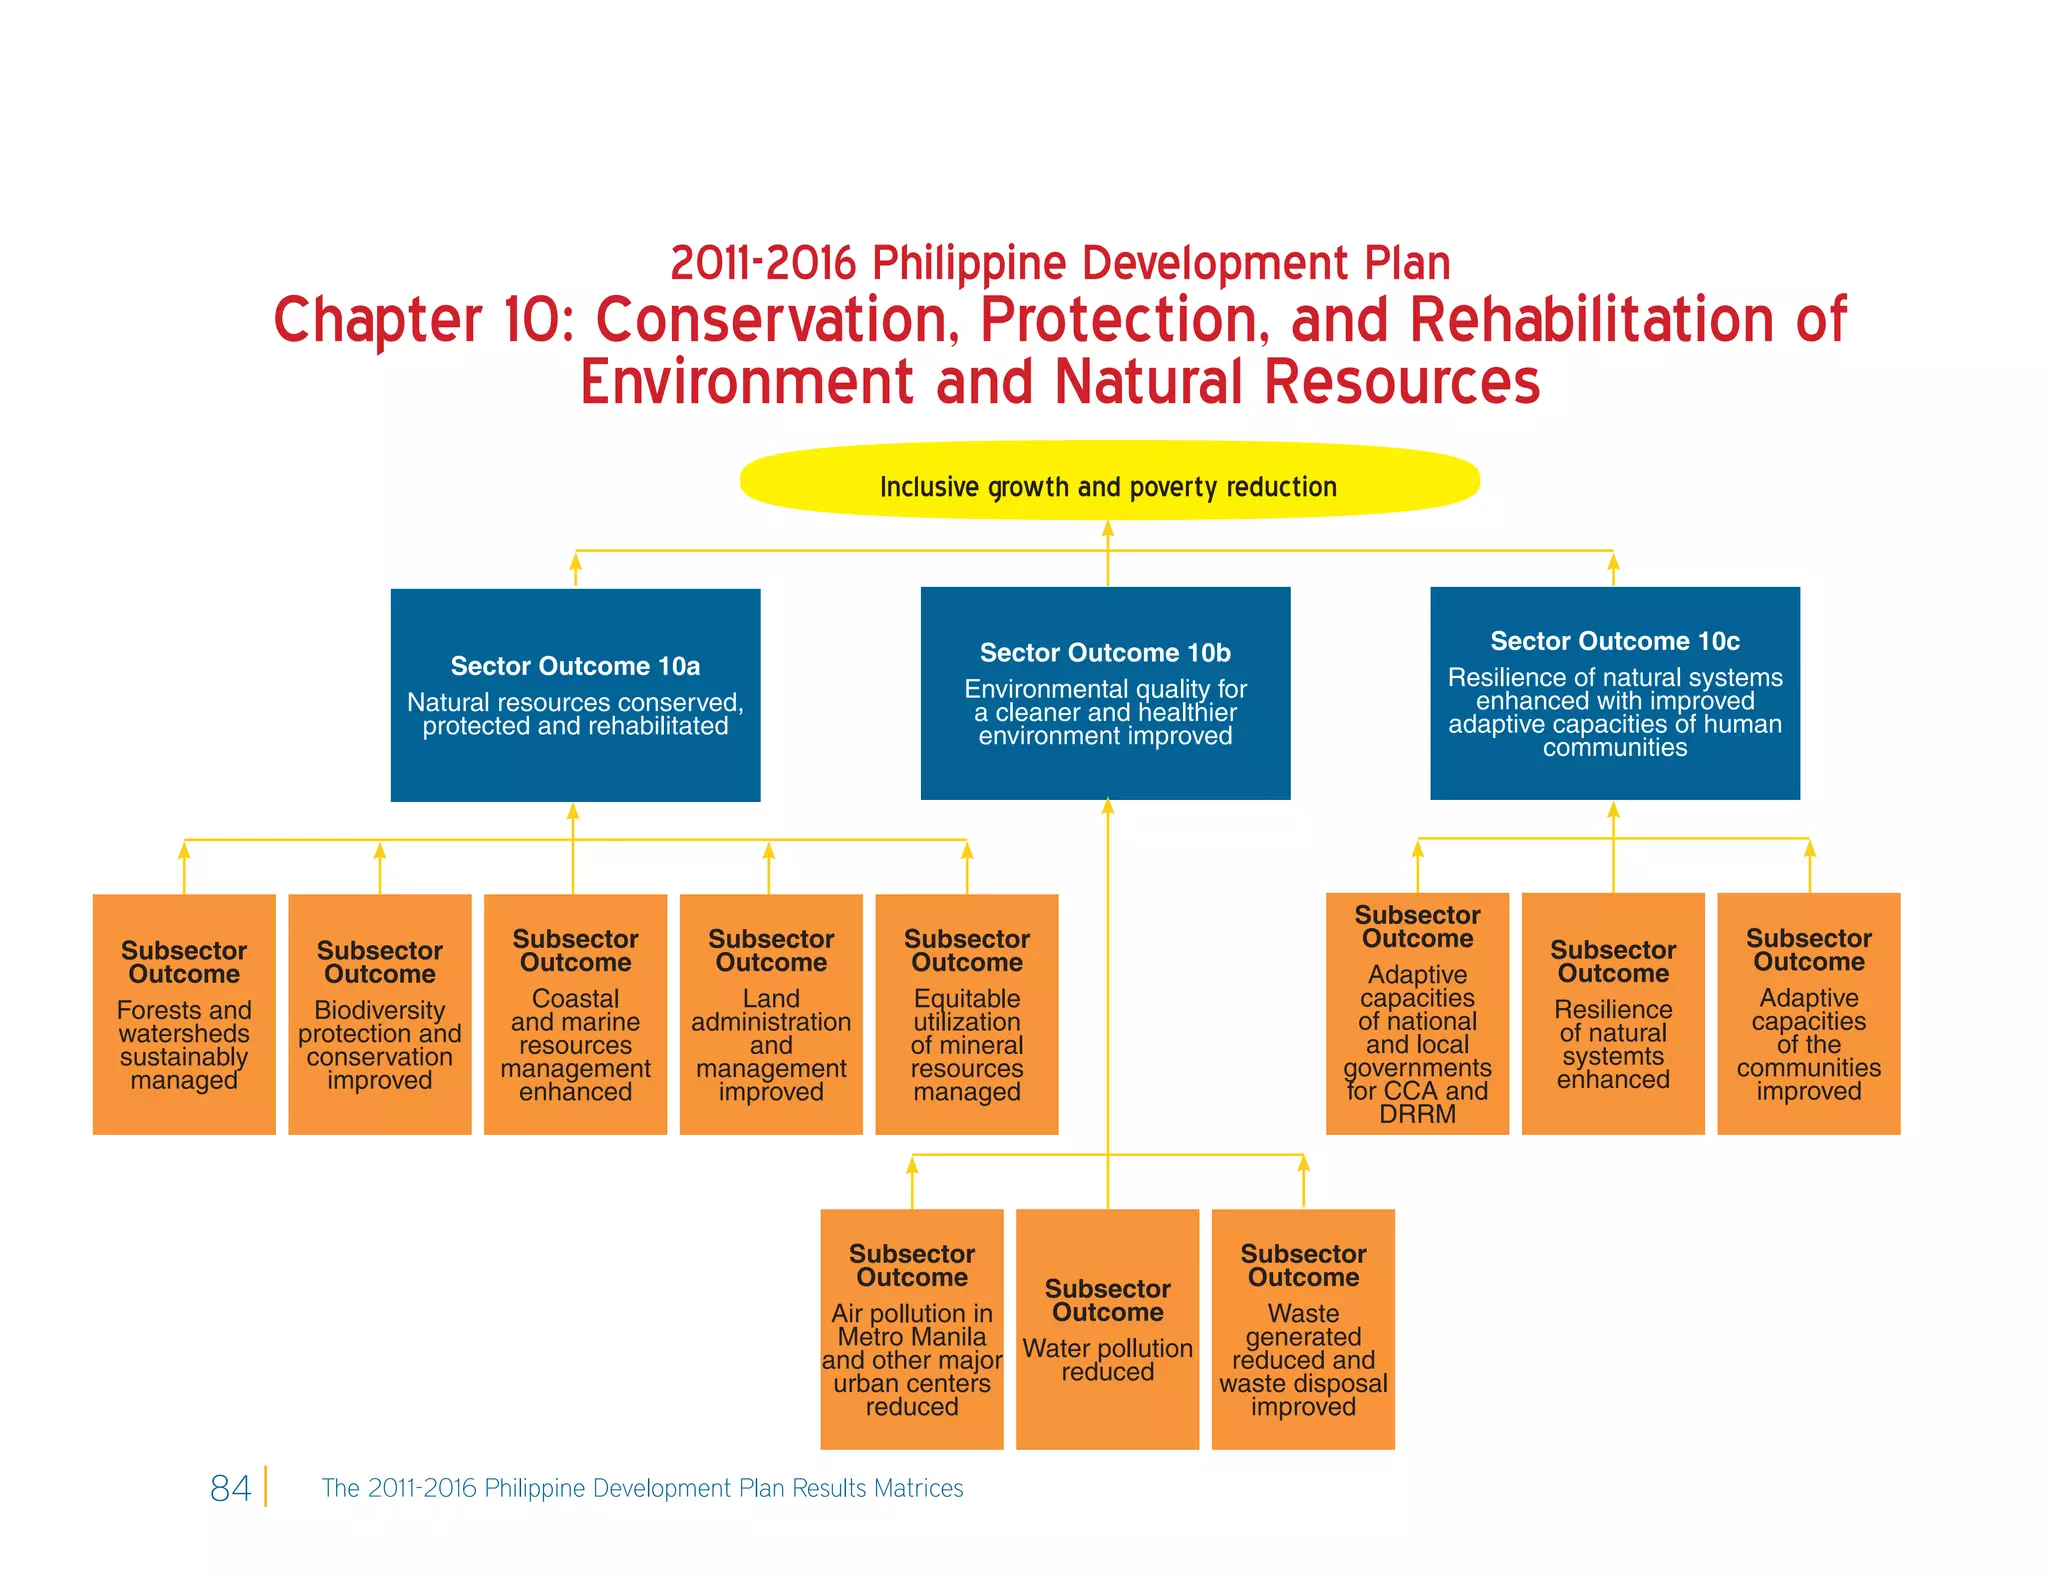
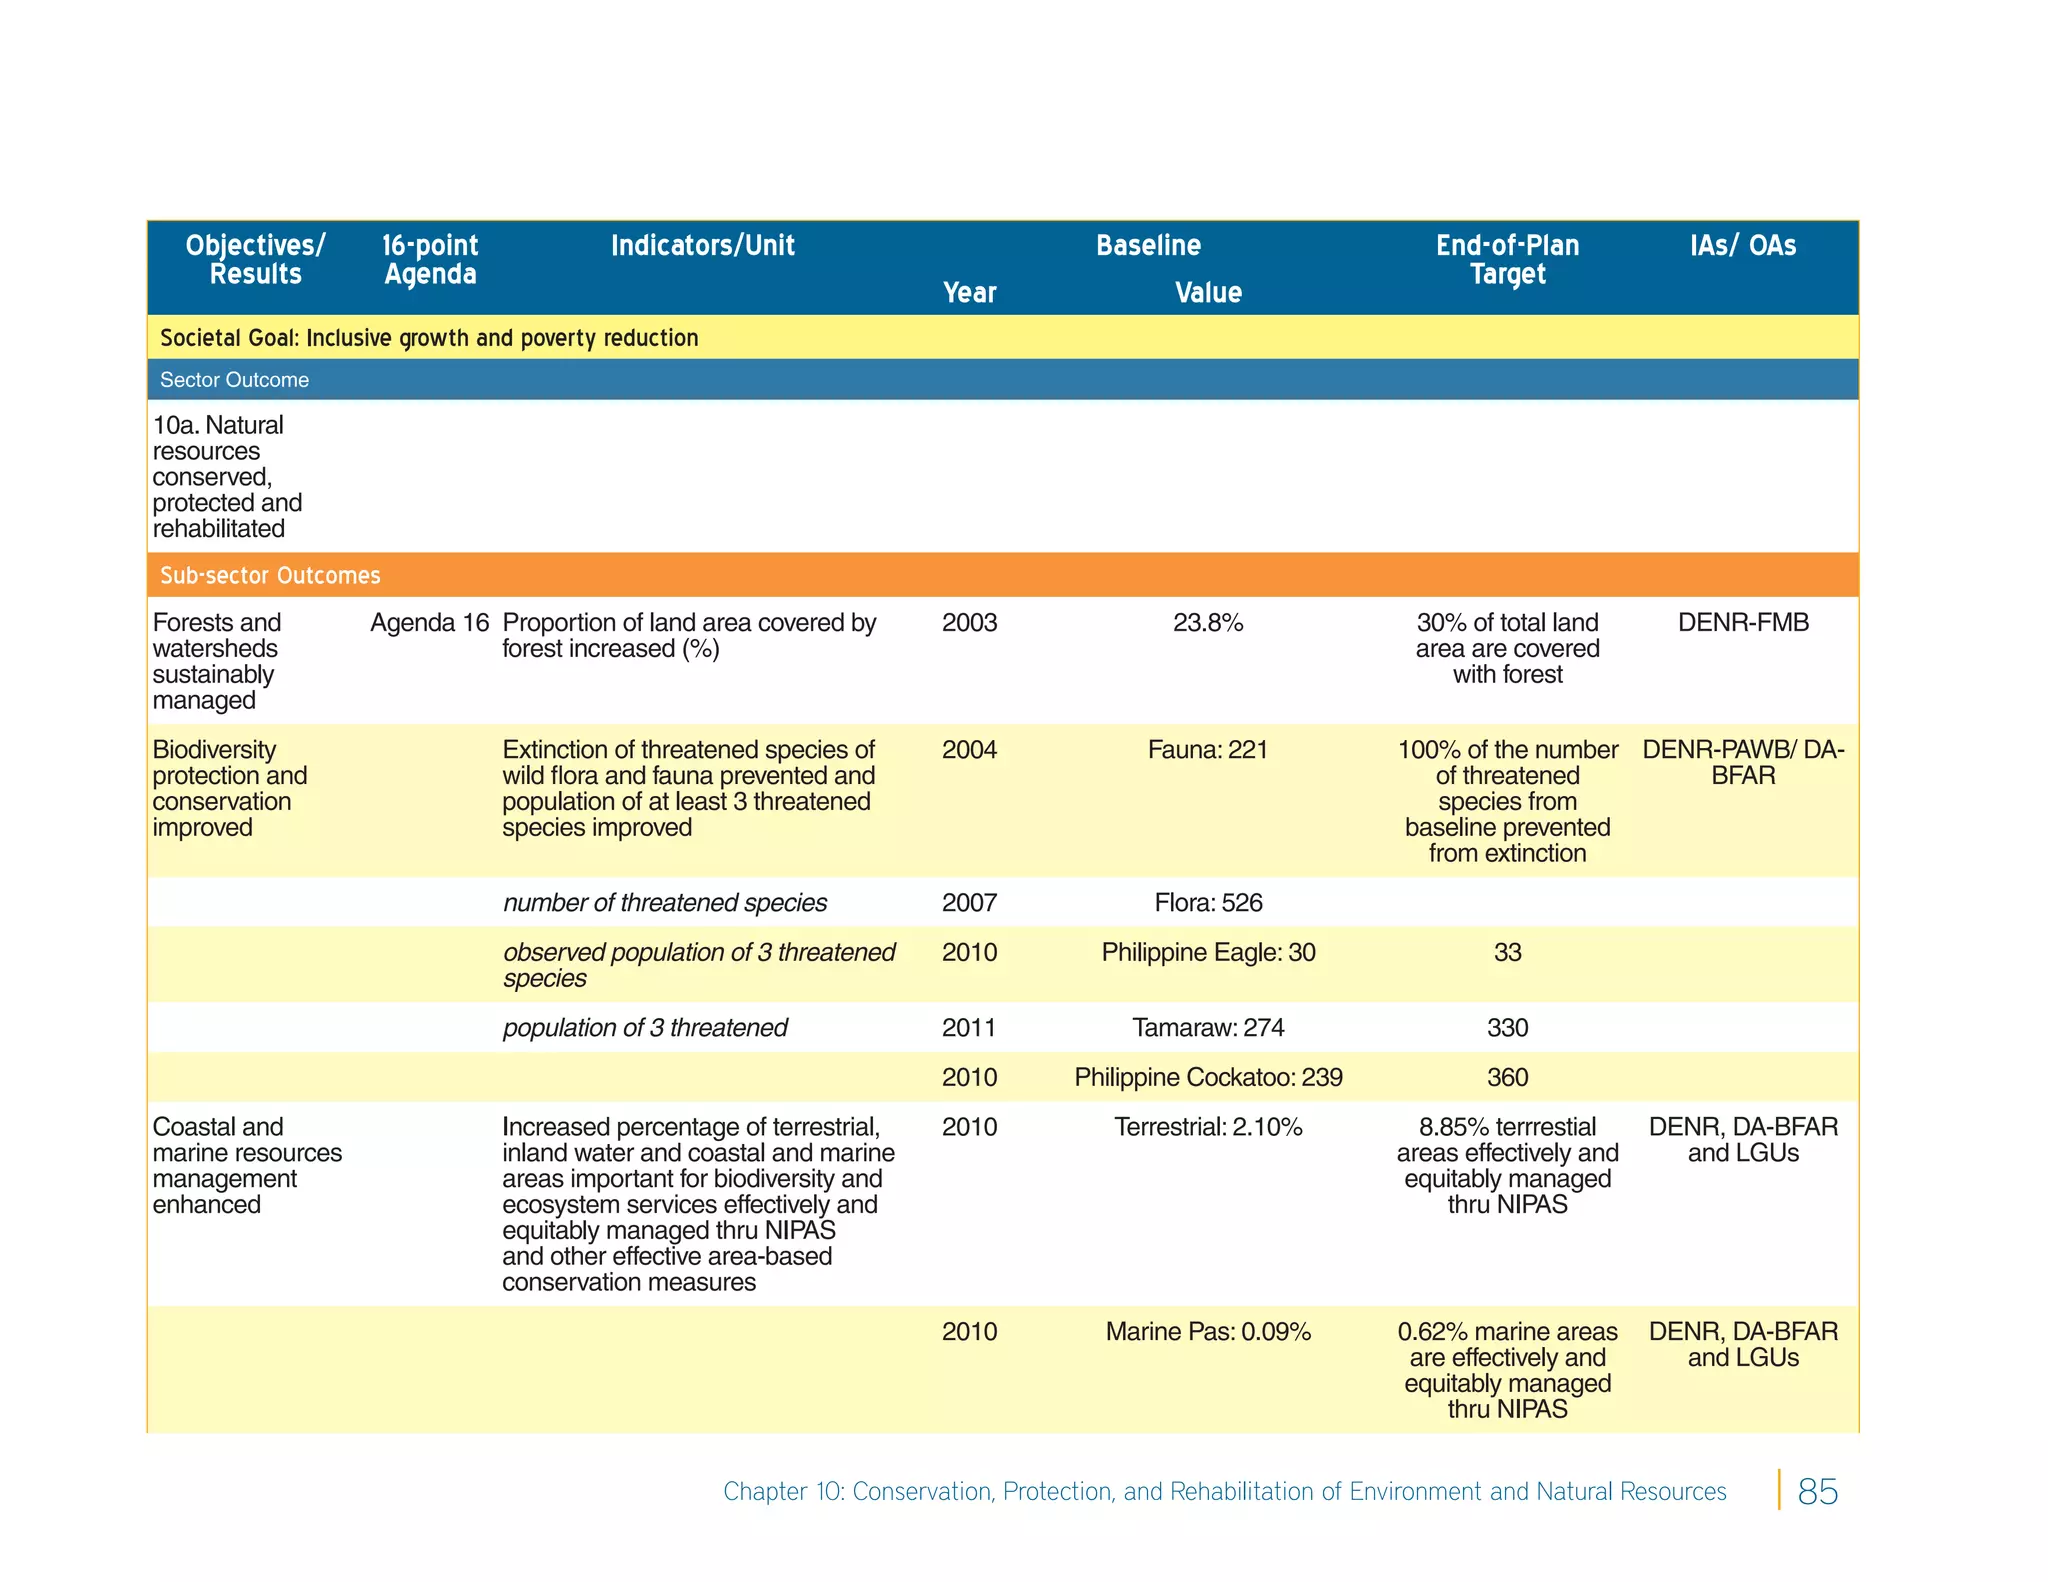
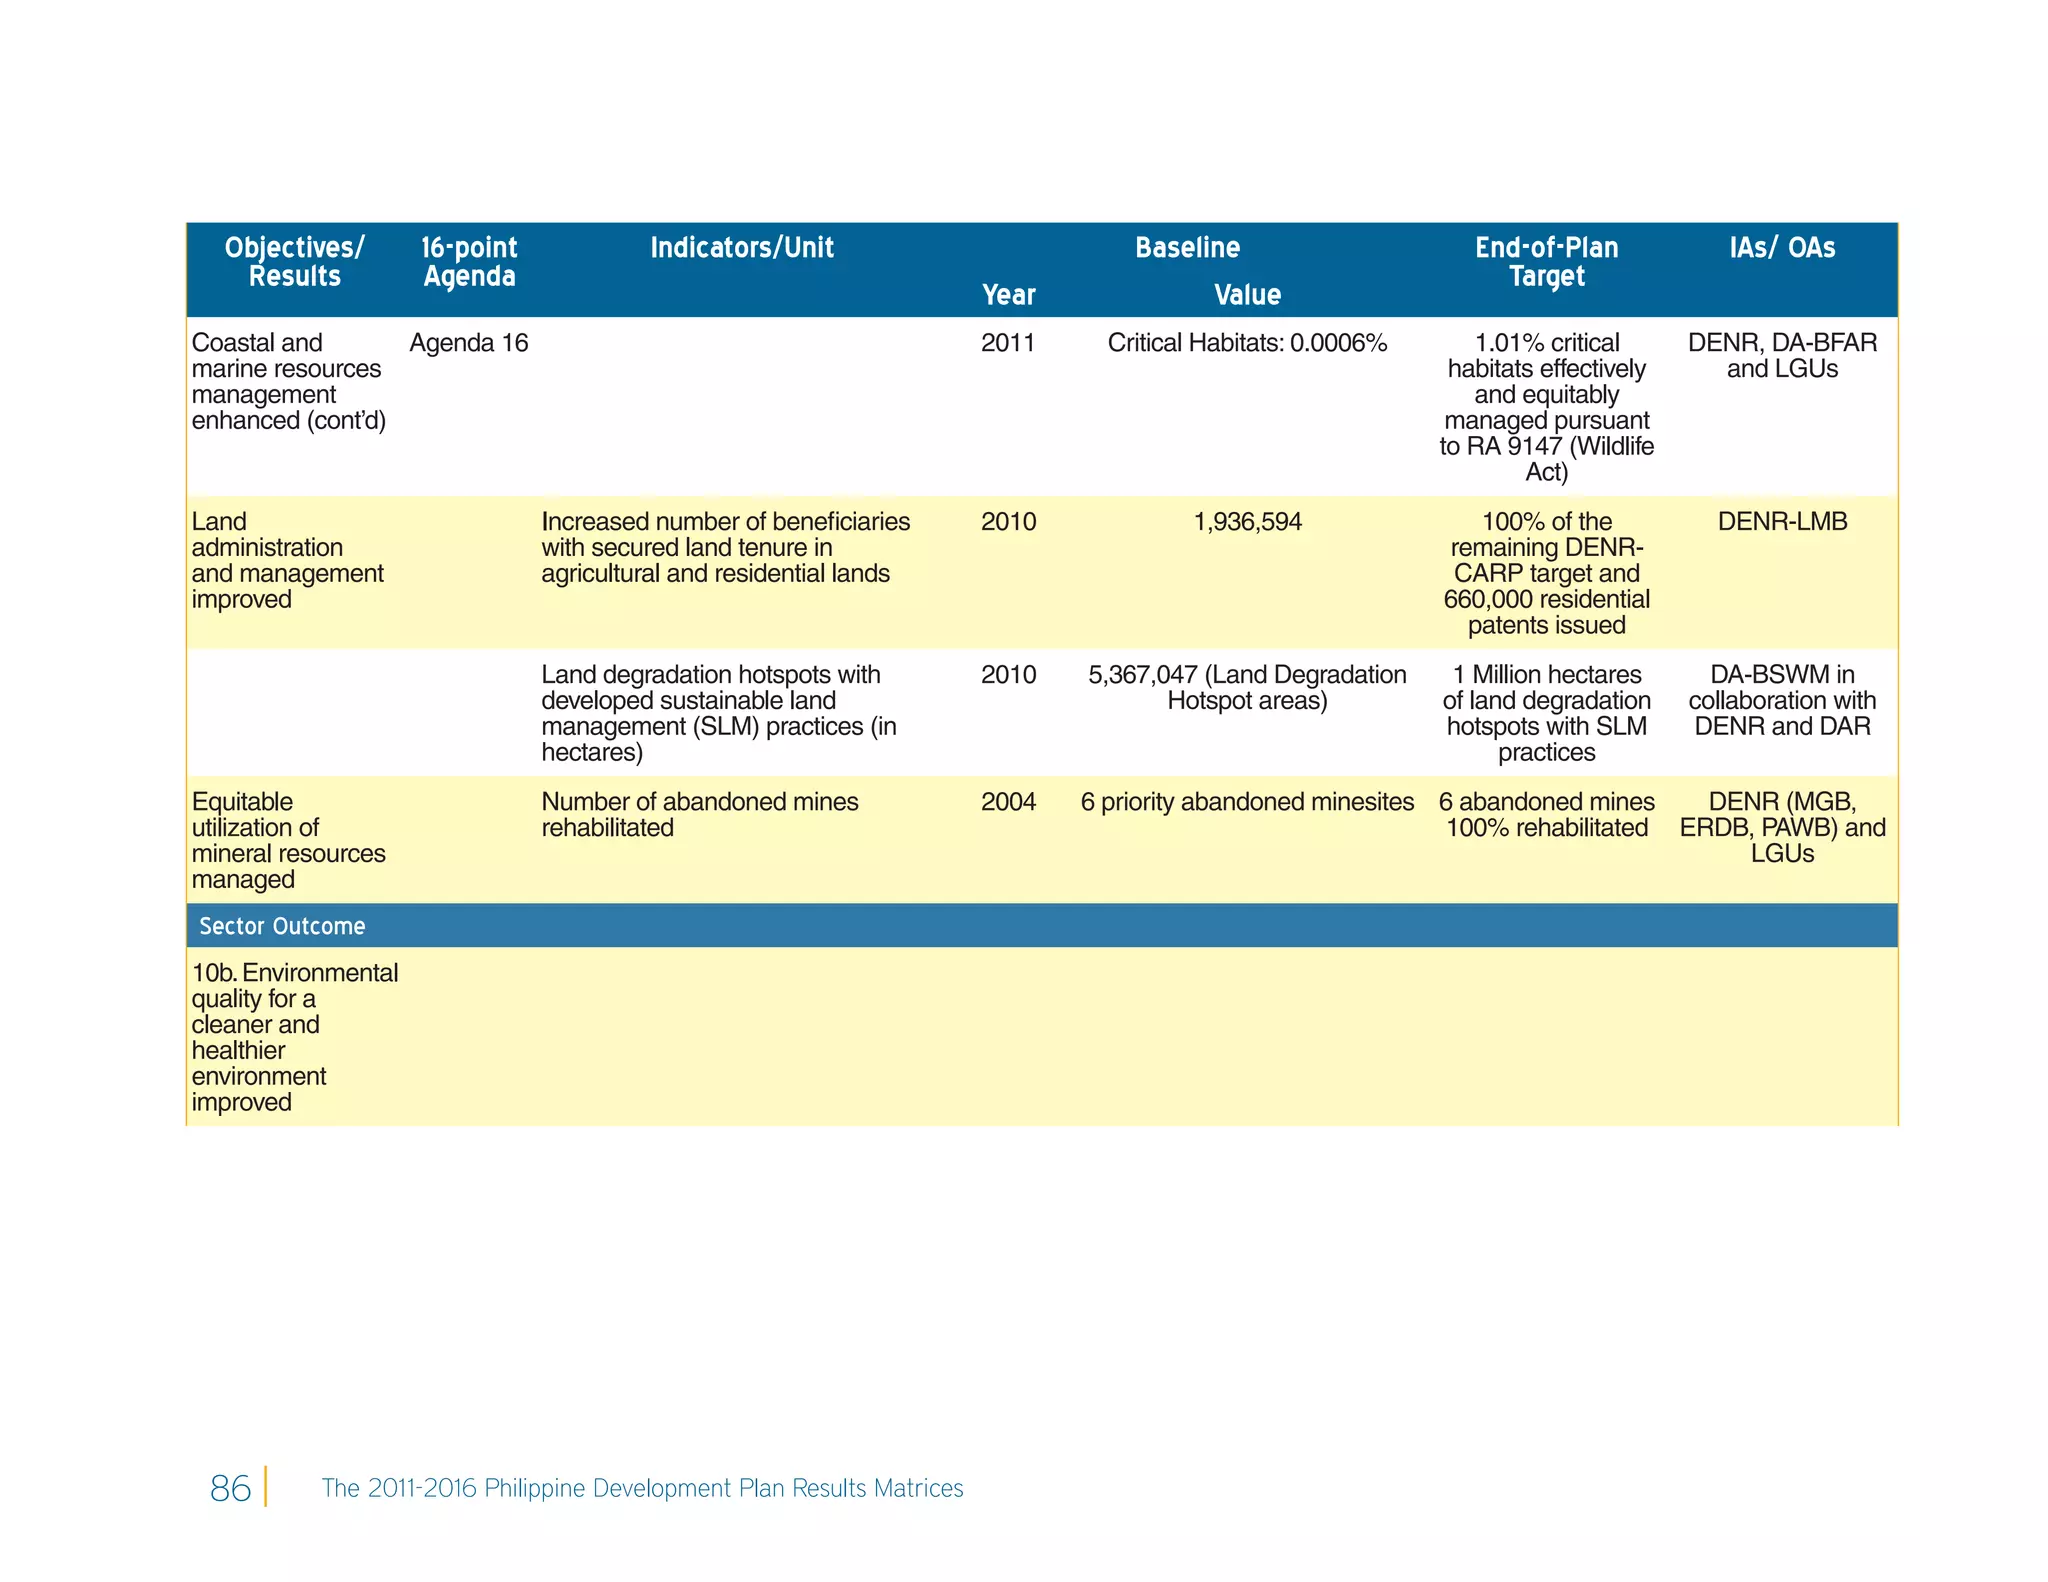
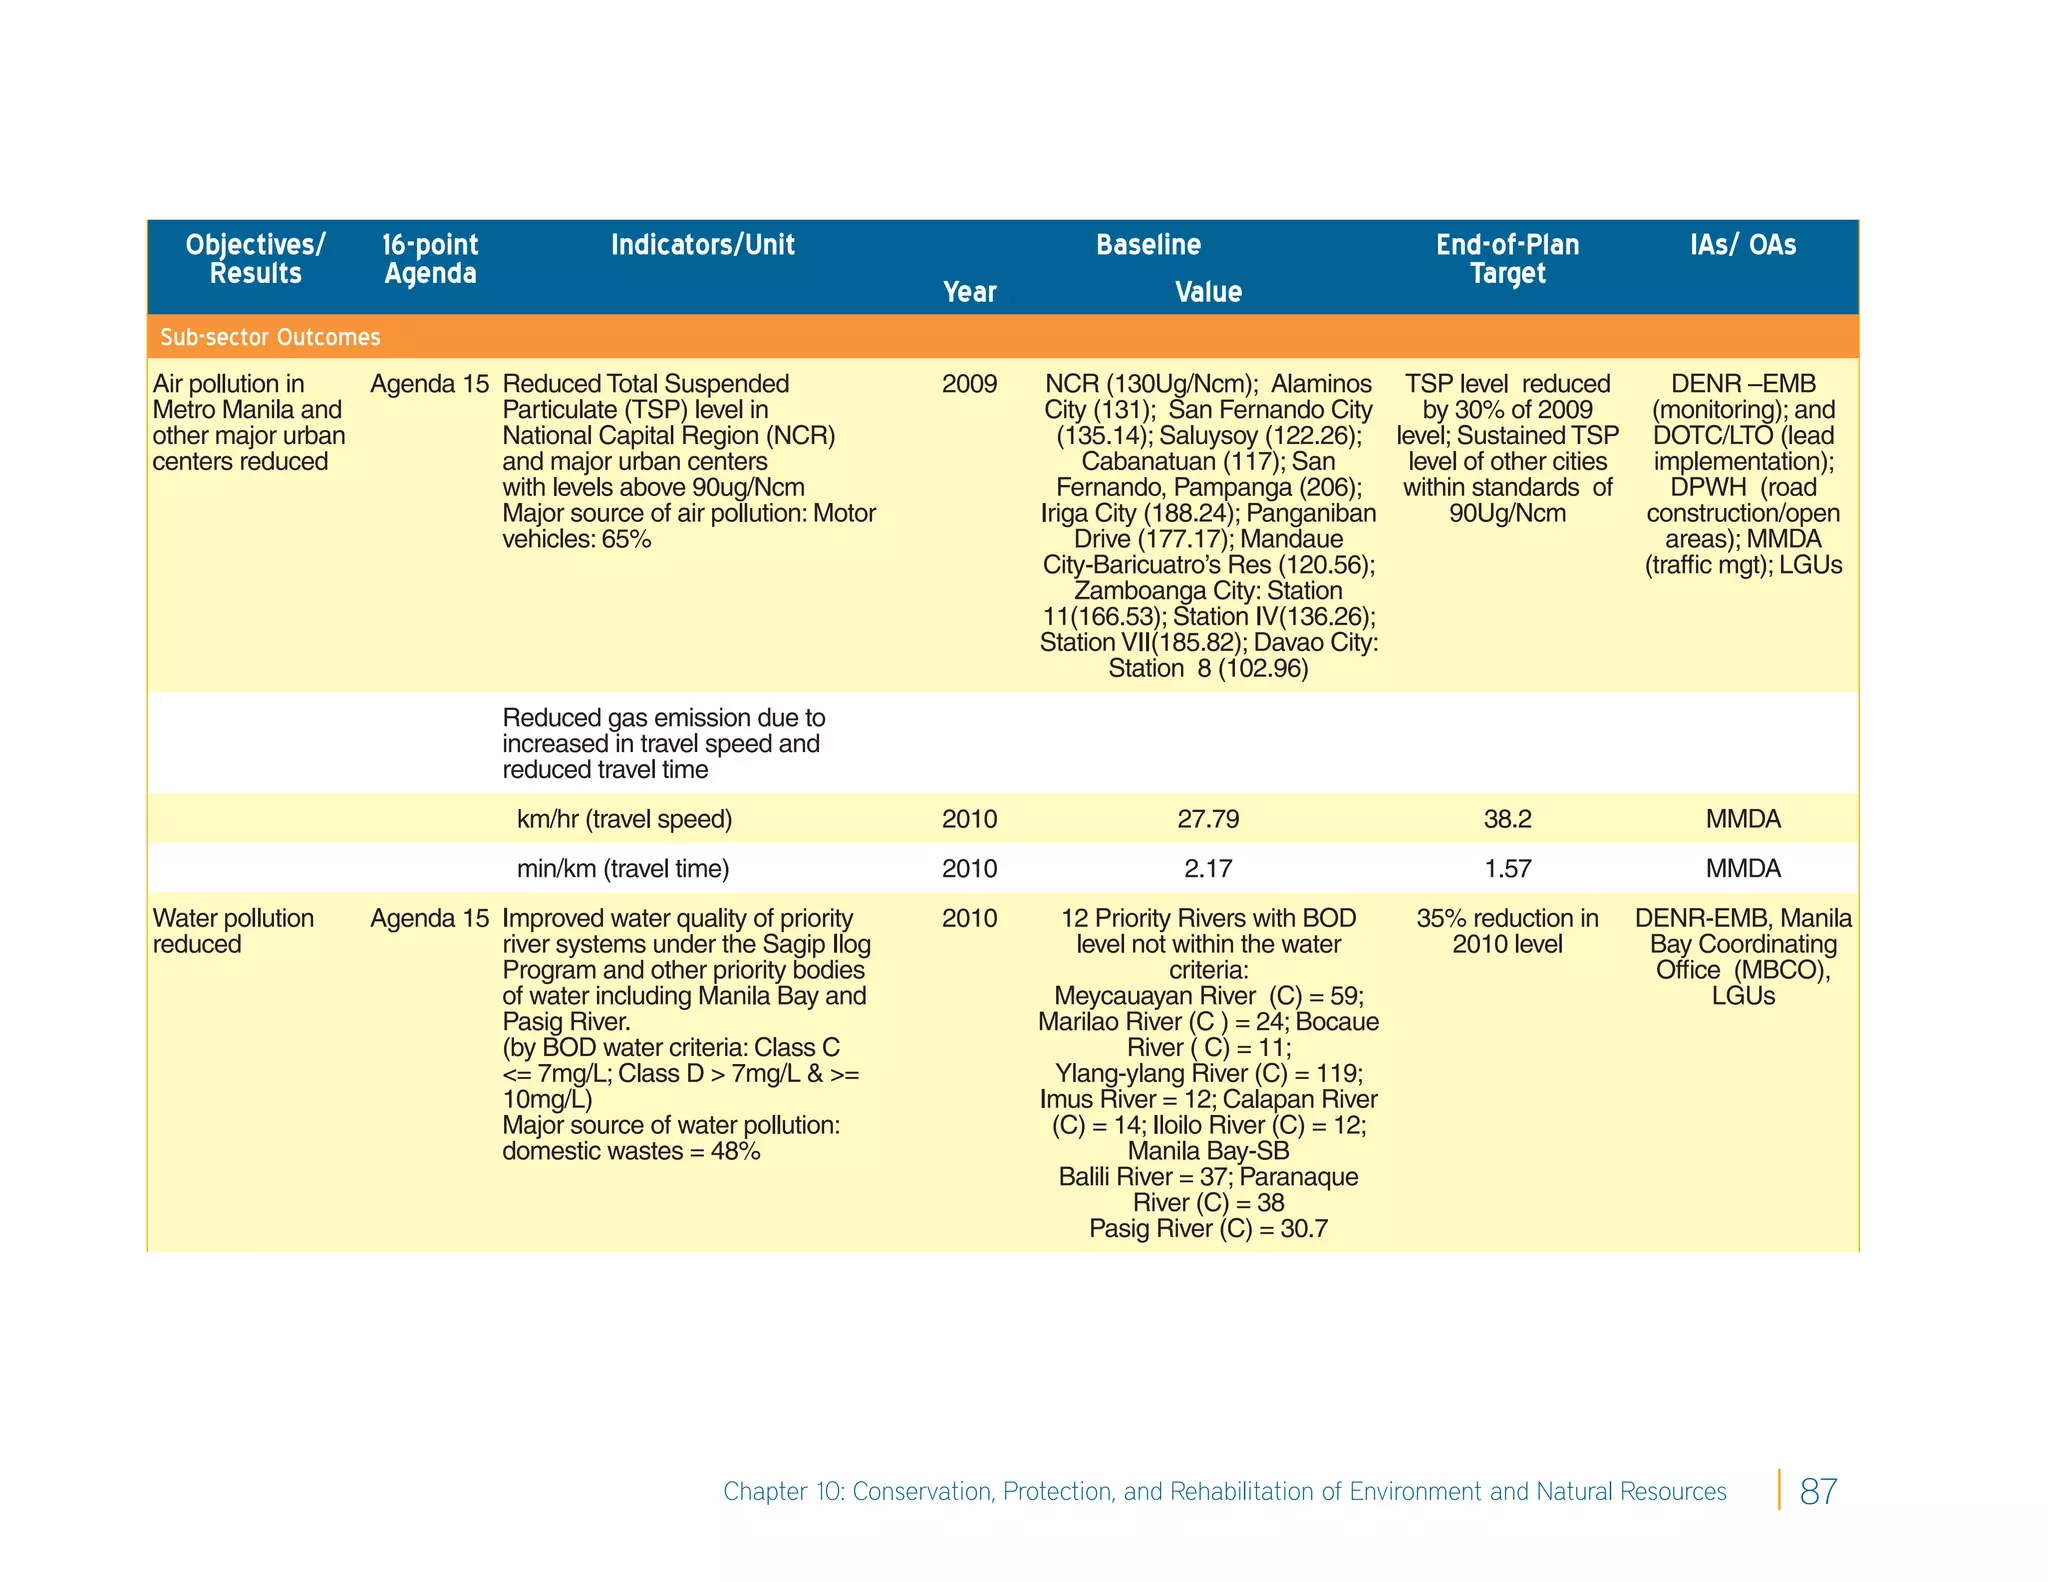
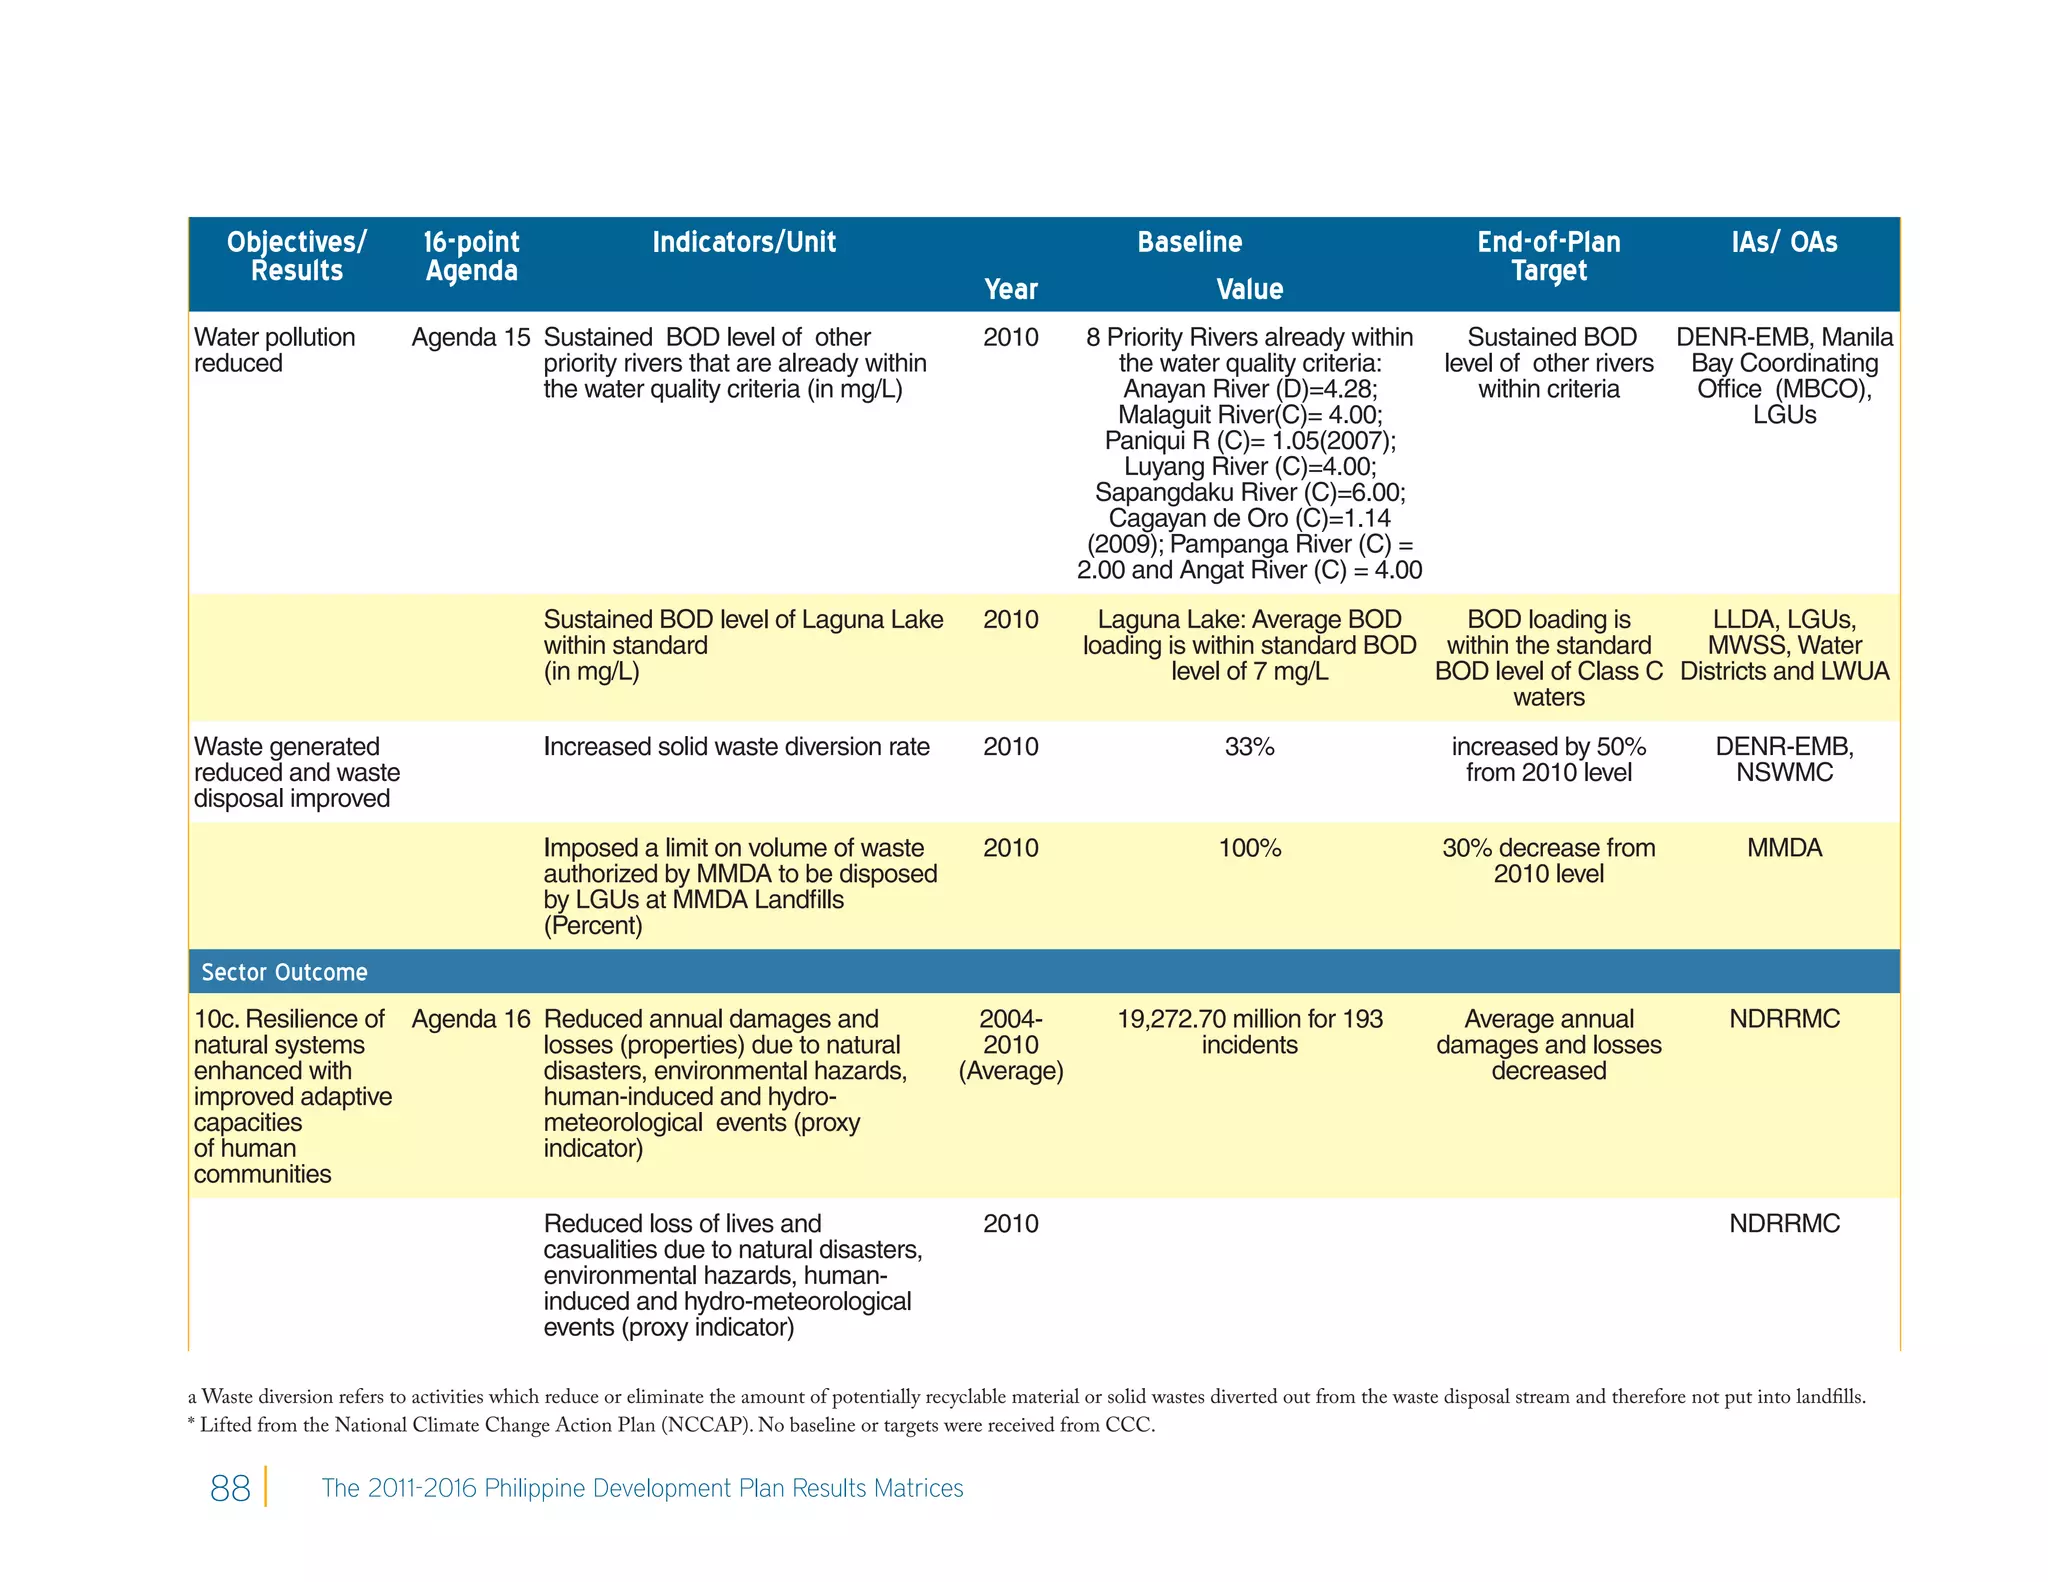
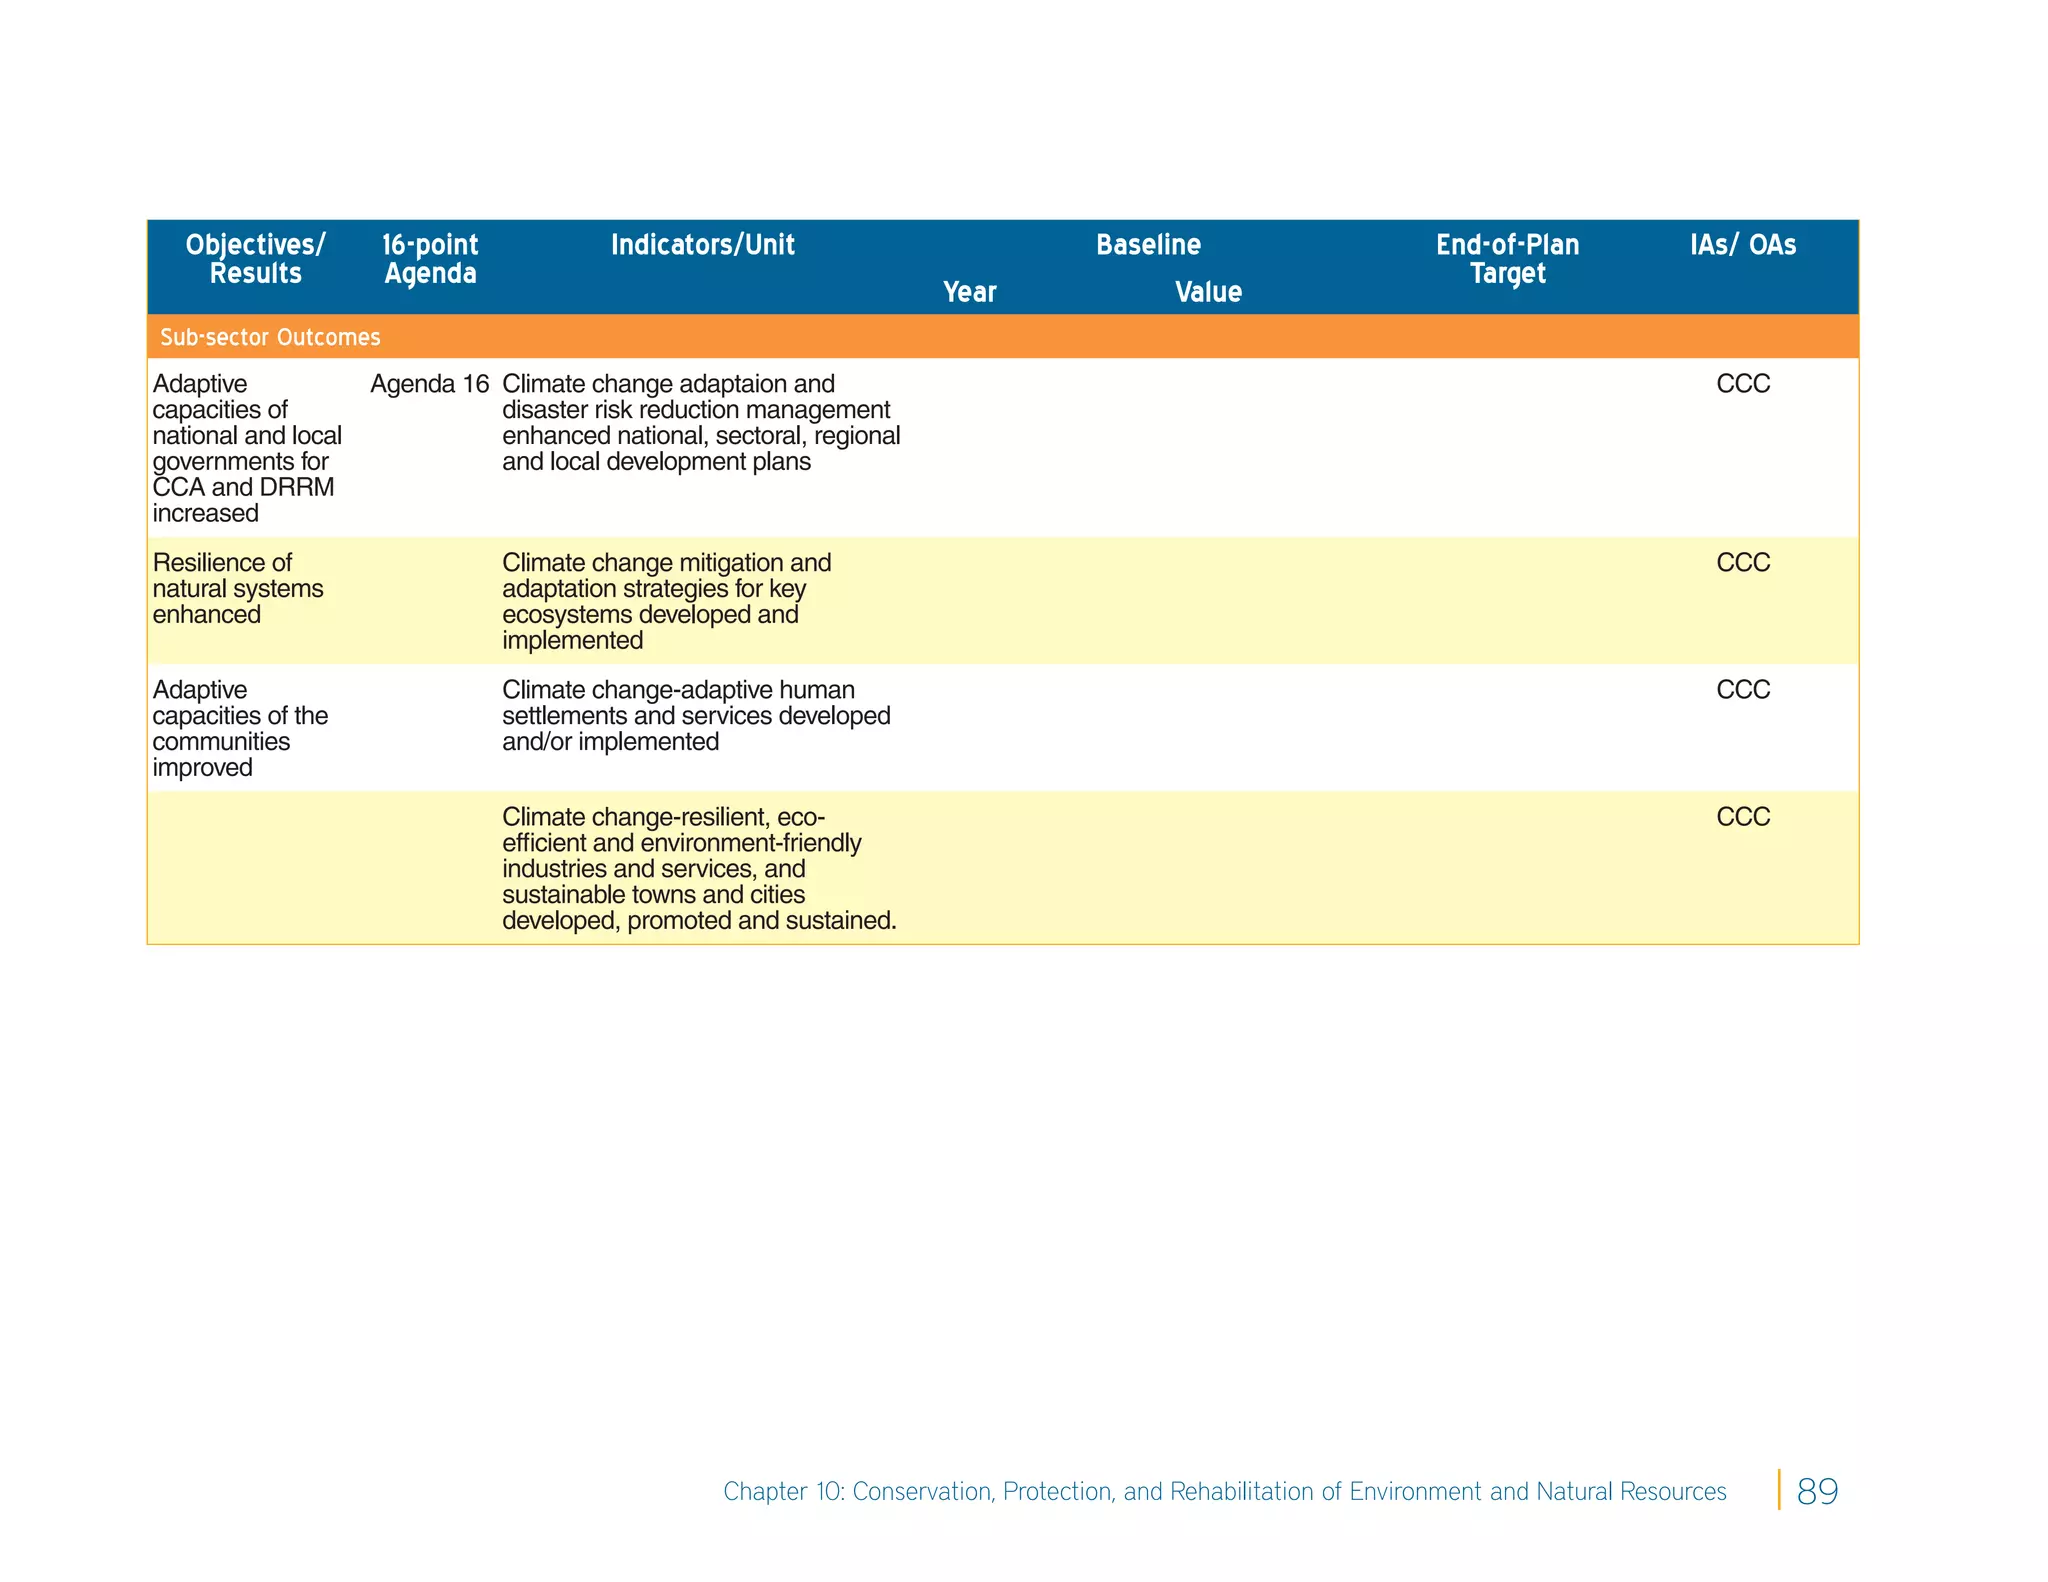


This document presents the Results Matrices (RMs) for monitoring and evaluating the Philippine Development Plan (PDP) 2011-2016. The RMs structure the planning process by linking the PDP's strategies and programs to indicators and targets. They incorporate the government's five major guideposts and present the results chain from subsector to sector outcomes to the overarching societal goal of inclusive growth and poverty reduction. The RMs will be used as the primary tool for managing development results across all stages of public sector management, from planning to budgeting to implementation to monitoring and evaluation. They are meant to strengthen the PDP's results orientation and will be enhanced annually through collaboration between government agencies, statistical offices, and other stakeholders.