Download as PDF, PPTX

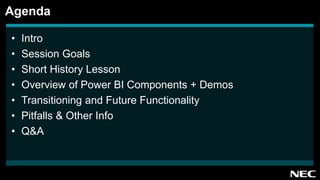
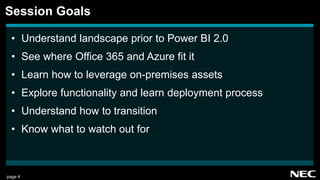
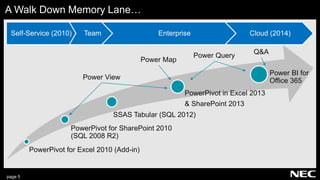
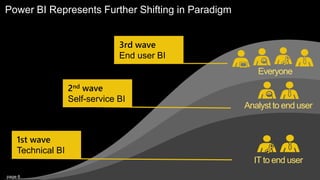
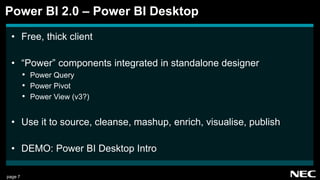
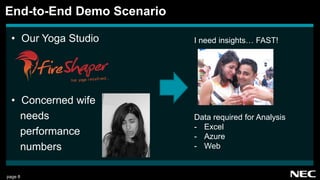


The document discusses the evolution and functionality of Power BI and hybrid cloud solutions, highlighting the transition from earlier versions to Power BI 2.0. It covers the components of Power BI, deployment processes, potential pitfalls, and various features such as data visualization, cloud service integration, and mobile app functionality. The session aims to educate users on leveraging on-premises assets while navigating the Power BI landscape.


![Microsoft Power Stack 2019 [Power BI, Excel, Azure & Friends]](https://cdn.slidesharecdn.com/ss_thumbnails/cl5khvpdqxat1towwmgy-signature-ad54afc6bb6f90c90525c52bba803ad4bbc4540a1573646d15de668783fb664a-poli-170212213019-thumbnail.jpg?width=640&height=640&fit=bounds)


