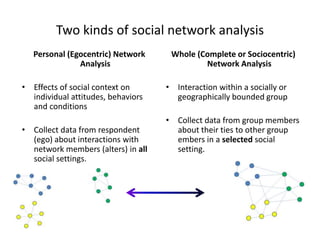
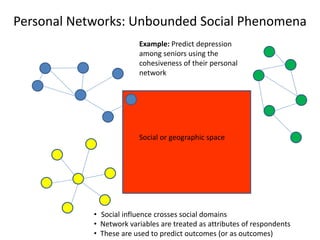
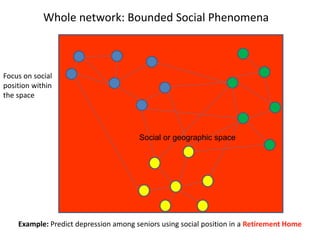
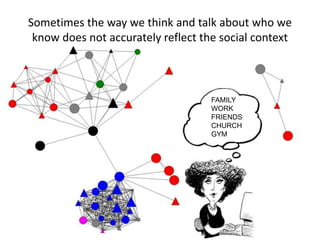
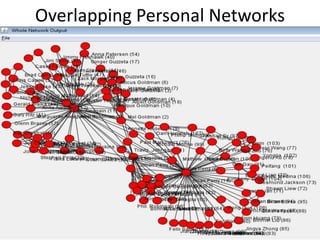
This document discusses two main types of social network analysis: personal (egocentric) network analysis and whole (sociocentric) network analysis. It notes that personal network analysis focuses on how social context affects individuals, collecting data from respondents about their interactions with network members. Whole network analysis looks at interaction within a bounded group, collecting data from all group members. However, it notes that the distinction is not simple, as personal networks are part of the spectrum of social observations within the larger whole network of the world.
This short set of slides summarizes the characteristics of people who play specific roles in networks. In a social network analysis, people in these roles can be discovered by running mathematical algorithms through the social graphs. But you don't need to be an algorithm to spot some of these people in your networks!
Power no longer resides exclusively (if at all) in states, institutions, or large corporations. It is located in the networks that structure society. Social network analysis seeks to understand networks and their participants and has two main focuses: the actors and the relationships between them in a specific social context.
Social Network Analysis & an Introduction to ToolsPatti Anklam
This presentation was delivered as part of an intense knowledge management curriculum. It covers the basics of network analysis and then goes into the different types of tool that support analyzing networks.
Social Network Analysis for Competitive IntelligenceAugust Jackson
How can CI teams apply the concepts of social network analysis to gain insight into the capabilities and plans of their competitors? Presented by Jim Richardson and August Jackson in April 2007 at the Society of Competitive Intelligence Professionals annual conference in New York City.
Part 1: Concepts and Cases (the language of networks, networks in organizations, case studies and key concepts)
Part 2: (Starts on #44) Mapping Organizational, Personal, and Enterprise Networks: Tools
An update to last year's Social Network Analysis Introduction and Tools...
Social network analysis [SNA] is the mapping and measuring of relationships and flows between people, groups, organizations, computers, URLs, and other connected information/knowledge entities. SNA provides both a visual and a mathematical analysis of human relationships.
Revision of Previous Show on SNA and Introduction to Tools
The Language of Networks
Introduction to Social Network Analysis/ Cases
Tools for Analyzing social networks, including graphing Facebook, LinkedIn, and Twitter networks
This workshop will introduce some of the main principles and techniques of Social Network Analysis (SNA). We will use examples from organizational and social media-based networks to understand concepts such as network density, diameter, centrality measures, community detection algorithms, etc. The session will also introduce Gephi, a popular program for SNA. Gephi is a free and open-source tool that is available for both Mac and PC computers.
By the end of the session, you will develop a general understanding of what SNA is, what research questions it can help you answer, and how it can be applied to your own research. You will also learn how to use Gephi to visualize and examine networks using various layout and community detection algorithms.
Instructor’s Bio: Dr. Anatoliy Gruzd is a Canada Research Chair in Social Media Data Stewardship, Associate Professor at the Ted Rogers School of Management at Ryerson University, and Director of Research at the Social Media Lab. Anatoliy is also a Member of the Royal Society of Canada’s College of New Scholars, Artists and Scientists; a co-editor of a multidisciplinary journal on Big Data and Society; and a founding co-chair of the International Conference on Social Media and Society. His research initiatives explore how social media platforms are changing the ways in which people and organizations communicate, collaborate and disseminate information and how these changes impact the norms and structures of modern society.
2009 - Connected Action - Marc Smith - Social Media Network AnalysisMarc Smith
Review of social media network analysis of Internet social spaces like twitter, flickr, email, message boards, etc. Network analysis and visualization of social media collections of connections.
More than ever, we need to learn how to harness the power of networks to tackle the complex issues we're facing as a society. Here's a quick guide to the basics of social network analysis.
Interested? Sign up at http://kumu.io
Practical Applications for Social Network Analysis in Public Sector Marketing...Mike Kujawski
Over the past decade there has been a growing public fascination with the complex connectedness of modern society. This has been driven in large part by the wide availability of public digital data produced through our daily interactions on the modern social web. This data can now easily be mined and analyzed to produce valuable and actionable business insights leading to better decision making in nearly every field of practice, especially marketing and communications. In this presentation, Joshua Gillmore and Mike Kujawski introduce the basics of social network analysis and some of the privacy related challenges that this rapidly growing space brings with it. Focus of this deck is on public sector organizations.
By: @mikekujawski and @joshuagillmore
Subscriber Churn Prediction Model using Social Network Analysis In Telecommun...BAINIDA
Subscriber Churn Prediction Model using Social Network Analysis In Telecommunication Industry โดย เชษฐพงศ์ ปัญญาชนกุล อาจารย์ ดร. อานนท์ ศักดิ์วรวิชญ์
ในงาน THE FIRST NIDA BUSINESS ANALYTICS AND DATA SCIENCES CONTEST/CONFERENCE จัดโดย คณะสถิติประยุกต์และ DATA SCIENCES THAILAND
2009 Node XL Overview: Social Network Analysis in Excel 2007Marc Smith
A quick overview of the features of NodeXL, the network overview, discovery, and exploration add-in for Excel 2007. This tool allows for visualizing directed graphs and social networks within Excel. It provides several network metrics and manipulation tools. Networks can be imported from Twitter and personal email.
Christopher Sibona Ph.D. is the Principal Software Engineer at Oracle Corp. Christopher obtained his Ph.D. at the University of Colorado Business School in 2011. His study on why people unfriend on Facebook has helped hundreds of corporations and individuals understand what encourages engagement and what turns people off when marketing on Facebook. This is Christopher’s talk at the January 2011 Emerging Media Conference in San Francisco, CA.
The emerging field of computational social science (CSS) is devoted to the pursuit of interdisciplinary social science research from an information processing perspective, through the medium of advanced computing and information technologies.
STATATHON: Unleashing the Power of Statistics in a 48-Hour Knowledge Extravag...sameer shah
"Join us for STATATHON, a dynamic 2-day event dedicated to exploring statistical knowledge and its real-world applications. From theory to practice, participants engage in intensive learning sessions, workshops, and challenges, fostering a deeper understanding of statistical methodologies and their significance in various fields."
The Building Blocks of QuestDB, a Time Series Databasejavier ramirez
Talk Delivered at Valencia Codes Meetup 2024-06.
Traditionally, databases have treated timestamps just as another data type. However, when performing real-time analytics, timestamps should be first class citizens and we need rich time semantics to get the most out of our data. We also need to deal with ever growing datasets while keeping performant, which is as fun as it sounds.
It is no wonder time-series databases are now more popular than ever before. Join me in this session to learn about the internal architecture and building blocks of QuestDB, an open source time-series database designed for speed. We will also review a history of some of the changes we have gone over the past two years to deal with late and unordered data, non-blocking writes, read-replicas, or faster batch ingestion.
Enhanced Enterprise Intelligence with your personal AI Data Copilot.pdfGetInData
Recently we have observed the rise of open-source Large Language Models (LLMs) that are community-driven or developed by the AI market leaders, such as Meta (Llama3), Databricks (DBRX) and Snowflake (Arctic). On the other hand, there is a growth in interest in specialized, carefully fine-tuned yet relatively small models that can efficiently assist programmers in day-to-day tasks. Finally, Retrieval-Augmented Generation (RAG) architectures have gained a lot of traction as the preferred approach for LLMs context and prompt augmentation for building conversational SQL data copilots, code copilots and chatbots.
In this presentation, we will show how we built upon these three concepts a robust Data Copilot that can help to democratize access to company data assets and boost performance of everyone working with data platforms.
Why do we need yet another (open-source ) Copilot?
How can we build one?
Architecture and evaluation
Unleashing the Power of Data_ Choosing a Trusted Analytics Platform.pdfEnterprise Wired
In this guide, we'll explore the key considerations and features to look for when choosing a Trusted analytics platform that meets your organization's needs and delivers actionable intelligence you can trust.
Analysis insight about a Flyball dog competition team's performanceroli9797
Insight of my analysis about a Flyball dog competition team's last year performance. Find more: https://github.com/rolandnagy-ds/flyball_race_analysis/tree/main
2. Two kinds of social network analysis
Personal (Egocentric) Network
Analysis
• Effects of social context on
individual attitudes, behaviors
and conditions
• Collect data from respondent
(ego) about interactions with
network members (alters) in all
social settings.
Whole (Complete or Sociocentric)
Network Analysis
• Interaction within a socially or
geographically bounded group
• Collect data from group members
about their ties to other group
embers in a selected social
setting.
3. Not a Simple Dichotomy
• The world is one large (un-measurable) whole
network
• Personal and whole networks are part of a
spectrum of social observations
• Different objectives require different network
“lenses”
4. Personal Networks: Unbounded Social Phenomena
Social or geographic space
• Social influence crosses social domains
• Network variables are treated as attributes of respondents
• These are used to predict outcomes (or as outcomes)
Example: Predict depression
among seniors using the
cohesiveness of their personal
network
5. Social or geographic space
Whole network: Bounded Social Phenomena
Example: Predict depression among seniors using social position in a Retirement Home
Focus on social
position within
the space
6. Social or geographic space
Overlapping personal networks: Bounded and Unbounded
Social Phenomena
Example: Predict depression among seniors
based on social position within a Retirement
Home and contacts with alters outside the
home
Use overlapping networks as a
proxy for whole network
structure, and identify
mutually shared peripheral
alters
7. A note on the term “Egocentric”
• Egocentric means “focused on Ego”.
• You can do an egocentric analysis within a
whole network
– See much of Ron Burt’s work on structural holes
– See the Ego Networks option in Ucinet
• Personal networks are egocentric networks
within the whole network of the World (but
not within a typical whole network).
8. Summary so far
• When to use whole networks
– If the phenomenon of interest occurs within a socially or
geographically bounded space.
– If the members of the population are not independent and tend to
interact.
• When to use personal networks
– If the phenomena of interest affects people irrespective of a
particular bounded space.
– If the members of the population are independent of one another.
• When to use both
– When the members of the population are not independent and tend
to interact, but influences from outside the space may also be
important.
9. Personal networks are unique
• Like snowflakes, no two
personal networks are
exactly alike
• Social contexts may share
attributes, but the
combinations of attributes
are each different
• We assume that the
differences across
respondents influences
attitudes, behaviors and
conditions
10. The content and shape of a personal network
may be influenced by many variables
• Ascribed characteristics
– Sex
– Age
– Race
– Place of birth
– Family ties
– Genetic attributes
• ??Chosen
characteristics
– Income
– Occupation
– Hobbies
– Religion
– Location of home
– Amount of travel
11. How a personal network is formed
• Ascribed characteristics
such as sex, and chosen
characteristics such as
hobbies, may interact
with culture to
effectively screen
potential alters
• Ascribed characteristics
may influence chosen
characteristics, but not
the reverse
12. Interventions?
• People often have little
choice over who is in a
whole network
• By showing people how the
whole network functions
changes can be made to
benefit the group
• Individuals may use the
knowledge of their social
position to their advantage
• People often have a lot of
choice over who is in their
personal network (but they
may not know it)
• Based on ascribed
characteristics and chosen
characteristics, some
people may make conscious
choices about the type of
people they meet and who
they introduce
13. Many variables of interest to social scientists
are thought to be influenced by social context
– Social outcomes
• Personality
• Acculturation
• Well-being
• Social capital
• Social support
– Health outcomes
• Smoking
• Depression
• Fertility
• Obesity
15. Types of personal network data
• Composition: Variables that summarize the attributes of
alters in a network.
– Average age of alters.
– Proportion of alters who are women.
– Proportion of alters that provide emotional support.
• Structure: Metrics that summarize structure.
– Number of components.
– Betweenness centralization.
– Subgroups.
• Composition and Structure: Variables that capture both.
– Sobriety of most between alter.
– Is most degree and most between central alter the same
person?
17. Personal network composition variables
* Proportion of personal network that
are women …
*Average age of network alters …
*Proportion of strong ties …
* Average number of years knowing alters
…
18. Percent of alters from host country
36 Percent Host Country 44 Percent Host Country
• Percent from host country captures composition
• Does not capture structure
20. Personal network structural variables
• Average degree centrality (density)
• Average closeness centrality
• Average betweenness centrality
• Core/periphery
• Number of components
• Number of isolates
21. Components
Components 1 Components 10
• Components captures separately maintained groups (network structure)
• It does not capture type of groups (network composition)
22. Average Betweenness Centrality
Average Betweenness 12.7
SD 26.5
Average Betweenness 14.6
SD 40.5
• Betweenness centrality captures bridging between groups
• It does not capture the types of groups that are bridged
23. 2. Designing a personal network
study
Goals, design, sampling, bias &
name generators issues.
24. Make sure you need a network study!
• Personal network data are time-consuming and
difficult to collect with high respondent burden
• Sometime network concepts can be represented
with proxy questions
– Example: “Do most of your friends smoke?”
• By doing a network study you assume that the
detailed data will explain some unique portion of
variance not accounted for by proxies
• It is difficult for proxy questions to capture structural
properties of networks
25. Sometimes the way we think and talk
about who we know does not accurately
reflect the social context
friends
people from the workplace
My family and me
Close friends
distant familydiverse acquaintances
Neighbors
acquaintances from the
workplace
Neighbors
Friends & acquaintances
from the workplace
Hairdresser
Former job
Friends
here from
Bosnia
Family in
Serbia
Husband
familyFriends
27. Prevalence vs. Relationships
• Estimate the prevalence of a personal-network
characteristic in a population
– Sampling should be as random and representative as possible.
– Sample size should be selected to achieve an acceptable margin of
error.
– Example: Sample 411 personal networks to estimate the proportion of
supportive alters with a five percent margin of error.
• Analyze the relationship between personal-network
characteristic and something you want to predict?
– Sampling should maximize the range of values across variables to
achieve statistical power.
– Example: Sample 200 personal networks of depressed and 200 of not
depressed seniors to test whether the number of isolates predicts
depression.
28. Steps to a personal network survey
Part of any survey
1. Identify a population.
2. Select a sample of respondents.
3. Ask questions about respondent.
Unique to personal network survey
4. Elicit network members (name generator).
5. Ask questions about each network member (name interpreter).
6. Ask respondent to evaluate alter-alter ties.
7. Discover with the informant new insights about her personal
network (through visualization + interview).
29. Selecting a Population
• Choose wisely, define properly – this largely will
determine your modes of data collection and the
sampling frame you will use to select respondents.
• Certain populations tend to cluster spatially, or have
lists available, while others do not
• Race and ethnicity may seem like good clustering
parameters, but are increasingly difficult to define.
30. Modes of Survey Research
• Face-to-face, telephone, mail, and Web (listed
here in order of decreasing cost)
• The majority of costs are not incurred in
actually interviewing the respondent, but in
finding available and willing respondents
• Depending on the population there may be
no convenient or practical sample frame for
making telephone, mail, or email contact
31. Sample Frames
• This can be thought of as a list representing, as
closely as possible, all of the people in the
population you wish to study.
• The combination of population definition and
survey mode suggests the sample frames available.
• Sample frames may be census tracts, lists of
addresses, membership rosters, or individuals who
respond to an advertisement.
32. Example from acculturation study
• GOAL: develop a personal-network measure of
acculturation to predict migrant behavior outcomes
• CHALLENGE: develop an acculturation measure not
dependent on language and/or geography
• POPULATION: migrants in the US and Spain
• SURVEY MODE: face-to-face computer assisted
• SAMPLE FRAME: Miami, NYC, Barcelona; n=535
recruitment via classifieds, flyers, and snowballing
33. Questions about Ego
• These are the dependent (outcome) variables you will predict
using network data, or the independent (explanatory) variables
you will use to explain network data and for controls
– Dependent
• Depression
• Smoking
• Income
– Independent
• Number of moves in lifetime
• Hobbies
– Controls
• Age
• Sex
• Be aware that it is common to find relationships between personal
network variables and outcomes that disappear when control
variables are introduced
34. Example models from acculturation study
Prob>|t| for models using average degree centrality
Variable Health Depression Smoking Children
Average Degree Centrality
(density)
0.2546 0.0487 0.0026 0.1516
Sex (1=Male) 0.0001 0.9235 0.0009 0.0299
Generation (1=First) 0.6672 0.0230 0.0412 0.4297
Age 0.4674 0.0051 0.0747 0.4934
Skin color (1=White) 0.5495 0.7051 0.3473 0.4874
Marital status (1=Never Married) 0.0451 0.2639 0.1571 0.0001
Employed (1=No) 0.3921 0.0127 0.2389 0.2501
Education (1=Secondary) 0.0001 0.0073 0.2439 0.0004
Legal (1=Yes) 0.1428 0.2537 0.1330 0.3468
R Square 0.0732 0.0619 0.0677 0.2543
35. Writing Questions
• Be mindful of levels of measurement and the
limitations/advantages each provides (nominal,
ordinal, interval and ratio)
• Ensure that your questions are valid, brief, and
are not double-barreled or leading
• You can ensure survey efficiency by utilizing
questionnaire authoring software with skip logic
36. Name generators
• Only ego knows who is in his or her network.
• Name generators are questions used to elicit
alter names.
• Elicitation will always be biased because:
– Names are not stored randomly in memory
– Many variables can impact the way names are
recalled
– Respondents have varying levels of energy and
interest
37. Variables that might impact how
names are recalled
• The setting
– Home
– Work
• The use of external aids
– Phone
– Address book
– Facebook
– Others sitting nearby
• Serial effects to naming
– Alters with similar
names
– Alters in groups
• Chronology
– Frequency of contact
– Duration
38. Ways to control (select) bias
• Large sample of alters
– Name 45 alters.
• Force chronology
– List alters you saw most recently.
– Diary.
• Force structure
– Name as many unrelated pairs and isolates.
• Force closeness
– Name people you talk to about important matters.
• Attempt randomness
– Name people with specific first names.
39. Limited or unlimited
• There are many reasons respondents stop listing alters.
– They list all relevant alters.
– Memory.
– Fatigue.
– Motivation.
• The number of alters listed is not a good proxy for network size
• There are other ways to get network size.
– RSW.
– Network Scale-up Method.
• Structural metrics with different numbers of alters requires
normalization.
• Sometimes is preferable to have respondents do the same amount of
work.
40. Names or initials
• Some Human Subjects Review Boards do not
like alter names being listed.
– Personal health information.
– Revealing illegal or dangerous activity.
• With many alters ego will need a name that
they recognize later in the interview.
• First and last name is preferable or WilSha for
William Shakespeare.
41. Online relations (Facebook)
• Should online relationships count?
• Relationships that exist outside should…
• An understudied question is the nature of
exclusively online relationships relative to
offline relationships
42. Personal Network Peculiarities
• Respondents may want to list dead people,
long-lost friends, TV characters, or celebrities
• They may have compromised memories
• You may want to limit alters to people who
provide respondents specific kinds of support
43. Acculturation Example
• Our prompt (pretested) for freelisting 45 alters:
“You know them and they know you by sight or by
name. You have had some contact with them in
the past two years, either in person, by phone, by
mail or by e-mail, and you could contact them
again if you had to.”
• Still, migrants often didn’t understand that alters
who didn’t live in the host country could be listed
44. Other Elicitation Options
• You may want to let alters keep listing names to get
a network size variable, but it is hard to know why
people stop listing alters (fatigue, memory, etc.)
• More likely, you will want less alters named, since
personal network data collection is very intensive
• You can use specialized prompts to more randomly
elicit fewer alters or only ask questions about every
Nth alter named, but keep in mind that eliciting
fewer alters will unintentionally bias your sample
45. Asking Questions about Alters
(Name Interpreters)
• Try to avoid having respondents make
uninformed guesses about people they know
• Still, some researchers argue it is really the
respondents’ perception of their alters that
influences their own attitudes and behaviors
• Figuring out how well a person knows their
alters and the nature of their relationships is
the most challenging interpretive activity
46. How well do you know…
• Find out long the respondent has known the alter
(duration) as well as their frequency and main
mode of contact
• Research suggests that tie strength is best assessed
using questions about closeness
• People tend to be less close to people they do not
like, even though they may know a lot about them
• Asking how respondents know someone is also
helpful – “How did you meet?” (school, work, etc.)
47. Acculturation Example
45 alters
x 13 questions about each
= 585 total items
• Demographics (age, sex, CoO, distance, etc.)
• Closeness of respondent/alters relationship (1-5)
• How they met (family, work, neighbor, school)
• Communication (modes, intimacy, trust )
• Do they smoke?
48. Analyzing Compositional Data
• Create a summary of each variable for each
respondent, keeping in mind their levels of
measurement
• Merge the summarized variables onto the respondent-
level data to explain characteristics of respondents
• Measure the extent to which alter characteristics match
the respondent (ego correspondence, homophily)
• You can then perform frequencies, cross tabulations,
and create dummy variables to be used in regressions
49. Effect of respondent characteristics on
predicting migrants’ smoking
• Individual Attributes: age, sex, employment, etc.
Respondent Characteristic % Does Not Smoke % Smoke
Sex***
Male 67 (200) 33 (99)
Female 80 (189) 20 (47)
Employment**
Full Time 68 (103) 32 (49)
Part Time 85 (87) 15 (15)
Unemployed 73 (127) 27 (47)
Retired 83 (10) 17 (2)
Self Employed 54 (19) 46 (16)
Seasonal 72 (43) 28 (17)
Acculturation
Level 1 77 (150) 23 (45)
Level 2 71 (148) 29 (60)
Level 3 69 (72) 31 (32)
Level 4 65 (17) 35 (9)
Level 5 100 (2) 0 (0)
50. Effect of compositional variables on migrant smoking
Composition Variable % Does Not Smoke % Smoke
Proportion of alters with listed tie strength
Level 1 .12 .10
Level 2 .24 .26
Level 3** .23 .27
Level 4 .18 .17
Level 5 .22 .20
Proportion of alters of listed sex
Male*** .52 .57
Female *** .47 .42
Proportion of alters that are confidantes
Yes*** .39 .47
No*** .61 .53
Proportion of alters that are smokers
Yes*** .19 .35
No*** .81 .65
51. Asking about Ties Between Alters
• This is a time consuming process… however,
• If you limit yourself to network composition, you
assume the effects of social context on attitudes,
behaviors and conditions are more about who
occupies a personal network than about how they
are structurally arranged around the respondent
• Still, keep in mind the exponential nature of your
chosen alter sample size…
52. “How likely is it that Alter A and Alter B talk to each
other when you are not around? That is, how likely is
it that they have a relationship independent of you?”
53. Questions about Accuracy
• Some researchers do not believe respondents can
report alter-tie data with any accuracy… We do
• It is easier for respondents to report on the
existence of ties between alters they know from
different social domains than on ties between people
they may not know well from a single domain
• Personal networks are more attuned to the larger
structures of different groups and bridging between
groups than subtle interactions within groups
54. Some Network Structural Metrics
• Degree Centrality is the number of alters any given alter is directly
connected to.
• Degree Centralization is the extent to which the network structure is
dominated by a single alter in terms of degree.
• Closeness Centrality is the inverse of the distance from that alter to
all other alters.
• Closeness Centralization is the extent to which the network structure
is dominated by a single alter in terms of closeness.
• Betweenness centrality for a given alter is the number of geodesics
(shortest paths) between all alters that the alter is on.
• Betweenness Centralization is the extent to which the network
structure is dominated by a single alter in terms of betweenness.
• Components are connected graphs within a network.
• Cliques are maximally complete subgraphs.
• Isolates are alters who are not tied to anybody else.
55. Some Network Structural Procedures
• Multi-dimensional scaling is a procedure used to determine
the number and type of dimensions in a data set.
• Factor Analysis (also called principal components) is a
procedure that attempts to construct groups based on the
variability of the alter ties. Also used in survey research.
• Cluster analysis is a family of statistical procedures
designed to group objects of similar kinds into categories.
• Quadratic Assignment Procedure is a bootstrap method
used to determine whether two networks are different.
56. Acculturation Example
Network Structural Metric Does not smoke Smokes
Average degree centrality*** 29 23
Average closeness centrality 142 149
Average betweenness centrality 1.5 1.7
Components 1.4 1.5
Isolates* 4 6
• migrants with denser networks are more likely to smoke
• but wait… does smoking cause the structural differences
or do the structural differences cause smoking?
57. Incremental improvement in R square by adding variable in model with
acculturation and control variables
Variable Health Depression Smoking Children
Strength of tie 0 0.0031 0.0018 0.0035
Alter sex 0.0019 0.0024 0.0012 0.0011
Frequency of alter contact 0.0042 0.0169 0 0.0043
Where alters live 0.0003 0.0072 0.0029 0.004
Where alters were born 0 0.0005 0.0004 0.0003
Proportion family 0.0045 0.0019 0.0059 0.0235
Alter age 0.0116 0.0006 0.0025 0.0298
Alter race 0.0012 0.001 0.0023 0.0183
Alter as confidante 0.0005 0.0033 0.0267 0.0003
Alter smoking status 0.0001 0.0202 0.1296 0.0046
Average degree centrality 0.0035 0.0065 0.0151 0.001
Average closeness centrality 0.0012 0.0076 -0.001 -0.0002
Average betweenness centrality 0.0012 -0.0001 0.0021 0.0025
Isolates 0.0033 0.0015 0.0046 -0.0003
Components 0.0051 0.0072 -0.0008 0
Core size 0.0033 0.0035 0.0095 0.0019
58. Combining Composition and Structure
• Treating each variable independently assumes
composition and structure do not interact
• You can only combine structural variables with
compositional variables when they are calculated at
the level of the alter…
– Centrality Scores
– Density
– whether or not the alter is an isolate
59. Acculturation Example
Does Not Smoke Smokes
Most degree central alter
does not smoke
83 57
Most degree central alter
smokes
17 43
Does Not Smoke Smokes
Proportion of smoking
alters that are strong ties
.07 .13
Proportion of smoking
alters that are confidantes
.08 .18
60. Personal Network Visualizations
Hand-Drawn vs. Structural
Halle
other
other
mother's
family
father's
family
Florencia
Berlin
Berlin
Barcelona friends +
close kin
College friends
Mother’s family
Barcelona friends
family
Florencia
Berlín
Halle friends
Berlin’s former boyfriend
Father’s family
61. Some Notes on Visualization
• Network visualization lets you quickly identify
relationships between several compositional and
structural variables simultaneously
• Visualization should be guided by research question
• The way different software algorithms places nodes
with respect to one another is meaningful
• Nodes and ties can often be sized, shaped, and
colored in various ways to convey info
67. Egonet
• Egonet is a program for the collection and analysis
of egocentric network data.
• It helps you create the questionnaire, collect data,
and provide global network measures and
matrices.
• It also provides the means to export data that can
be used for further analysis by other software.
69. Study design
• When you create a new Study, EgoNet open a
folder with the name of the Study plus some
subfolders when needed: “interviews”,
“graphs”, “statistics”.
• The study design is saved in a file named
name_study.ego.
• The study has four modules, Ego description,
Ego-Alters’ name generator, Alters description
and Alter-Alter relationship.
70. Study design …
• We will provide the .ego file at the end of this
exercise in order to avoid possible problems
with compatibility.
78. Development of a Social Network Measure
of Acculturation and its Application to
Immigrant Populations in South Florida and
Northeastern Spain.
• Develop a measure of acculturation based on
personal network variables that can be used
across geography and language
79. Visualization of the networks of two sisters
Label = Country of origin, Size = Closeness, Color = Skin color,
Shape = Smoking Status
• Mercedes is a 19-year-old second
generation Gambian woman in Barcelona
• She is Muslim and lives with her parents
and 8 brothers and sisters
• She goes to school, works and stays
home caring for her siblings. She does
not smoke or drink.
• Laura is a 22-year-old second generation
Gambian woman in Barcelona
• She is Muslim and lives with her parents
and 8 brothers and sisters
• She works, but does not like to stay
home. She smokes and drinks and goes
to parties on weekends.
80. Ethnic-
exclusive
Ethnic-plural
or transna-
tional
Generic F
Percentage of French/Wolof
Percentage of migrants
N cohesive subgroups
Homogeneity of subgroups
Density
Betweenness centralization
Average freq. of contact
Average closeness
Percentage of family
13.2
29.6
1.6
60.9
41.2
16.2
4.0
2.1
36.3
25.2
31.9
2.2
63.5
28.9
20.6
4.3
2.1
30.4
26.2
36.3
2.1
56.3
30.6
18.8
4.0
2.1
35.2
12.3**
2.1
5.2**
1.7
9.5**
3.2*
1.8
0.9
3.1*
* p < .05; ** p < .01.
Table 1. Unstandardized means of personal network characteristics per
identification (N = 271).
81. Social and Cultural Context of Racial
Inequalities in Health
• Observation: Rates of hypertension are much higher
among African Americans than other racial groups
• Hypothesis: Hypertension is a function of stress
which is caused in part by the compositional and
structural properties of the personal networks of
African Americans
83. Egocentric author networks
• How does composition and structure of the
egocentric co-author network affect scientific
impact (the h-index)?
84. Example 1: Low H, Low co-authors
H-index 1
# co-authors 2
Affiliation Univ Milan,
Dipartimento Sci
Terra, I-20134
Milan, Italy
Sampled article Late Paleozoic and
Triassic bryozoans
from the Tethys
Himalaya (N India,
Nepal and S Tibet)
85. Example 2: Low H, High co-authors
H-index 1
# co-authors 12
Affiliation Clin Humanitas,
Med Oncol &
Hematol Dept, I-
20089 Rozzano,
MI, Italy
Sampled article Chemotherapy
with mitomycin c
and capecitabine in
patients with
advanced
colorectal cancer
pretreated with
irinotecan and
oxaliplatin
86. Example 3: High H, Low co-authors
H-index 31
# co-authors 14
Affiliation Catholic Univ
Korea, Dept
Pharmacol, Seoul,
South Korea
Sampled article Establishment of a
2-D human urinary
proteomic map in
IgA nephropathy
87. Example 4: High H, High co-authors
H-index 35
# co-authors 67
Affiliation Katholieke Univ
Leuven, Oral
Imaging Ctr, Fac
Med, B-3000
Louvain, Belgium
Sampled article Development of a
novel digital
subtraction
technique for
detecting subtle
changes in
jawbone density
90. Promise & Challenges
• greater ability to assess causation
• greater ability to infer dynamic network change
• high likelihood of respondent attrition
• more alters may be added to networks over time
• Interviewers need to keep asking egos the same
questions about their alters – increasing burden
92. Personal Network Visualization as a Helpful
Interviewing Tool
• Respondents become very interested when they
first see their network visualized
• By using different visualizations, you can ask
respondents questions about their social context
that would otherwise be impossible to consider
– why they confide in some alters more than others
– if they’d introduce an alter from one group into another
– Why isolates in their network aren’t tied to anyone
94. Vennmaker
• It is a new software tool for participative visualization
and analysis of social networks.
• Provides a user friendly mapping layout and GUI.
• Can compare different individual perspectives and
visualizing changes in networks over time.
• Allows for automated personal network interviews.
• Combines aspects of quantitative and qualitative
network analysis in real-time (audio recording).
95.
96. Deceased!
2 regions of departure
2 „conflicts“
Intercultural
working
relationships
0 own-ethnic
contacts in GER
98. E-net
• E-NET is a free program written by Steve Borgatti for
analyzing and vsiualizing ego-network data
• Allows for simultaneous calculation of network
metrics across many cases, presently including
• The program is currently in the beta stage of
development, so it is still pretty rough.
102. Final remarks …
• In the last decade the studies using the
personal network perspective has increased a
lot …
• We plan to put all data gathered during the
last years in a joint Observatory open to the
scientific community:
http://personal-networks.uab.es
107. Formula from Krackhardt and Stern (1986)
Assuming two groups based on some attribute, one
defined as internal and the other as external:
108. Interpretation
• Score of +1.0 = All links external to subunit
• Score of 0 = Links are divided equally
• Score of -1.0 = All links are internal to subunit
109. EI Index
EI Index -0.549
Normalized -0.0118
EI Index -0.185
Normalized -0.0037
• Captures both composition and structure
• Represents the interaction between two types of nodes
110. Distribution of EI index
(Most scores are positive, indicating more interaction between
migrants and non-migrants than within groups)
- 1 - 0 . 8 - 0 . 6 - 0 . 4 - 0 . 2 0 0 . 2 0 . 4 0 . 6 0 . 8 1
0
2 . 5
5 . 0
7 . 5
1 0 . 0
1 2 . 5
1 5 . 0
1 7 . 5
2 0 . 0
2 2 . 5
P
e
r
c
e
n
t
EI _ I n d e x
112. Relation categories in Thailand
• Objective: Discover mutually exclusive and
exhaustive categories in a language for how
people know each other to be used on a
network scale-up survey instrument
113. Procedure 1: Twenty one respondents freelist in Thai
ways that people know each other
Chris, I deleted some nodes in the whole network of the right because SOME NODES are not captured by the sociocentric networks (for instance, family …).