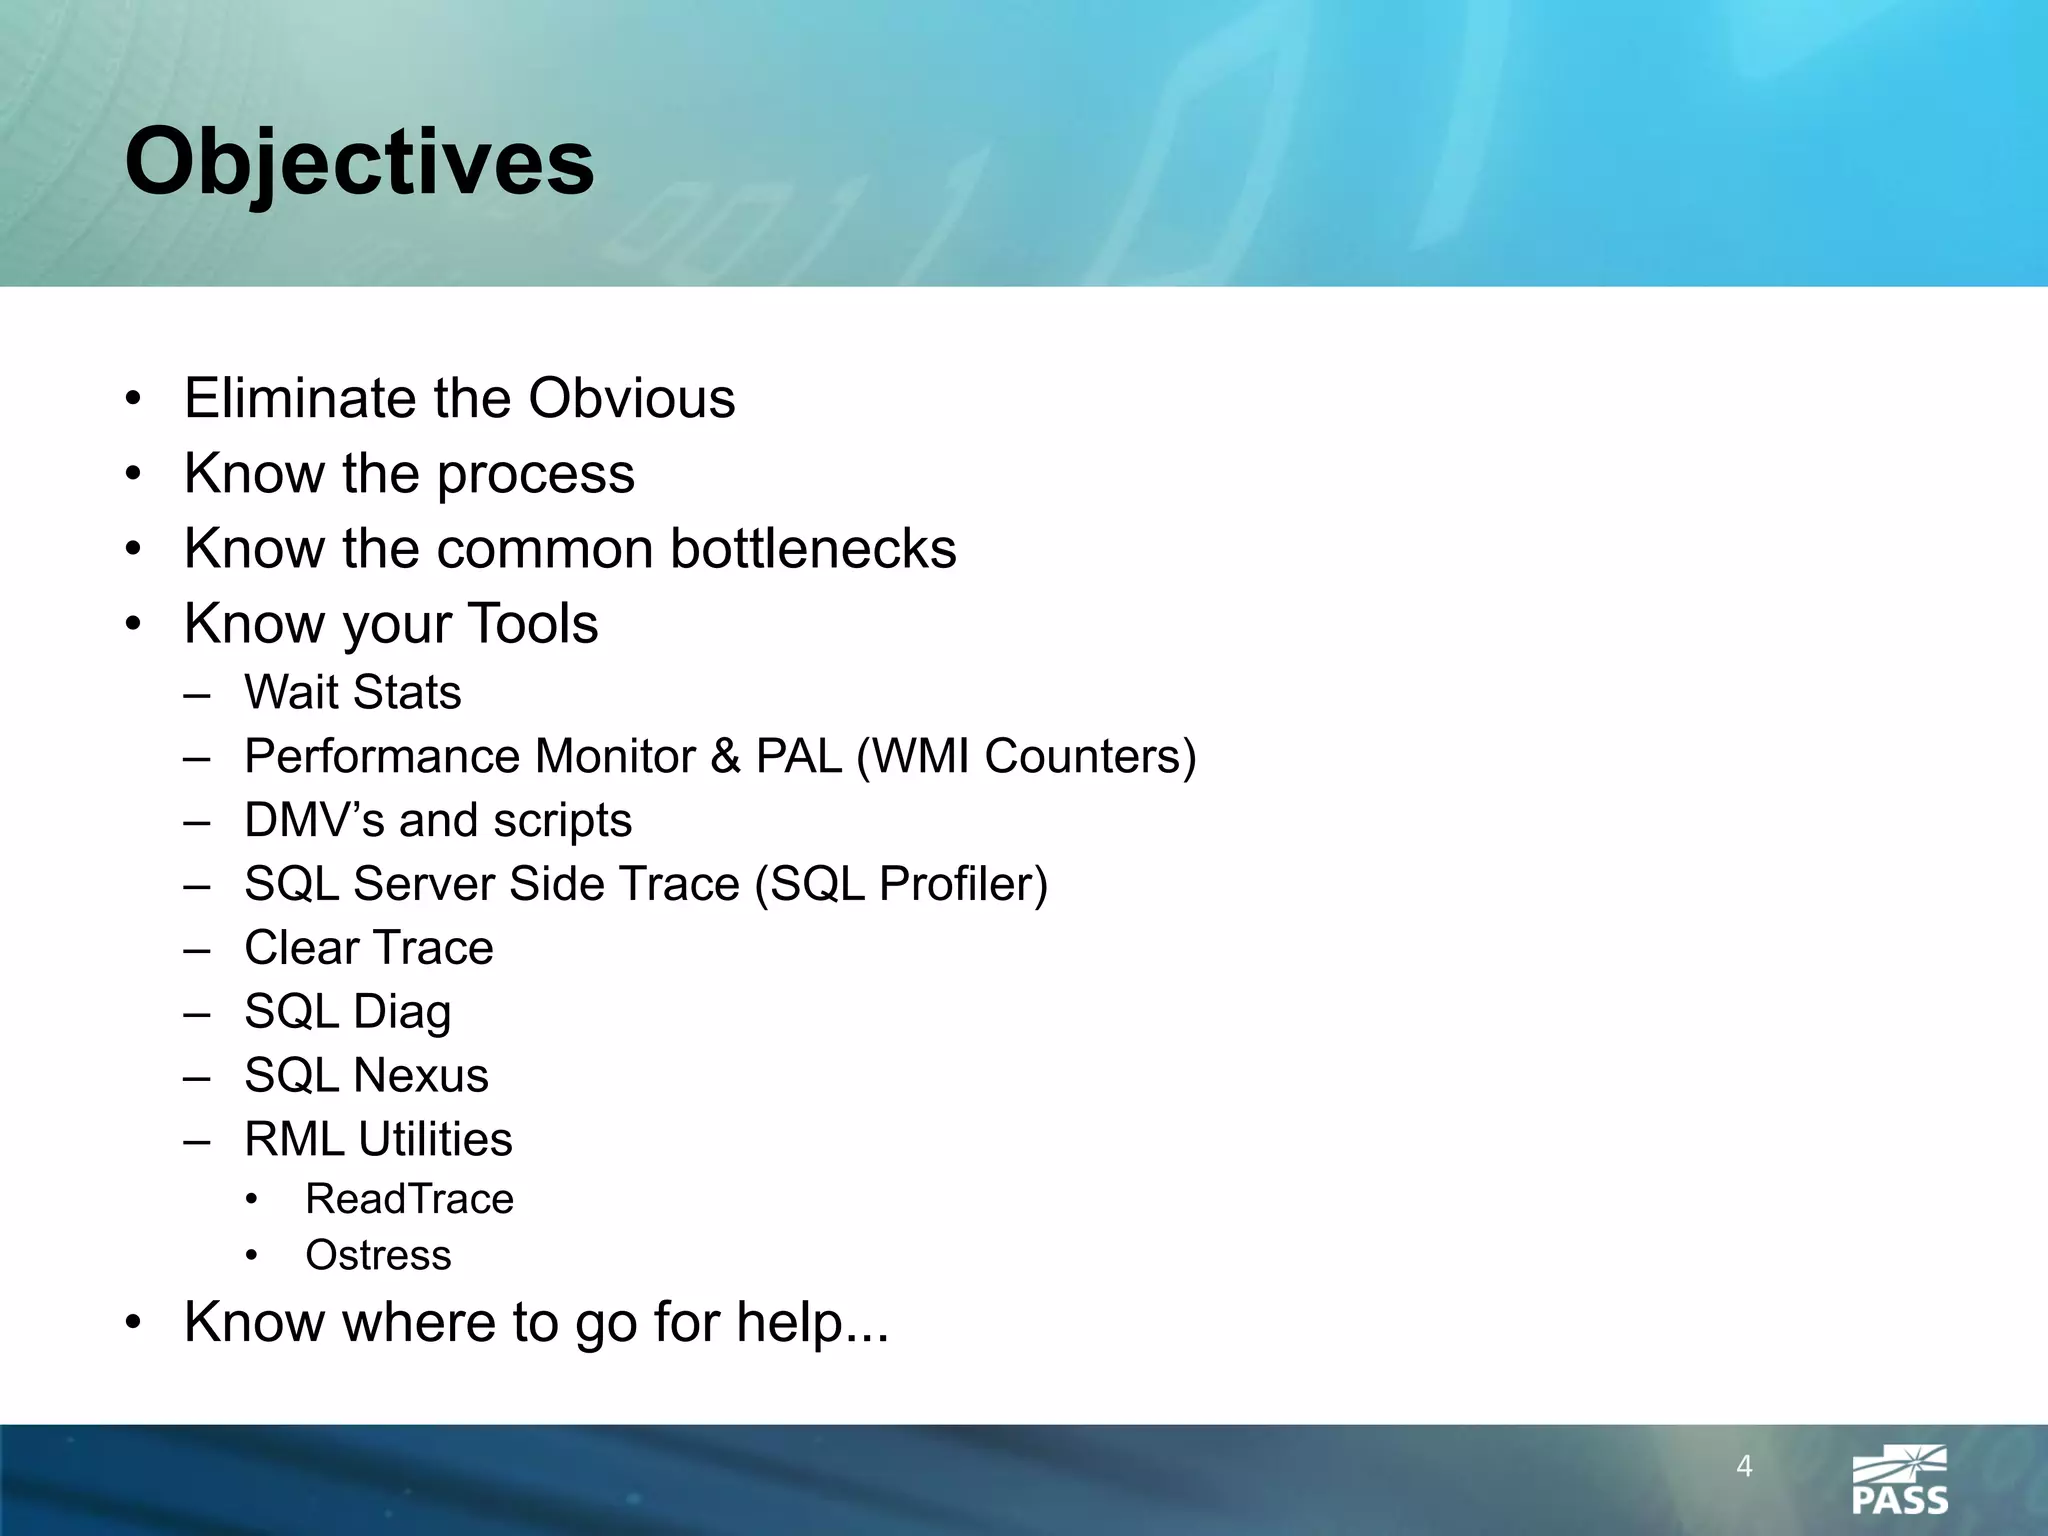
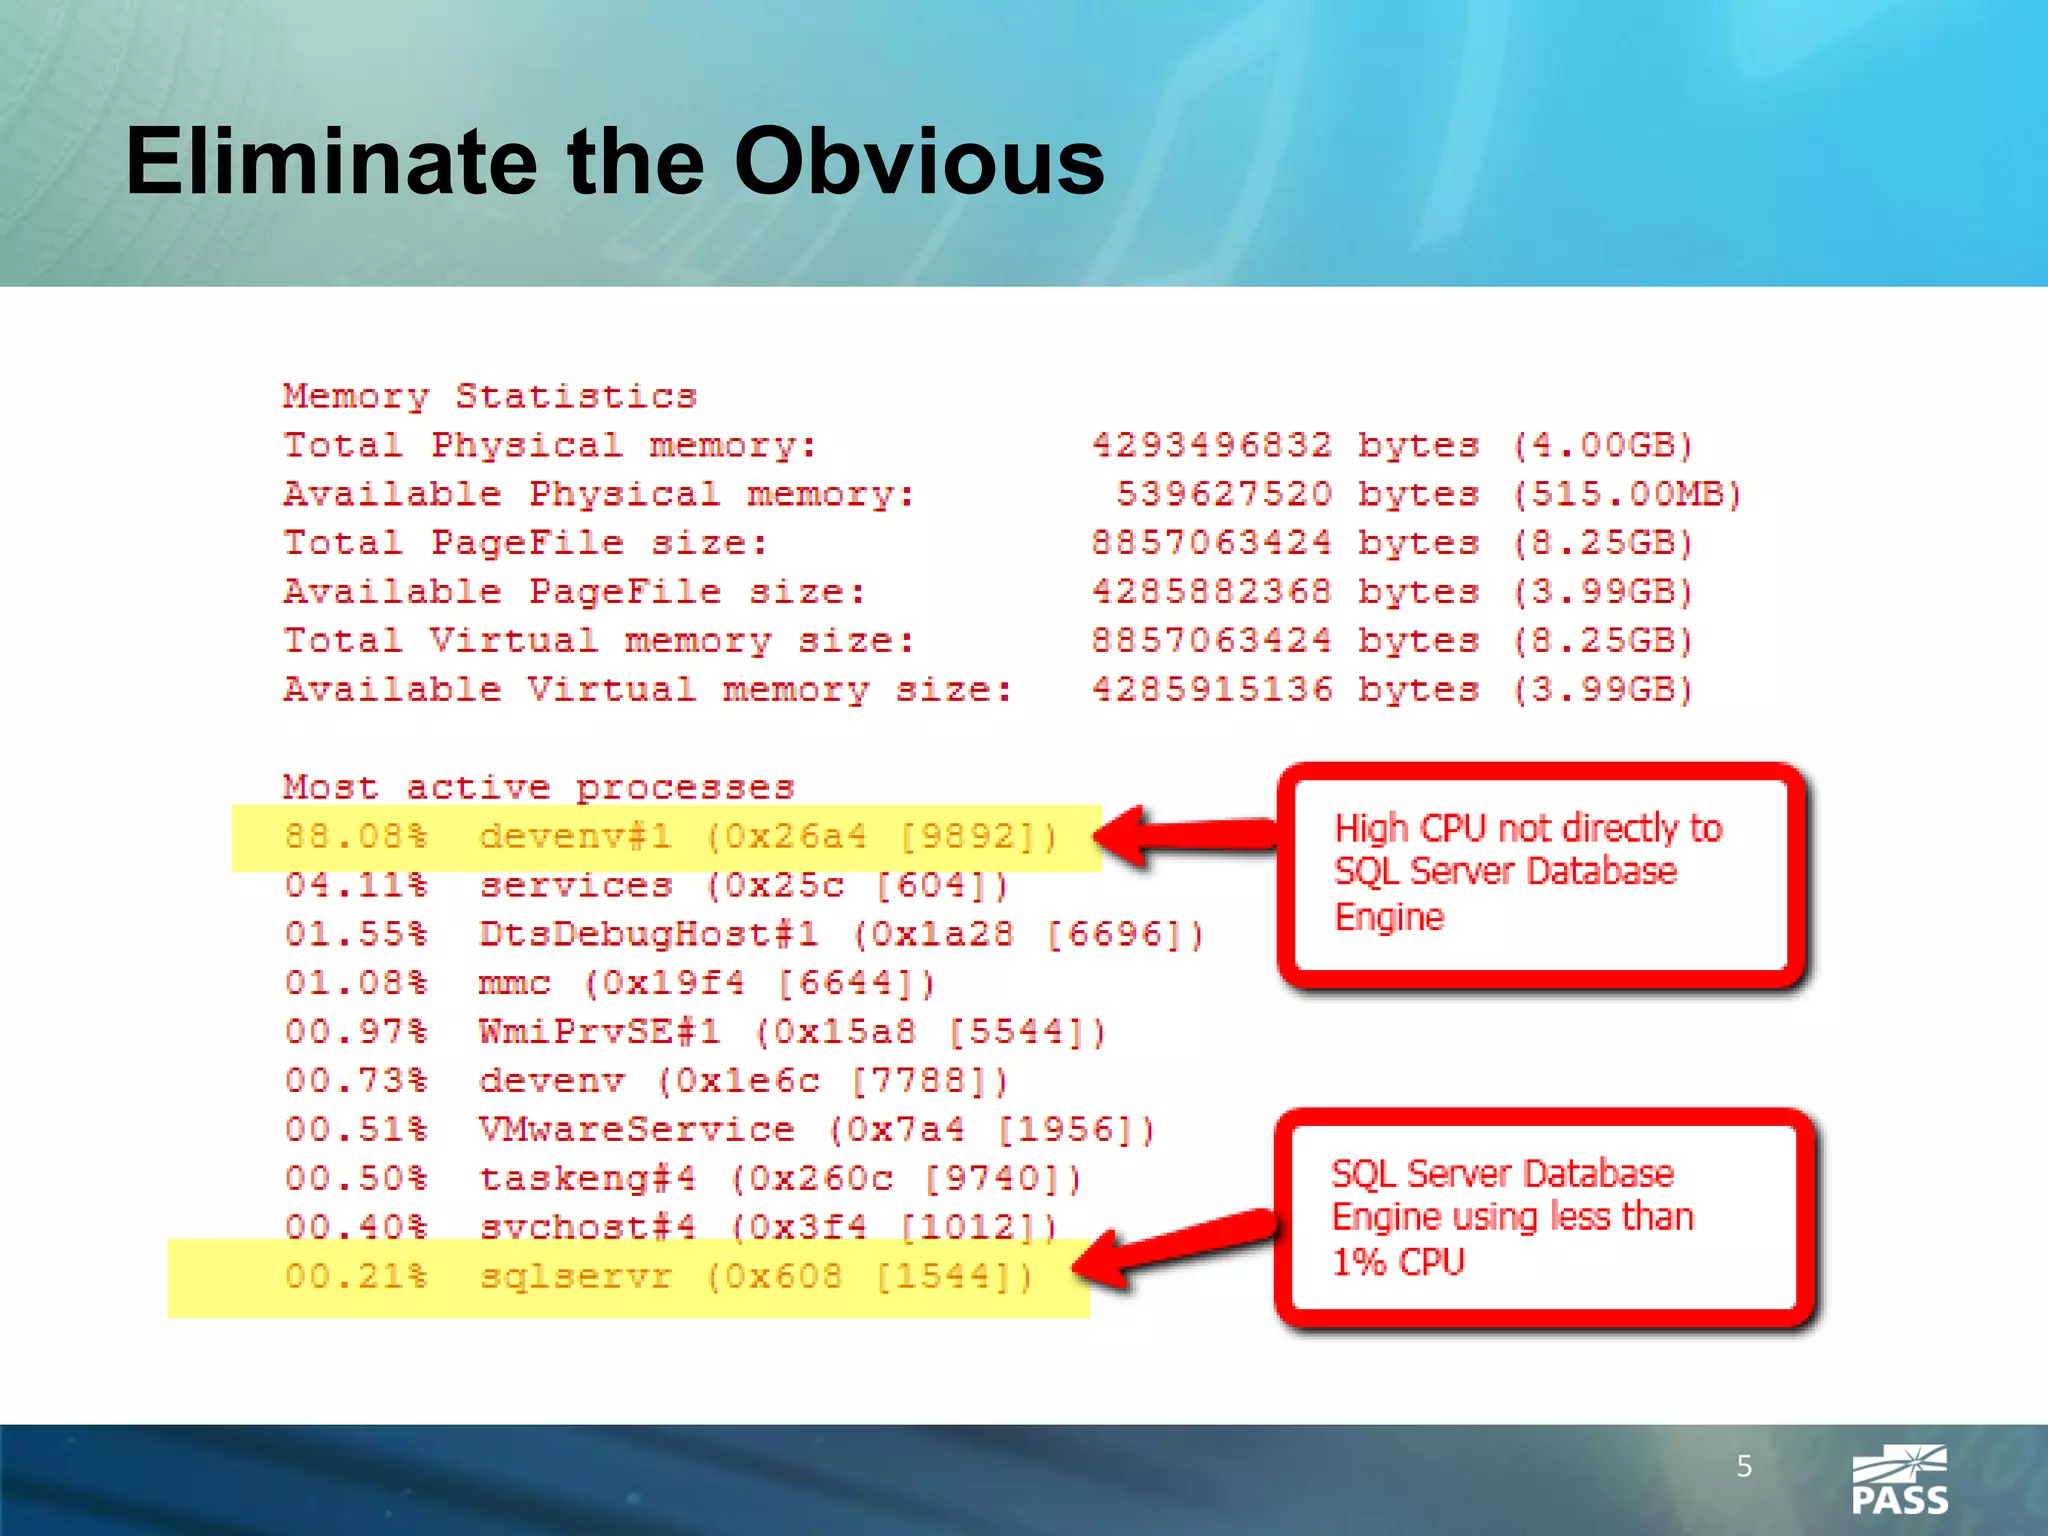
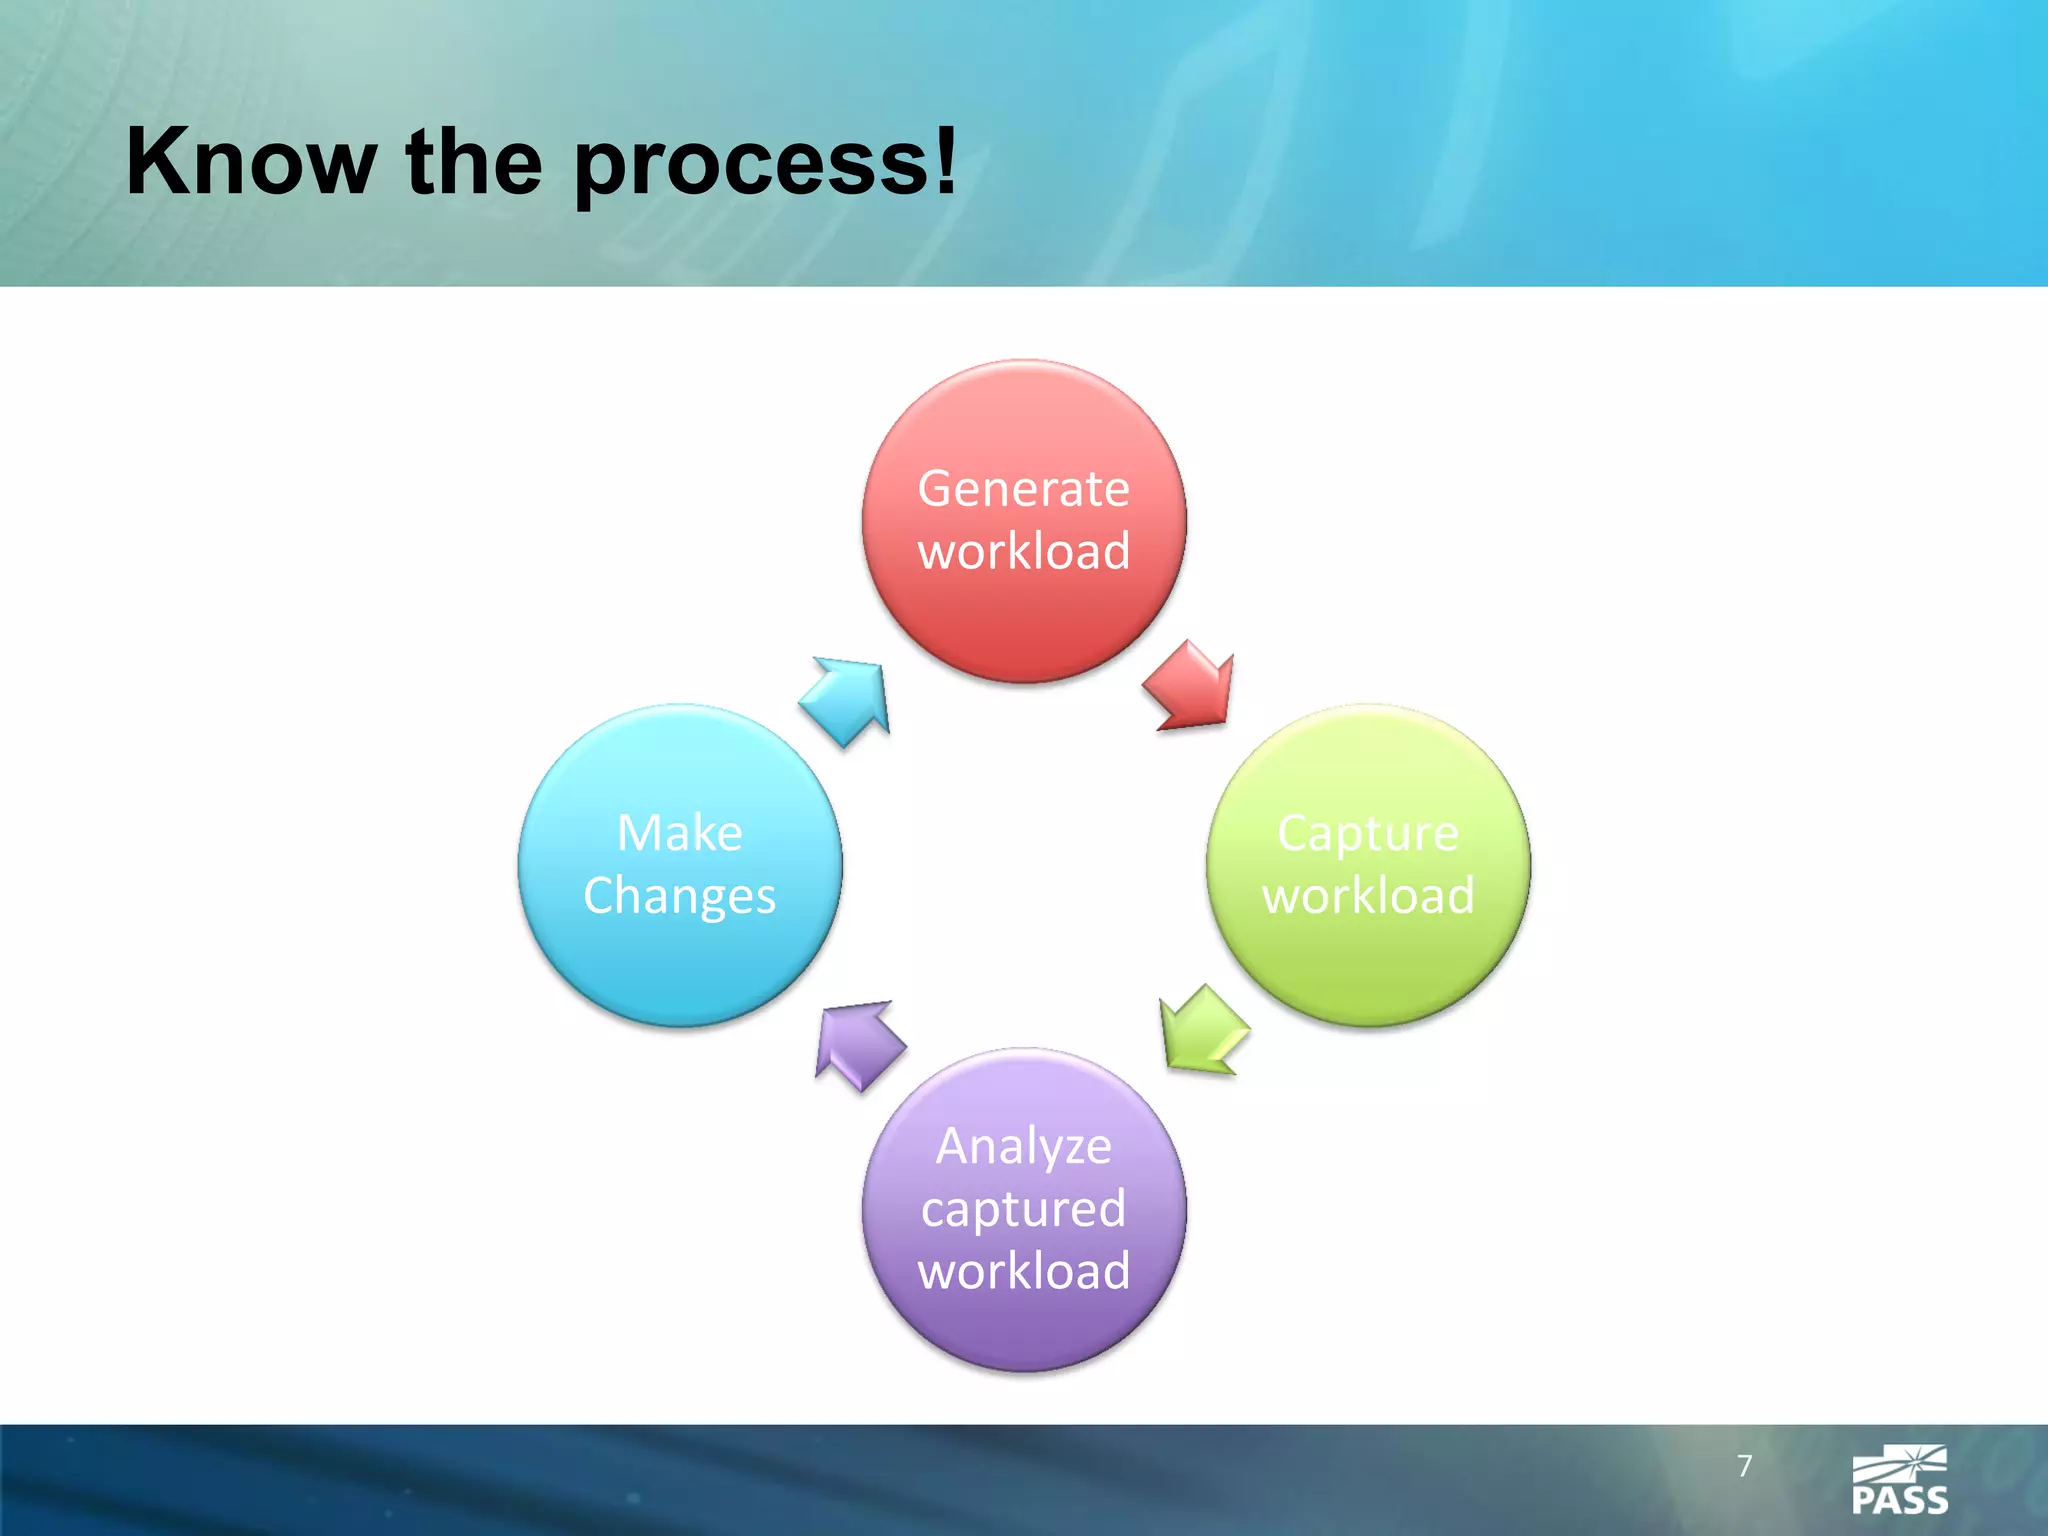
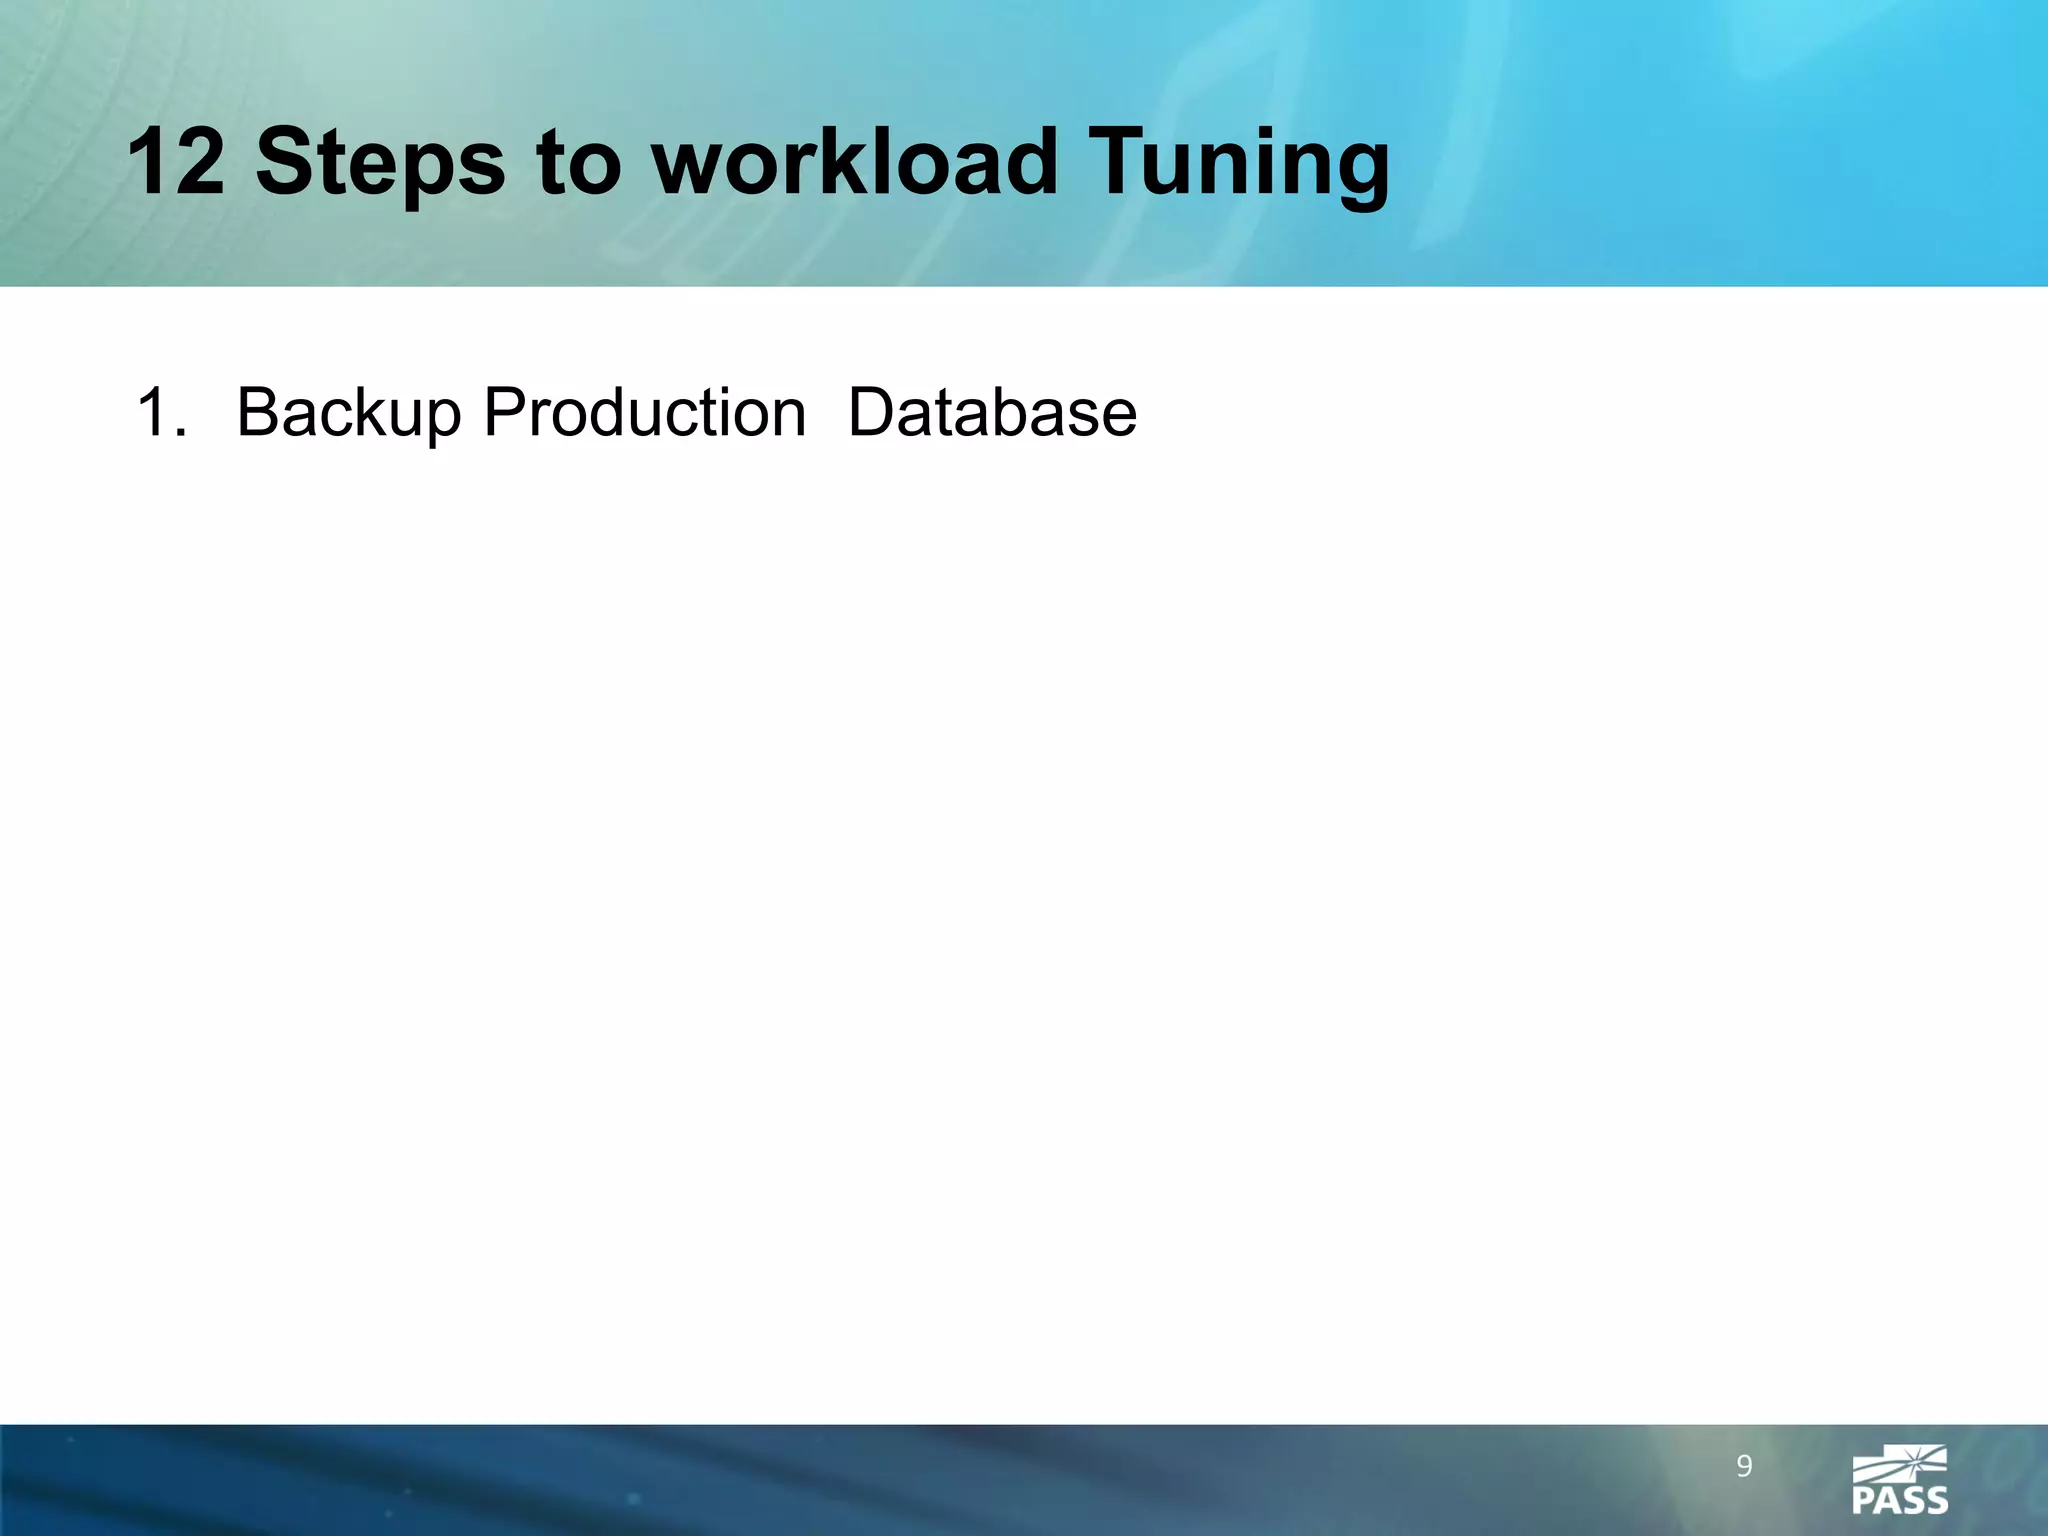
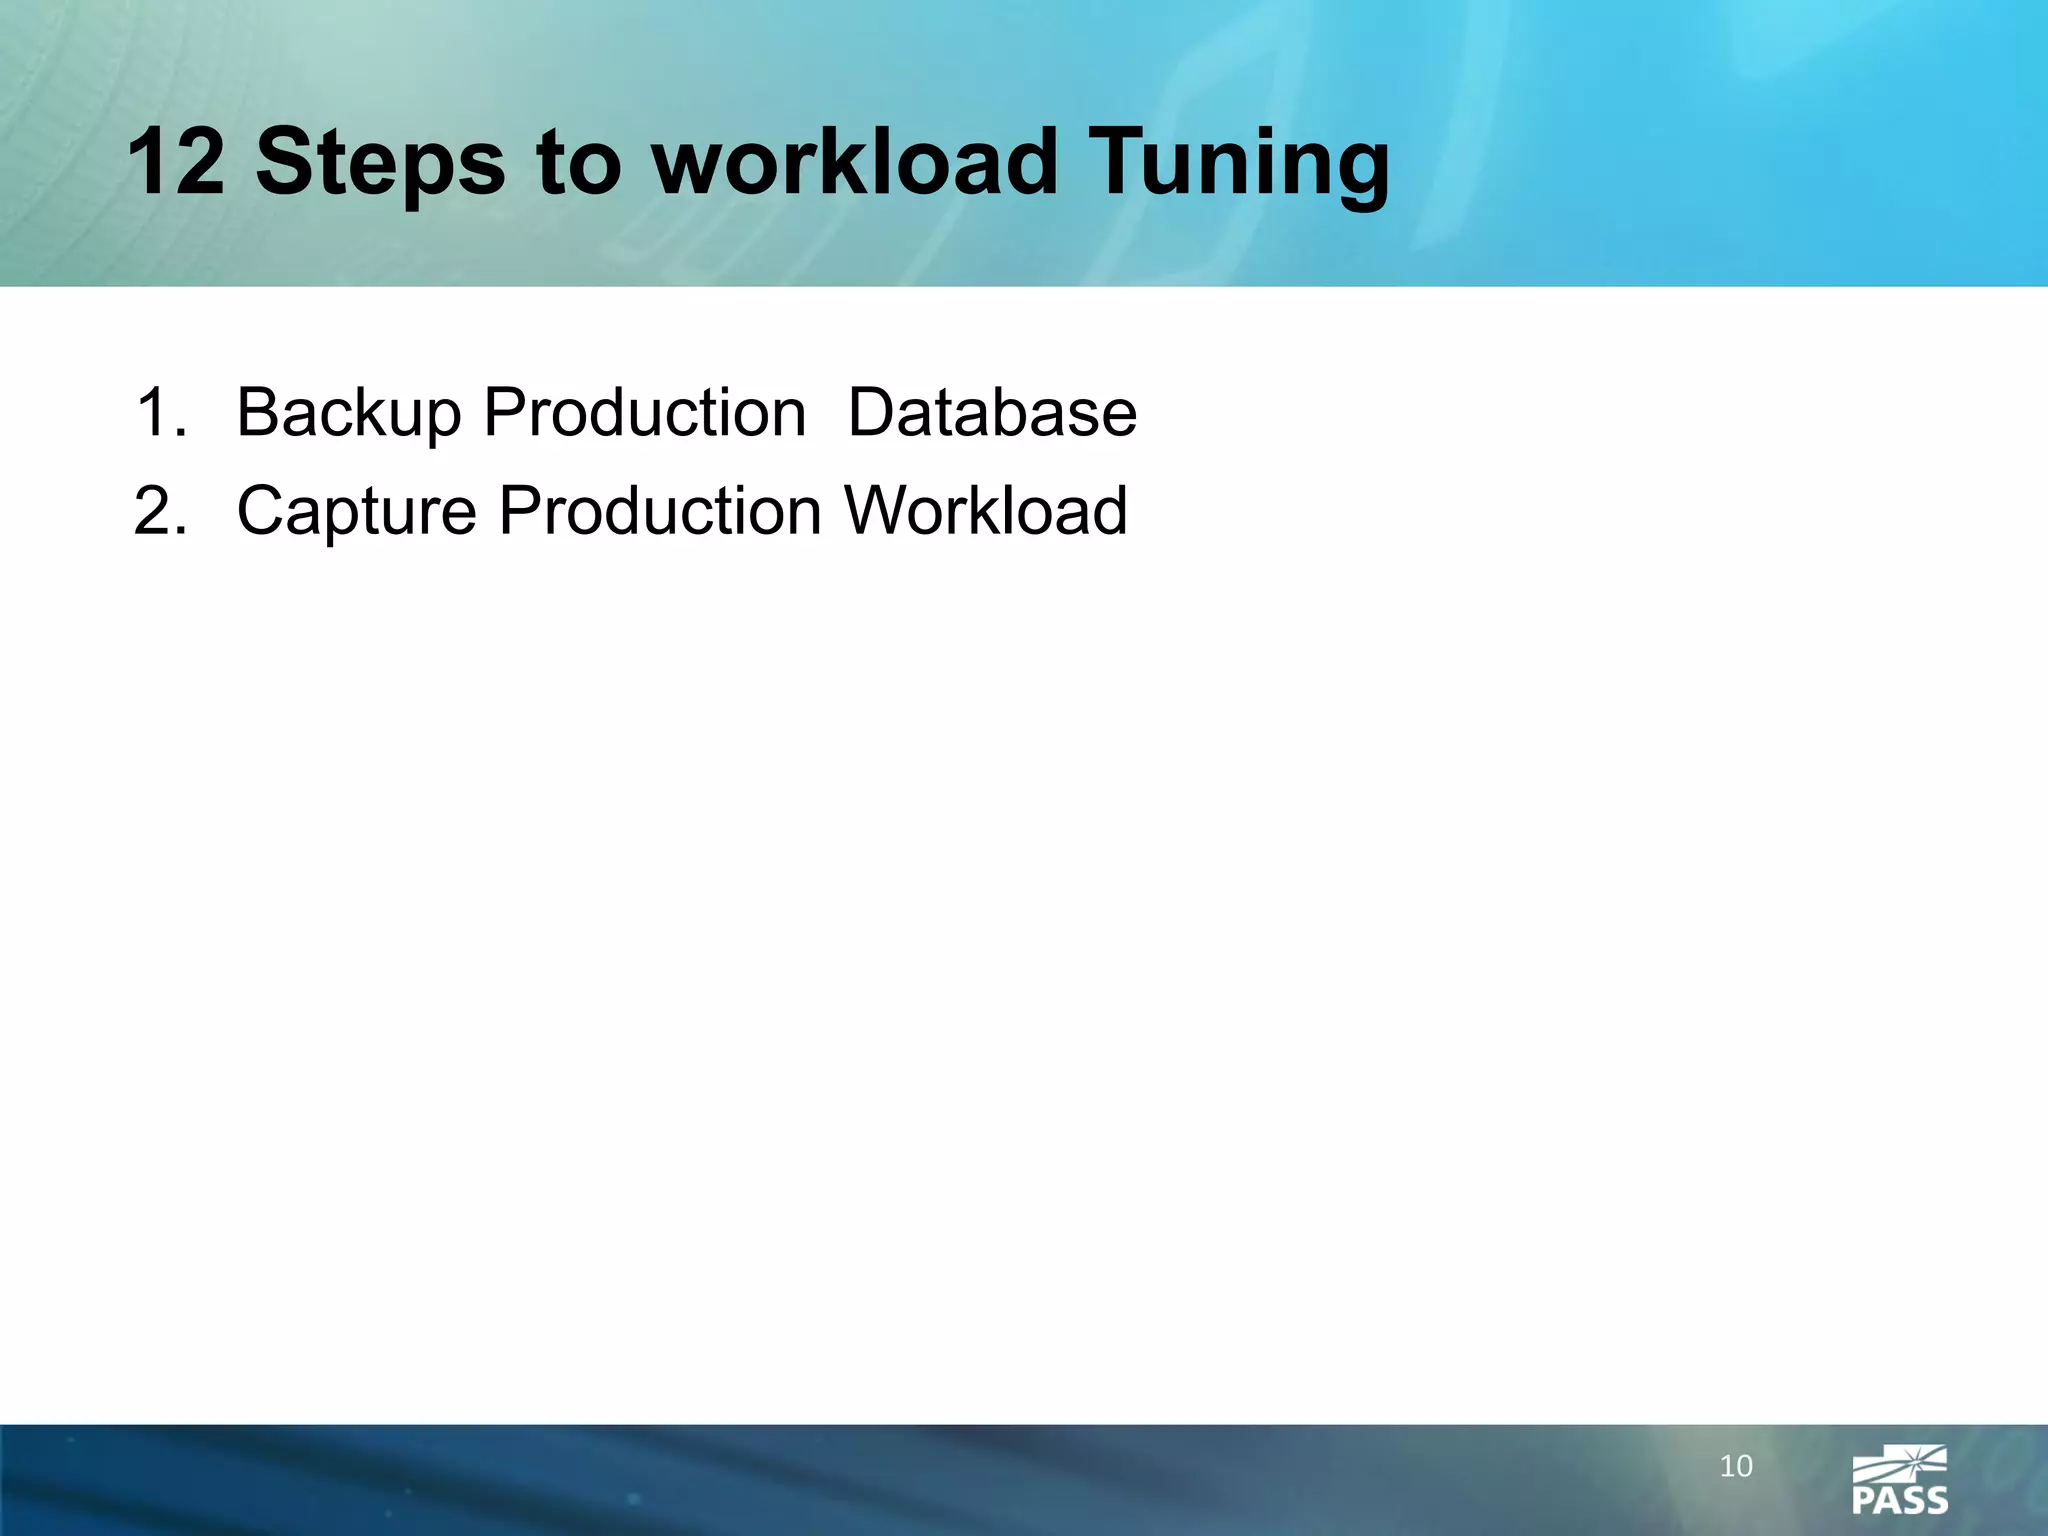
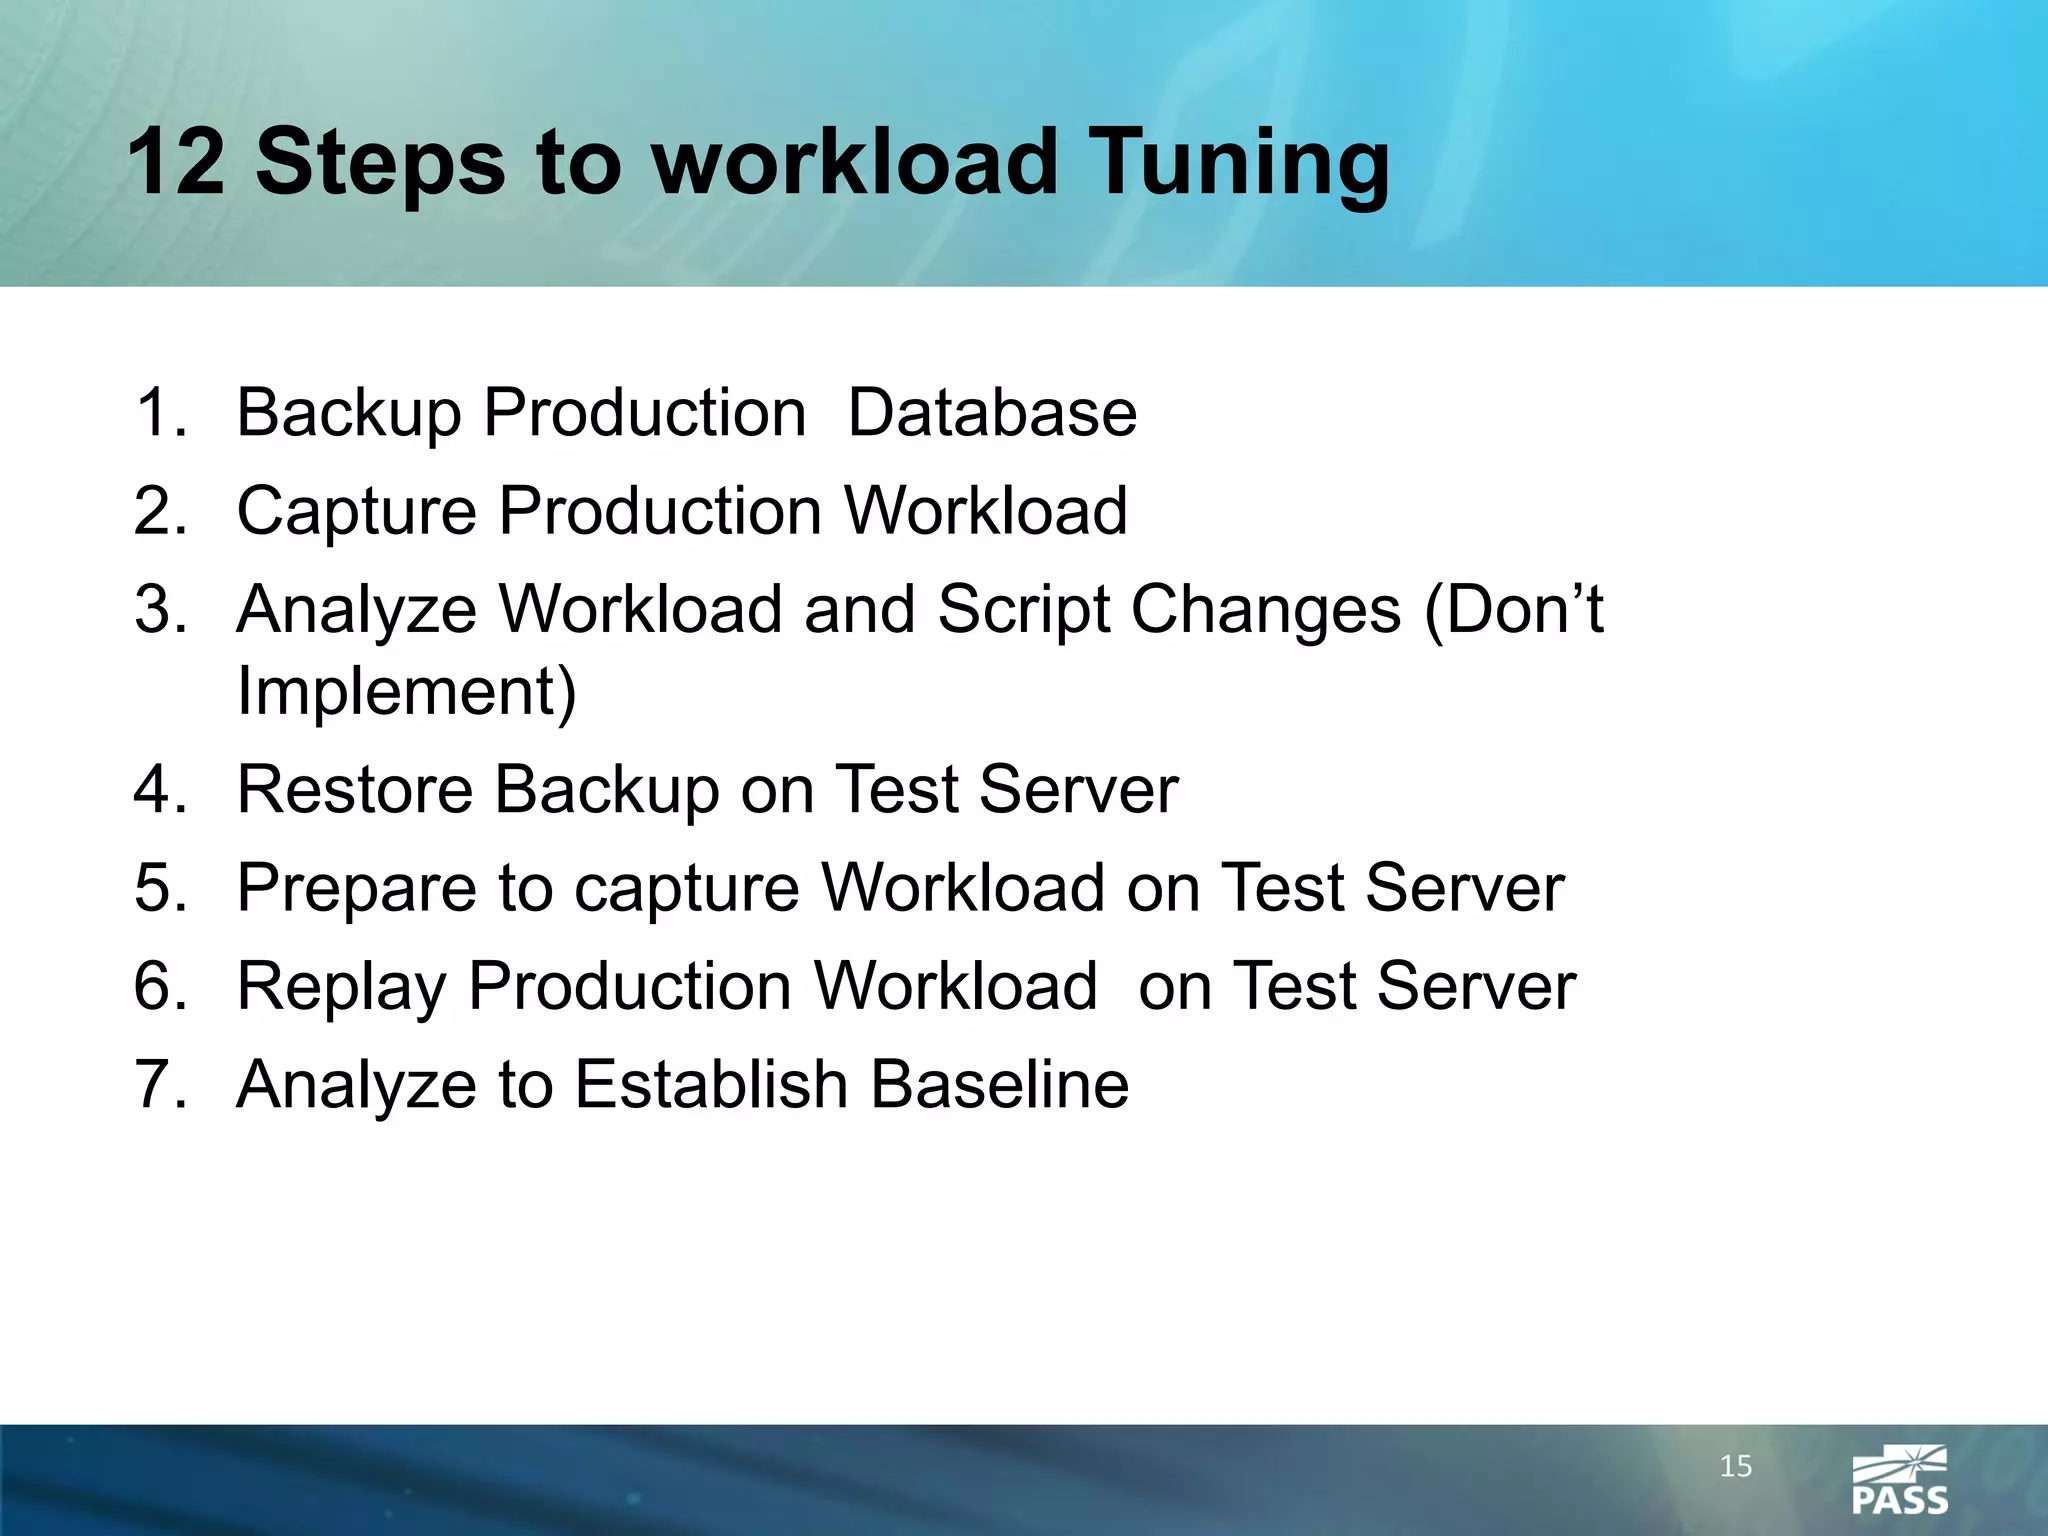
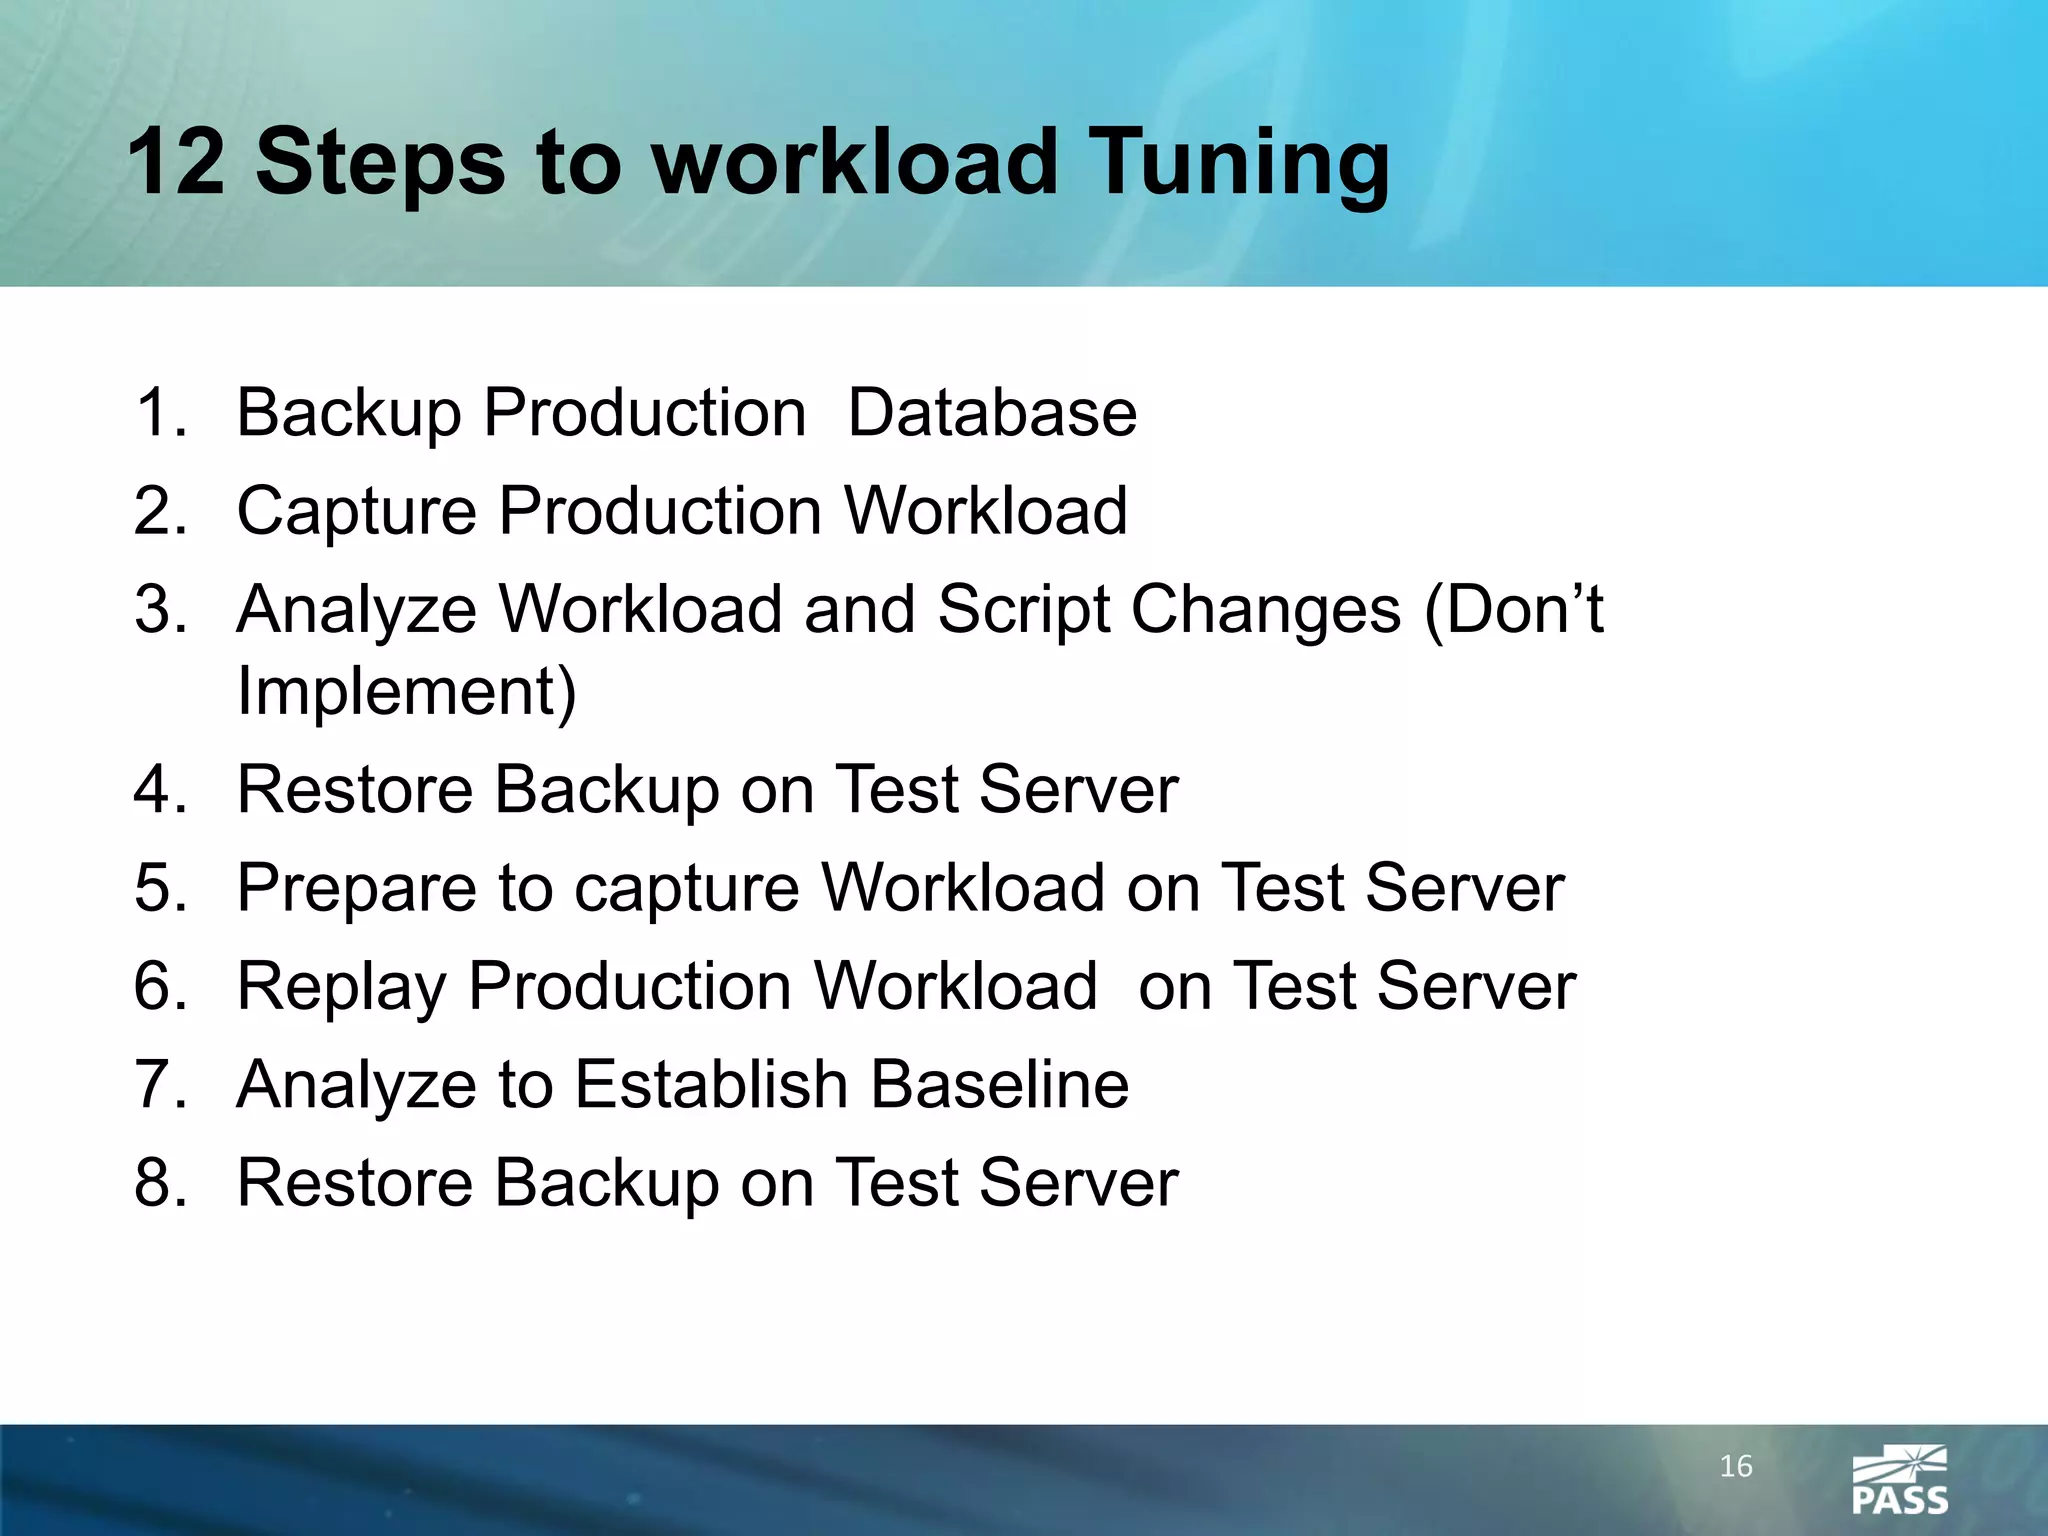
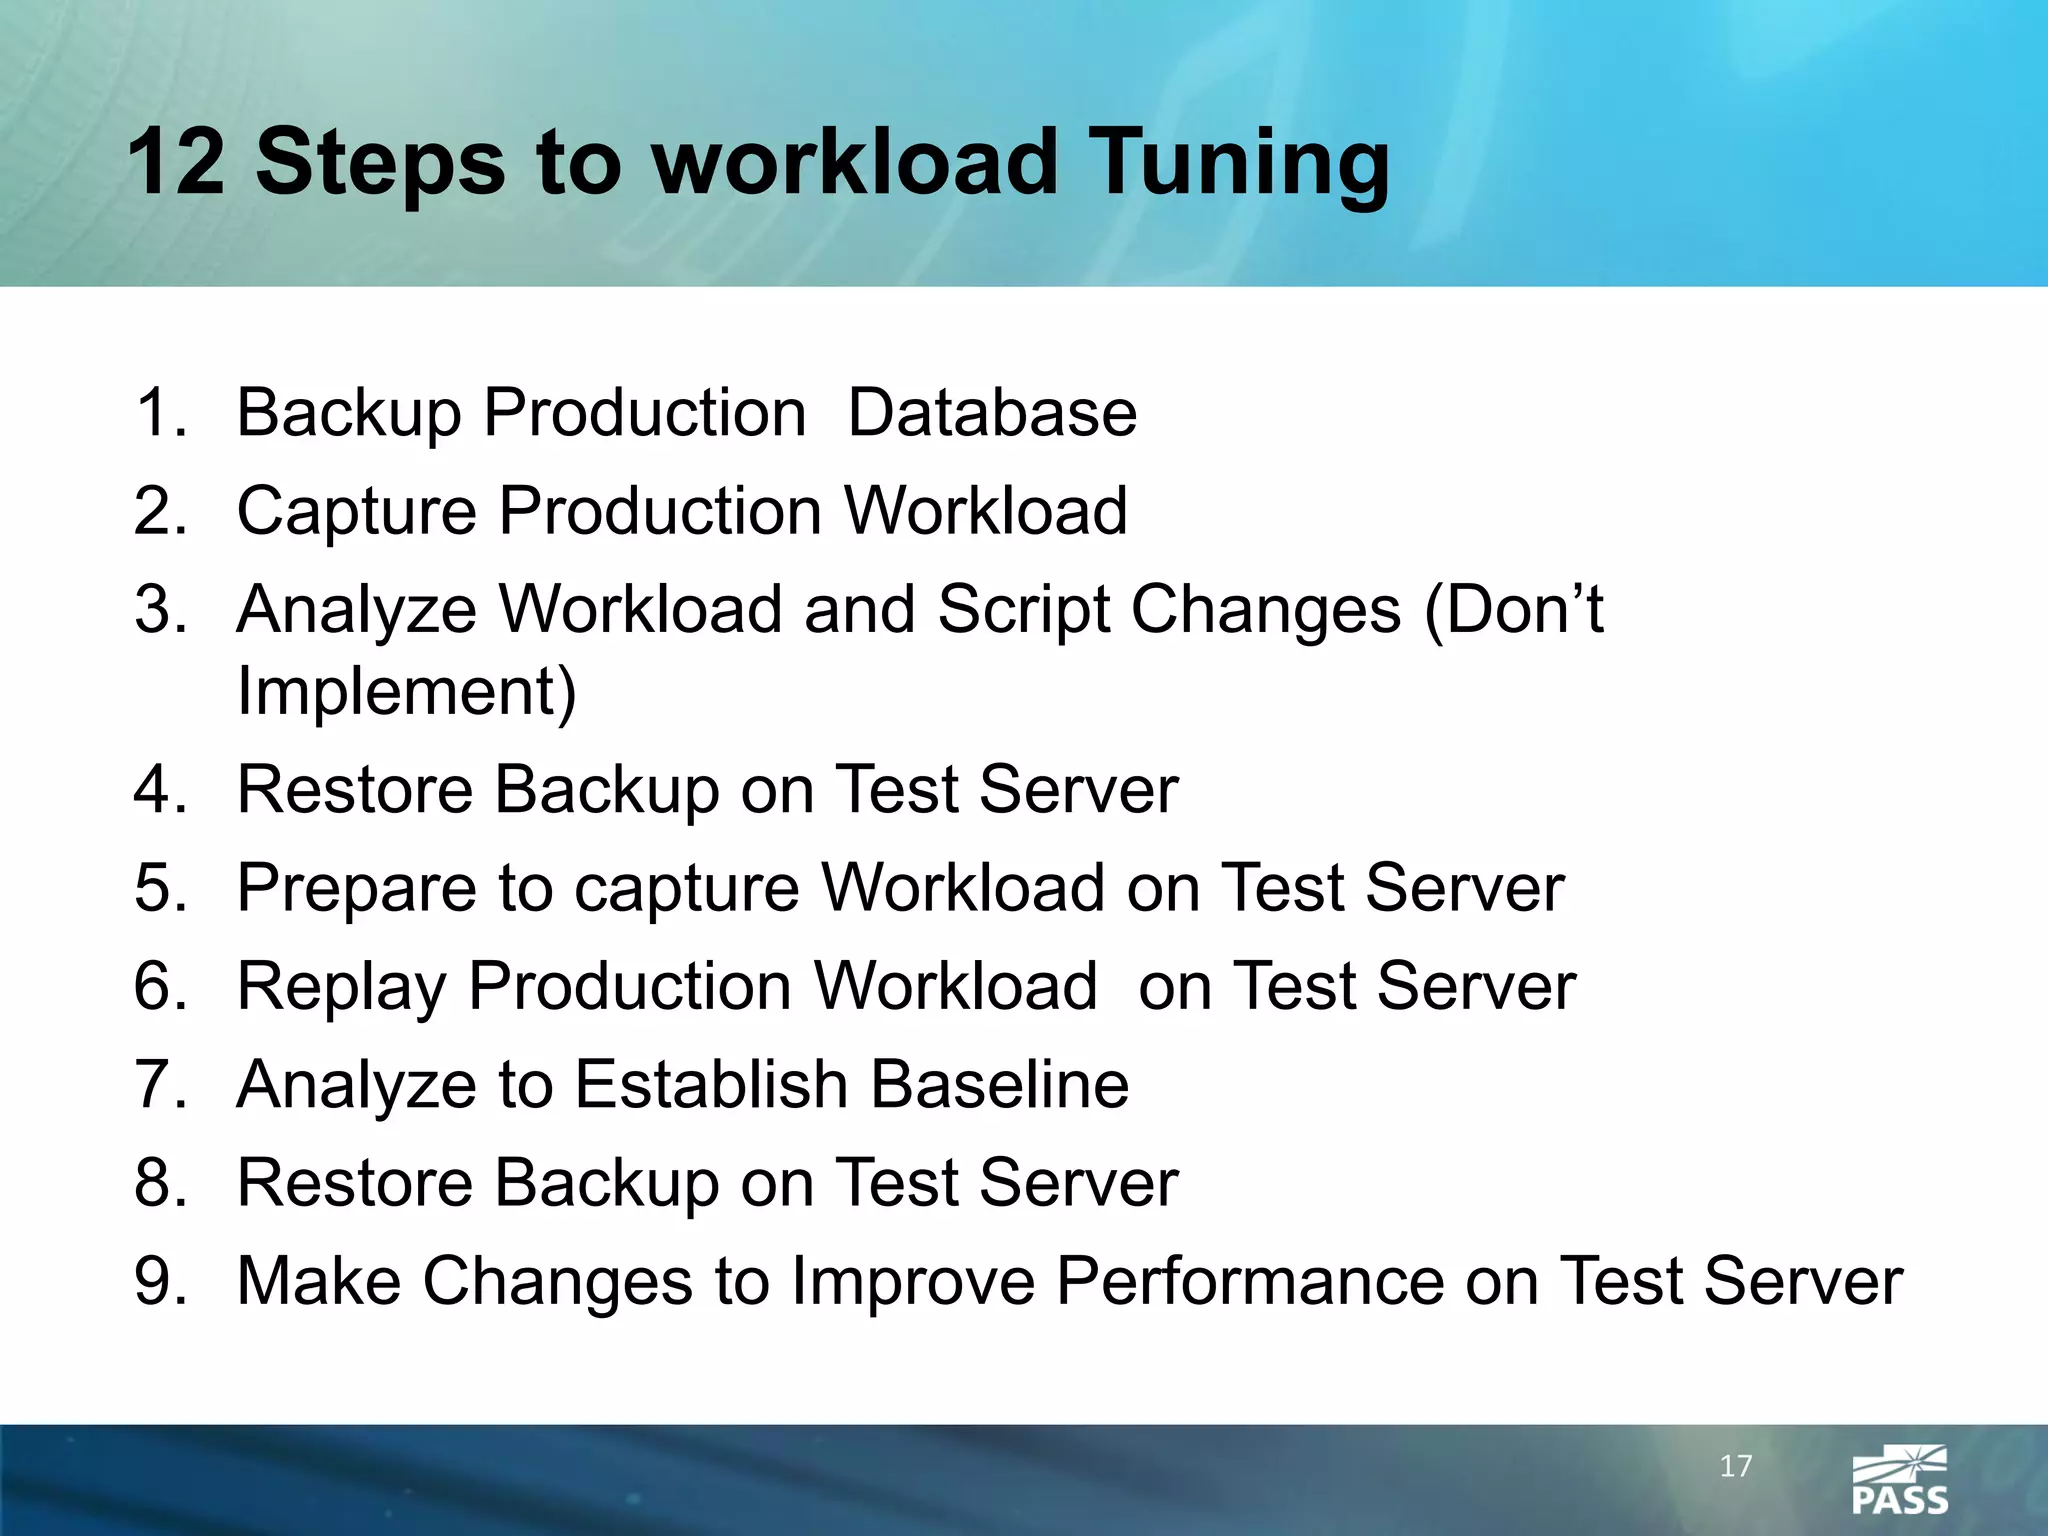
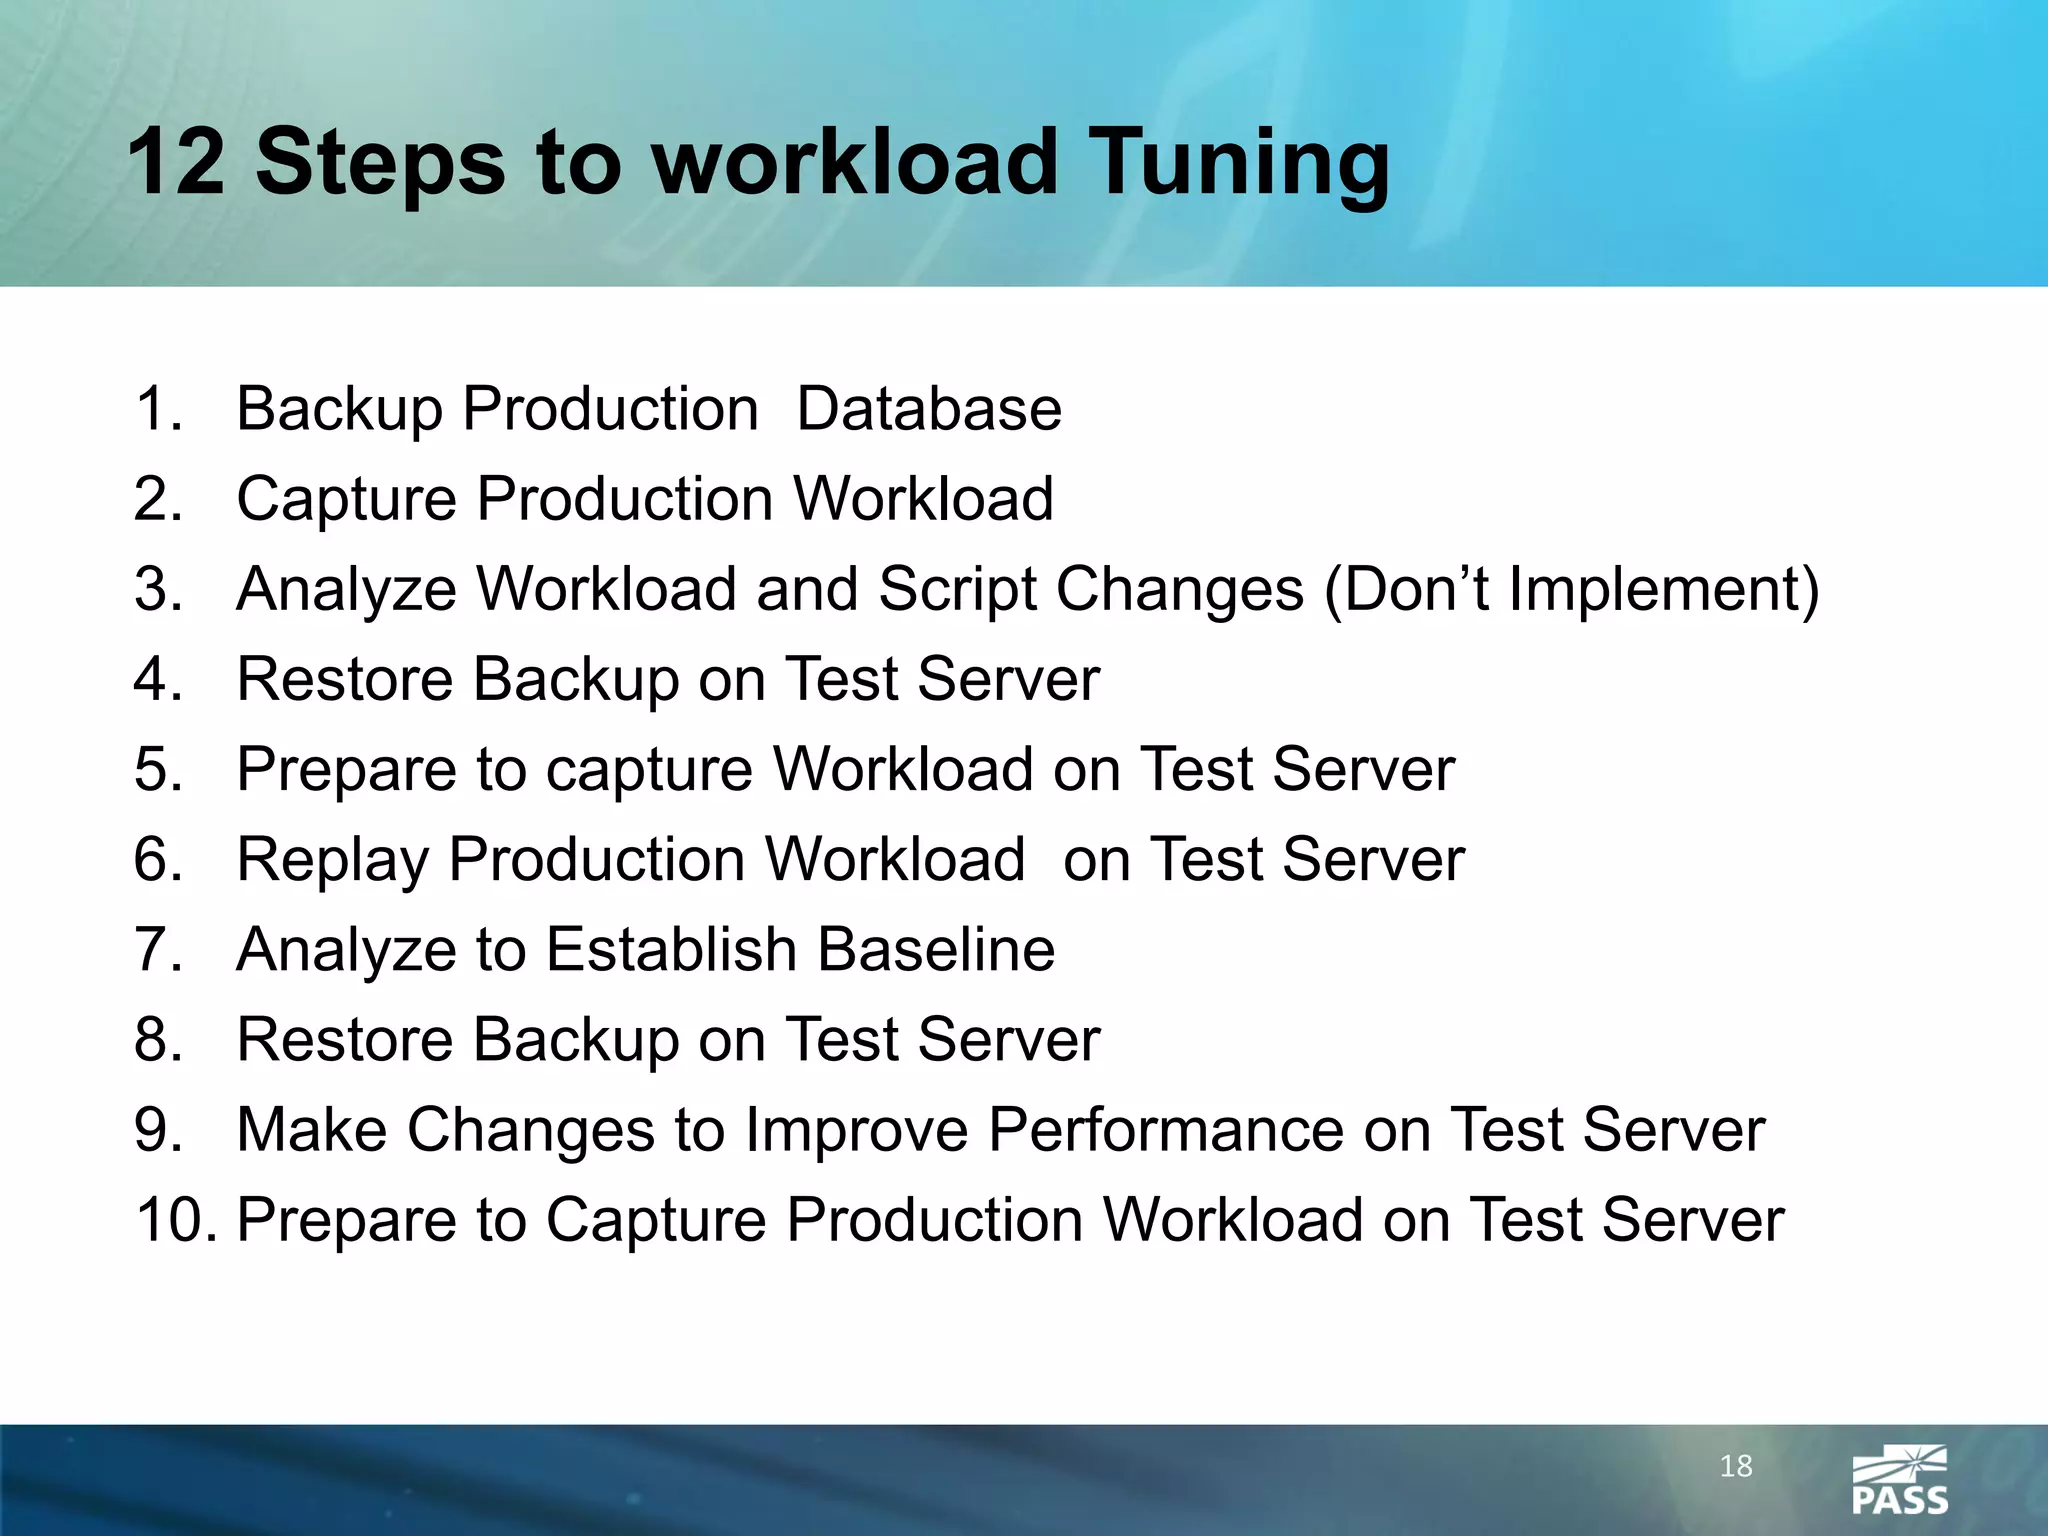
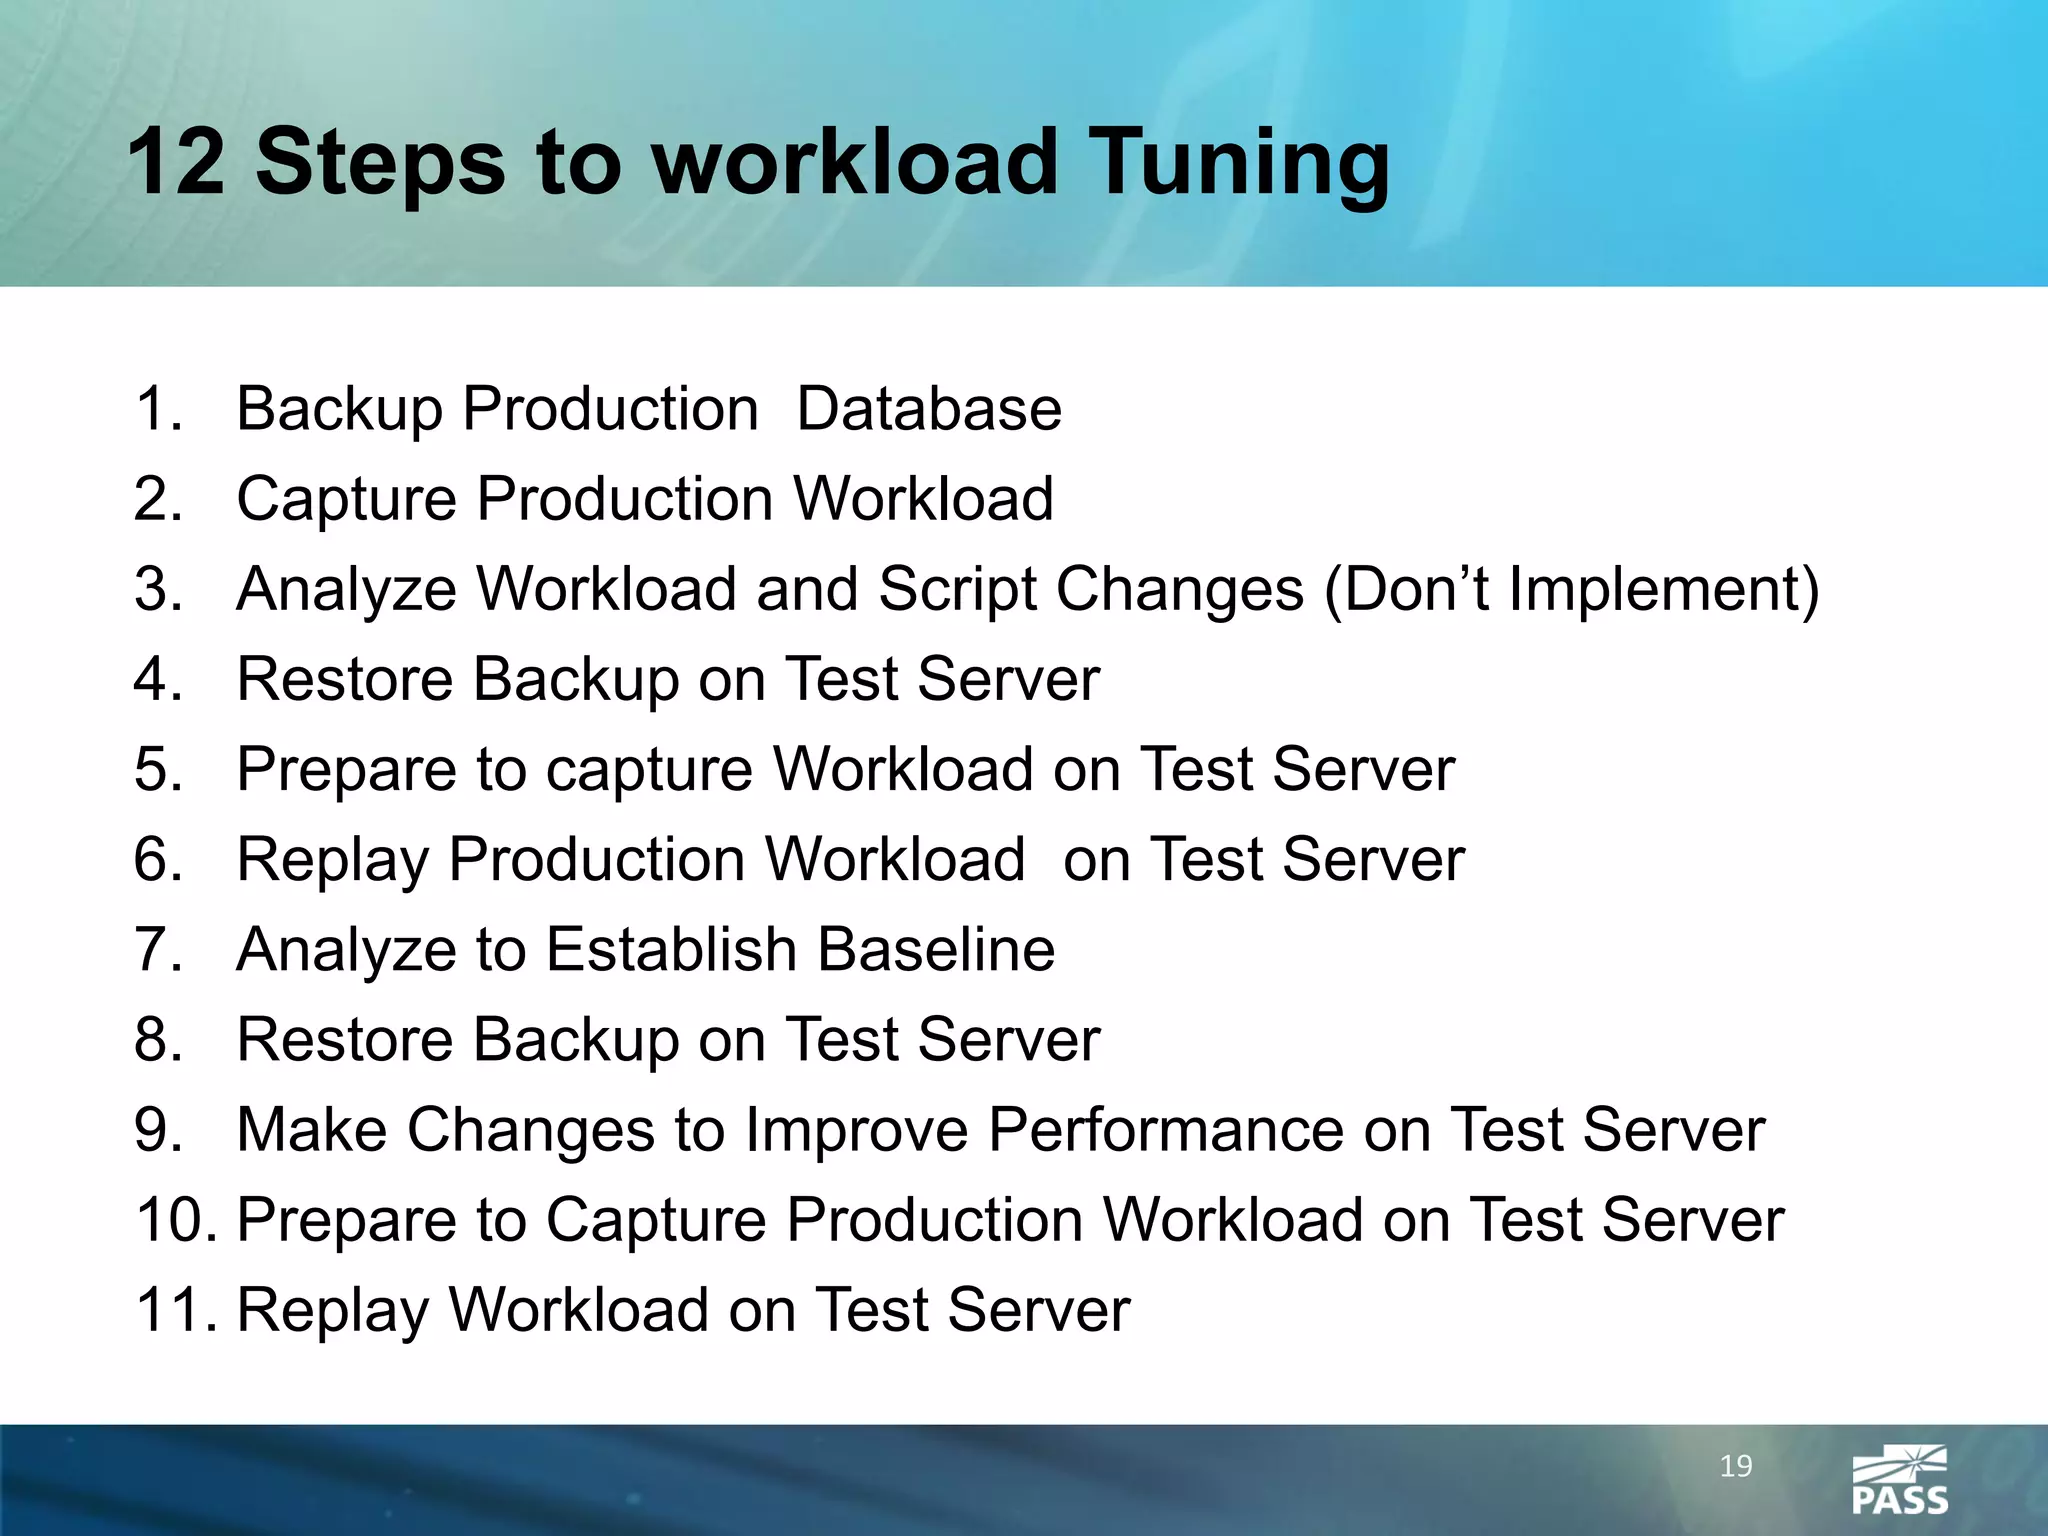
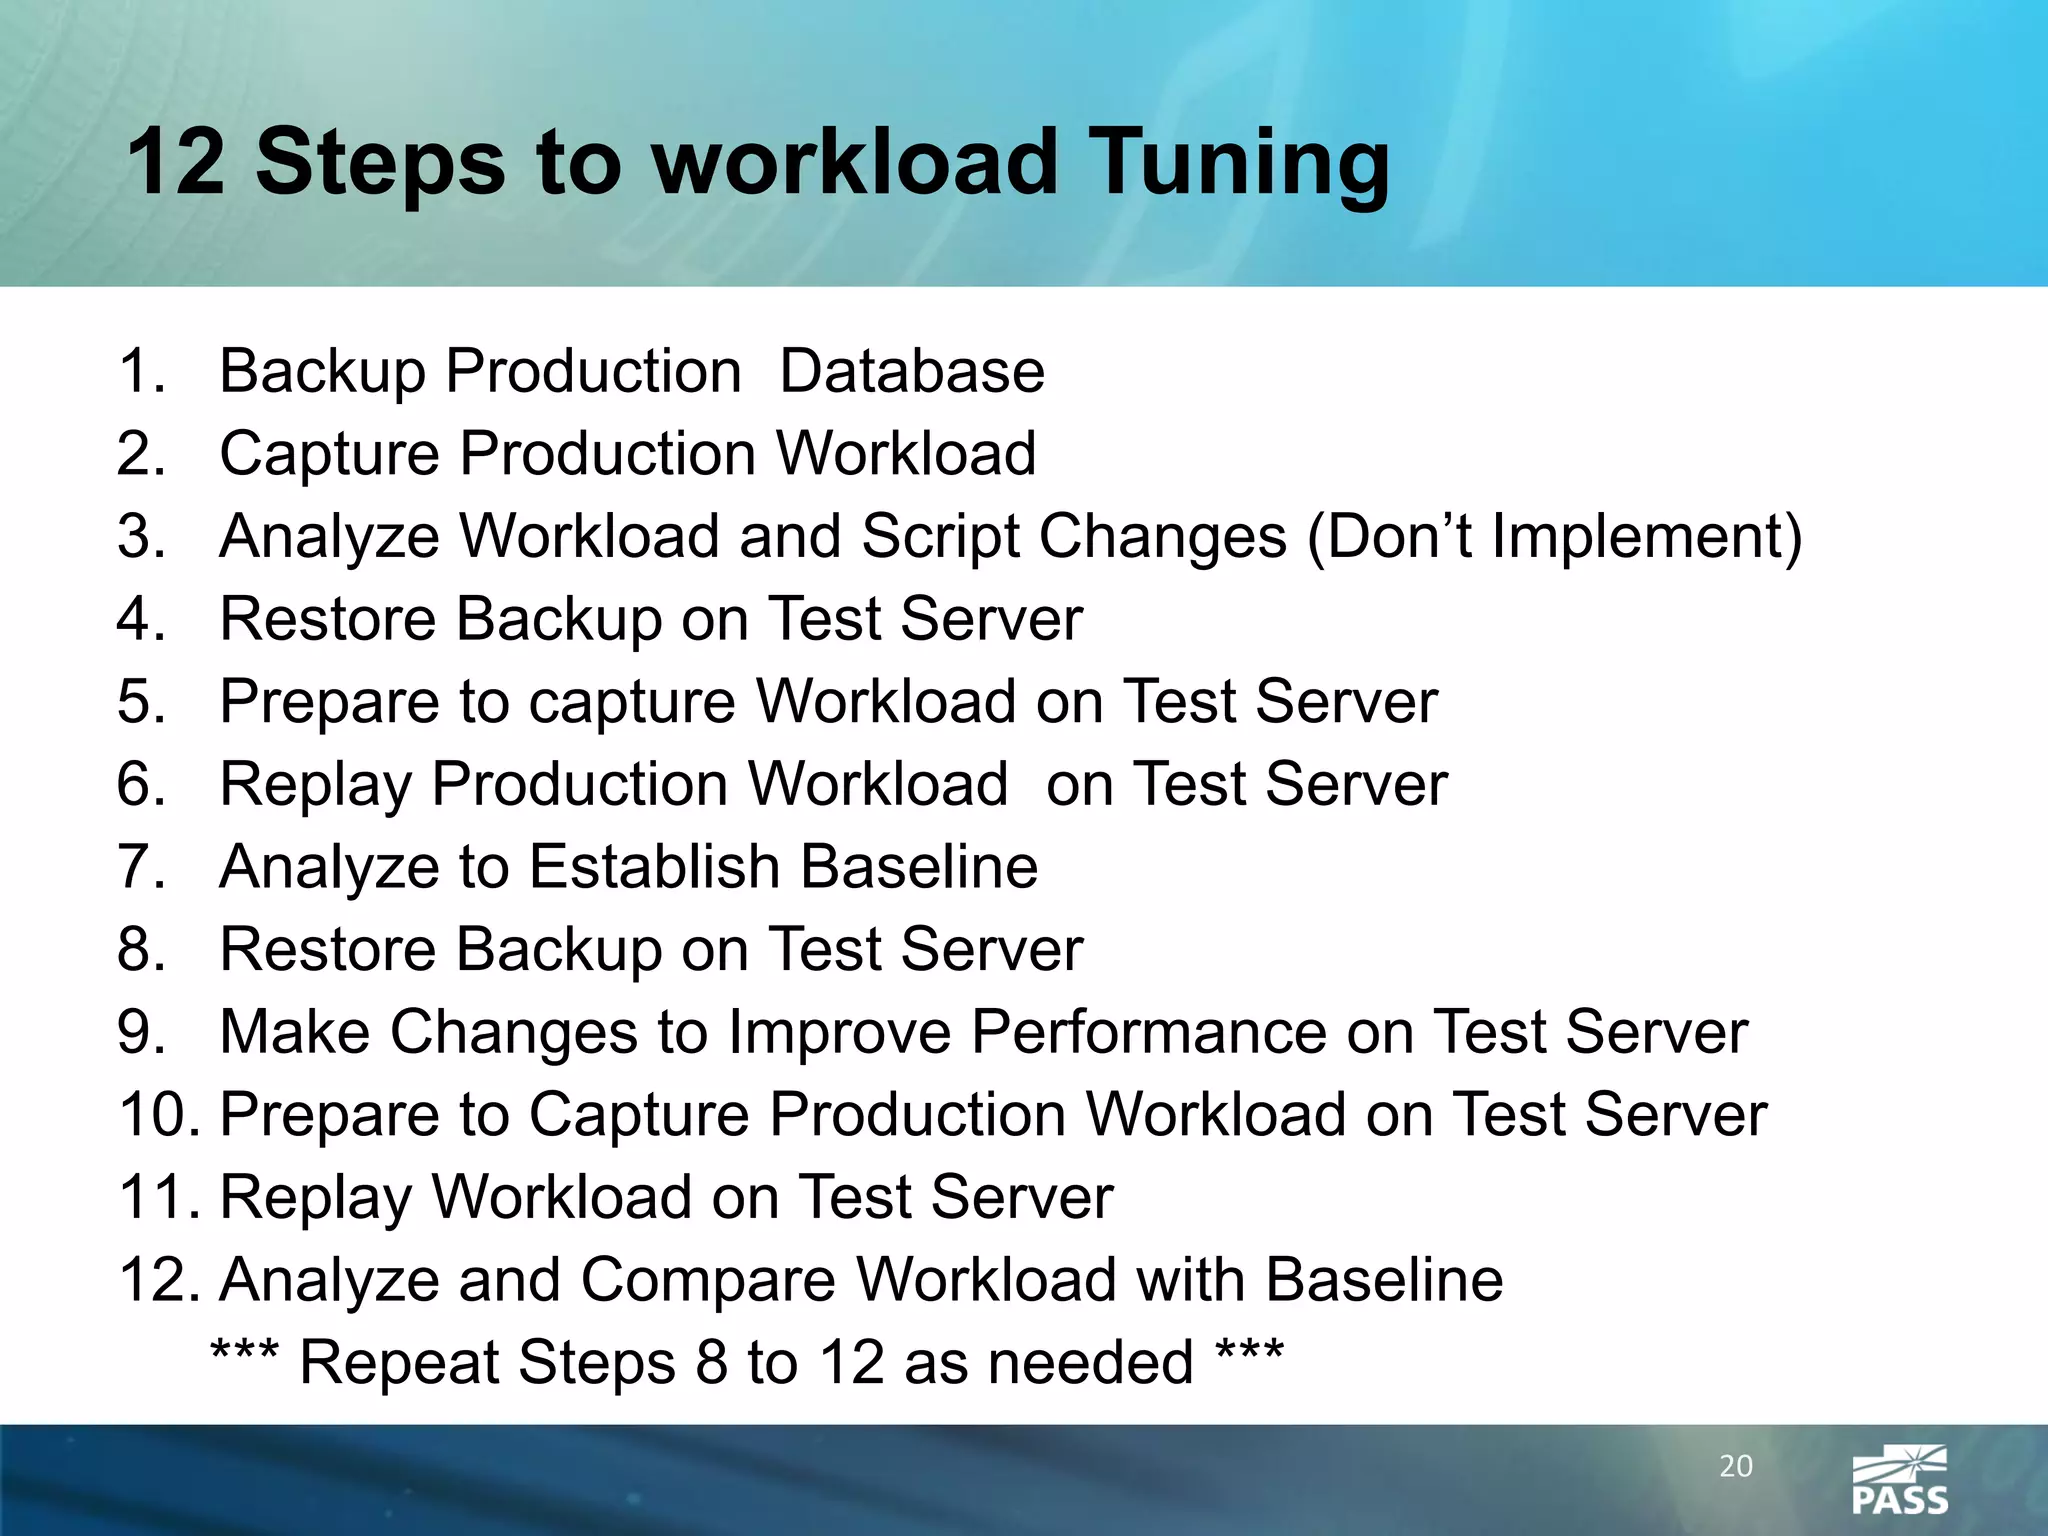
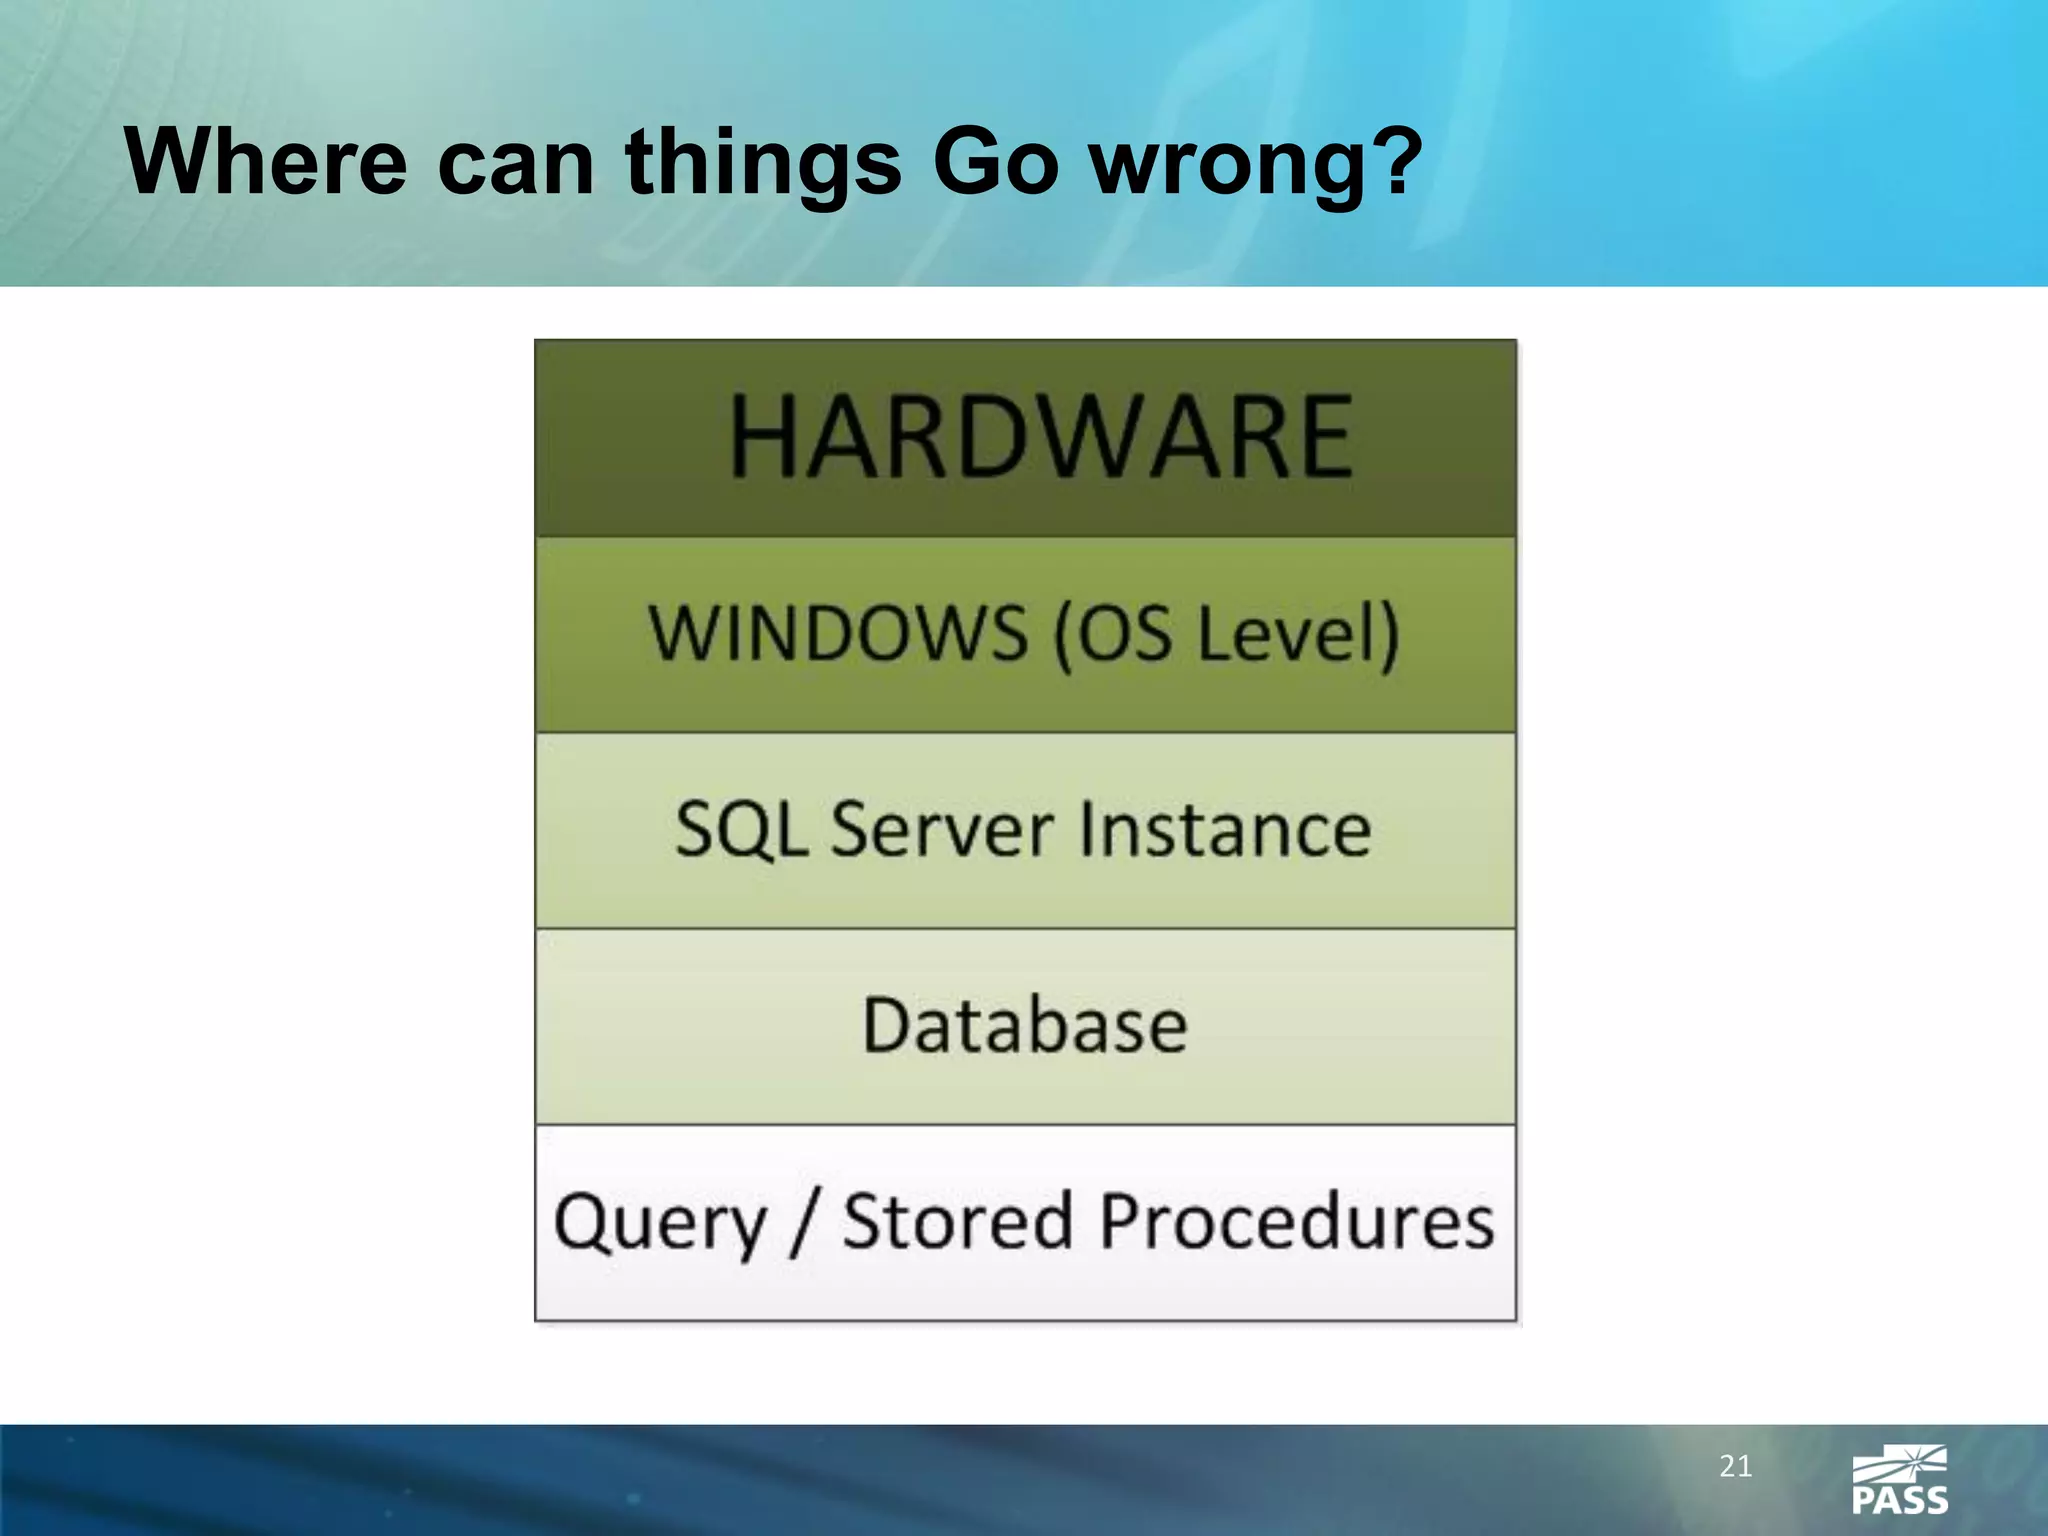
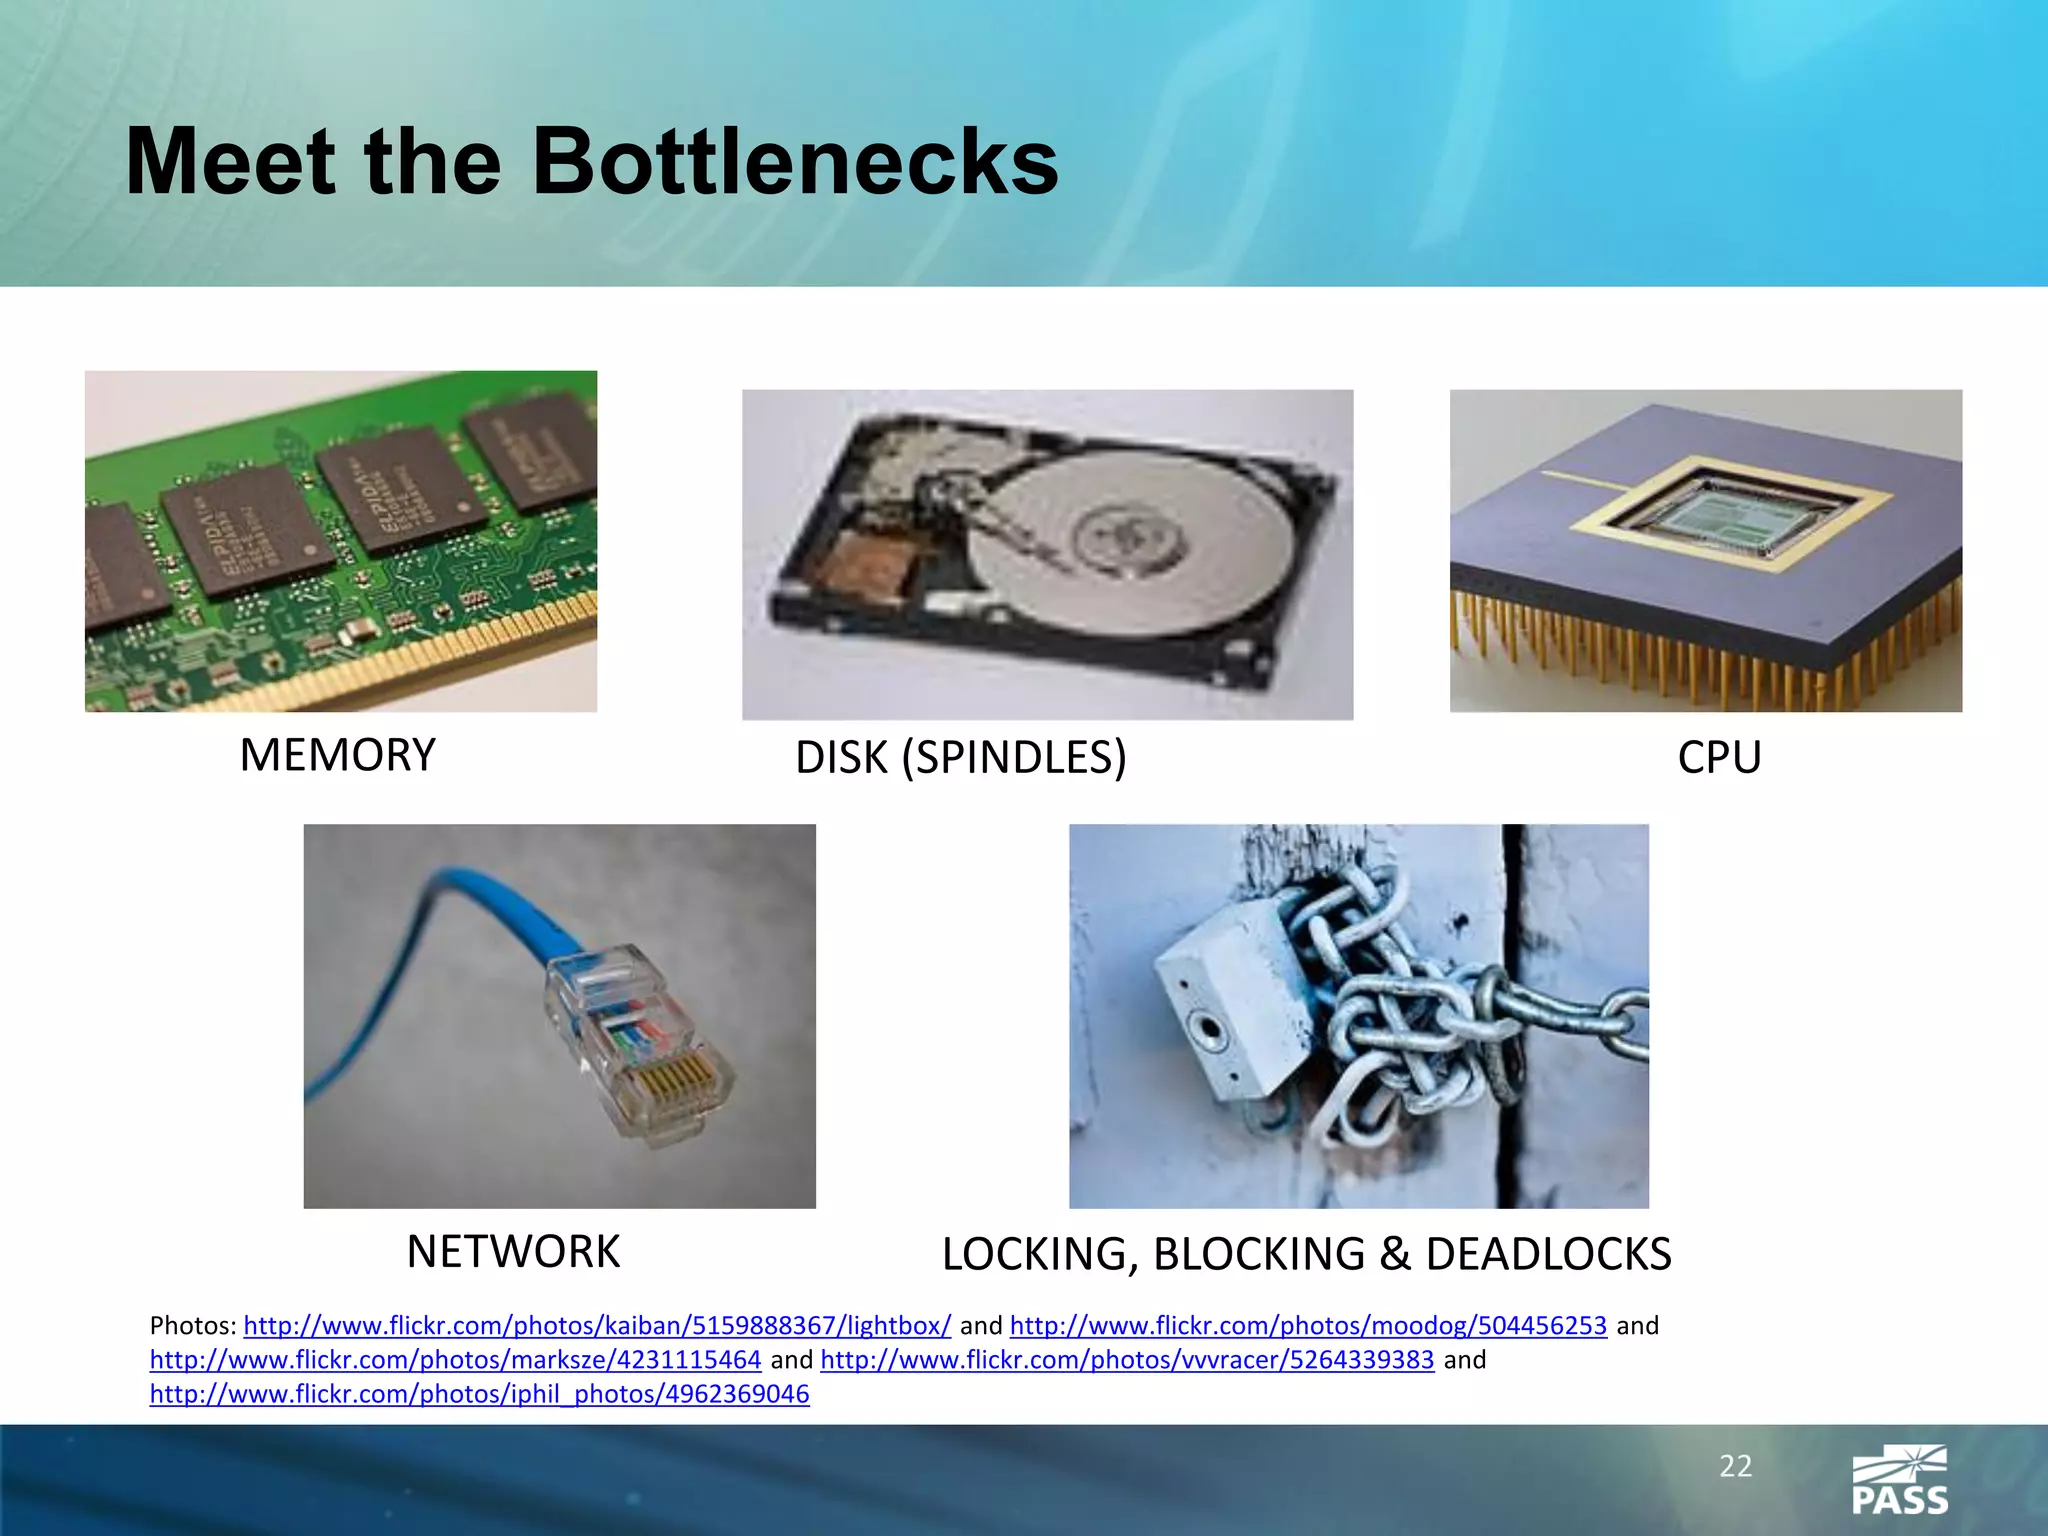
This document provides an overview of performance tuning for SQL Server databases. It discusses eliminating obvious issues, understanding common bottlenecks like CPU, memory, disk and locking, and using tools like wait statistics, performance counters and dynamic management views to analyze workload and identify tuning opportunities. The document outlines a 12 step process for capturing a production workload, replaying it on a test server, making tuning changes and reanalyzing. It also demonstrates various tools and techniques like SQL Profiler, SQL Diagnostic Manager and RML Utilities.
Ten query tuning techniques every SQL Server programmer should knowKevin Kline
From the noted database expert and author of 'SQL in a Nutshell' - SELECT statements have a reputation for being very easy to write, but hard to write very well. This session will take you through ten of the most problematic patterns and anti-patterns when writing queries and how to deal with them all. Loaded with live demonstrations and useful techniques, this session will teach you how to take your SQL Server queries mundane to masterful.
Once the ‘Backup Database’ command executed, SQL Server automatically does few ‘Checkpoint’ to reduce the recovery time and also it makes sure that at point of command execution there is no dirty pages in the buffer pool. After that SQL Server creates at least three workers as ‘Controller’, ‘Stream Reader’ and ‘Stream Writer’ to read and buffer the data asynchronously into the buffer area (Out of buffer pool) and write the buffers into the backup device.
Many People know FastTrack as a reference architecture for relational databases. The goal of this guideline is to provide a reference architecture for scalable and fast Analysis Services solutions.
SQL Server Query Tuning Tips - Get it Right the First TimeDean Richards
Whether you are a developer or DBA, this presentation will outline a method for determining the best approach for tuning a query every time by utilizing response time analysis and SQL Diagramming techniques. Regardless of the complexity of the statement or database platform being utilized (this method works on all), this quick and systematic approach will lead you down the correct
tuning path with no guessing. If you are a beginner or expert, this approach will save you countless hours tuning a query.
Free and useful tools have proliferated since the launch of the CodePlex and SourceForge websites. Join Kevin Kline, long-time author of the SQL Server Magazine column "Tool Time", as he profiles the very best of the free tools covered in his monthly column - dozens of free tools and utilities! Some of the cover tools help to:
- Track database growth
- Implement logging in SSIS job steps
- Stress test your database applications
- Automate important preventative maintenance tasks
- Automate maintenance tasks for Analysis Services
- Help protect against SQL Injection attacks
- Graphically manage Extended Events
- Utilize PowerShell scripts to ease administration
And much more. These tools are all free and independently supported by SQL Server enthusiasts around the world.
Sql server performance tuning and optimizationManish Rawat
Sql server performance tuning and optimization
SQL Server Concepts/Structure
Performance Measuring & Troubleshooting Tools
Locking
Performance Problem : CPU
Performance Problem : Memory
Performance Problem : I/O
Performance Problem : Blocking
Query Tuning
Indexing
This session is for you if you want to learn tips and techniques that are used to optimize database development with special emphasis on SQL Server 2005. If you write lot of stored procedures and want to learn the tools of a DBA, this is the session for you. If you are new to SQL Server development environment, you will learn how the various constructs compare to each other and better performance can be produced every time with a brief introduction to understanding Execution Plans.
SQL Server Tuning to Improve Database PerformanceMark Ginnebaugh
SQL Server tuning is a process to eliminate performance bottlenecks and improve application service. This presentation from Confio Software discusses SQL diagramming, wait type data, column selectivity, and other solutions that will help make tuning projects a success, including:
•SQL Tuning Methodology
•Response Time Tuning Practices
•How to use SQL Diagramming techniques to tune SQL statements
•How to read executions plans
In this presentation, we’ll explore the essential steps to get started and running SQL on Linux. Get up to speed quickly on identifying the software and hardware required plus the how-to on installation, configuration and administration for SQL on Linux.
Uwe Ricken at SQL in the City 2016.
Waits, as they’re known in the SQL Server world, indicate that a worker thread inside SQL Server is waiting for a resource to become available before it can proceed with executing. They’re often a major source of performance issues.
In this session, we’ll walk through an optimal performance troubleshooting process for a variety of scenarios, and illustrate both the strengths and weaknesses of using a waits-only approach to troubleshooting.
Database Configuration for Maximum SharePoint 2010 PerformanceEdwin M Sarmiento
Database configuration has a direct impact on how SharePoint 2010 performs. This presentation looks at the SQL Server database and what configuration changes can be made to maximize performance for your SharePoint 2010 farms
SQL Server High Availability Solutions (Pros & Cons)Hamid J. Fard
Proper SQL Server High Availability Solution Is Highly Depends on the Business Objective and IT Operation Objectives. It Happens Sometimes that We Might Have Few Solutions on the Table to Implement.
Agile Database Development with LiquibaseTim Berglund
Learn to apply well-understood agile development practices to the database, using the open-source Liquibase tool to refactor your database schema in a controlled, incremental fashion.
This session introduces tools that can help you analyze and troubleshoot performance with SharePoint 2013. This sessions presents tools like perfmon, Fiddler, Visual Round Trip Analyzer, IIS LogParser, Developer Dashboard and of course we create Web and Load Tests in Visual Studio 2013.
At the end we also take a look at some of the tips and best practices to improve performance on SharePoint 2013.
Investigate SQL Server Memory Like Sherlock HolmesRichard Douglas
Memory is one part of the holy trinity of resources consumed by SQL Server, the others being CPU and disk. Most people know how to look at disk latency and throughput and then take remedial measures to fix those issues. But what about memory issues?
In this session, you will learn how SQL Server uses memory and various caches, how to gauge memory pressure, and how to address the significant problems it can cause.
You will leave with a much clearer understanding of how to monitor and manage memory consumption within SQL Server using native Dynamic Management Objects.
Ajuste (tuning) del rendimiento de SQL Server 2008Eduardo Castro
En el siguiente webcast http://msevents.microsoft.com/CUI/EventDetail.aspx?EventID=1032438450&Culture=es-AR analizamos las herramientas de desempeño de SQL Server 2008 y cómo utilizarlas.
Saludos,
Ing. Eduardo Castro Martínez, PhD – Microsoft SQL Server MVP
http://mswindowscr.org
http://comunidadwindows.org
Costa Rica
Technorati Tags: SQL Server
LiveJournal Tags: SQL Server
del.icio.us Tags: SQL Server
http://ecastrom.blogspot.com
http://ecastrom.wordpress.com
http://ecastrom.spaces.live.com
http://universosql.blogspot.com
http://todosobresql.blogspot.com
http://todosobresqlserver.wordpress.com
http://mswindowscr.org/blogs/sql/default.aspx
http://citicr.org/blogs/noticias/default.aspx
http://sqlserverpedia.blogspot.com/
Les comparto la presentación utilizada en la charla sobre optimización de desempeño de SQL Server.
Saludos,
Eduardo Castro Martinez
http://ecastrom.blogspot.com
http://comunidadwindows.org
DBA Basics: Getting Started with Performance Tuning.pdfJohn Sterrett
Have you ever found yourself in need of making queries go faster but didn't know where to begin? In this session, you will learn multiple ways to find your top offending statements. You will learn three key tips to help you understand execution plans. Finally, you will learn a framework to help you create indexes to help performance.
Workload Replay in the Cloud: Secret Weapon for Cloud MigrationsJohn Sterrett
Want to save money, validate performance, and make sure you don't have errors while migrating to the cloud? Video can be watched @ https://procuresql.com/blog/2020/09/11/replay-in-the-cloud/
Introduction to High Availability with SQL ServerJohn Sterrett
Have you ever wondered how companies keep their databases online through unplanned disasters? Have you wondered which high availability features might be best for our shop? In this session we will go over a quick look at log shipping, database mirroring, transactional replication, failover cluster instances and availability groups. John will identify pros and cons for each features and share some tips from the field.
Evaluate Daily Checklist with PBM and CMSJohn Sterrett
This presentation gives an introduction to evaluating a daily checklist against 100+ instances of SQL Server while you get a cup of coffee. It will be given at SQLRally 2011
GraphRAG is All You need? LLM & Knowledge GraphGuy Korland
Guy Korland, CEO and Co-founder of FalkorDB, will review two articles on the integration of language models with knowledge graphs.
1. Unifying Large Language Models and Knowledge Graphs: A Roadmap.
https://arxiv.org/abs/2306.08302
2. Microsoft Research's GraphRAG paper and a review paper on various uses of knowledge graphs:
https://www.microsoft.com/en-us/research/blog/graphrag-unlocking-llm-discovery-on-narrative-private-data/
Observability Concepts EVERY Developer Should Know -- DeveloperWeek Europe.pdfPaige Cruz
Monitoring and observability aren’t traditionally found in software curriculums and many of us cobble this knowledge together from whatever vendor or ecosystem we were first introduced to and whatever is a part of your current company’s observability stack.
While the dev and ops silo continues to crumble….many organizations still relegate monitoring & observability as the purview of ops, infra and SRE teams. This is a mistake - achieving a highly observable system requires collaboration up and down the stack.
I, a former op, would like to extend an invitation to all application developers to join the observability party will share these foundational concepts to build on:
UiPath Test Automation using UiPath Test Suite series, part 3DianaGray10
Welcome to UiPath Test Automation using UiPath Test Suite series part 3. In this session, we will cover desktop automation along with UI automation.
Topics covered:
UI automation Introduction,
UI automation Sample
Desktop automation flow
Pradeep Chinnala, Senior Consultant Automation Developer @WonderBotz and UiPath MVP
Deepak Rai, Automation Practice Lead, Boundaryless Group and UiPath MVP
Essentials of Automations: Optimizing FME Workflows with ParametersSafe Software
Are you looking to streamline your workflows and boost your projects’ efficiency? Do you find yourself searching for ways to add flexibility and control over your FME workflows? If so, you’re in the right place.
Join us for an insightful dive into the world of FME parameters, a critical element in optimizing workflow efficiency. This webinar marks the beginning of our three-part “Essentials of Automation” series. This first webinar is designed to equip you with the knowledge and skills to utilize parameters effectively: enhancing the flexibility, maintainability, and user control of your FME projects.
Here’s what you’ll gain:
- Essentials of FME Parameters: Understand the pivotal role of parameters, including Reader/Writer, Transformer, User, and FME Flow categories. Discover how they are the key to unlocking automation and optimization within your workflows.
- Practical Applications in FME Form: Delve into key user parameter types including choice, connections, and file URLs. Allow users to control how a workflow runs, making your workflows more reusable. Learn to import values and deliver the best user experience for your workflows while enhancing accuracy.
- Optimization Strategies in FME Flow: Explore the creation and strategic deployment of parameters in FME Flow, including the use of deployment and geometry parameters, to maximize workflow efficiency.
- Pro Tips for Success: Gain insights on parameterizing connections and leveraging new features like Conditional Visibility for clarity and simplicity.
We’ll wrap up with a glimpse into future webinars, followed by a Q&A session to address your specific questions surrounding this topic.
Don’t miss this opportunity to elevate your FME expertise and drive your projects to new heights of efficiency.
GDG Cloud Southlake #33: Boule & Rebala: Effective AppSec in SDLC using Deplo...James Anderson
Effective Application Security in Software Delivery lifecycle using Deployment Firewall and DBOM
The modern software delivery process (or the CI/CD process) includes many tools, distributed teams, open-source code, and cloud platforms. Constant focus on speed to release software to market, along with the traditional slow and manual security checks has caused gaps in continuous security as an important piece in the software supply chain. Today organizations feel more susceptible to external and internal cyber threats due to the vast attack surface in their applications supply chain and the lack of end-to-end governance and risk management.
The software team must secure its software delivery process to avoid vulnerability and security breaches. This needs to be achieved with existing tool chains and without extensive rework of the delivery processes. This talk will present strategies and techniques for providing visibility into the true risk of the existing vulnerabilities, preventing the introduction of security issues in the software, resolving vulnerabilities in production environments quickly, and capturing the deployment bill of materials (DBOM).
Speakers:
Bob Boule
Robert Boule is a technology enthusiast with PASSION for technology and making things work along with a knack for helping others understand how things work. He comes with around 20 years of solution engineering experience in application security, software continuous delivery, and SaaS platforms. He is known for his dynamic presentations in CI/CD and application security integrated in software delivery lifecycle.
Gopinath Rebala
Gopinath Rebala is the CTO of OpsMx, where he has overall responsibility for the machine learning and data processing architectures for Secure Software Delivery. Gopi also has a strong connection with our customers, leading design and architecture for strategic implementations. Gopi is a frequent speaker and well-known leader in continuous delivery and integrating security into software delivery.
Smart TV Buyer Insights Survey 2024 by 91mobiles.pdf91mobiles
91mobiles recently conducted a Smart TV Buyer Insights Survey in which we asked over 3,000 respondents about the TV they own, aspects they look at on a new TV, and their TV buying preferences.
State of ICS and IoT Cyber Threat Landscape Report 2024 previewPrayukth K V
The IoT and OT threat landscape report has been prepared by the Threat Research Team at Sectrio using data from Sectrio, cyber threat intelligence farming facilities spread across over 85 cities around the world. In addition, Sectrio also runs AI-based advanced threat and payload engagement facilities that serve as sinks to attract and engage sophisticated threat actors, and newer malware including new variants and latent threats that are at an earlier stage of development.
The latest edition of the OT/ICS and IoT security Threat Landscape Report 2024 also covers:
State of global ICS asset and network exposure
Sectoral targets and attacks as well as the cost of ransom
Global APT activity, AI usage, actor and tactic profiles, and implications
Rise in volumes of AI-powered cyberattacks
Major cyber events in 2024
Malware and malicious payload trends
Cyberattack types and targets
Vulnerability exploit attempts on CVEs
Attacks on counties – USA
Expansion of bot farms – how, where, and why
In-depth analysis of the cyber threat landscape across North America, South America, Europe, APAC, and the Middle East
Why are attacks on smart factories rising?
Cyber risk predictions
Axis of attacks – Europe
Systemic attacks in the Middle East
Download the full report from here:
https://sectrio.com/resources/ot-threat-landscape-reports/sectrio-releases-ot-ics-and-iot-security-threat-landscape-report-2024/
Transcript: Selling digital books in 2024: Insights from industry leaders - T...BookNet Canada
The publishing industry has been selling digital audiobooks and ebooks for over a decade and has found its groove. What’s changed? What has stayed the same? Where do we go from here? Join a group of leading sales peers from across the industry for a conversation about the lessons learned since the popularization of digital books, best practices, digital book supply chain management, and more.
Link to video recording: https://bnctechforum.ca/sessions/selling-digital-books-in-2024-insights-from-industry-leaders/
Presented by BookNet Canada on May 28, 2024, with support from the Department of Canadian Heritage.
Generative AI Deep Dive: Advancing from Proof of Concept to ProductionAggregage
Join Maher Hanafi, VP of Engineering at Betterworks, in this new session where he'll share a practical framework to transform Gen AI prototypes into impactful products! He'll delve into the complexities of data collection and management, model selection and optimization, and ensuring security, scalability, and responsible use.
Securing your Kubernetes cluster_ a step-by-step guide to success !KatiaHIMEUR1
Today, after several years of existence, an extremely active community and an ultra-dynamic ecosystem, Kubernetes has established itself as the de facto standard in container orchestration. Thanks to a wide range of managed services, it has never been so easy to set up a ready-to-use Kubernetes cluster.
However, this ease of use means that the subject of security in Kubernetes is often left for later, or even neglected. This exposes companies to significant risks.
In this talk, I'll show you step-by-step how to secure your Kubernetes cluster for greater peace of mind and reliability.
2. ABOUT John…
I am a Remote DBA Expert
• Responsible 100+ Instances of SQL Server
• Senior DBA on Integration Team
Mid-Atlantic Region Mentor
Founder of WVPASS (SQL UG)
Host of SQL Saturday #36 and #80
I reside in Wheeling, WV (Pittsburgh, PA)
2
3. Pirates and Yankees
Photos: http://www.flickr.com/photos/jaubele1/4299542394/ and http://www.flickr.com/photos/wenzday01/2537854102
3
4. Objectives
• Eliminate the Obvious
• Know the process
• Know the common bottlenecks
• Know your Tools
– Wait Stats
– Performance Monitor & PAL (WMI Counters)
– DMV’s and scripts
– SQL Server Side Trace (SQL Profiler)
– Clear Trace
– SQL Diag
– SQL Nexus
– RML Utilities
• ReadTrace
• Ostress
• Know where to go for help...
4
9. 12 Steps to workload Tuning
1. Backup Production Database
9
10. 12 Steps to workload Tuning
1. Backup Production Database
2. Capture Production Workload
10
11. 12 Steps to workload Tuning
1. Backup Production Database
2. Capture Production Workload
3. Analyze Workload and Script Changes (Don’t
Implement)
*** Done with Production ***
11
12. 12 Steps to workload Tuning
1. Backup Production Database
2. Capture Production Workload
3. Analyze Workload and Script Changes (Don’t
Implement)
4. Restore Backup on Test Server
12
13. 12 Steps to workload Tuning
1. Backup Production Database
2. Capture Production Workload
3. Analyze Workload and Script Changes (Don’t
Implement)
4. Restore Backup on Test Server
5. Prepare to capture Workload on Test Server
13
14. 12 Steps to workload Tuning
1. Backup Production Database
2. Capture Production Workload
3. Analyze Workload and Script Changes (Don’t
Implement)
4. Restore Backup on Test Server
5. Prepare to capture Workload on Test Server
6. Replay Production Workload on Test Server
14
15. 12 Steps to workload Tuning
1. Backup Production Database
2. Capture Production Workload
3. Analyze Workload and Script Changes (Don’t
Implement)
4. Restore Backup on Test Server
5. Prepare to capture Workload on Test Server
6. Replay Production Workload on Test Server
7. Analyze to Establish Baseline
15
16. 12 Steps to workload Tuning
1. Backup Production Database
2. Capture Production Workload
3. Analyze Workload and Script Changes (Don’t
Implement)
4. Restore Backup on Test Server
5. Prepare to capture Workload on Test Server
6. Replay Production Workload on Test Server
7. Analyze to Establish Baseline
8. Restore Backup on Test Server
16
17. 12 Steps to workload Tuning
1. Backup Production Database
2. Capture Production Workload
3. Analyze Workload and Script Changes (Don’t
Implement)
4. Restore Backup on Test Server
5. Prepare to capture Workload on Test Server
6. Replay Production Workload on Test Server
7. Analyze to Establish Baseline
8. Restore Backup on Test Server
9. Make Changes to Improve Performance on Test Server
17
18. 12 Steps to workload Tuning
1. Backup Production Database
2. Capture Production Workload
3. Analyze Workload and Script Changes (Don’t Implement)
4. Restore Backup on Test Server
5. Prepare to capture Workload on Test Server
6. Replay Production Workload on Test Server
7. Analyze to Establish Baseline
8. Restore Backup on Test Server
9. Make Changes to Improve Performance on Test Server
10. Prepare to Capture Production Workload on Test Server
18
19. 12 Steps to workload Tuning
1. Backup Production Database
2. Capture Production Workload
3. Analyze Workload and Script Changes (Don’t Implement)
4. Restore Backup on Test Server
5. Prepare to capture Workload on Test Server
6. Replay Production Workload on Test Server
7. Analyze to Establish Baseline
8. Restore Backup on Test Server
9. Make Changes to Improve Performance on Test Server
10. Prepare to Capture Production Workload on Test Server
11. Replay Workload on Test Server
19
20. 12 Steps to workload Tuning
1. Backup Production Database
2. Capture Production Workload
3. Analyze Workload and Script Changes (Don’t Implement)
4. Restore Backup on Test Server
5. Prepare to capture Workload on Test Server
6. Replay Production Workload on Test Server
7. Analyze to Establish Baseline
8. Restore Backup on Test Server
9. Make Changes to Improve Performance on Test Server
10. Prepare to Capture Production Workload on Test Server
11. Replay Workload on Test Server
12. Analyze and Compare Workload with Baseline
*** Repeat Steps 8 to 12 as needed ***
20
22. Meet the Bottlenecks
MEMORY DISK (SPINDLES) CPU
NETWORK LOCKING, BLOCKING & DEADLOCKS
Photos: http://www.flickr.com/photos/kaiban/5159888367/lightbox/ and http://www.flickr.com/photos/moodog/504456253 and
http://www.flickr.com/photos/marksze/4231115464 and http://www.flickr.com/photos/vvvracer/5264339383 and
http://www.flickr.com/photos/iphil_photos/4962369046
22
27. Viewing Wait Stats
• Sys.dm_os_wait_stats
• Wait stats can be cleared manually or during restart.
– DBCC SQLPERF(‘sys.dm_os_wait_stats’, CLEAR)
• Focus on waits dedicated to bottlenecks
27
30. Memory Performance counters
You Want Description
Object Counter
> 256 MB Unused physical memory
Memory Available Mbytes
< 10 Reads from hard disk per second to memory
Memory Pages Input/sec
> 300 On average, how many seconds SQL Server expects page to say in cache
(memory)
SQL Server: Buffer Manager Page Life Expectancy
Shows amount of memory SQL Server is currently using.
SQL Server: Memory Manager Total Server Memory (KB)
Amount of memory that SQL Server wants to use based on configured max
Server Memory setting
SQL Server: Memory Manager Target Server Memory (KB)
0 Total number of processess pers second waiting for workspace memory grants
SQL Server: Memory Manager Memory Grants Pending
> 640 Total number of pages avaiable across all free lists. A value under 640
SQL Server: Buffer Manager Free Pages
< 20 Number of times per second that the lazywritter process moves dirty page from
buffer to disk.
SQL Server: Buffer Manager LazyWrites/Sec
30
31. Disk Performance Counters
• The sys.dm_io_virtual_file_stats DMV can be used to get disk latency for
individual sql server files.
Object Counter You Want Description
Avg. Disk sec/Read is the average time, in seconds, of a read of data from the disk.This
analysis determines if any of the physical disks are responding slowly.
Physical Disk Avg Disk Sec/Read < 25ms
Avg. Disk sec/Write is the average time, in seconds, of a write of data to the disk.
Physical Disk Avg Disk Sec/Write < 25ms
Disk Reads/sec is the rate of read operations on the disk.
Physical Disk Disk Reads/sec
Disk Writes/sec is the rate of write operations on the disk.
Physical Disk Disk Writes/sec
31
32. CPU Performance Counters
Object Counter You Want Description
< 80% Percentage of processor time spent on SQL Server process threads.
Process (sqlservr) %Processor Time
< 80% Percentage of elapsed time the processor spends executing non-idle threads.
Processor %Processor Time
32
33. General Workload performance
counters
Object Counter You Want Description
Number of SQL batch requests received by server. This counter
measures the number of batch requests that SQL Server receives per
Batch Requests/Sec second, and generally follows in step to how busy your server's CPUs
SQL Server: SQL Statistics (SQL2005/08) are.
< 10% of the number of Number of SQL compilations.
SQL Server: SQL Statistics SQL Compilations/sec batch request/sec
< 10% of the number of Number of SQL re-compiles. This needs to be 0 as much as possible. A
compilations/sec recompile can cause deadlocks and compile locks that are not
SQL Server: SQL Statistics SQL Re-Compilations/sec compatible with any locking type.
SQL Server: SQL Statistics User Connections
1 Full scan for every 1000 This counter monitors the number of full scans on base tables or
index searches indexes. High values indicate that we may be having performance
SQL Server: Access Methods Full Scans/sec issues due to table / index page scans.
This counter measures the number of index searches per second. Index
searches are used to start range scans, single index record fetches, and
to reposition within an index. Index searches are preferable to index
SQL Server: Access Methods Index Searches/sec and table scans.
Number of page splits per second that occur as a result of overflowing
index pages. Reduce non-sequential inserts or use fill factor and
SQL Server: Access Methods Page Splits/sec pad_index to leave more empty space per page.
33
34. Locking Performance Counters
Object Counter You Want Description
Number of lock requests per second
SQL Server: Locks Number of Deadlocks/sec <1 that resulted in deadlock.
Number of times SQL escalated
locks to table level. This can indicate
SQL Server: Locks Table Lock Escalations/sec poorly coded transactions.
The average wait time for each lock
SQL Server: Locks Avg Wait Time (ms) < 500 request that had to wait.
Number of currently blocked
SQL Server: General Statistics Processes blocked processes.
34
35. DEMO!!!
• Review Perfmon
• Review PAL Tool
– Collection Process
– Generating Reports
– Reviewing Reports
35
36. Execution DMV’s
• Sys.dm_exec_session
– Returns one row per authenticated session, including user and
system processes.
• Sys.dm_exec_requests
– Returns one row for each request executing within SQL Server,
doesn’t include code executed outside of SQL (distributed queries,
extended stored procedures etc…)
• Sys.dm_exec_query_stats
– Returns one row per query statement with cached plan, detailing
aggregated performance stats for cached plans.
• Sys.dm_exec_connections
– Returns server information about a connection to SQL Server
including client network address, TCP Port etc..
36
37. Query details DMV’S
• Sys.dm_exec_sql_text
– Returns the text of the SQL Server batch that is identified by
specific sql handle.
• Sys.dm_exec_text_query_plan
– Returns the showplan output in text format.
• Sys.dm_query_plan
– Returns a given query’s showplan output in xml.
37
38. INDEX DMV’s
• Sys.dm_db_index_usage_stats
– Returns a count of index operations including seeks, scans, lookup
and updates
• Sys.dm_db_index_physical_stats
– Returns size and fragmentation information for data pages and
indexes.
• DMV’s to find recommended indexes
– Sys.dm_db_missing_index_columns
– Sys.dm_db_missing_index_details
– Sys.dm_db_missing_index_groups
– Sys.dm_db_missing_index_group_stats
38
39. SQLOS DMV’s
• Sys.dm_os_sys_memory
– Returns complete picture of memory at the os level including total and
available memory.
• Sys.dm_os_tasks
– Returns a row for each OS task thais is active in the instance of SQL
Server.
• Sys.dm_os_threads
– Returns a row for each SQLOS thread running under the SQL Server
process.
• Sys.dm_os_performance_counters
– Returns a row for each SQL Server perfmon counter.
• Sys.dm_os_waiting_tasks
– Returns information about the wait queue of SQLOS. This would be
tasks waiting on resources like blocking and latch contention etc..
39
40. DMV Queries (DEMO)
http://www.flickr.com/photos/democonference/4458079104
• What is Running?
• Probing the Proc Cache
40
41. SQL Profiler (DEMO!)
http://www.flickr.com/photos/democonference/4458079104
• Generate Server Side traces
– Tuning Columns and Events
– Remove the noise
• Read Trace with Clear Trace
41