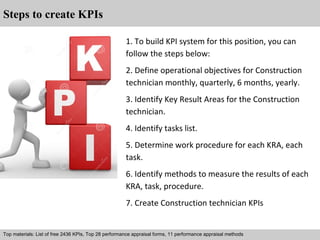
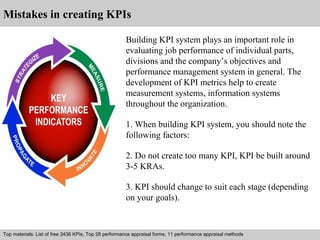
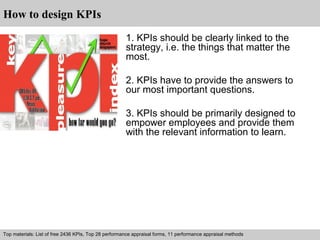
This document discusses key performance indicators (KPIs) and how to develop them. It provides information on different types of KPIs, including process, input, output, leading, lagging, outcome, qualitative and quantitative KPIs. The document also outlines steps for creating KPIs, such as defining objectives, identifying key result areas and tasks, and determining how to measure results. Additionally, it discusses common mistakes to avoid, such as creating too many KPIs or ones that do not change based on goals.
How S&OP Drives Agility -- Supply Chain Insights Research Results (April 2012)Lora Cecere
Summary slides of research on how S&OP drives supply chain agility. Conducted by Supply Chain Insights in March-April 2012.
Objective: Assess the importance of supply chain agility and tactics used to improve agility – and specifically to understand the role of S&OP in driving agility in organizations.
Why is Sales and Operations Planning So Hard?Lora Cecere
Sales and Operations Planning processes are not a panacea. Just because an organization has a process, does not automatically mean that the company will drive value.
In the past decade, company progress moved backwards with fewer and fewer companies believing that they are successful. The reasons? Lack of definition of supply chain excellence, the need for design, clear delineation of governance, clarity of the role of the financial budget and the organizational tension in reconciliation with the market, and the lack of organizational alignment.
Sales and Operations Planning: A Guide for the Supply Chain LeaderLora Cecere
Covid-19 brings unprecedented times for the supply chain leader. Sales and Operations Planning is even more critical. Here we share insights on how to avoid the pitfalls and potholes of S&OP processes.
Steelwedge Launches Next-Generation S&OP Technology Platform with New Mobile, Analytics and Big Data Capabilities. For more Information on S&OP, visit http://www.steelwedge.com/resources/s-and-op-intro
The Role of Analytics In Defining The Art Of The PossibleLora Cecere
Analytics capabilities are evolving faster than organizations can adopt them into their processes. Here we share the research of 92 respondents in their journey to use new forms of analytics in their digital transformation journey.
The Fallacy of Supply Chain IntegrationLora Cecere
While most business leaders speak of an end-to-end integrated supply chain, this vision is too narrow. Instead, companies need to think about the flow of data and the synchronization and harmonization of data.
Today only one in three business leaders are satisfied with their supply chain. One of the issues is the lack of agility. In this report, we share case studies on how to improve supply chain agility. This report first defines supply chain agility and then shares case studies of agility techniques that work to improve the ability to deliver the same cost, quality and customer service given the rising levels of demand and supply volatility. Each case study is supported by the Supply Chains to Admire financial analysis.
Comparison of the Supply Chains to Admire and Gartner Top 25 Winners for 2011...Lora Cecere
When analyzing the Gartner Top 25 using the Supply Chains to Admire methodology, we find that:
75% underperformed on growth
29% underperformed on margin
42% underperformed on inventory turns
Business Guide for Supply Chain Leaders for S&OP in the PandemicLora Cecere
The return on investment for S&OP excellence in normal times is seven months, in the pandemic excellence in S&OP matters more than ever. Here we share a business guide for supply chain leaders to drive value and eliminate the pitfalls and potholes of S&OP evolution.
Current State of Sales and Operations PlanningLora Cecere
Summary document on research from over 100 companies on the current state of Sales and Operations Planning. The average company has seven processes and feels significantly less satisfied in 2019 than in 2016. Business complexity outpaces process and technology evolution. Companies deploying SAP APO or IBP rate themselves significantly behind peer group due to the lack of what if modeling and modeling capabilities.
Presentation for the Upcoming Llamasoft Event Summercon. Looking forward to discussing the evolution of value networks and the use of network design technologies at this event on June 20th in Ann Arbor, MI.
Executive Overview
Analytic strategies are at the core of digital innovation. It is a building block in digital manufacturing, autonomous supply chains, and digital path to purchase. New forms of analytics are defining new capabilities.
Traditional supply chains do not sense. They respond. The response is usually late, and out of step with the market. Today’s supply chains are dependent on structured data and Excel spreadsheets. Despite spending 1.7% of revenue on Information Technology (IT), Excel ghettos are scattered across the organization. Most organizations are held hostage by long and grueling ERP implementations only to find out at the end of the project that the business users cannot get to the data.
The traditional supply chain paradigm is an extension to the three-letter acronyms which dominated the client-server architected world of the 1990s—ERP, APS, PLM, SRM, and CRM—while the more enlightened business user understands that analytics are not an extension of yesterday’s alphabet soup.
Historically, analytics has only meant reporting. In contrast, today, analytic strategies are at the core. As analytics capabilities morph and change, analytics technologies are at the core of the architecture, sandwiched between the conventional applications and workforce productivity tools as shown in Figure 2.
Figure 2. Analytic Strategies at the Core of Digital Transformation
Current State
Today, the focus of analytics implementations is on data visualization, unstructured data mining, and data lake technologies. As will be seen in this report, this is rapidly changing. Within five years, the most disruptive technologies will be Blockchain and cognitive computing. New forms of analytics will make many of today’s technology approaches obsolete. Few companies, mainly early adopters, are working in these areas.
The Supply Chains To Admire Report for 2021Lora Cecere
The Supply Chains To Admire methodology tracks the rate of improvement and performance of 60 public companies in 28 industry sectors. Twenty companies outperform including In the 2021 analysis, twenty companies met the Supply Chains to Admire Award criteria. The winners include Apple, AbbVie Inc., Air Products & Chemicals, Assa Abloy AB, Broadcom, Celestica, Dollar General, Ecolab Inc., Intuitive Surgical, Inditex, Lockheed Martin Corporation, Nike Inc., Nvidia, PACCAR Inc, Ross Stores, Sleep Number, Taiwan Semiconductor Manufacturing (TSMC) Company, Tempur Sealy, TJX Companies, and Western Digital. No company met the criteria in seventeen of the twenty-six sectors studied.
In June of this year, we will publish our fifth analysis of the Supply Chains to Admire. The Supply Chains to Admire methodology celebrates companies that outperform their peer group while driving a faster rate of improvement. Improvement is easier to say than to measure. To create the Supply Chains to Admire, we developed a methodology to measure improvement. It is defined by the Supply Chain Index. To help companies better understand the Supply Chain Index and relative rates of change within an industry, here we dedicate an entire report to the methodology underlying the Index.
What Is the Value Proposition of Sales and Operations Planning? Summary ChartsLora Cecere
Survey Details: The research for this report was conducted online from January 6 - September 14, 2015 by Supply Chain Insights. Surveys were conducted among Manufacturers and Wholesalers/Distributors/Co-operatives with $250M+ in revenue and who have at least one S&OP process (n=73). For the purpose of analysis, respondents were split between those with a self-reported "effective" S&OP (n=31) and those without (n=42).
Objective: To understand the value proposition of an effective S&OP (Sales and Operations Planning) process. NOTE: An S&OP process was defined as a "tactical planning process to forecast sales and plan operations."
Highlight: Companies with a more effective S&OP process are more aligned, agile and balanced, which leads to greater control and improved response.
Managing Supply Chain Talent During the PandemicLora Cecere
With one out of two supply chain professionals satisfied with their jobs and an increase in job opportunities for supply chain leaders post-pandemic, is supply chain talent your greatest risk? In this report, Supply Chain Insights captures insights from studies conducted in 2019 and 2020 to give insights for supply chain leaders on retaining employees and improving job satisfaction.
A group of 6 students, in the 4rth grade in the Faculty of English commerce, prepared a a Presentation about S&OP as it was tasked by Professor Ibrahim ElShaer.
for any further questions contact:
Karim_refaat_as@yahoo.com ,
Post Covid-19 Recovery: Building Better Supply ChainsLora Cecere
Today, supply chain leaders are facing a global pandemic and a redefinition of business models along with unprecedented unemployment. This time is anything BUT business as usual. The traditional supply chain, stuck before the pandemic, is unequal to the challenge. Today, I presented my thoughts on how to build better supply chains to the the Supply Chain Canada trade association.
Summary of the Supply Chains to Admire AnalysisLora Cecere
The Supply Chains to Admire analysis, now in its seventh year, is a data-driven methodology to analyze relative improvement and performance against sector peer groups. The data source is public balance sheet information for the period of 2010-2019. The analysis is for 440 public companies in 28 industry sectors. Only 4% of companies are outperforming their peer group while driving improvement at a faster rate than peers.
1. performance kpi
In this ppt file, you can ref materials for performance kpi such as list of KPIs,
performance appraisal metrics, job skills, KRAs, BSC…
For more performance kpi materials such as free 4 ebooks below,
please visit: kpi123.com
• List of free 2436 KPIs
• Top 28 performance appraisal forms
• 11 performance appraisal methods
• 1125 performance review phrases
Top materials: List of free 2436 KPIs, Top 28 performance appraisal forms, 11 performance appraisal methods
Interview questions and answers – free download/ pdf and ppt file
2. Steps to create KPIs
1. To build KPI system for this position, you can
follow the steps below:
2. Define operational objectives for Construction
technician monthly, quarterly, 6 months, yearly.
3. Identify Key Result Areas for the Construction
technician.
4. Identify tasks list.
5. Determine work procedure for each KRA, each
task.
6. Identify methods to measure the results of each
KRA, task, procedure.
7. Create Construction technician KPIs
Top materials: List of free 2436 KPIs, Top 28 performance appraisal forms, 11 performance appraisal methods
Interview questions and answers – free download/ pdf and ppt file
3. Mistakes in creating KPIs
Building KPI system plays an important role in
evaluating job performance of individual parts,
divisions and the company’s objectives and
performance management system in general. The
development of KPI metrics help to create
measurement systems, information systems
throughout the organization.
1. When building KPI system, you should note the
following factors:
2. Do not create too many KPI, KPI be built around
3-5 KRAs.
3. KPI should change to suit each stage (depending
on your goals).
Top materials: List of free 2436 KPIs, Top 28 performance appraisal forms, 11 performance appraisal methods
Interview questions and answers – free download/ pdf and ppt file
4. How to design KPIs
1. KPIs should be clearly linked to the
strategy, i.e. the things that matter the
most.
2. KPIs have to provide the answers to
our most important questions.
3. KPIs should be primarily designed to
empower employees and provide them
with the relevant information to learn.
Top materials: List of free 2436 KPIs, Top 28 performance appraisal forms, 11 performance appraisal methods
Interview questions and answers – free download/ pdf and ppt file
5. Interview questions and answers – free download/ pdf and ppt file
Types of KPIs:
1. Process KPIs - measure the efficiency or
productivity of a business process. Examples -
Days to deliver an order.
2. Input KPIs - measure assets and resources
invested in or used to generate business results.
Examples - Dollars spent on research and
development, Funding for employee training,
Quality of raw materials.
3. Output KPIs - measure the financial and
nonfinancial results of business activities.
Examples - Revenues, Number of new
customers acquired.
4. Leading KPI - measure activities that have a
significant effect on future performance. Drive
the performance of the outcome measure, being
predictor of success or failure.
Top materials: List of free 2436 KPIs, Top 28 performance appraisal forms, 11 performance appraisal methods
6. Types of KPIs (continue…):
5. Lagging KPI - is a type of indicator that reflect
the success or failure after an event has been
consumed. Such as most financial KPIs, measure
the output of past activity.
6. Outcome KPI - Reflects overall results or
impact of the business activity in terms of
generated benefits, as a quantification of
performance. Examples are customer retention,
brand awareness.
7. Qualitative KPI - A descriptive characteristic,
an opinion, a property or a trait. Examples are
employee satisfaction through surveys which
gives a qualitative report.
8. Quantitative KPI - A measurable characteristic,
resulted by counting, adding, or averaging
numbers. Quantitative data is most common in
measurement and therefore forms the backbone
of most KPIs.
Top materials: List of free 2436 KPIs, Top 28 performance appraisal forms, 11 performance appraisal methods
Interview questions and answers – free download/ pdf and ppt file
7. Types of KPIs (continue…):
5. Lagging KPI - is a type of indicator that reflect
the success or failure after an event has been
consumed. Such as most financial KPIs, measure
the output of past activity.
6. Outcome KPI - Reflects overall results or
impact of the business activity in terms of
generated benefits, as a quantification of
performance. Examples are customer retention,
brand awareness.
7. Qualitative KPI - A descriptive characteristic,
an opinion, a property or a trait. Examples are
employee satisfaction through surveys which
gives a qualitative report.
8. Quantitative KPI - A measurable characteristic,
resulted by counting, adding, or averaging
numbers. Quantitative data is most common in
measurement and therefore forms the backbone
of most KPIs.
Top materials: List of free 2436 KPIs, Top 28 performance appraisal forms, 11 performance appraisal methods
Interview questions and answers – free download/ pdf and ppt file