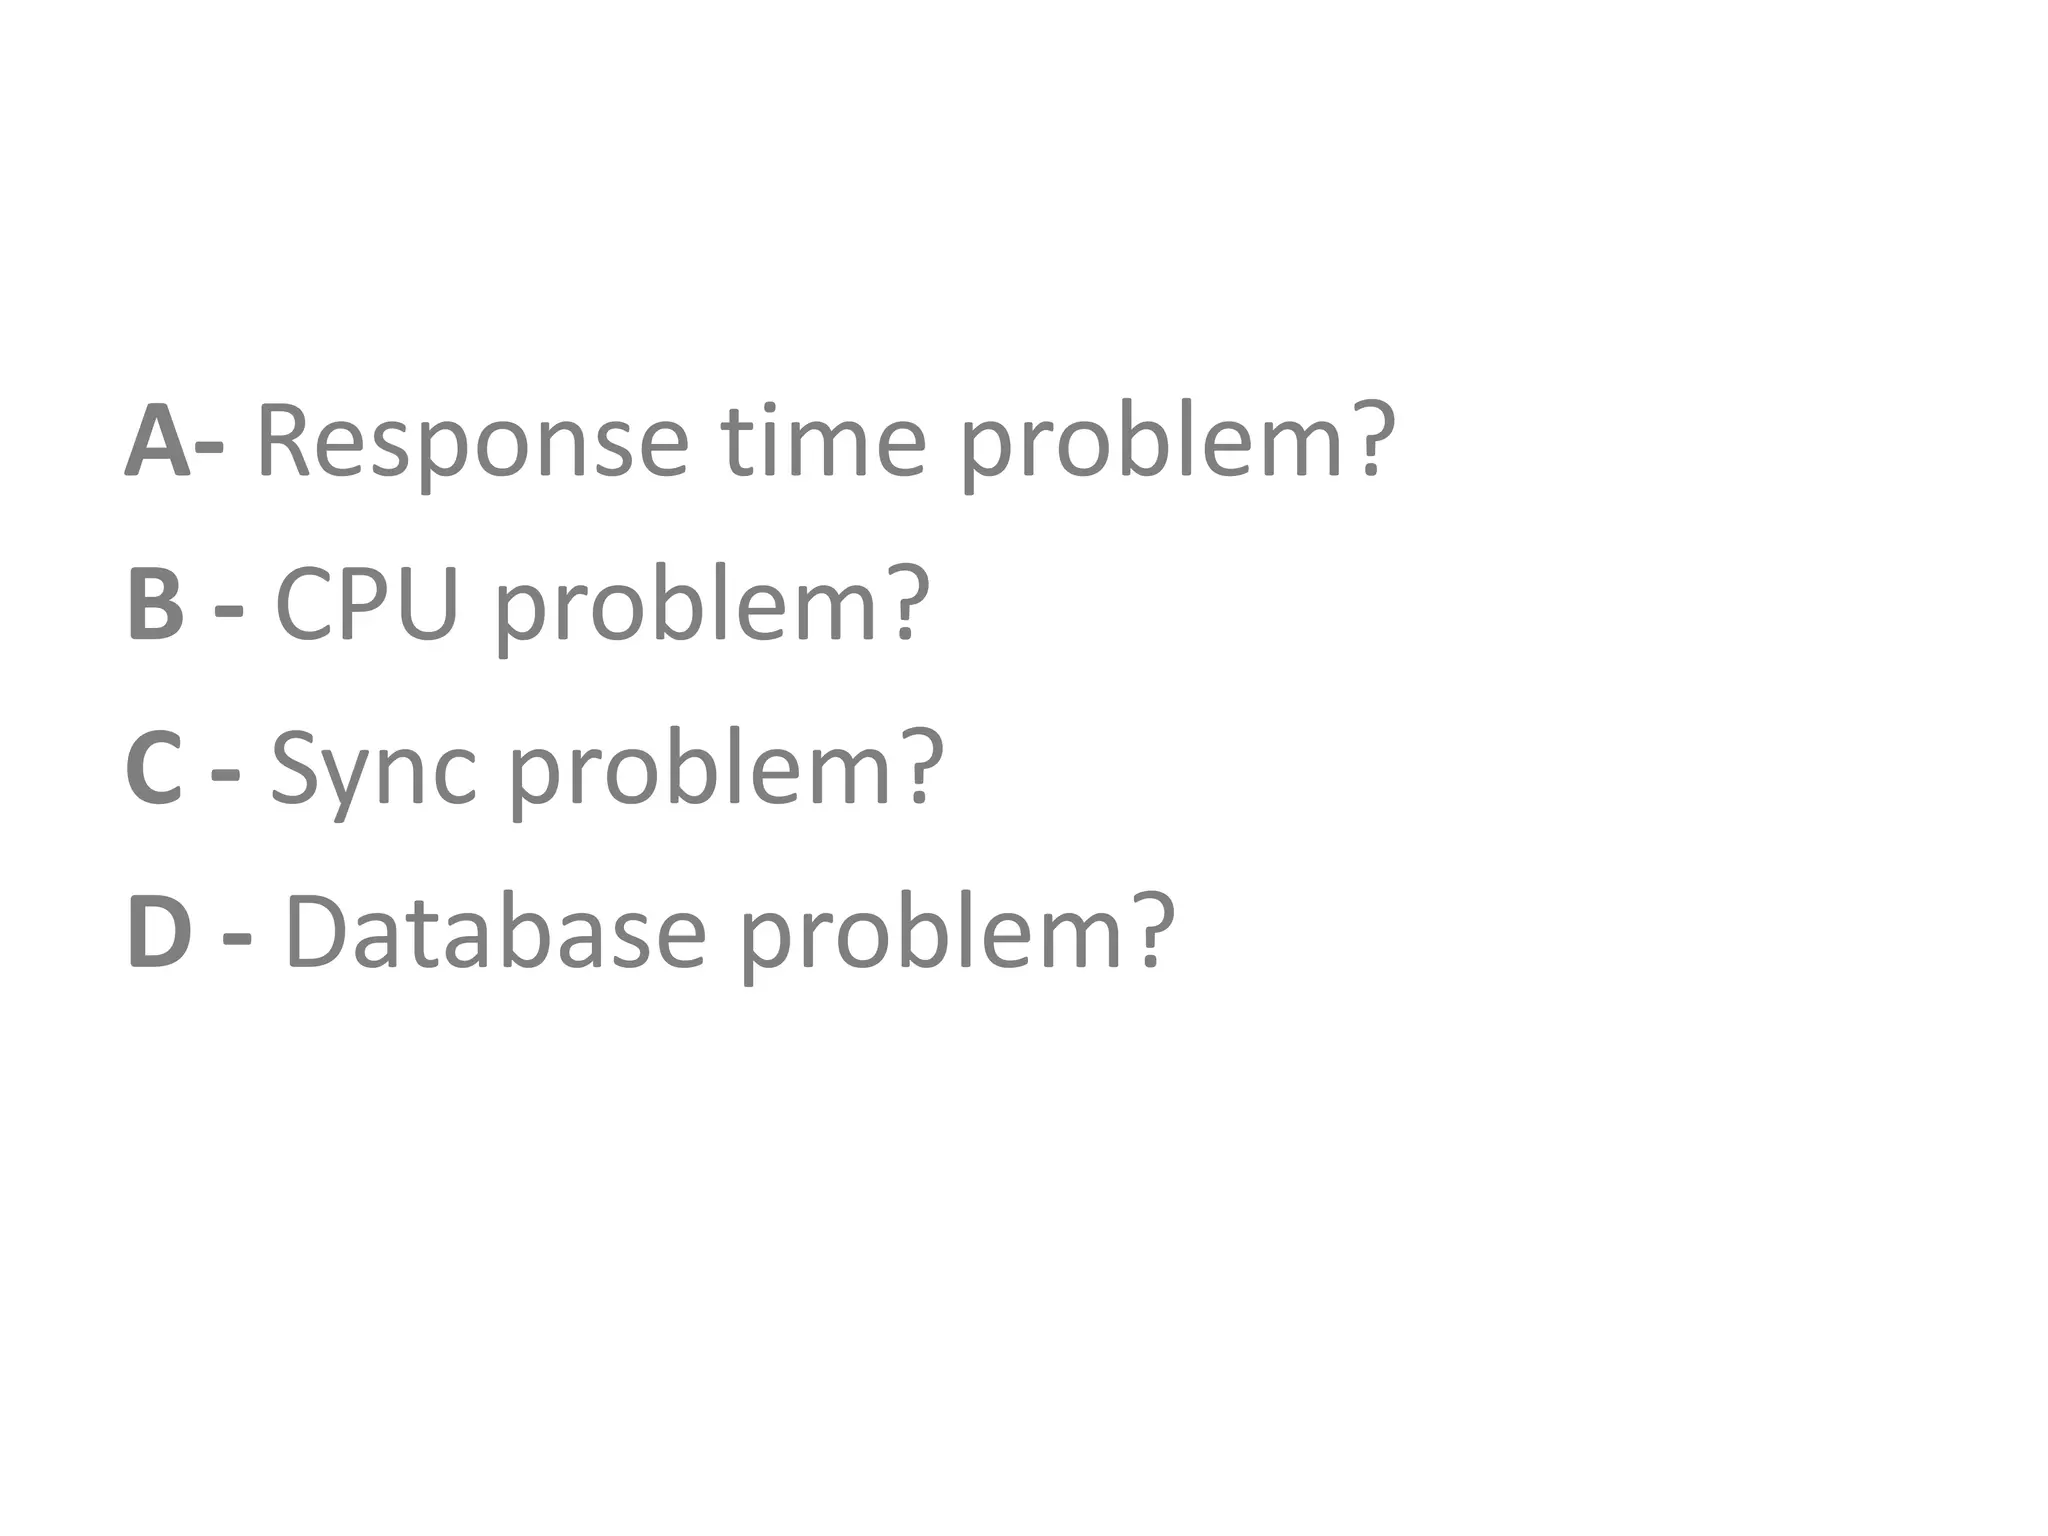
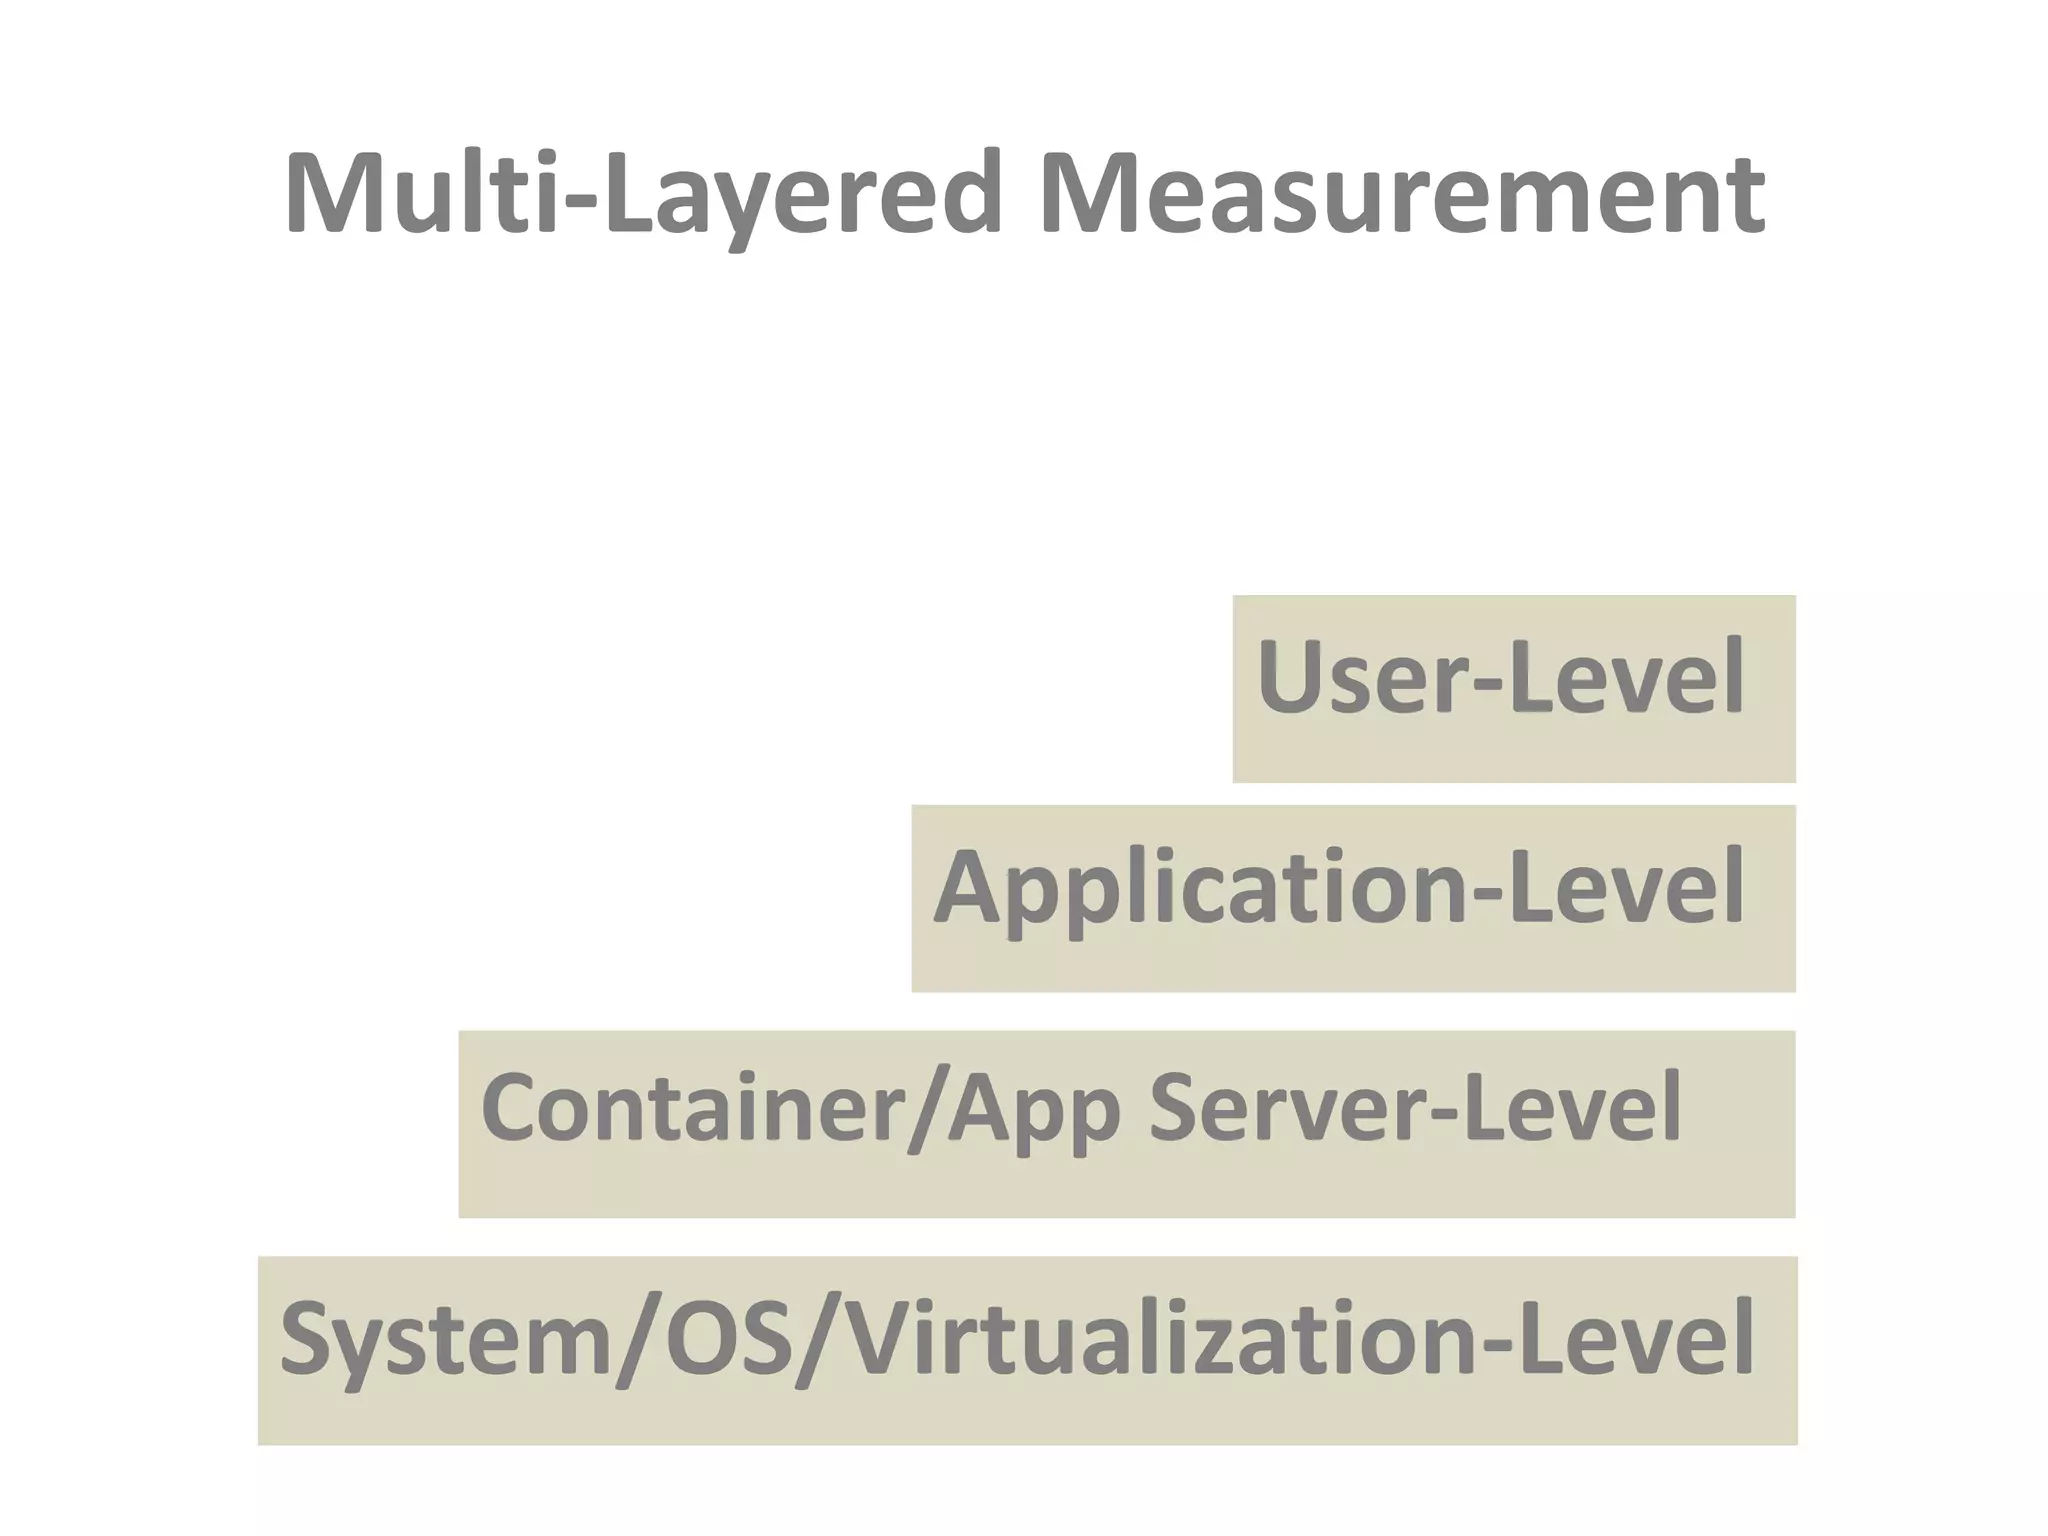
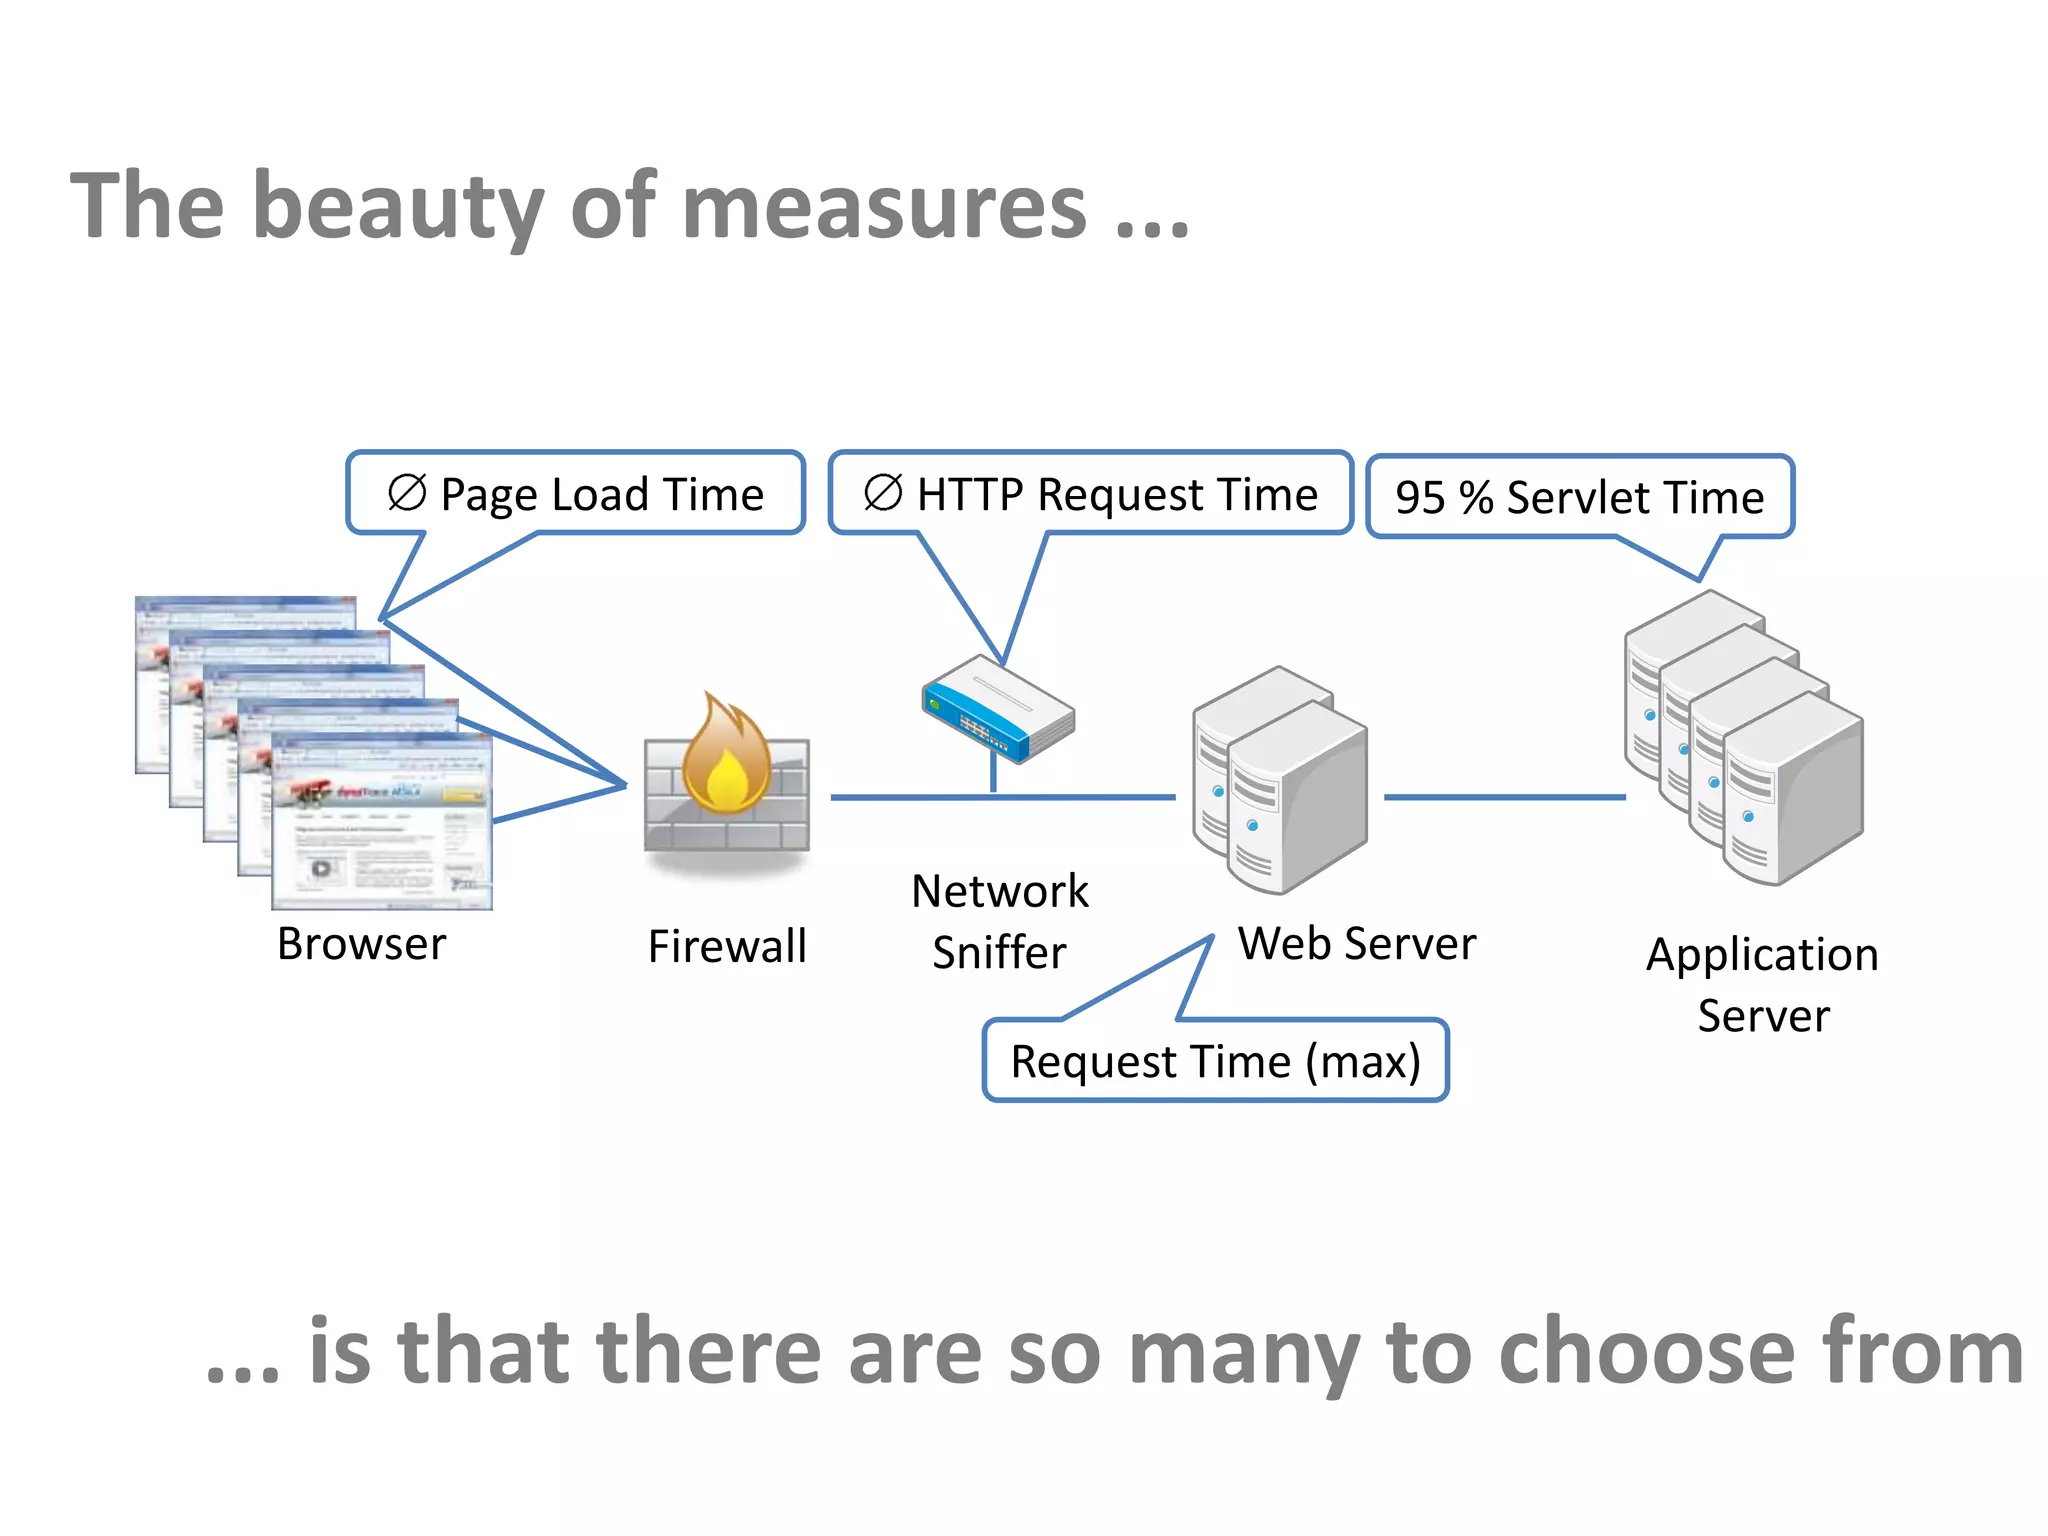
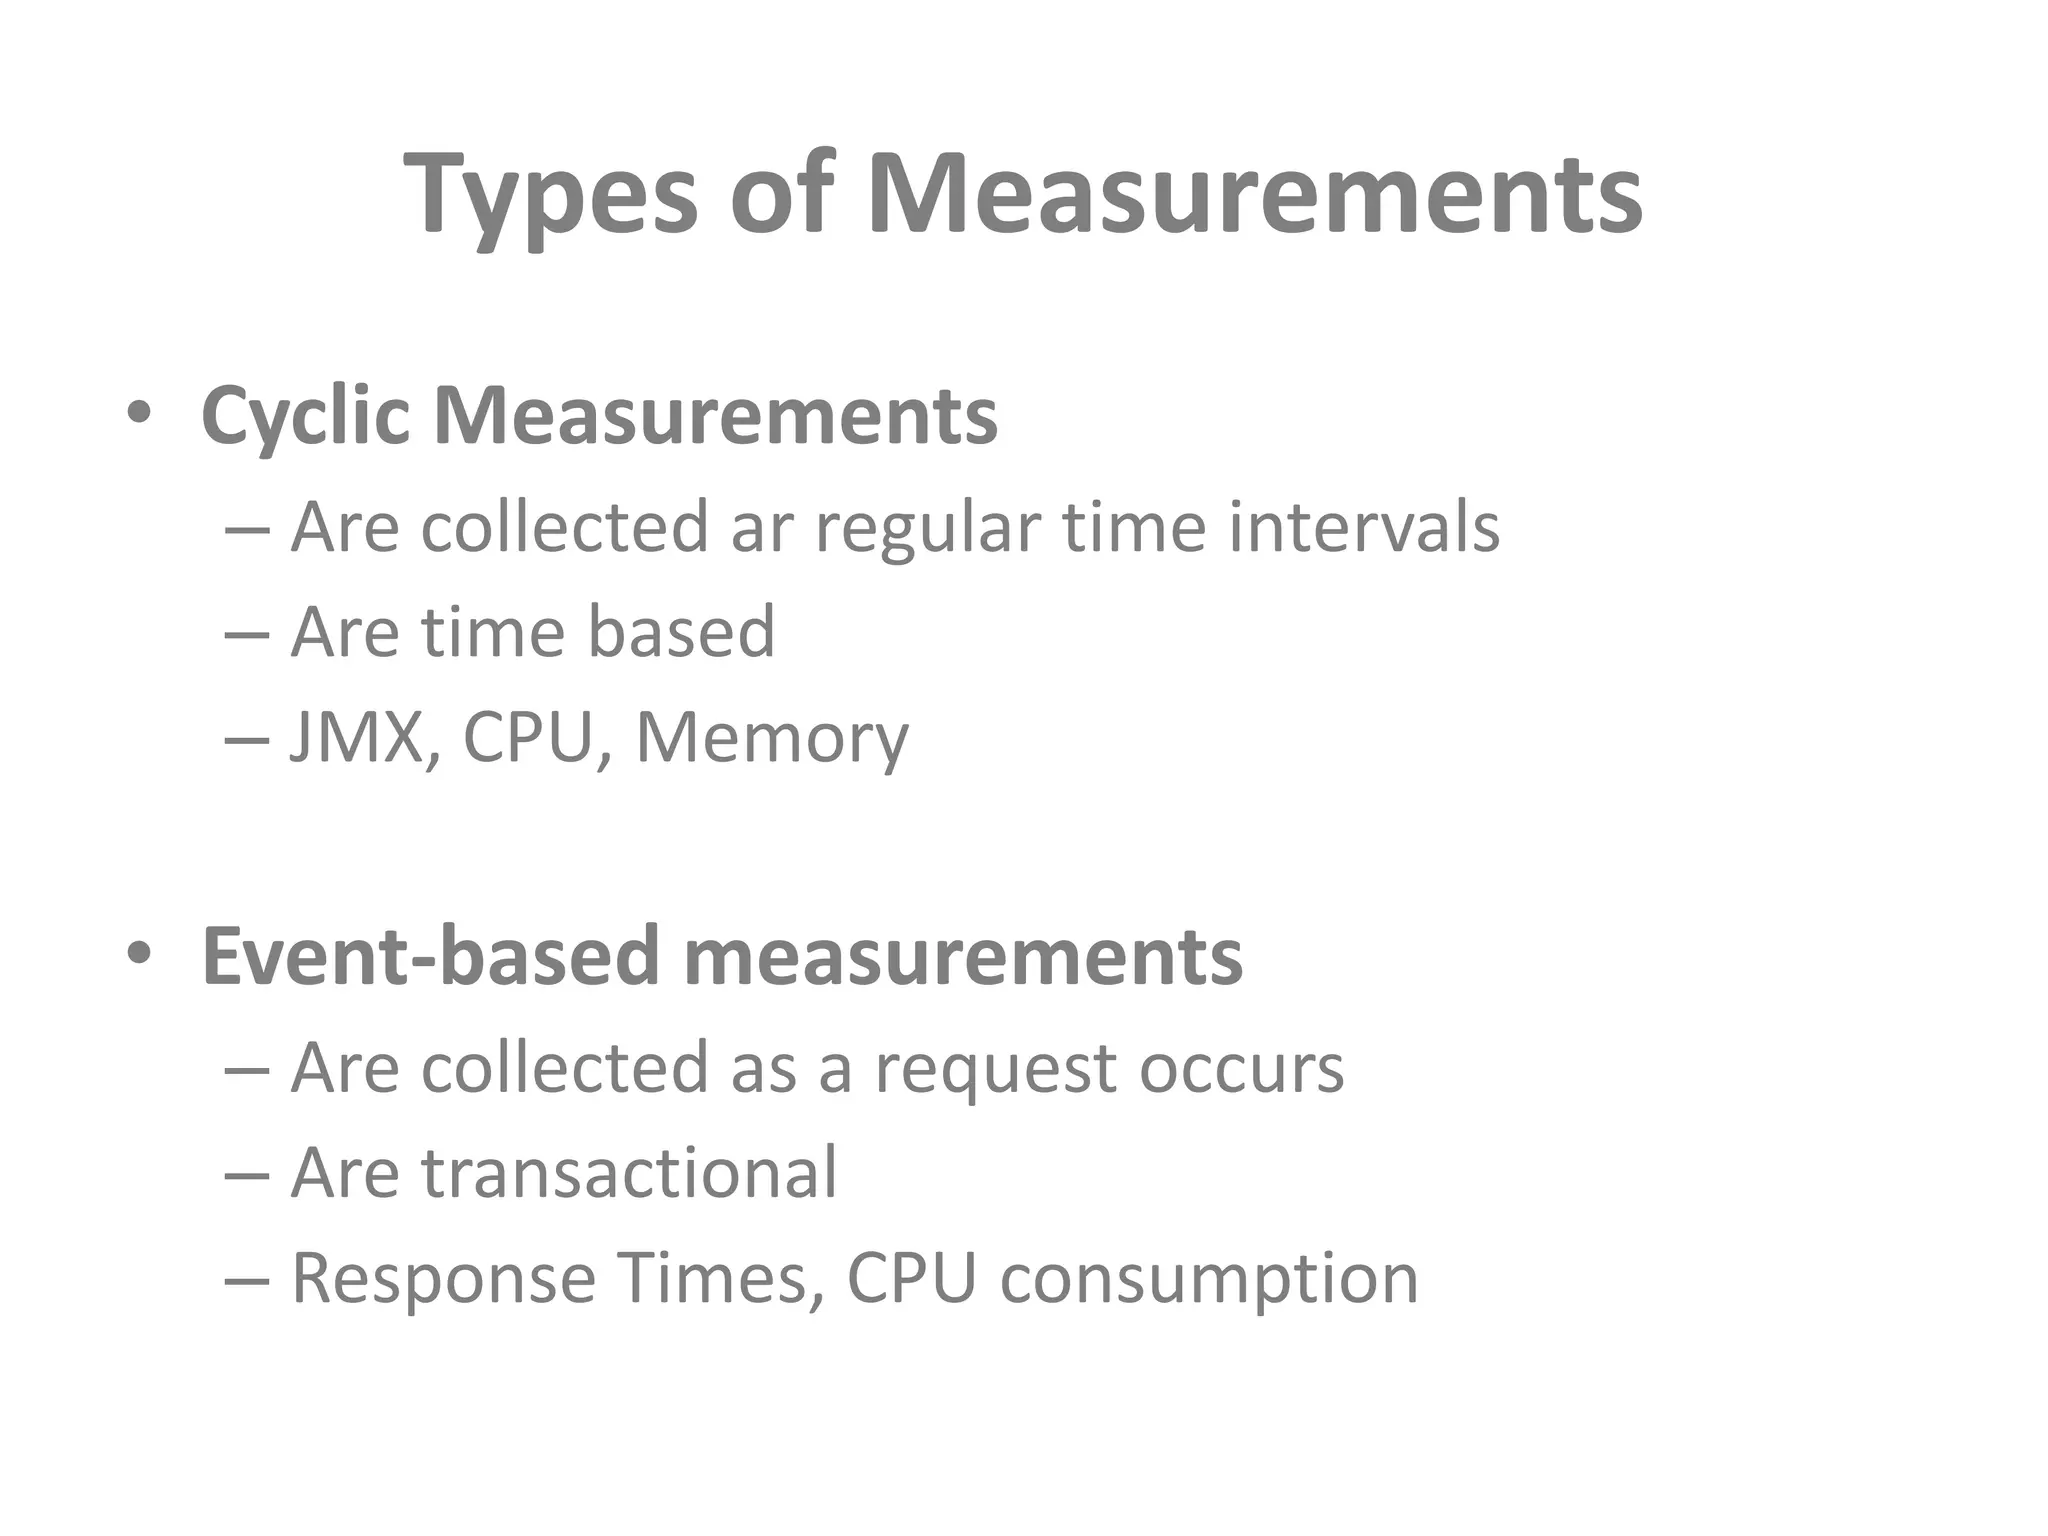
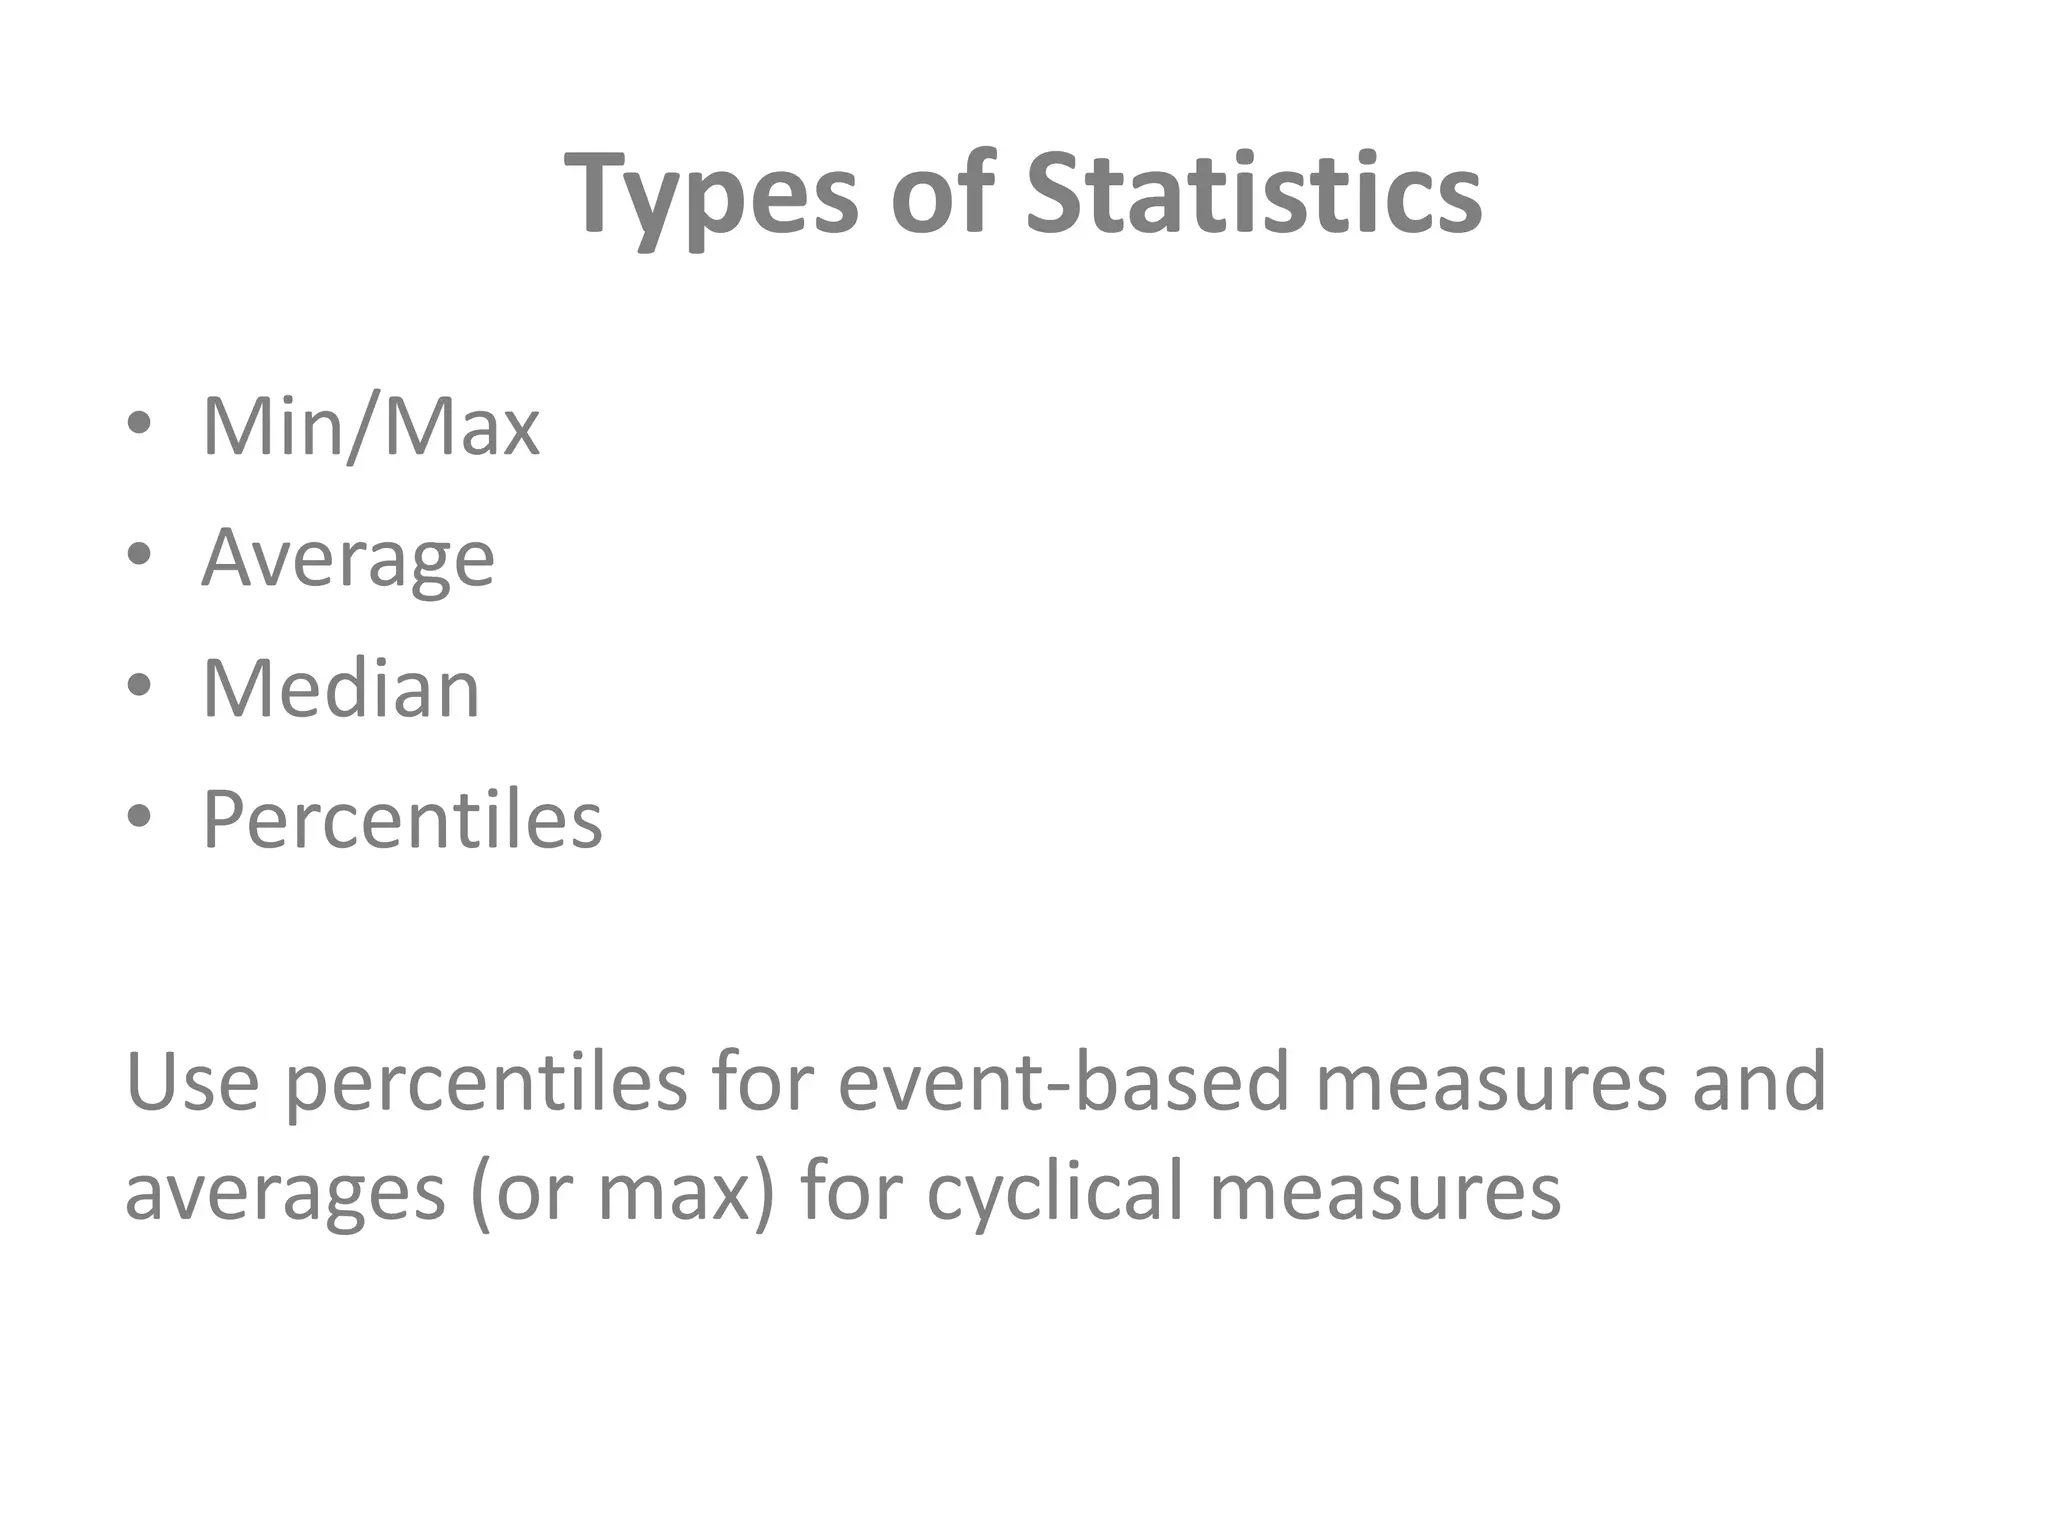
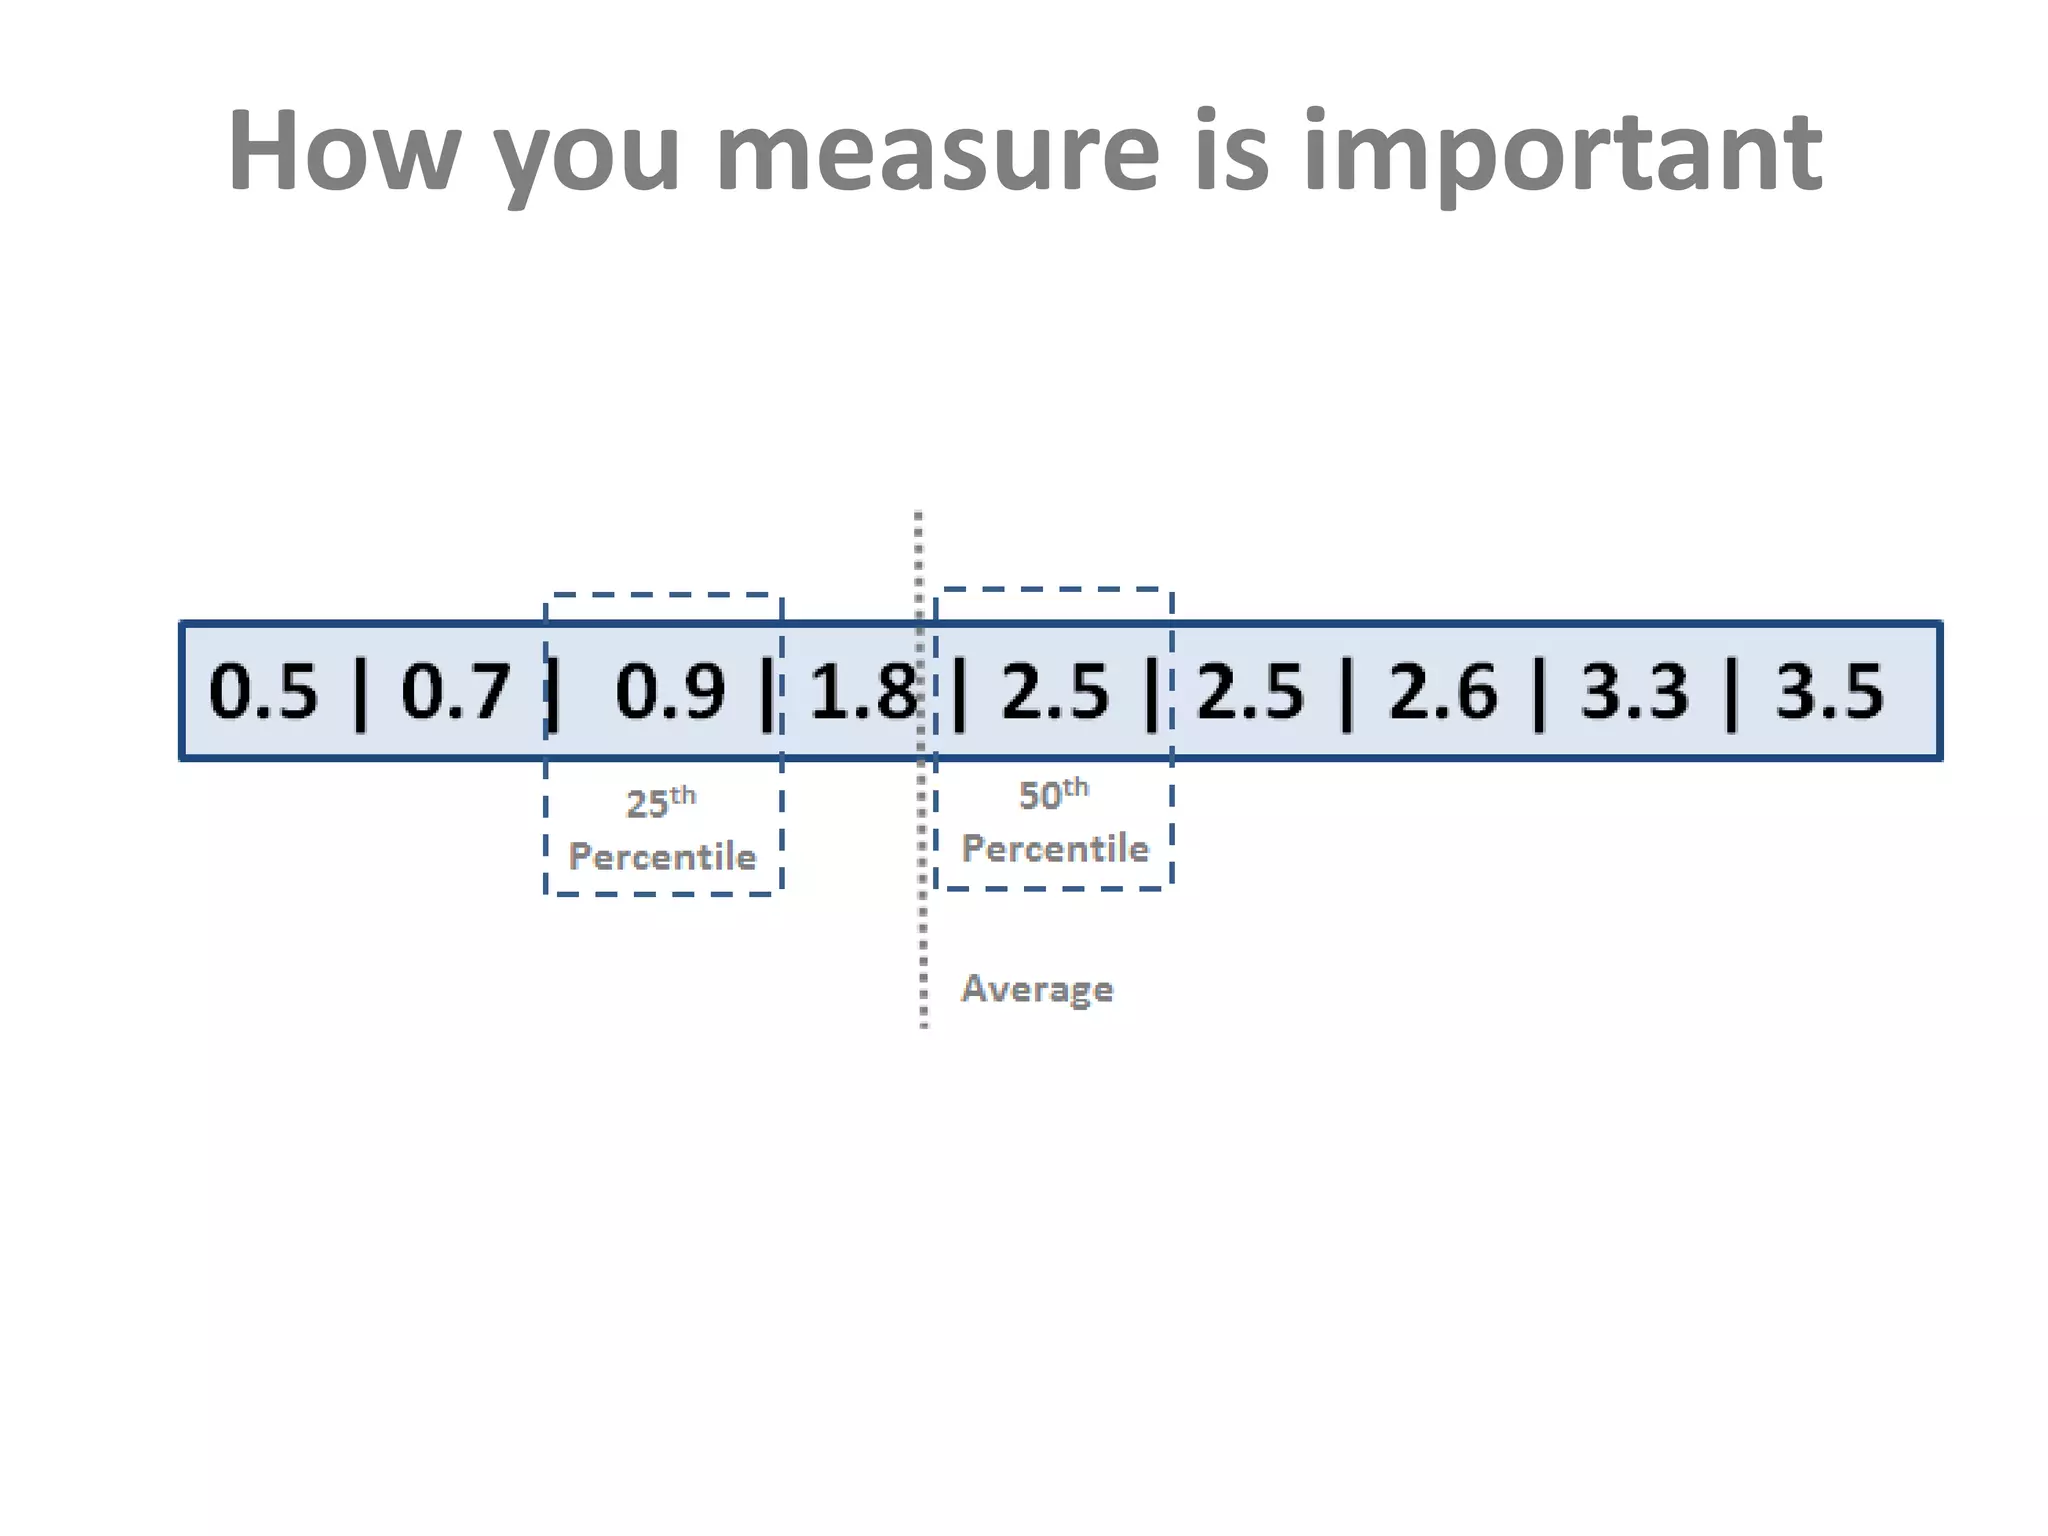
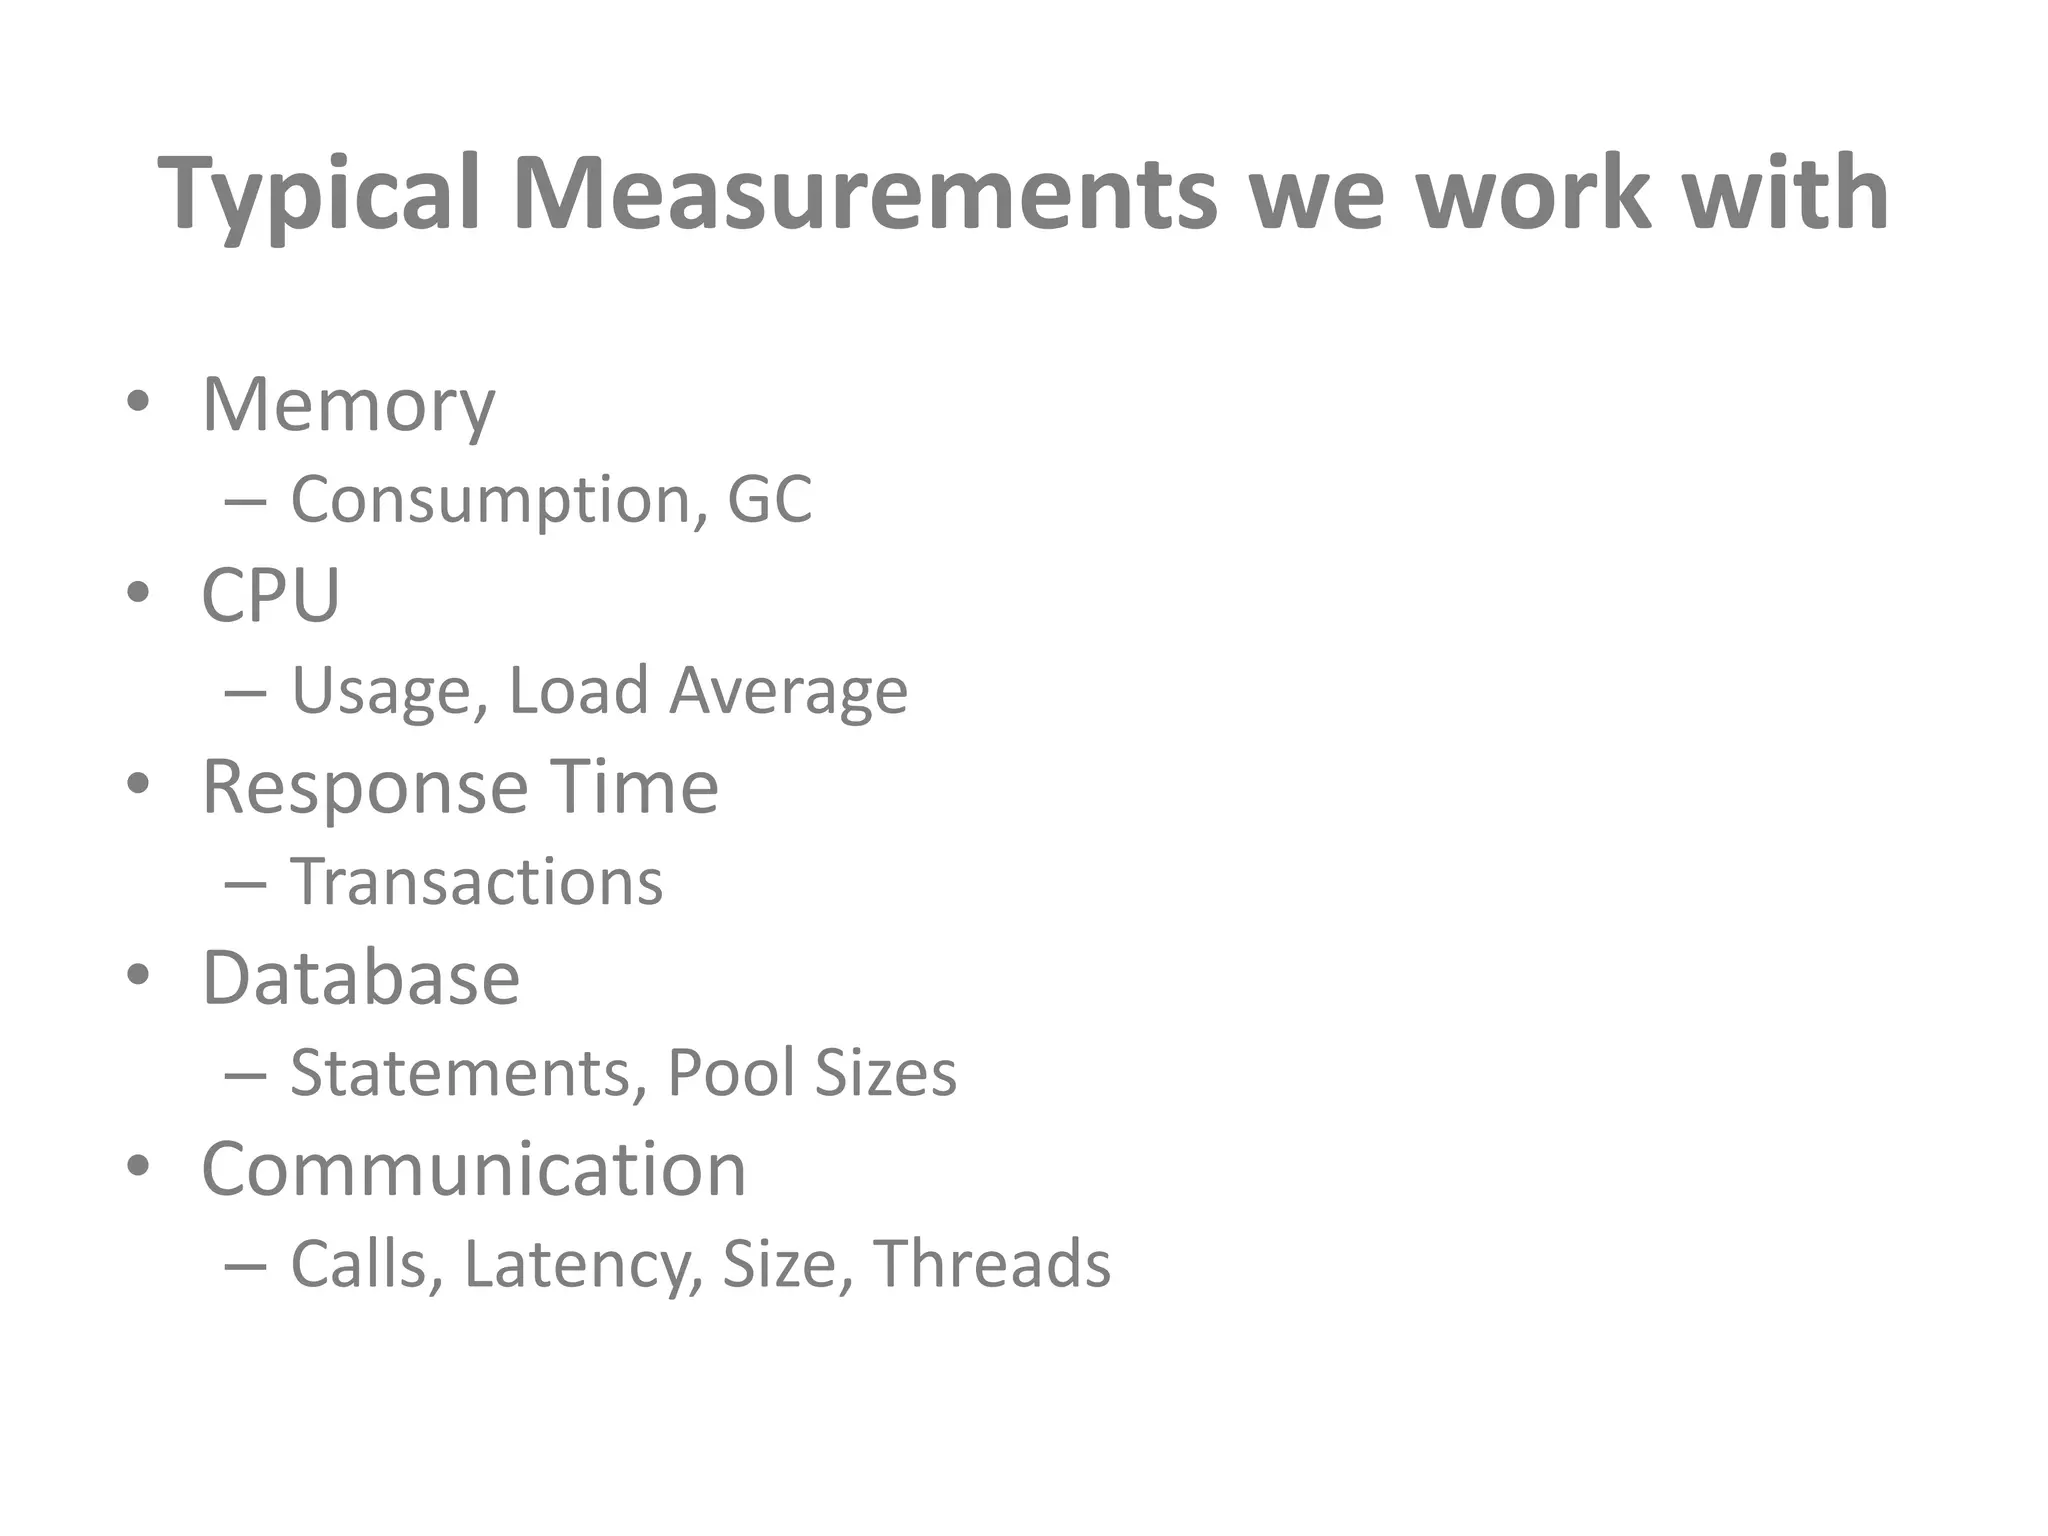
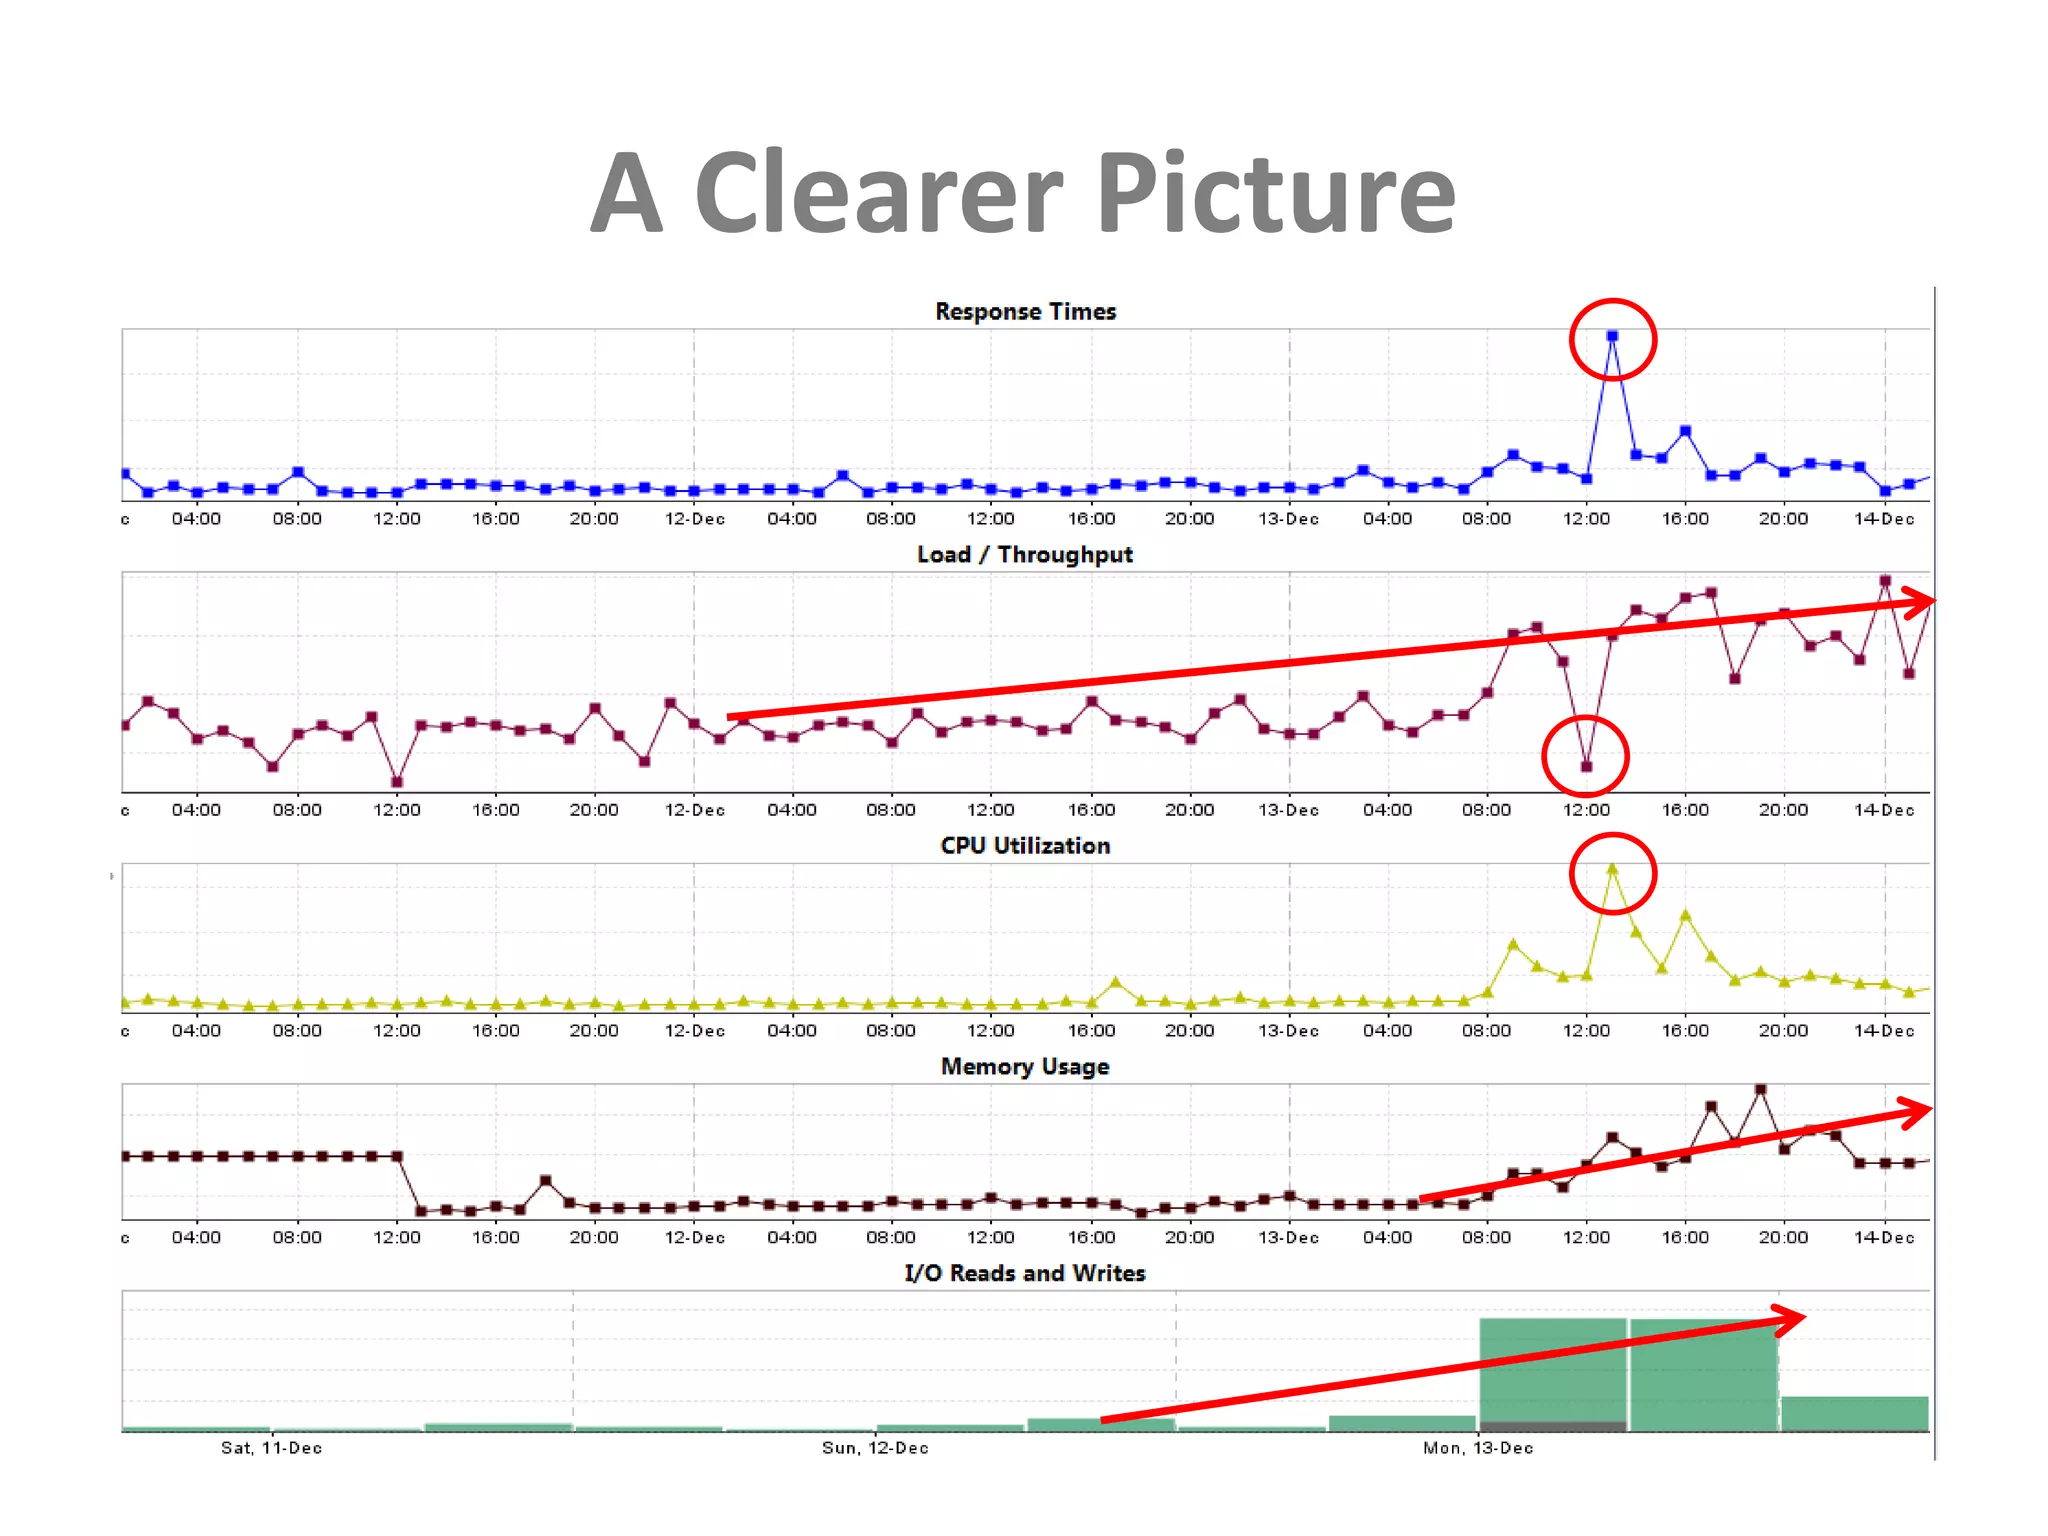
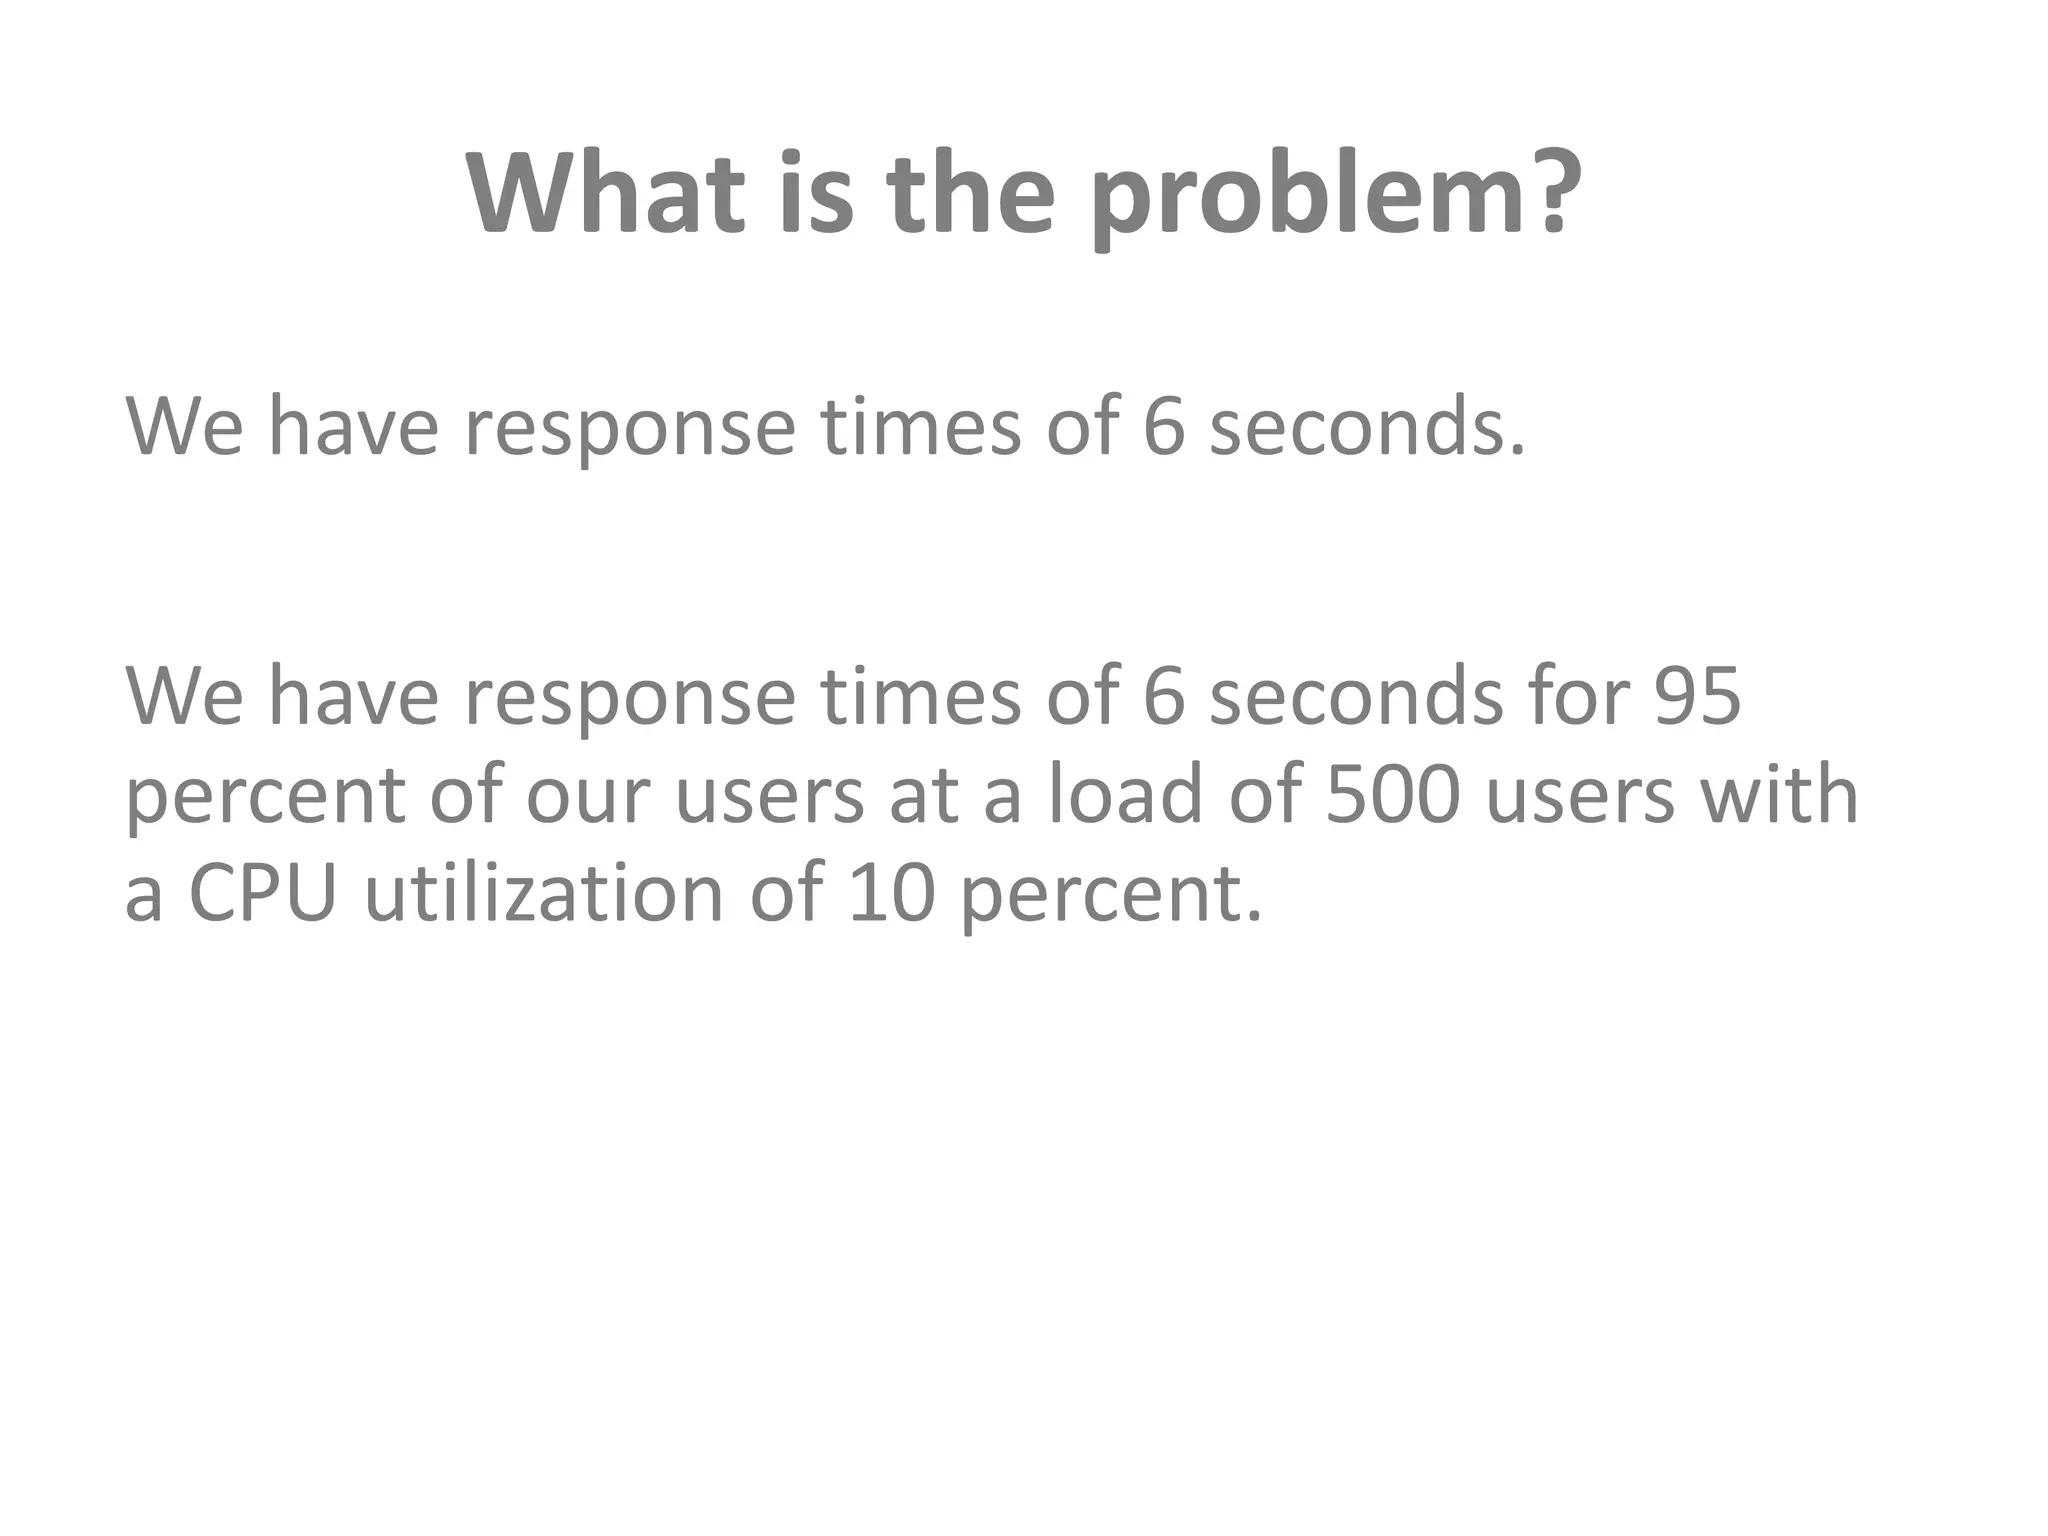
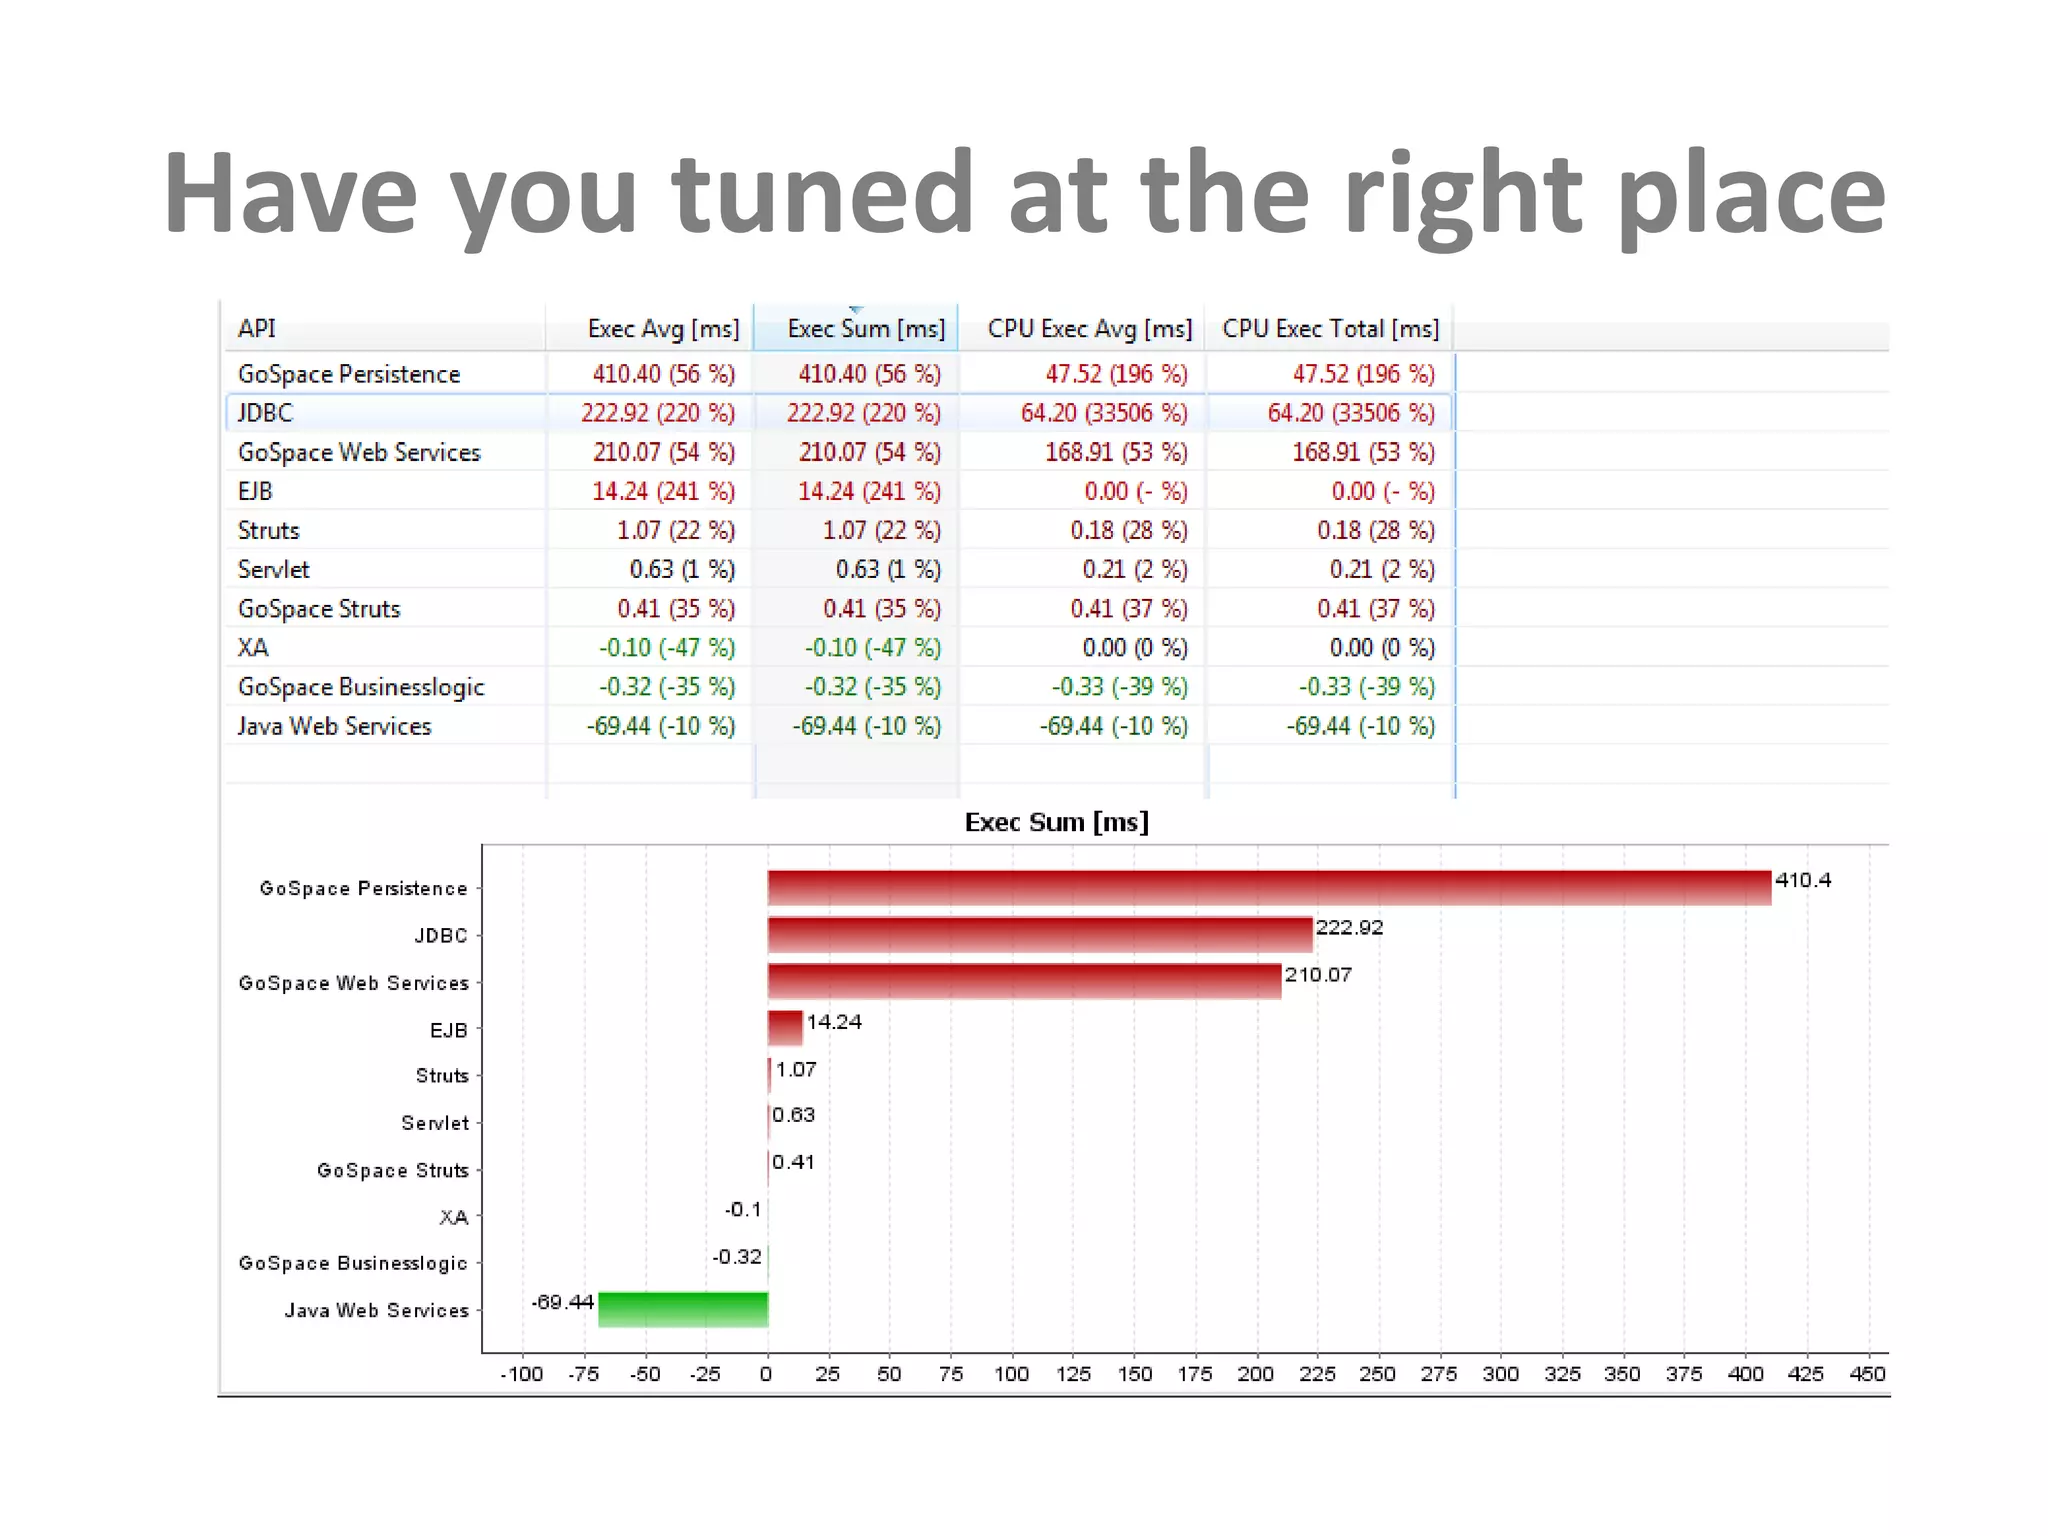
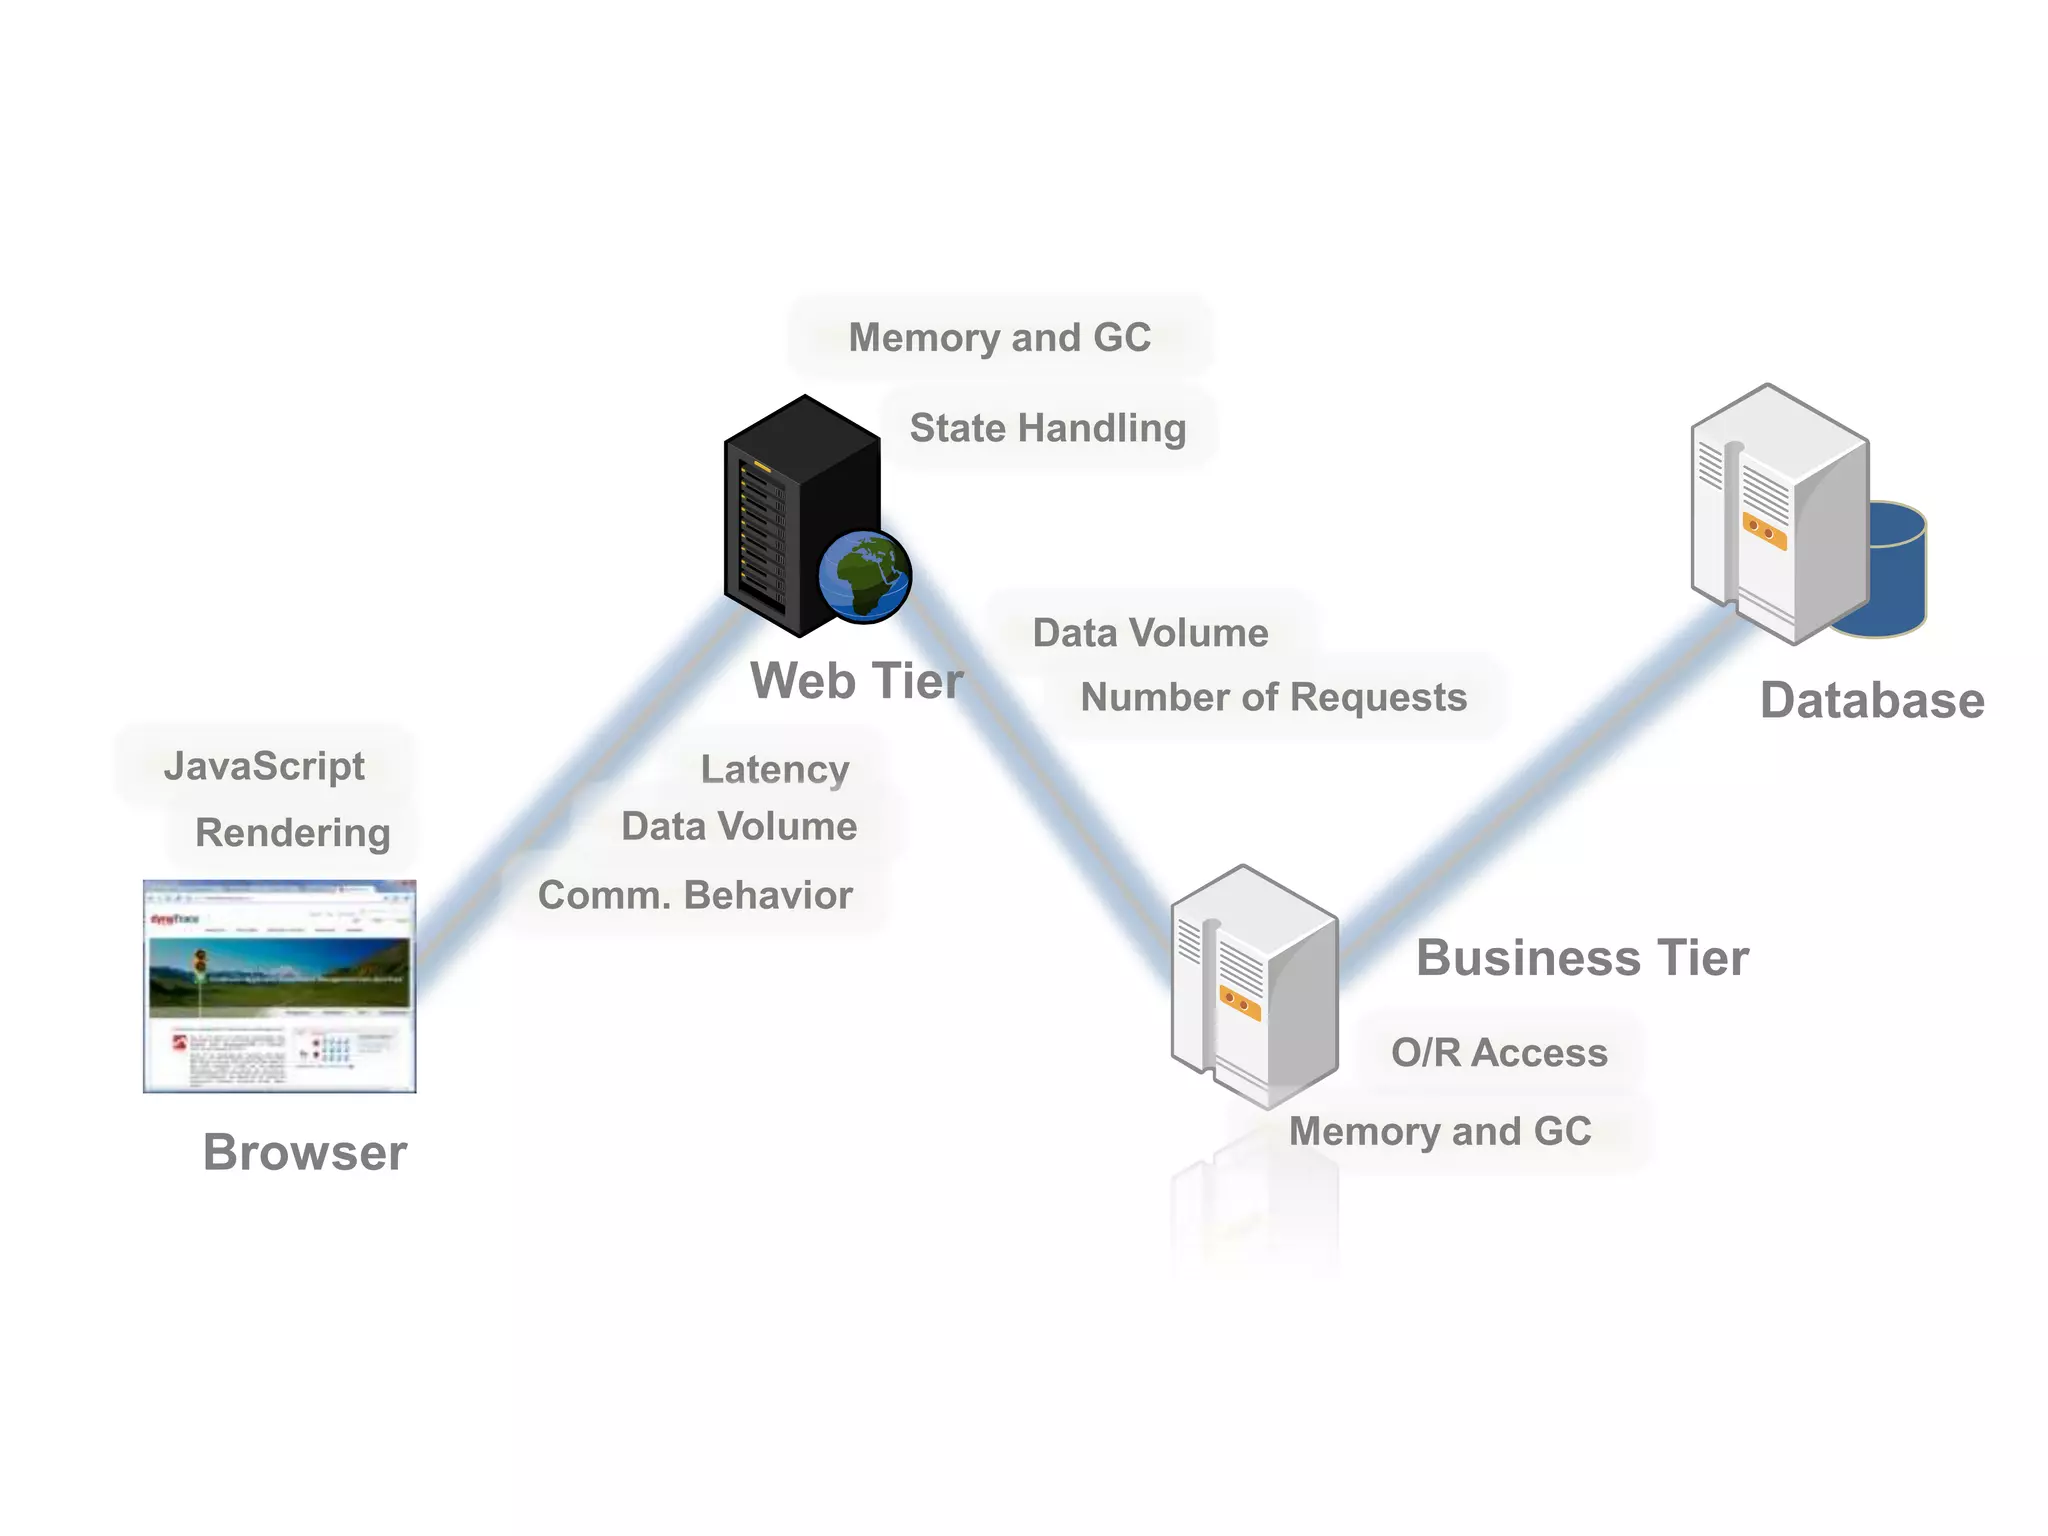
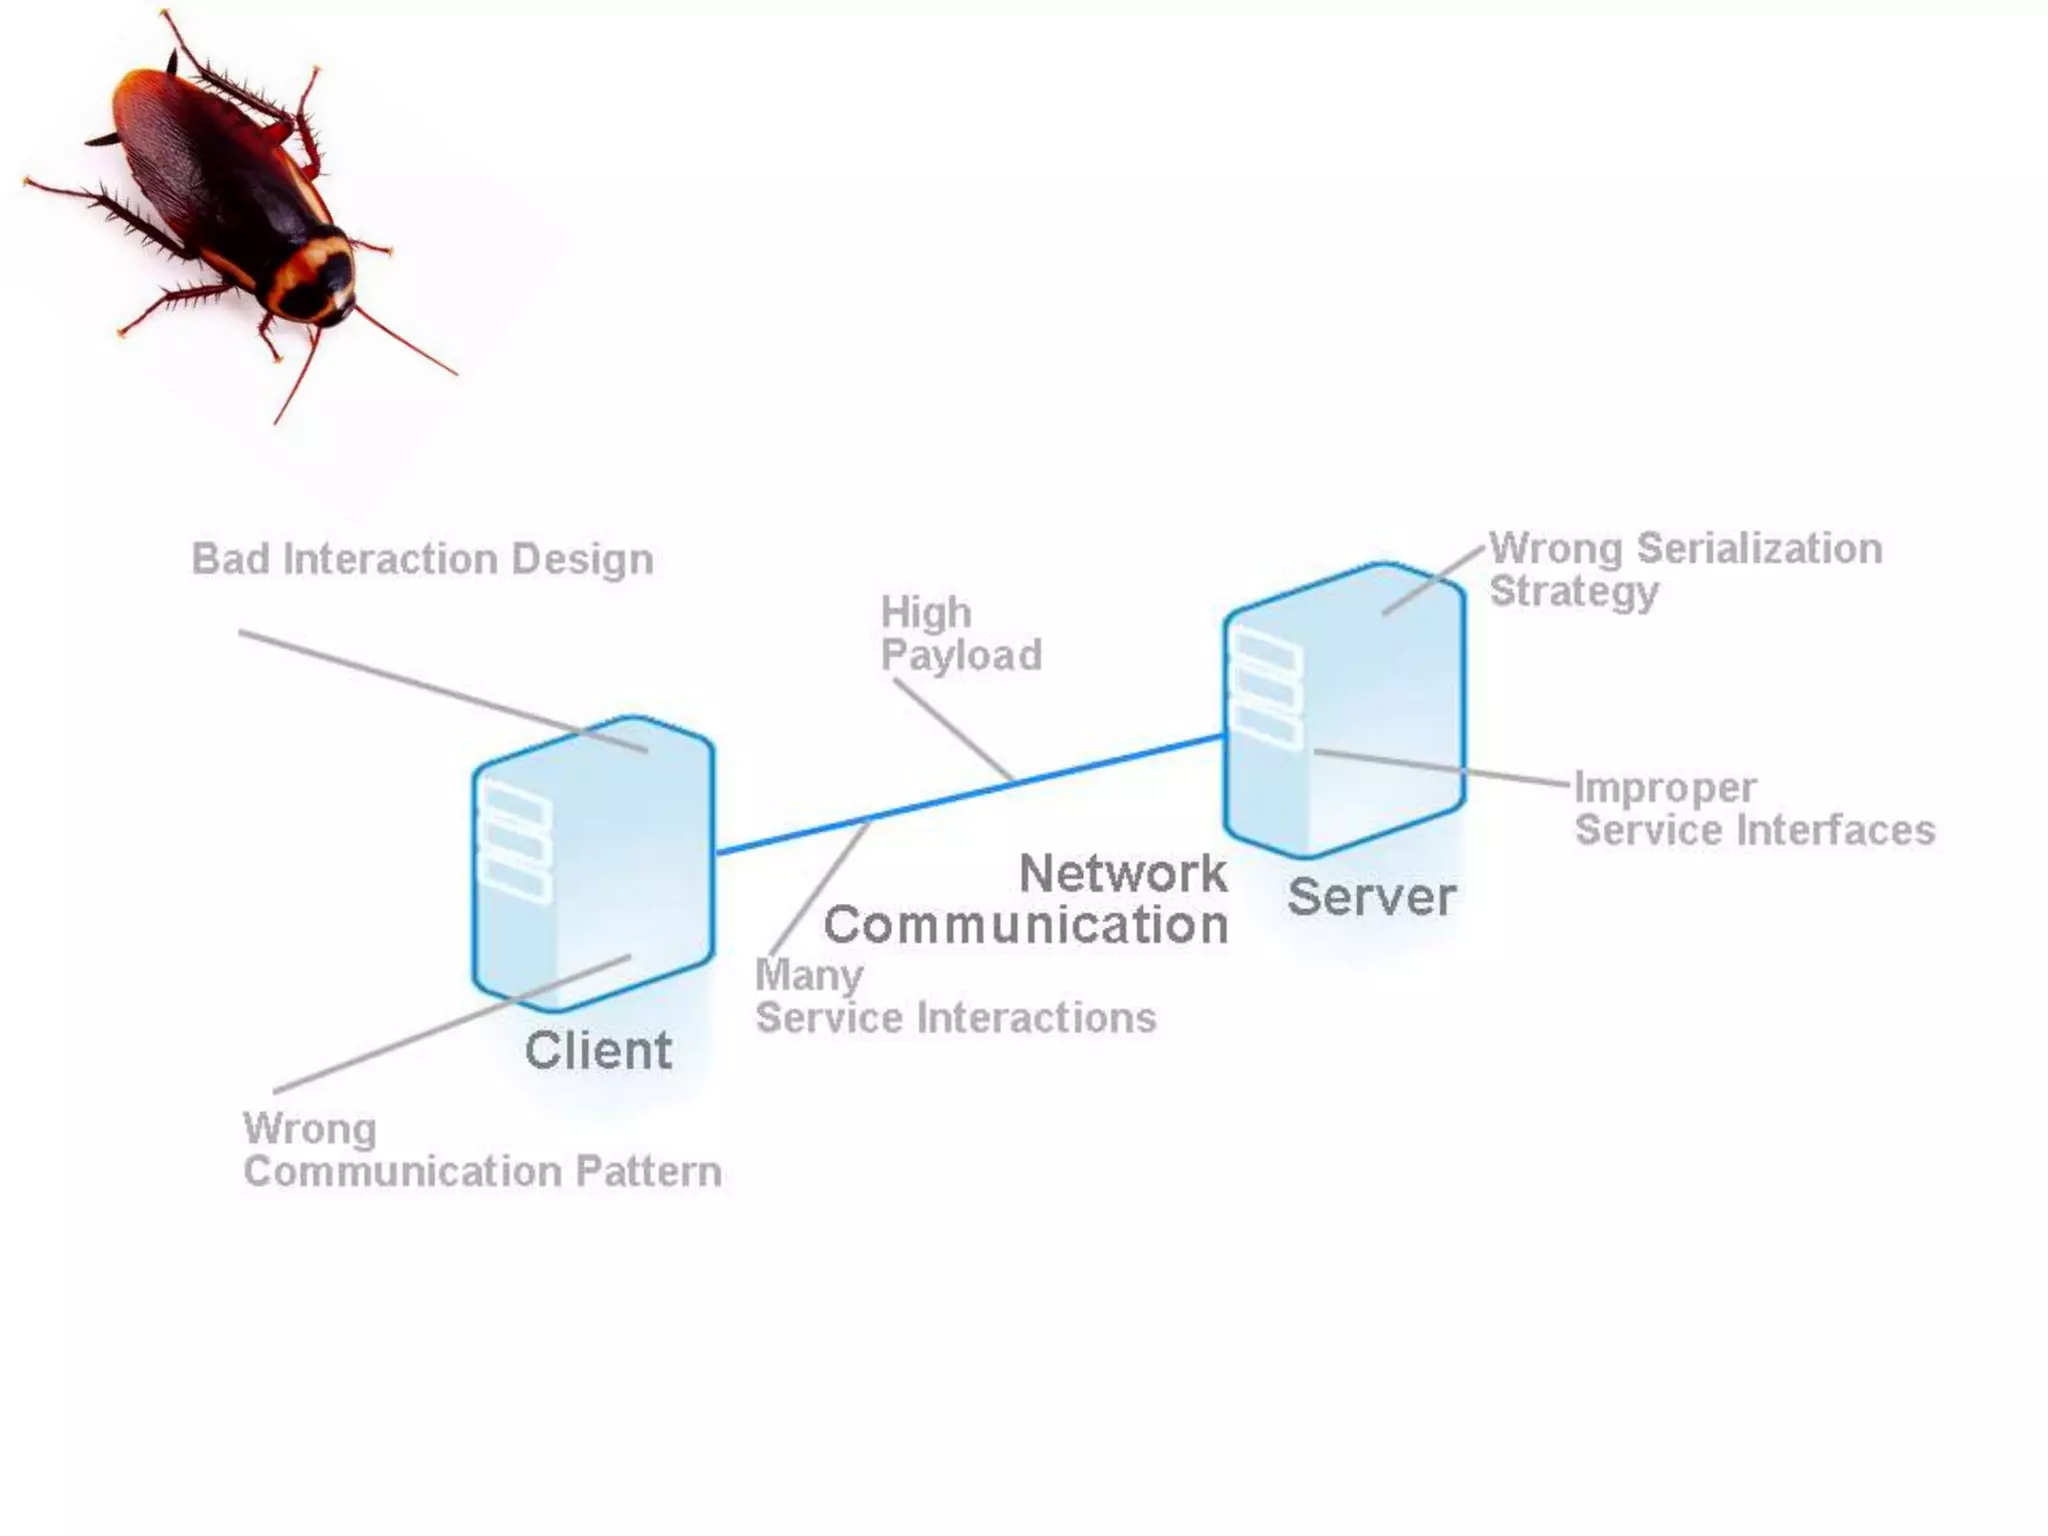
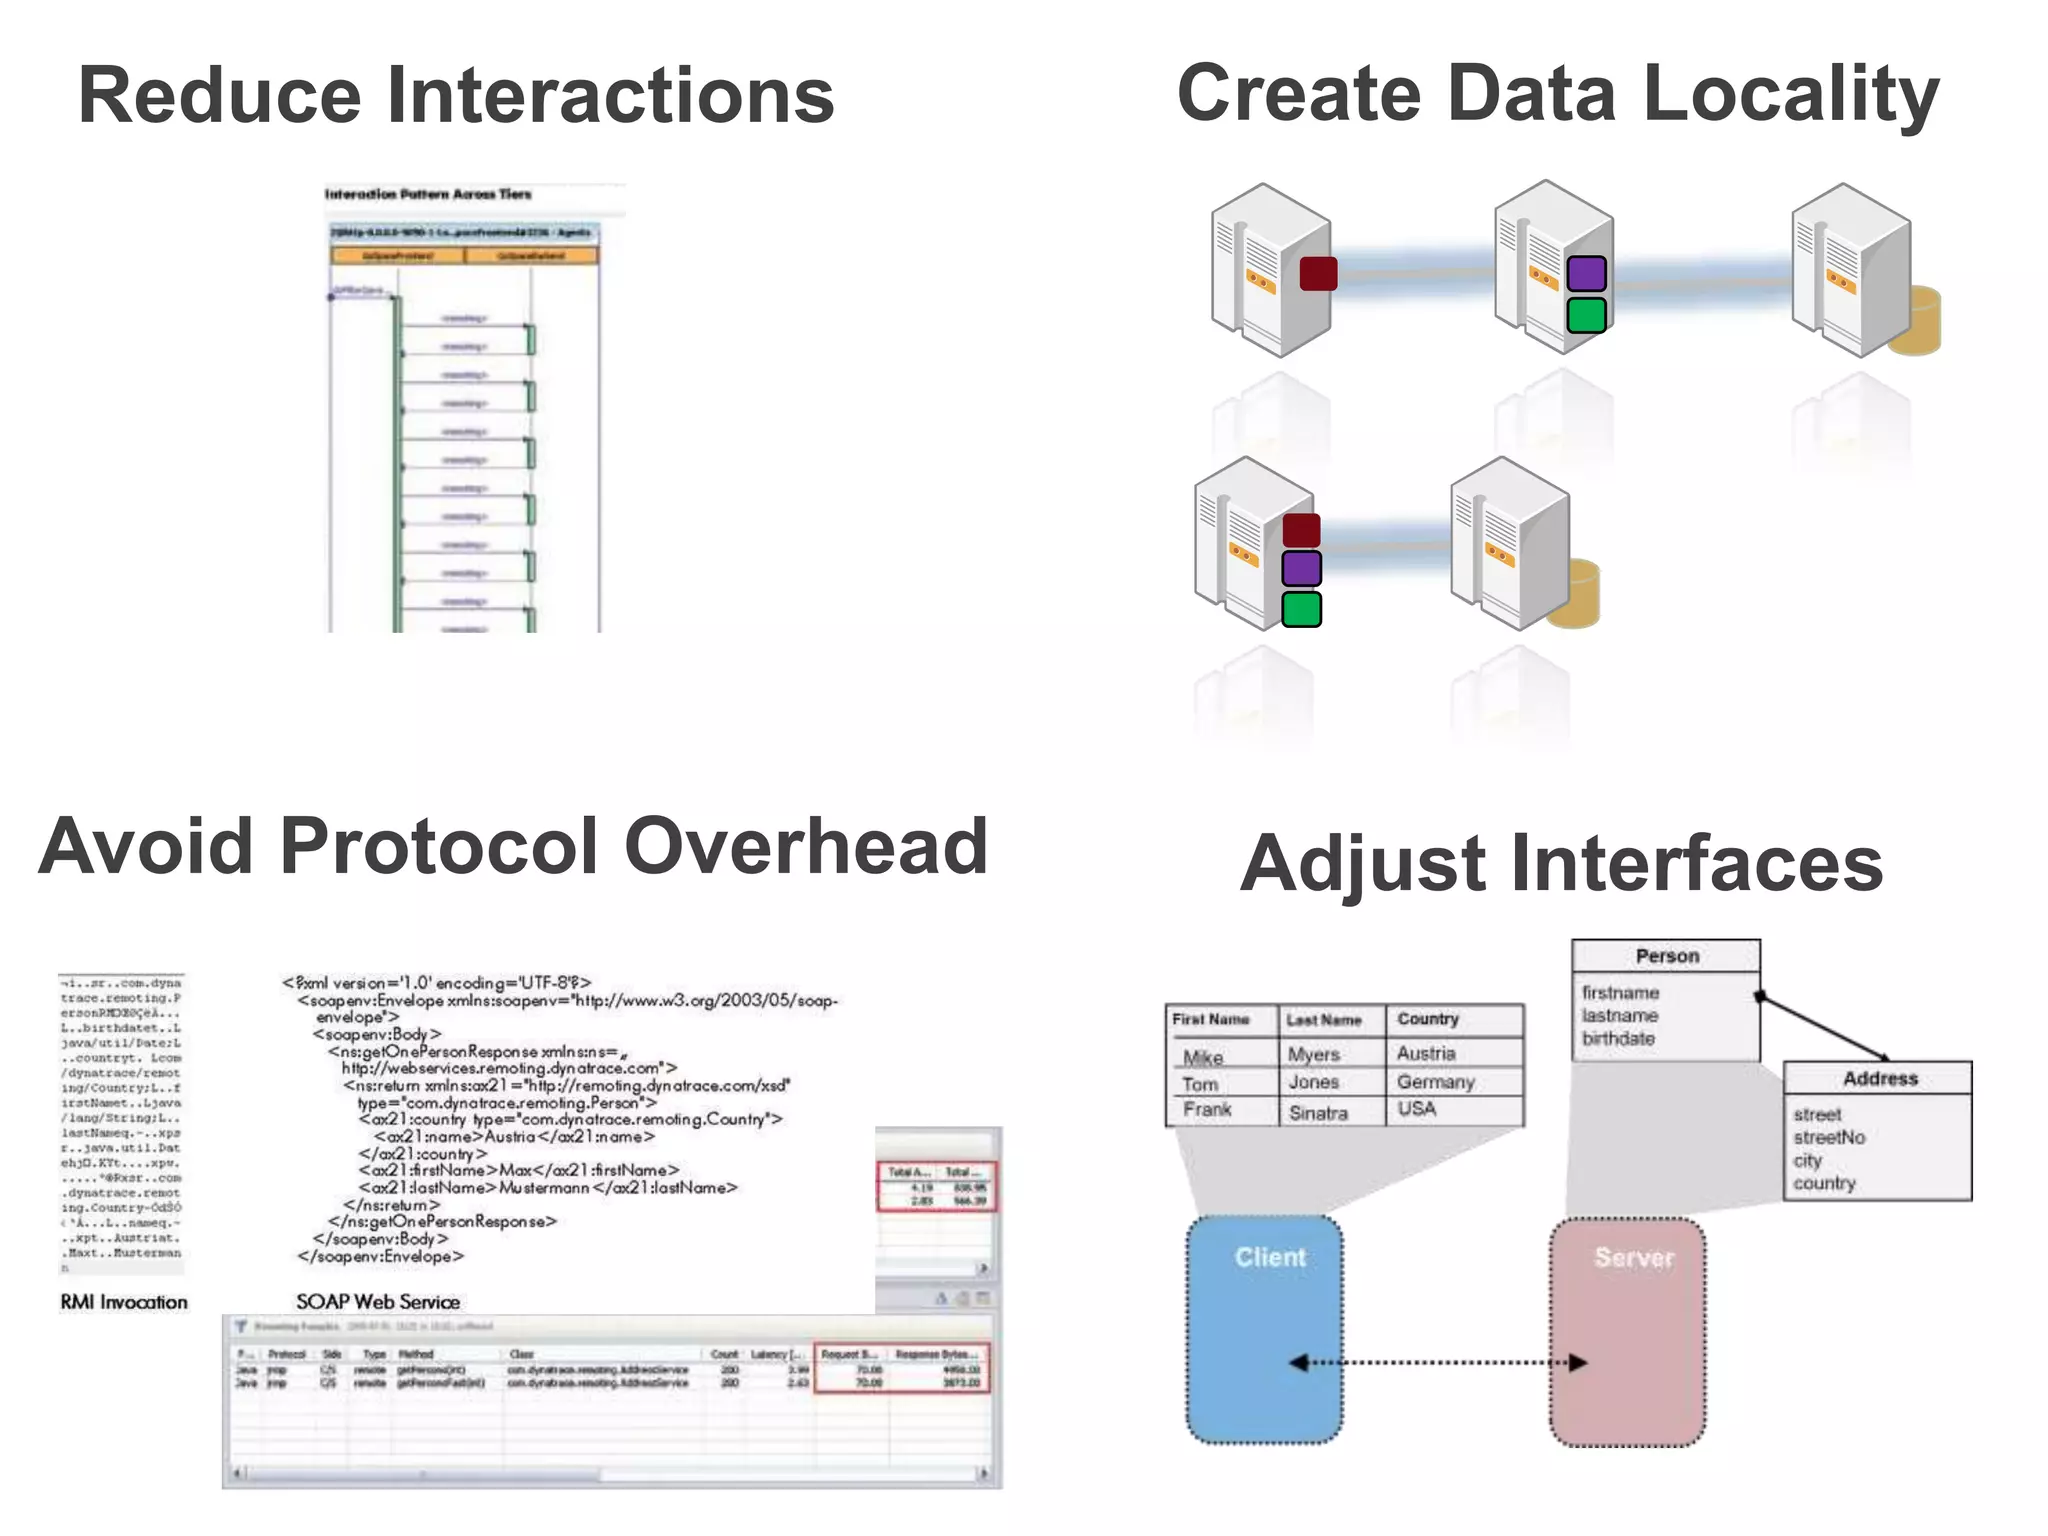
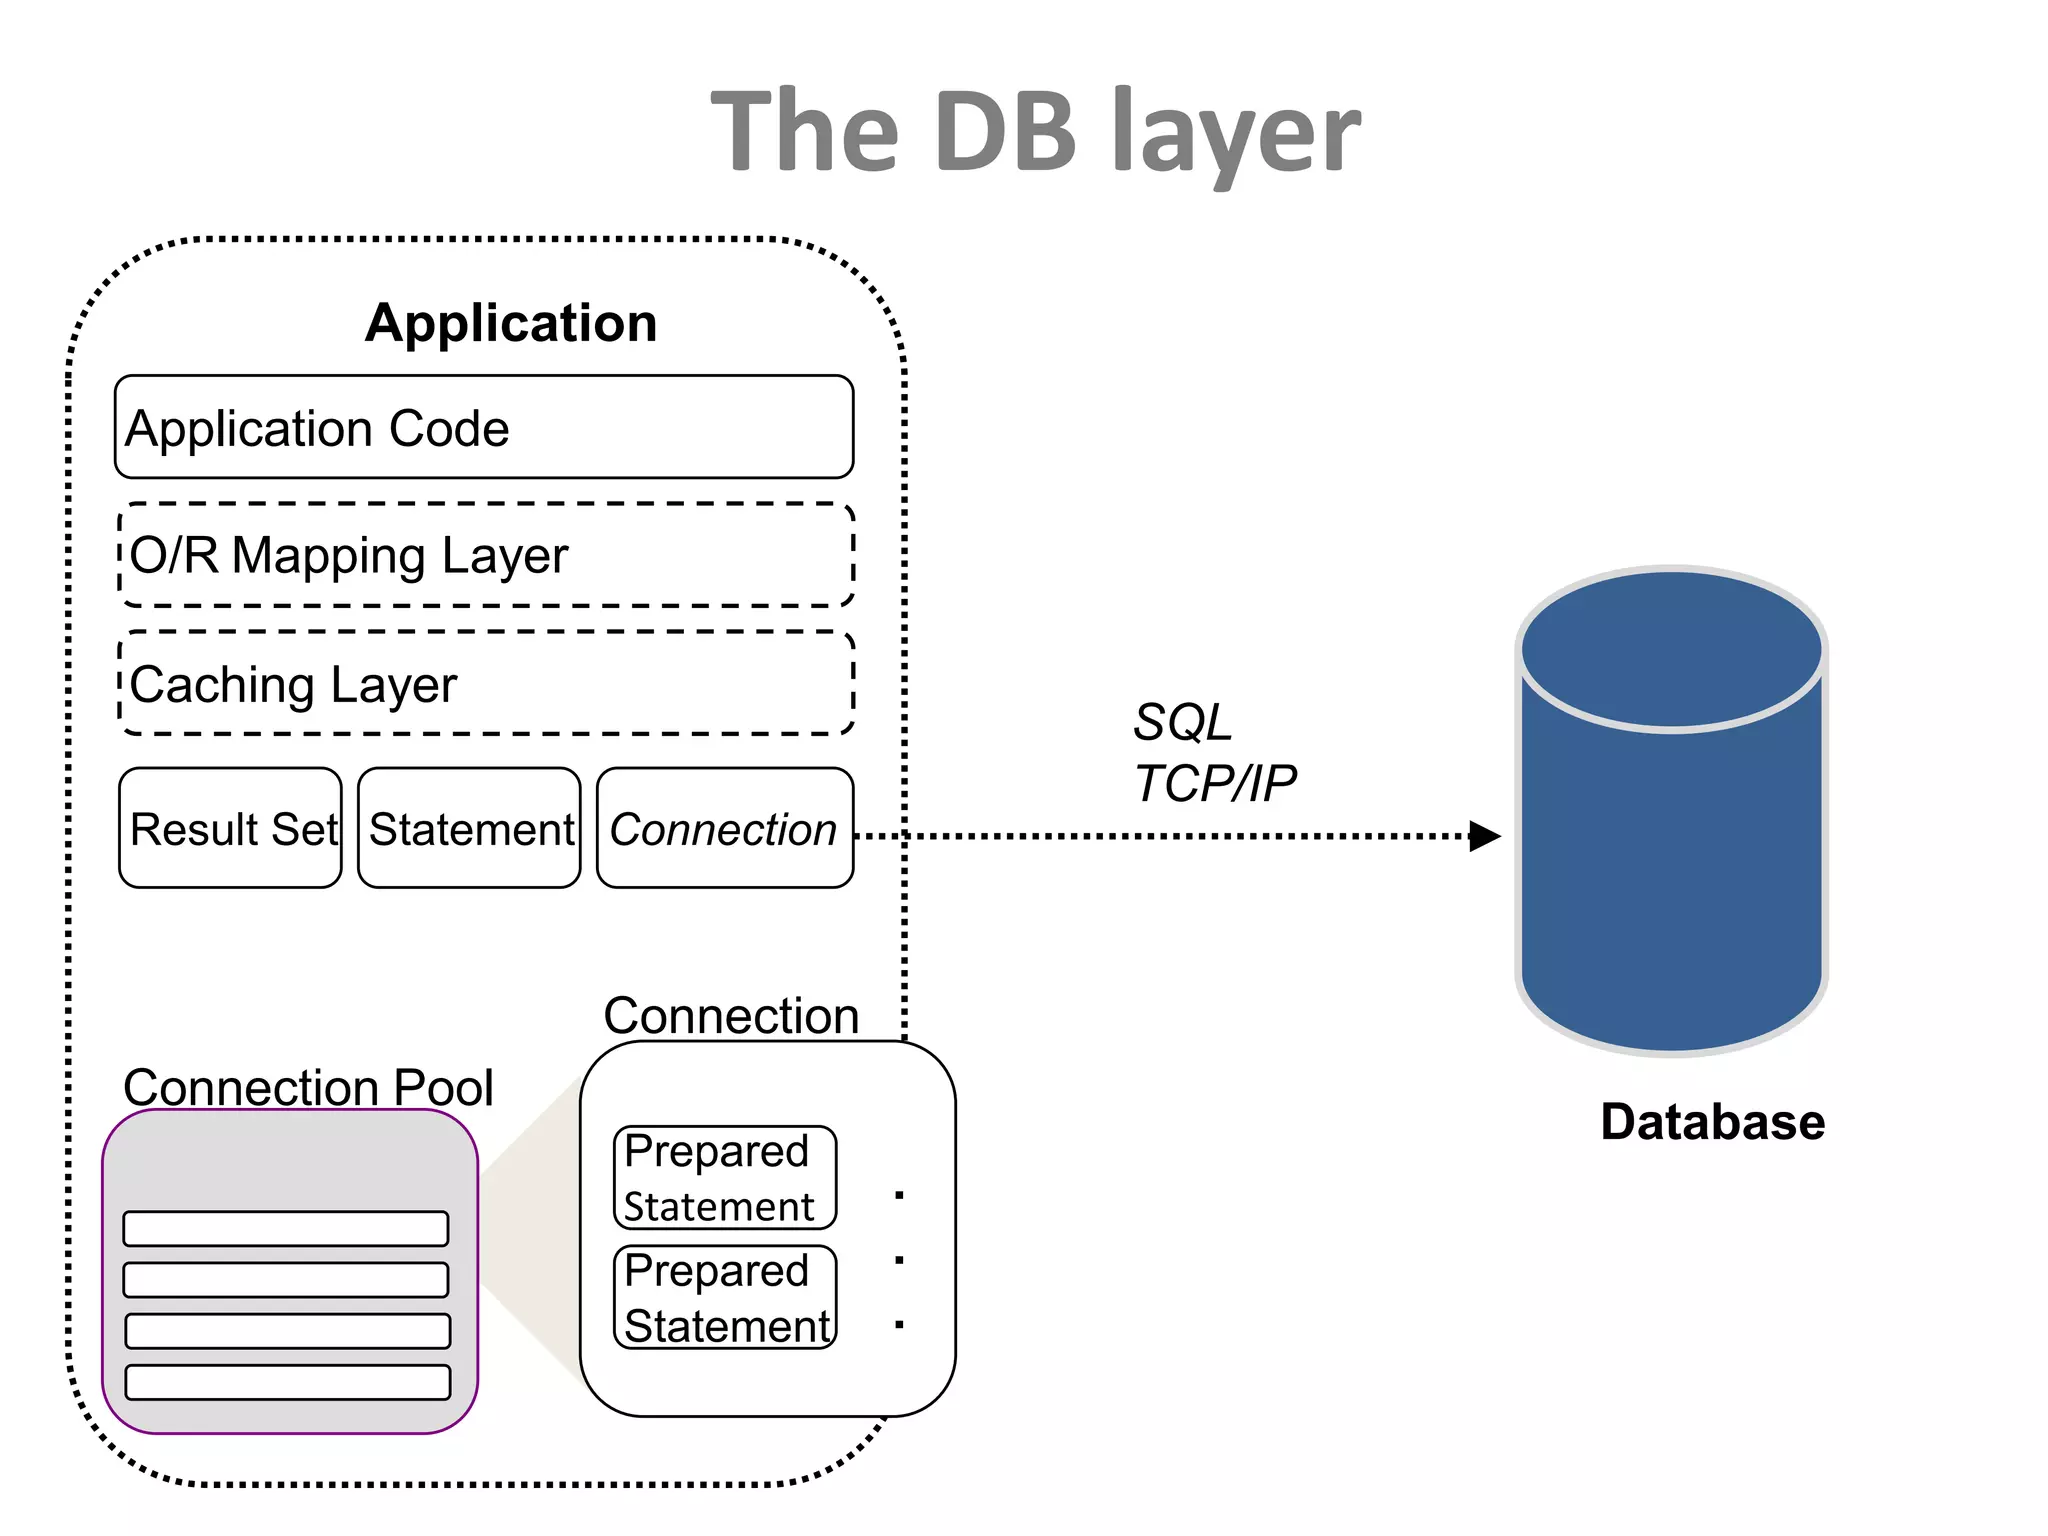
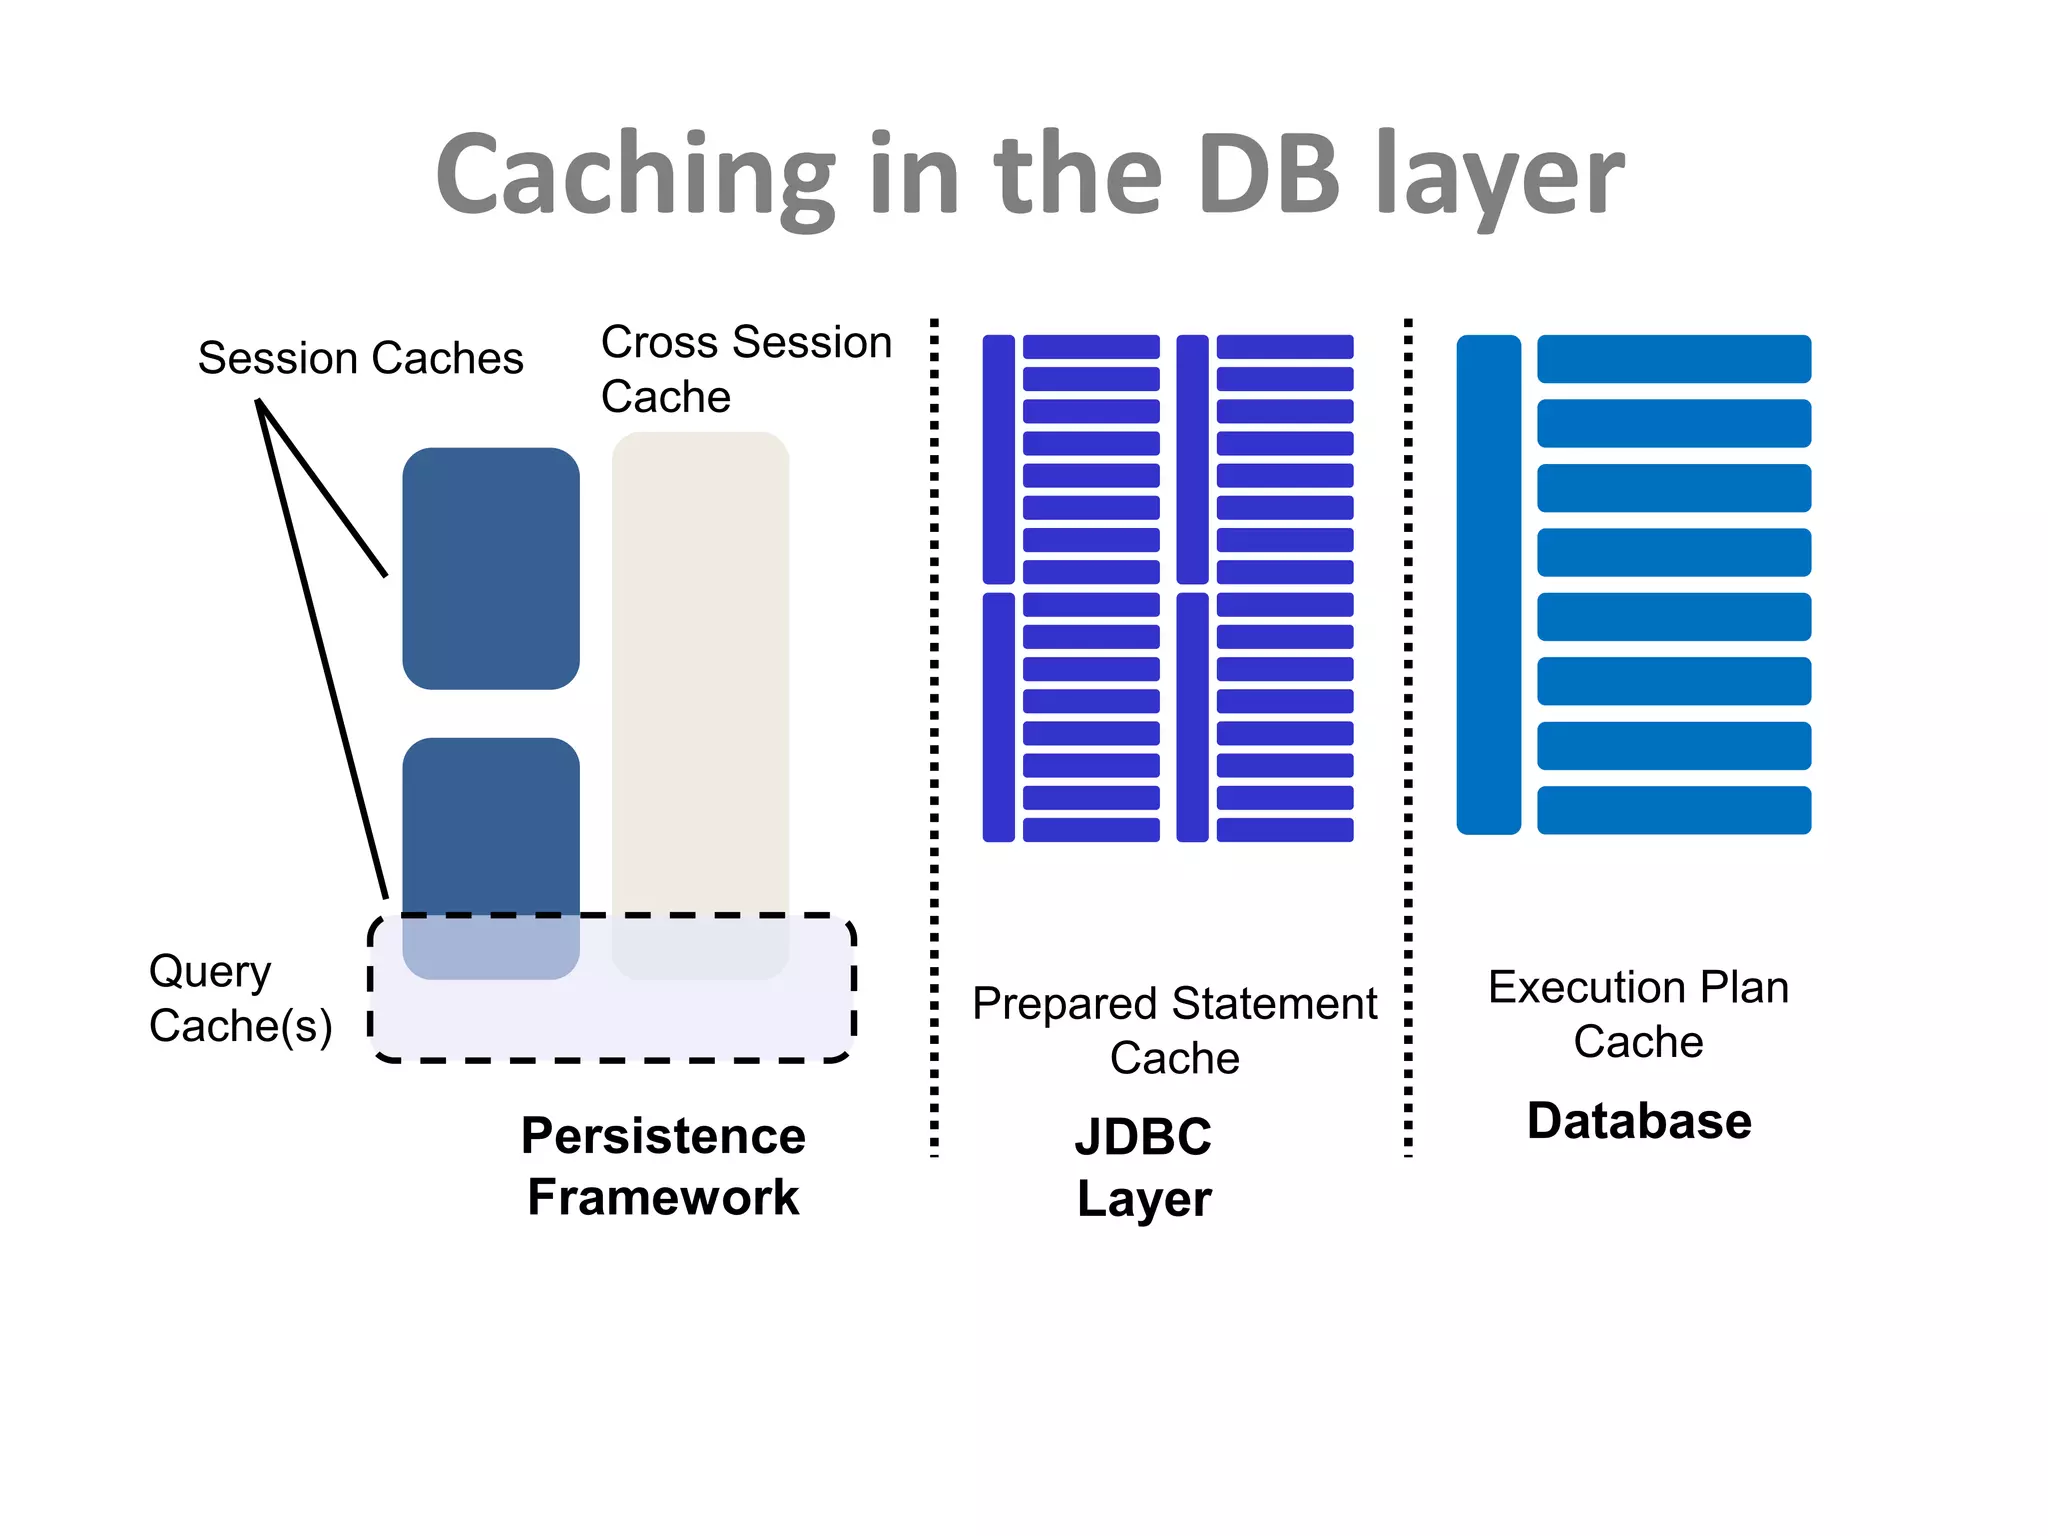
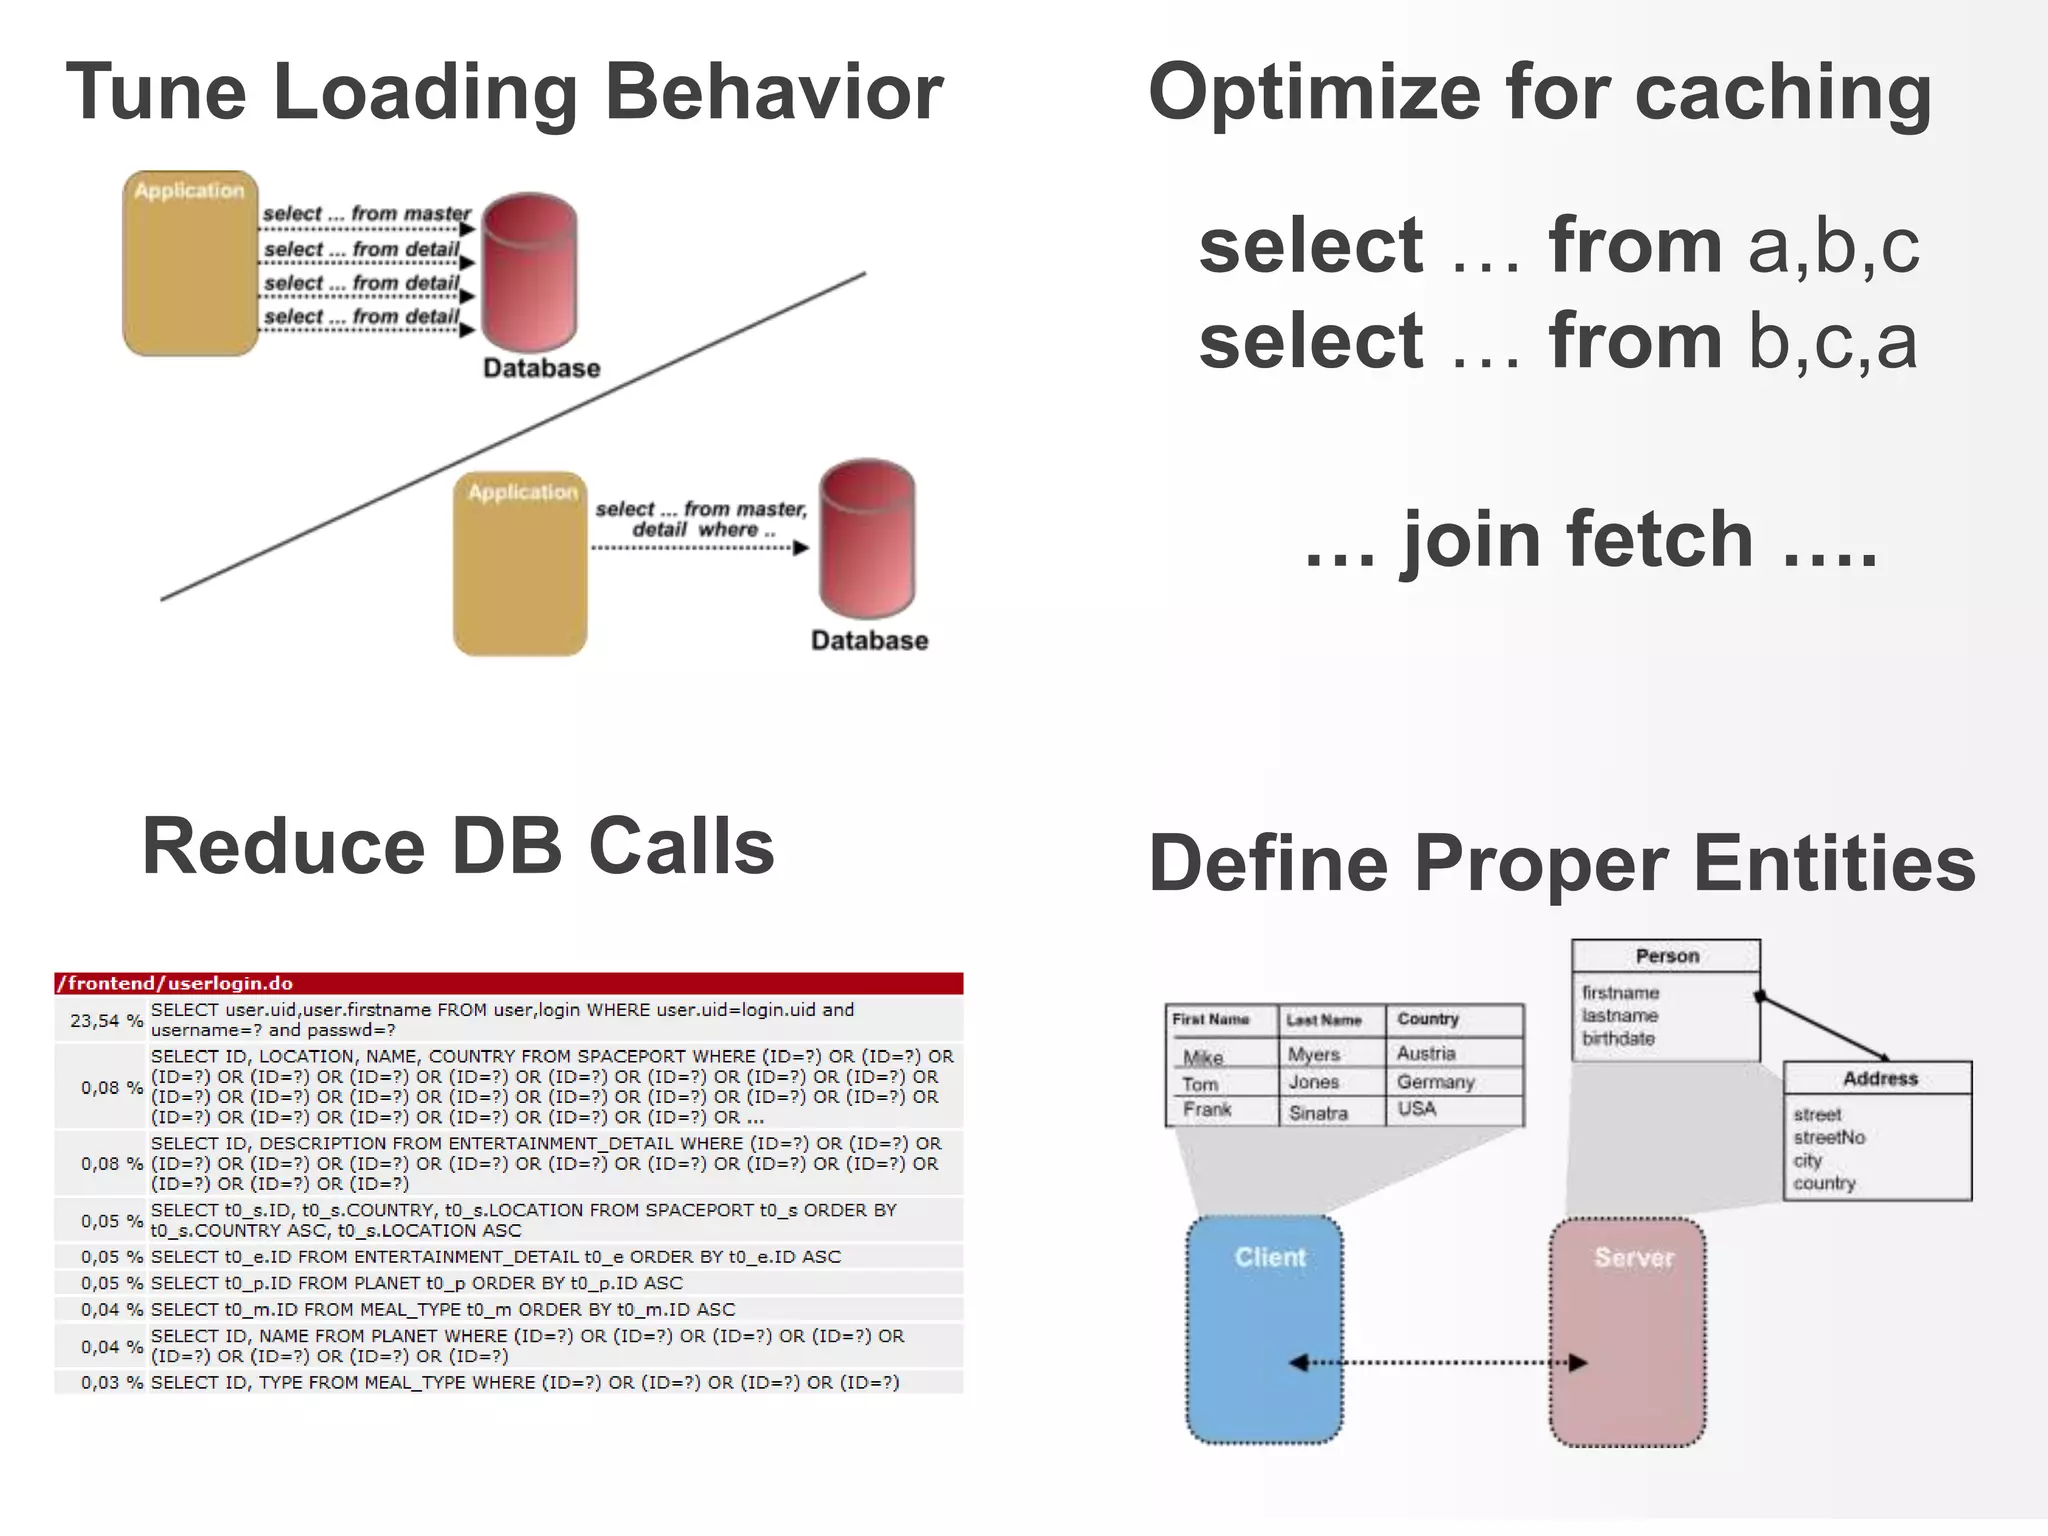
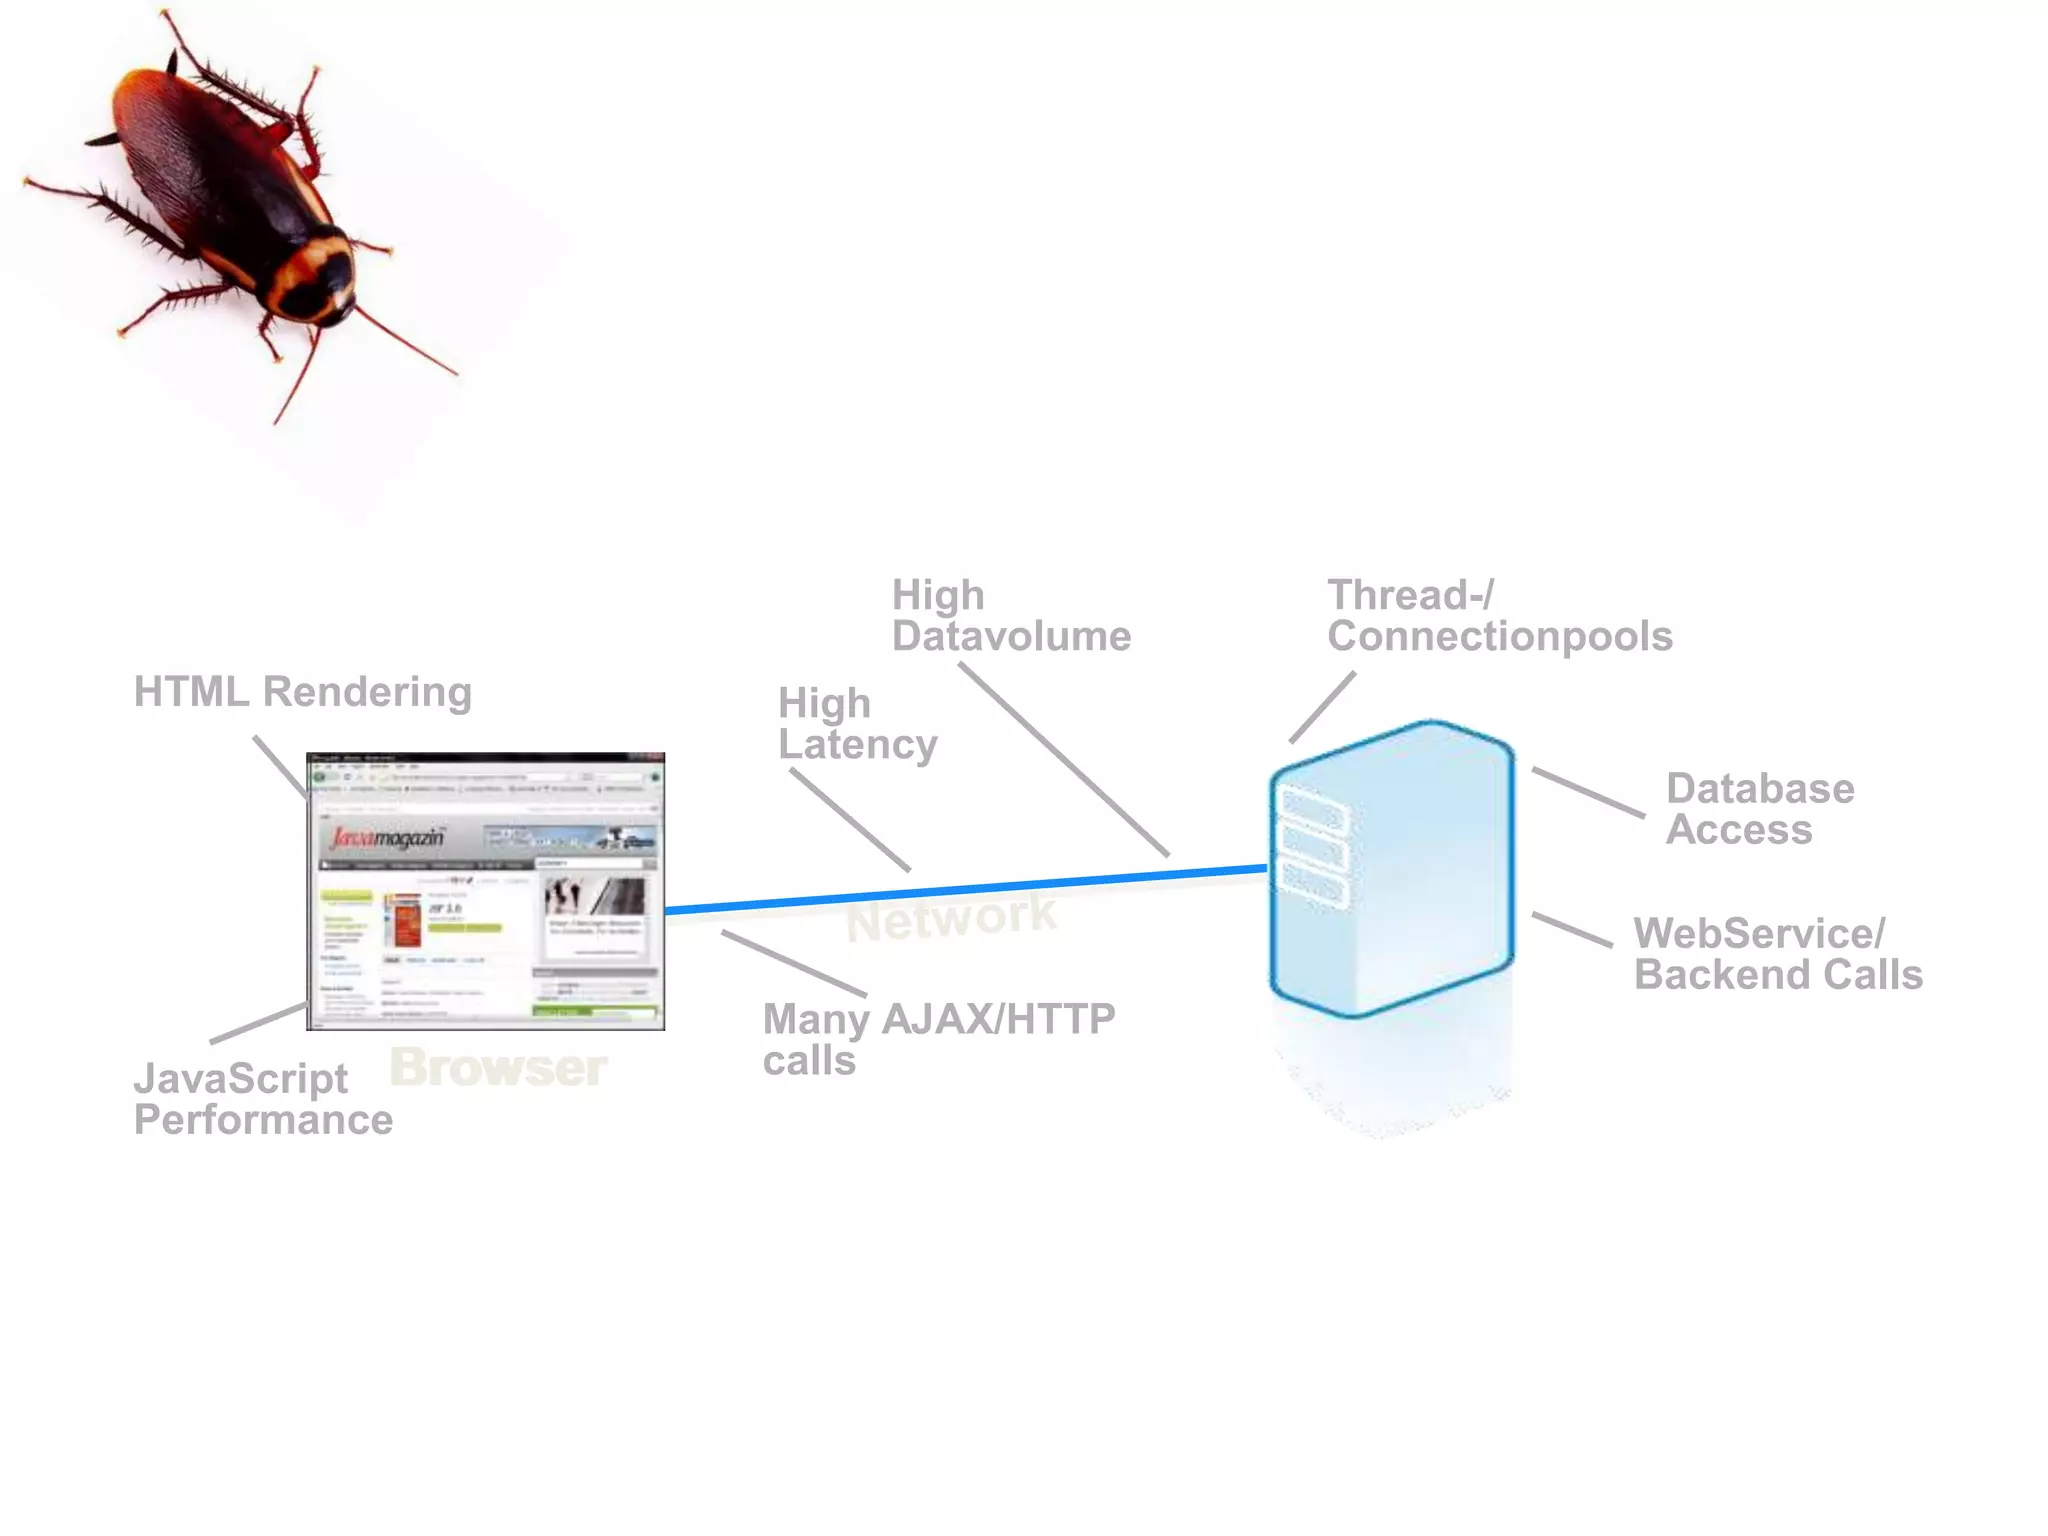
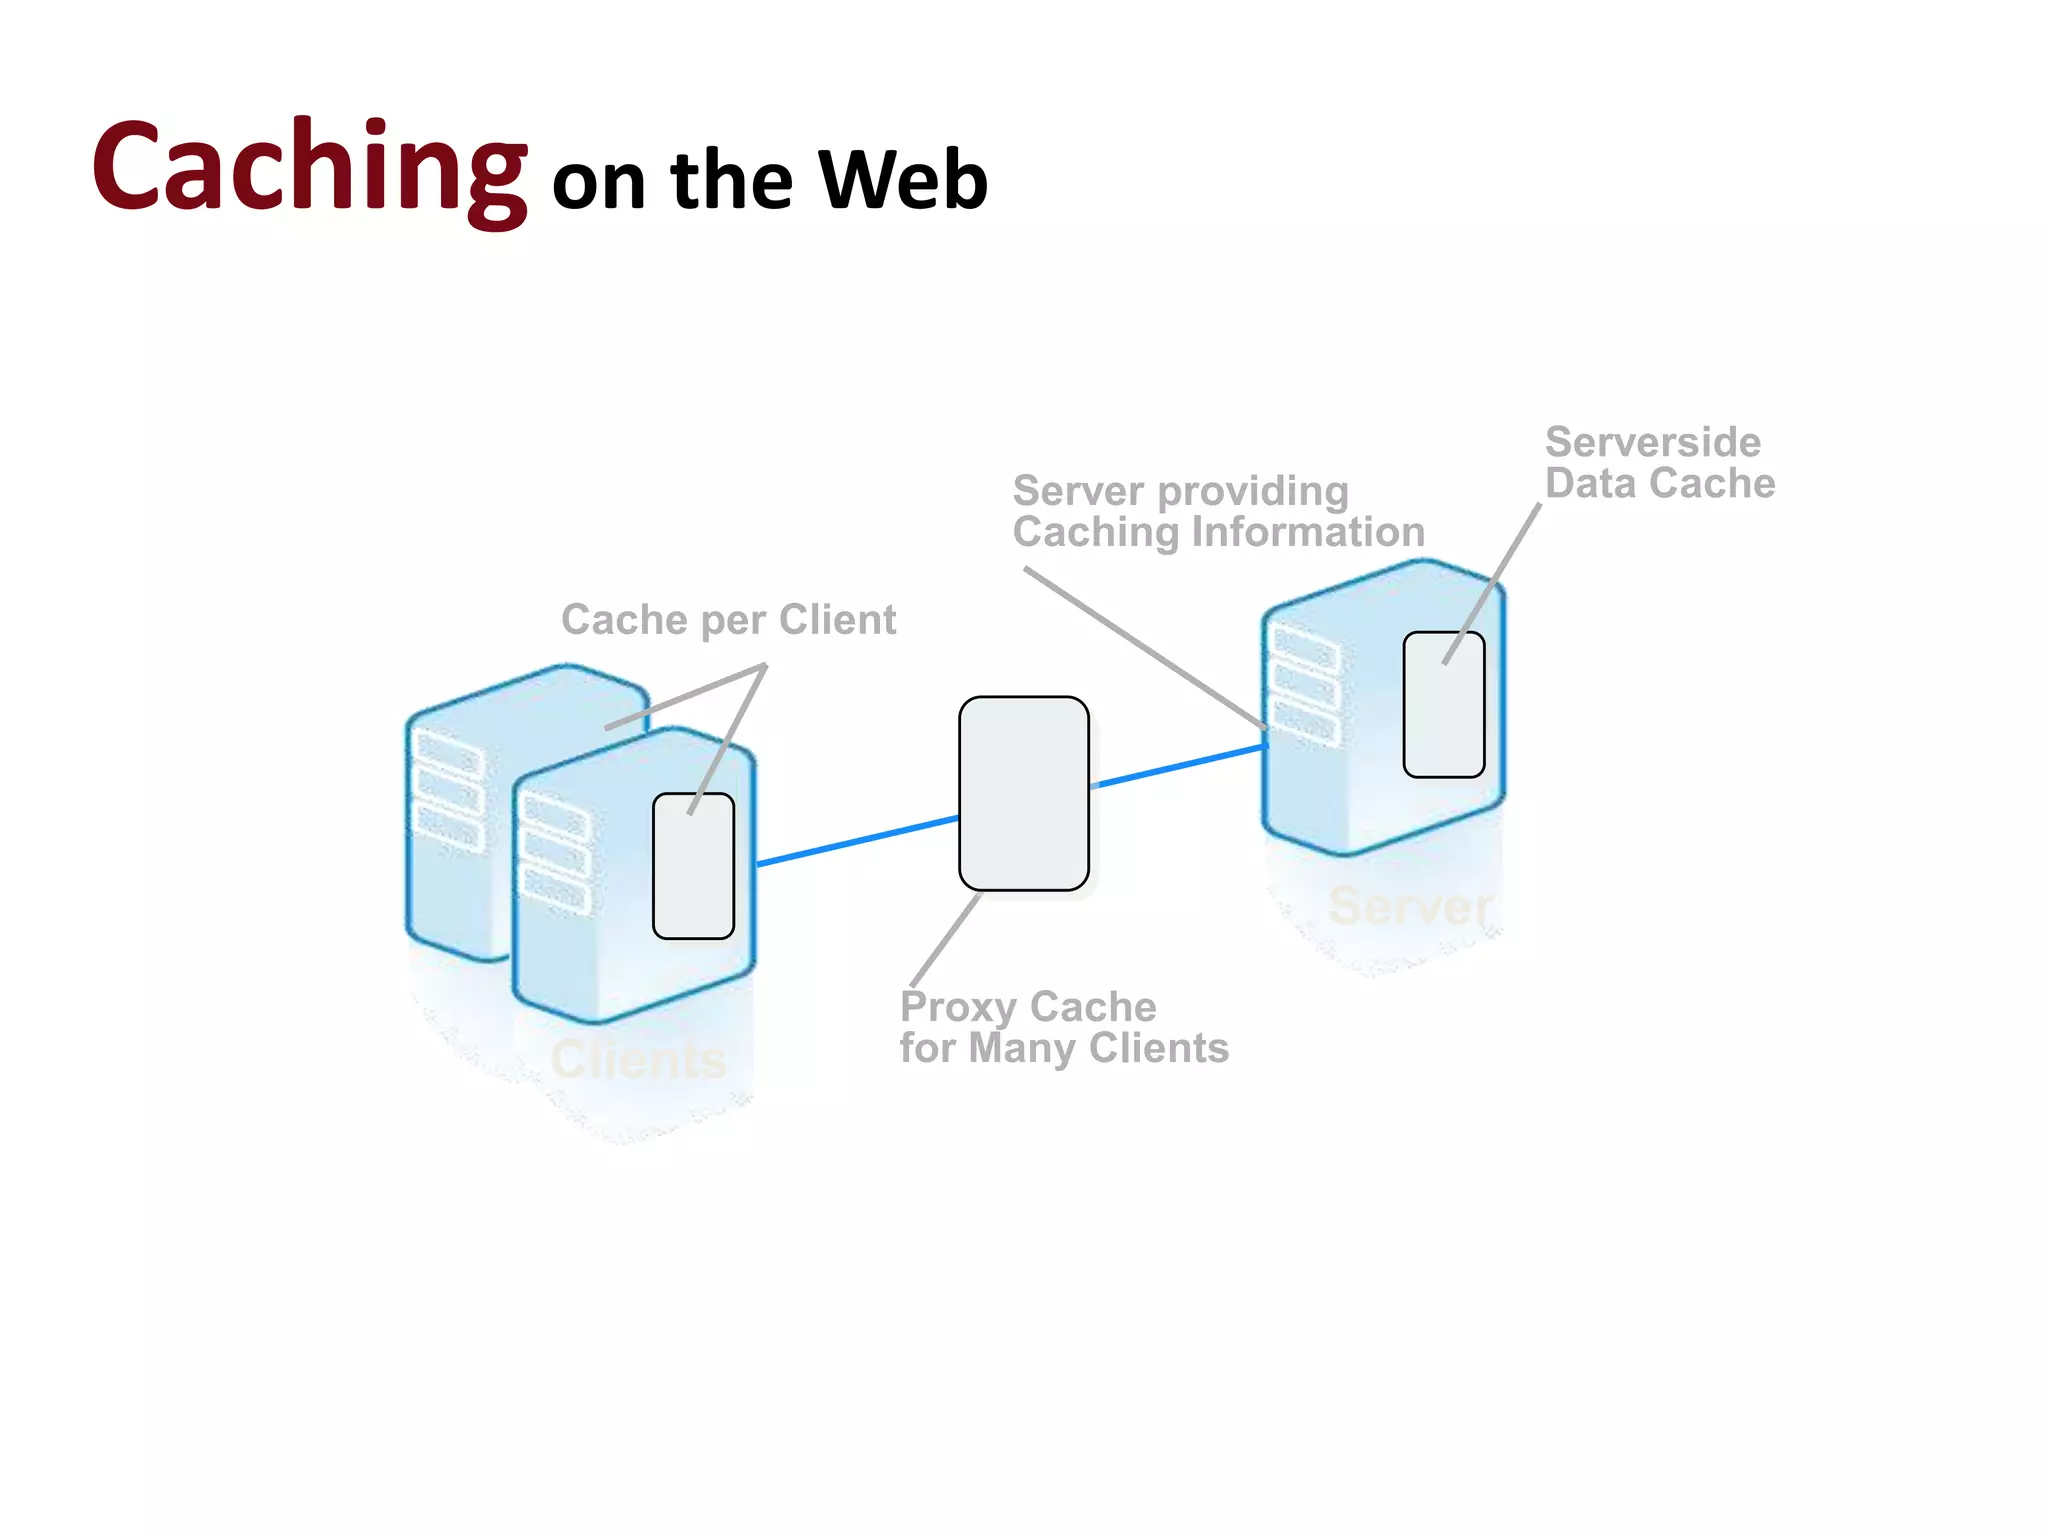
Microservices are a great way to design your system so that it can scale. But once those pieces are in production, how do you know if all the different pieces are working properly? Are some metrics more important than others, and what story can each of the metrics tell you? This talk shows you some tools and techniques to monitor distributed systems
How fast does a web page need to be in a certain industry. Learn about the characteristics of retail, travel and media sites. See what makes them fast or slow.
The definition of normal - An introduction and guide to anomaly detection. Alois Reitbauer
What is normal behaviour?
How are expectations about future behaviour derived from data?
How do anomaly detection algorithms work including trending and seasonality?
How do these algorithms know whether something is an anomaly?
Which algorithms can be used for which type of data?
Micro Services provide a means to build more flexible infrastructures that can maintained by large and distributed teams. Micro Deployments allow us to constantly evolve our applications step by step in small increments constantly. These paradigms helps us to achieve more agility. At the same time the force us to rethink how we run our DevOps processes. This talk covers the key requirements for DevOps follow the Site Reliability Engineering approach
We all know not to poke at alien life forms in another planet, right? But what about metrics, do you know how to pick, measure and draw conclusions from them? In this talk we will cover various Site Reliability Engineering topics, such as SLIs and SLOs while we explore real life examples of defining and implementing metrics in a system with examples using Prometheus, an open-source system monitoring and alert platform, to demonstrate implementation. Let's get back to some real science.
Flink Forward San Francisco 2018: David Reniz & Dahyr Vergara - "Real-time m...Flink Forward
“Customer experience is the next big battle ground for telcos,” proclaimed recently Amit Akhelikar, Global Director of Lynx Analytics at TM Forum Live! Asia in Singapore. But, how to fight in this battle? A common approach has been to keep “under control” some well-known network quality indicators, like dropped calls, radio access congestion, availability, and so on; but this has proven not to be enough to keep customers happy, like a siege weapon is not enough to conquer a city. But, what if it were possible to know how customers perceive services, at least most demanded ones, like web browsing or video streaming? That would be like a squad of archers ready to battle. And even having that, how to extract value of it and take actions in no time, giving our skilled archers the right targets? Meet CANVAS (Customer And Network Visualization and AnaltyticS), one of the first LATAM implementations of a Flink-based stream processing use case for a telco, which successfully combines leading and innovative technologies like Apache Hadoop, YARN, Kafka, Nifi, Druid and advanced visualizations with Flink core features like non-trivial stateful stream processing (joins, windows and aggregations on event time) and CEP capabilities for alarm generation, delivering a next-generation tool for SOC (Service Operation Center) teams.
DIY guide to runbooks, incident reports, and incident responseNathan Case
In this session, we explore the cost of incidents and consider creative ways to look at future threats. We walk you through the threat landscape, looking at what has happened over the last year. Learn about the best open-source tools to have in your security arsenal now and in the future to help you detect and deal with the threats of today and tomorrow. Finally, learn how to identify where these threats are coming from and how to detect them more easily. The information in this session is provided by various teams and sources
Starting Your DevOps Journey – Practical Tips for OpsDynatrace
To watch, please see:
https://info.dynatrace.com/apm_wc_getting_started_with_devops_na_registration.html
Starting Your DevOps Journey: Practical Tips for Ops
In this webinar, Andreas Grabner, Chief DevOps Activist at Dynatrace, shares practical tips that all IT groups from Dev to Ops can use to start their DevOps journey quickly. With experience from hundreds of DevOps deployments, Andi provides insights it would take your team months or years to learn firsthand.
- Learn how everyone on your Ops team can use APM to better understand and monitor SLAs, Performance and End User Impact of their applications.
- Foster better collaboration between Ops and architects by extending basic system monitoring to monolith and microservices architectures.
- Shift-left your testing and QA by working with metrics that you and the architects agreed on up front, resulting in early relevant feedback and faster code deployments.
- Hear why changing the cultural mindset from “fear of change” to “Continuous Innovation and Optimization” is critical for success.
Andi is joined by guest speaker, Brian Chandler, Systems Engineer at Raymond James, who shares commonly used Ops dashboards that increase collaboration across IT teams and pro-actively break down silos!
We all know not to poke at alien life forms in another planet, right? But what about metrics, do you know how to pick, measure and draw conclusions from them? In this talk we will cover various Site Reliability Engineering topics, such as SLIs and SLOs while we explore real life examples of defining and implementing metrics in a system with examples using Prometheus, an open-source system monitoring and alert platform, to demonstrate implementation. Let's get back to some real science.
You know that performance is crucial to your company's success, but do the people in the corner office know this? You need to get the message across using the language they speak and targeting the goals they care about.
This session -- presented by Strangeloop president Joshua Bixby at the 2011 Web Performance Summit -- summarizes the benefits of a faster website or web app, then delves into a series of how-tos for creating a business case for web performance in your organization.
For the Computer Measurement Group workshop in San Diego November 2013. Also presented to a student class at UC Santa Barbara. What is Cloud Native. Capacity and Performance benchmarks. Cost Optimization Techniques - content co-developed with Jinesh Varia of AWS.
Similar to Performance Forensics - Understanding Application Performance (20)
Ajax applications are different to classical web applications. This presentation covers performance relevant aspects architectures should consider when building ajax applications
Epistemic Interaction - tuning interfaces to provide information for AI supportAlan Dix
Paper presented at SYNERGY workshop at AVI 2024, Genoa, Italy. 3rd June 2024
https://alandix.com/academic/papers/synergy2024-epistemic/
As machine learning integrates deeper into human-computer interactions, the concept of epistemic interaction emerges, aiming to refine these interactions to enhance system adaptability. This approach encourages minor, intentional adjustments in user behaviour to enrich the data available for system learning. This paper introduces epistemic interaction within the context of human-system communication, illustrating how deliberate interaction design can improve system understanding and adaptation. Through concrete examples, we demonstrate the potential of epistemic interaction to significantly advance human-computer interaction by leveraging intuitive human communication strategies to inform system design and functionality, offering a novel pathway for enriching user-system engagements.
Essentials of Automations: Optimizing FME Workflows with ParametersSafe Software
Are you looking to streamline your workflows and boost your projects’ efficiency? Do you find yourself searching for ways to add flexibility and control over your FME workflows? If so, you’re in the right place.
Join us for an insightful dive into the world of FME parameters, a critical element in optimizing workflow efficiency. This webinar marks the beginning of our three-part “Essentials of Automation” series. This first webinar is designed to equip you with the knowledge and skills to utilize parameters effectively: enhancing the flexibility, maintainability, and user control of your FME projects.
Here’s what you’ll gain:
- Essentials of FME Parameters: Understand the pivotal role of parameters, including Reader/Writer, Transformer, User, and FME Flow categories. Discover how they are the key to unlocking automation and optimization within your workflows.
- Practical Applications in FME Form: Delve into key user parameter types including choice, connections, and file URLs. Allow users to control how a workflow runs, making your workflows more reusable. Learn to import values and deliver the best user experience for your workflows while enhancing accuracy.
- Optimization Strategies in FME Flow: Explore the creation and strategic deployment of parameters in FME Flow, including the use of deployment and geometry parameters, to maximize workflow efficiency.
- Pro Tips for Success: Gain insights on parameterizing connections and leveraging new features like Conditional Visibility for clarity and simplicity.
We’ll wrap up with a glimpse into future webinars, followed by a Q&A session to address your specific questions surrounding this topic.
Don’t miss this opportunity to elevate your FME expertise and drive your projects to new heights of efficiency.
JMeter webinar - integration with InfluxDB and GrafanaRTTS
Watch this recorded webinar about real-time monitoring of application performance. See how to integrate Apache JMeter, the open-source leader in performance testing, with InfluxDB, the open-source time-series database, and Grafana, the open-source analytics and visualization application.
In this webinar, we will review the benefits of leveraging InfluxDB and Grafana when executing load tests and demonstrate how these tools are used to visualize performance metrics.
Length: 30 minutes
Session Overview
-------------------------------------------
During this webinar, we will cover the following topics while demonstrating the integrations of JMeter, InfluxDB and Grafana:
- What out-of-the-box solutions are available for real-time monitoring JMeter tests?
- What are the benefits of integrating InfluxDB and Grafana into the load testing stack?
- Which features are provided by Grafana?
- Demonstration of InfluxDB and Grafana using a practice web application
To view the webinar recording, go to:
https://www.rttsweb.com/jmeter-integration-webinar
Dev Dives: Train smarter, not harder – active learning and UiPath LLMs for do...UiPathCommunity
💥 Speed, accuracy, and scaling – discover the superpowers of GenAI in action with UiPath Document Understanding and Communications Mining™:
See how to accelerate model training and optimize model performance with active learning
Learn about the latest enhancements to out-of-the-box document processing – with little to no training required
Get an exclusive demo of the new family of UiPath LLMs – GenAI models specialized for processing different types of documents and messages
This is a hands-on session specifically designed for automation developers and AI enthusiasts seeking to enhance their knowledge in leveraging the latest intelligent document processing capabilities offered by UiPath.
Speakers:
👨🏫 Andras Palfi, Senior Product Manager, UiPath
👩🏫 Lenka Dulovicova, Product Program Manager, UiPath
Neuro-symbolic is not enough, we need neuro-*semantic*Frank van Harmelen
Neuro-symbolic (NeSy) AI is on the rise. However, simply machine learning on just any symbolic structure is not sufficient to really harvest the gains of NeSy. These will only be gained when the symbolic structures have an actual semantics. I give an operational definition of semantics as “predictable inference”.
All of this illustrated with link prediction over knowledge graphs, but the argument is general.
GDG Cloud Southlake #33: Boule & Rebala: Effective AppSec in SDLC using Deplo...James Anderson
Effective Application Security in Software Delivery lifecycle using Deployment Firewall and DBOM
The modern software delivery process (or the CI/CD process) includes many tools, distributed teams, open-source code, and cloud platforms. Constant focus on speed to release software to market, along with the traditional slow and manual security checks has caused gaps in continuous security as an important piece in the software supply chain. Today organizations feel more susceptible to external and internal cyber threats due to the vast attack surface in their applications supply chain and the lack of end-to-end governance and risk management.
The software team must secure its software delivery process to avoid vulnerability and security breaches. This needs to be achieved with existing tool chains and without extensive rework of the delivery processes. This talk will present strategies and techniques for providing visibility into the true risk of the existing vulnerabilities, preventing the introduction of security issues in the software, resolving vulnerabilities in production environments quickly, and capturing the deployment bill of materials (DBOM).
Speakers:
Bob Boule
Robert Boule is a technology enthusiast with PASSION for technology and making things work along with a knack for helping others understand how things work. He comes with around 20 years of solution engineering experience in application security, software continuous delivery, and SaaS platforms. He is known for his dynamic presentations in CI/CD and application security integrated in software delivery lifecycle.
Gopinath Rebala
Gopinath Rebala is the CTO of OpsMx, where he has overall responsibility for the machine learning and data processing architectures for Secure Software Delivery. Gopi also has a strong connection with our customers, leading design and architecture for strategic implementations. Gopi is a frequent speaker and well-known leader in continuous delivery and integrating security into software delivery.
Securing your Kubernetes cluster_ a step-by-step guide to success !KatiaHIMEUR1
Today, after several years of existence, an extremely active community and an ultra-dynamic ecosystem, Kubernetes has established itself as the de facto standard in container orchestration. Thanks to a wide range of managed services, it has never been so easy to set up a ready-to-use Kubernetes cluster.
However, this ease of use means that the subject of security in Kubernetes is often left for later, or even neglected. This exposes companies to significant risks.
In this talk, I'll show you step-by-step how to secure your Kubernetes cluster for greater peace of mind and reliability.
Connector Corner: Automate dynamic content and events by pushing a buttonDianaGray10
Here is something new! In our next Connector Corner webinar, we will demonstrate how you can use a single workflow to:
Create a campaign using Mailchimp with merge tags/fields
Send an interactive Slack channel message (using buttons)
Have the message received by managers and peers along with a test email for review
But there’s more:
In a second workflow supporting the same use case, you’ll see:
Your campaign sent to target colleagues for approval
If the “Approve” button is clicked, a Jira/Zendesk ticket is created for the marketing design team
But—if the “Reject” button is pushed, colleagues will be alerted via Slack message
Join us to learn more about this new, human-in-the-loop capability, brought to you by Integration Service connectors.
And...
Speakers:
Akshay Agnihotri, Product Manager
Charlie Greenberg, Host
Accelerate your Kubernetes clusters with Varnish CachingThijs Feryn
A presentation about the usage and availability of Varnish on Kubernetes. This talk explores the capabilities of Varnish caching and shows how to use the Varnish Helm chart to deploy it to Kubernetes.
This presentation was delivered at K8SUG Singapore. See https://feryn.eu/presentations/accelerate-your-kubernetes-clusters-with-varnish-caching-k8sug-singapore-28-2024 for more details.
Generating a custom Ruby SDK for your web service or Rails API using Smithyg2nightmarescribd
Have you ever wanted a Ruby client API to communicate with your web service? Smithy is a protocol-agnostic language for defining services and SDKs. Smithy Ruby is an implementation of Smithy that generates a Ruby SDK using a Smithy model. In this talk, we will explore Smithy and Smithy Ruby to learn how to generate custom feature-rich SDKs that can communicate with any web service, such as a Rails JSON API.
LF Energy Webinar: Electrical Grid Modelling and Simulation Through PowSyBl -...DanBrown980551
Do you want to learn how to model and simulate an electrical network from scratch in under an hour?
Then welcome to this PowSyBl workshop, hosted by Rte, the French Transmission System Operator (TSO)!
During the webinar, you will discover the PowSyBl ecosystem as well as handle and study an electrical network through an interactive Python notebook.
PowSyBl is an open source project hosted by LF Energy, which offers a comprehensive set of features for electrical grid modelling and simulation. Among other advanced features, PowSyBl provides:
- A fully editable and extendable library for grid component modelling;
- Visualization tools to display your network;
- Grid simulation tools, such as power flows, security analyses (with or without remedial actions) and sensitivity analyses;
The framework is mostly written in Java, with a Python binding so that Python developers can access PowSyBl functionalities as well.
What you will learn during the webinar:
- For beginners: discover PowSyBl's functionalities through a quick general presentation and the notebook, without needing any expert coding skills;
- For advanced developers: master the skills to efficiently apply PowSyBl functionalities to your real-world scenarios.
DevOps and Testing slides at DASA ConnectKari Kakkonen
My and Rik Marselis slides at 30.5.2024 DASA Connect conference. We discuss about what is testing, then what is agile testing and finally what is Testing in DevOps. Finally we had lovely workshop with the participants trying to find out different ways to think about quality and testing in different parts of the DevOps infinity loop.
2. Forensics forensisadj - "of or before the forum." In Roman times, a criminal charge meant presenting the case before a group of public individuals in the forum. … The individual with the best argument and delivery would determine the outcome of the case.
10. How can this happen? A: Our response time is 2.3 seconds B: Our response time is 1.5 seconds C: Our response time is 6 seconds
11. The beauty of measures ... Page Load Time HTTP Request Time 95 % Servlet Time NetworkSniffer Browser Web Server Firewall Application Server Request Time (max) ... is that there are so many to choose from
12. Types of Measurements Cyclic Measurements Are collected ar regular time intervals Are time based JMX, CPU, Memory Event-based measurements Are collected as a request occurs Are transactional Response Times, CPU consumption
13. Types of Statistics Min/Max Average Median Percentiles Use percentiles for event-based measures and averages (or max) for cyclical measures
15. Typical Measurements we work with Memory Consumption, GC CPU Usage, Load Average Response Time Transactions Database Statements, Pool Sizes Communication Calls, Latency, Size, Threads
17. What is the problem? We have response times of 6 seconds. We have response times of 6 seconds for 95 percent of our users at a load of 500 users with a CPU utilization of 10 percent.
34. Memory and GC State Handling Data Volume Web Tier Database Number of Requests JavaScript Latency Data Volume Rendering Comm. Behavior Business Tier O/R Access Memory and GC Browser
35. Remoting Stack Application Developers View Client Application Server Application Stub Facade Serialization Deserialisation Client Infrastructure Server Infrastructure Networking Networking
When there is a murder, suspicious fire or hit-and-run accident, police and rescue workers aren't the only ones in on the investigation. Forensic scientists also play an important part. They will take samples collected at the scene and analyze them in a forensics laboratory. With a little ingenuity and some very high-tech equipment, forensic scientists can help law enforcement catch even the wiliest perpetrator.Forensic science is a discipline that applies scientific analysis to the justice system, often to help prove the events of a crime. Forensic scientists analyze and interpret evidence found at the crime scene. That evidence can include blood, saliva, fibers, tire tracks, drugs,alcohol, paint chips and firearm residue.