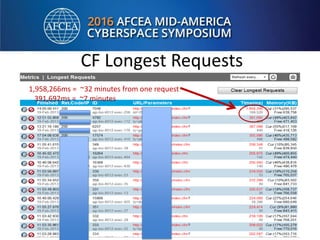
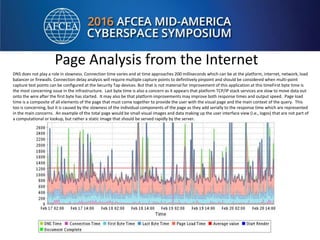
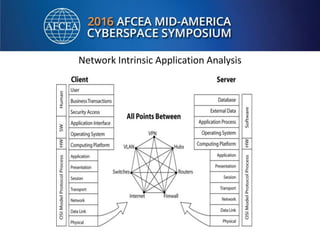
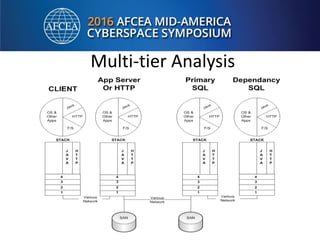
Download to read offline


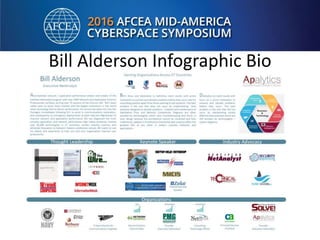

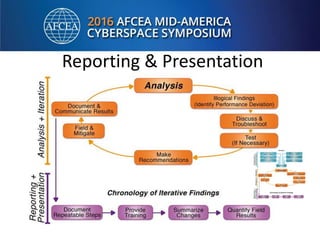


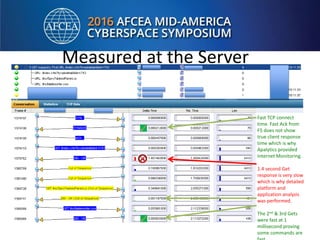
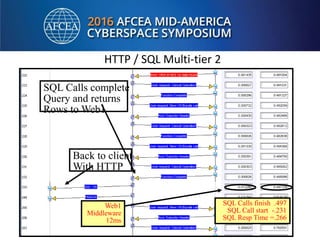
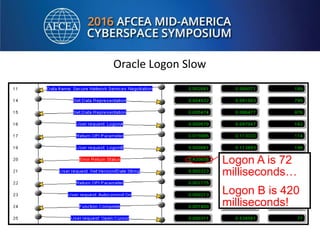
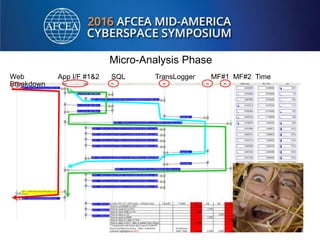
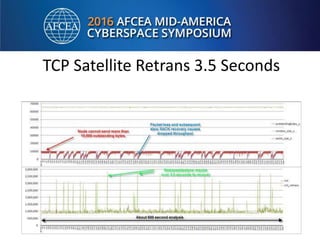
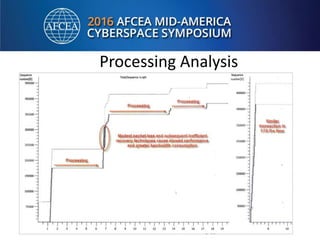
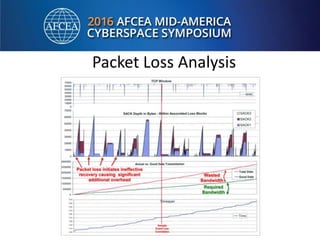
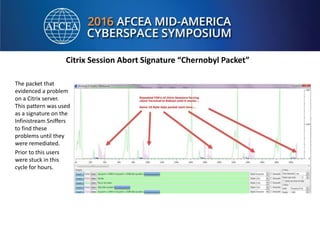
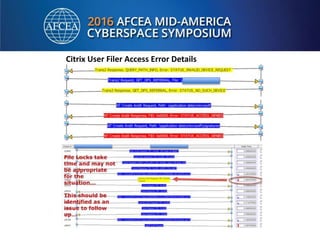


Bill Alderson is an expert in responding to high-profile IT problems at government and commercial organizations. He has helped restore communications at the Pentagon after 9/11 and optimized networks and applications for the Joint Chiefs of Staff and other military organizations. In his presentation, Alderson will demonstrate the tools and techniques used to perform deep packet analysis and pinpoint the root causes of complex IT issues in order to optimize systems and avoid unnecessary upgrades.


