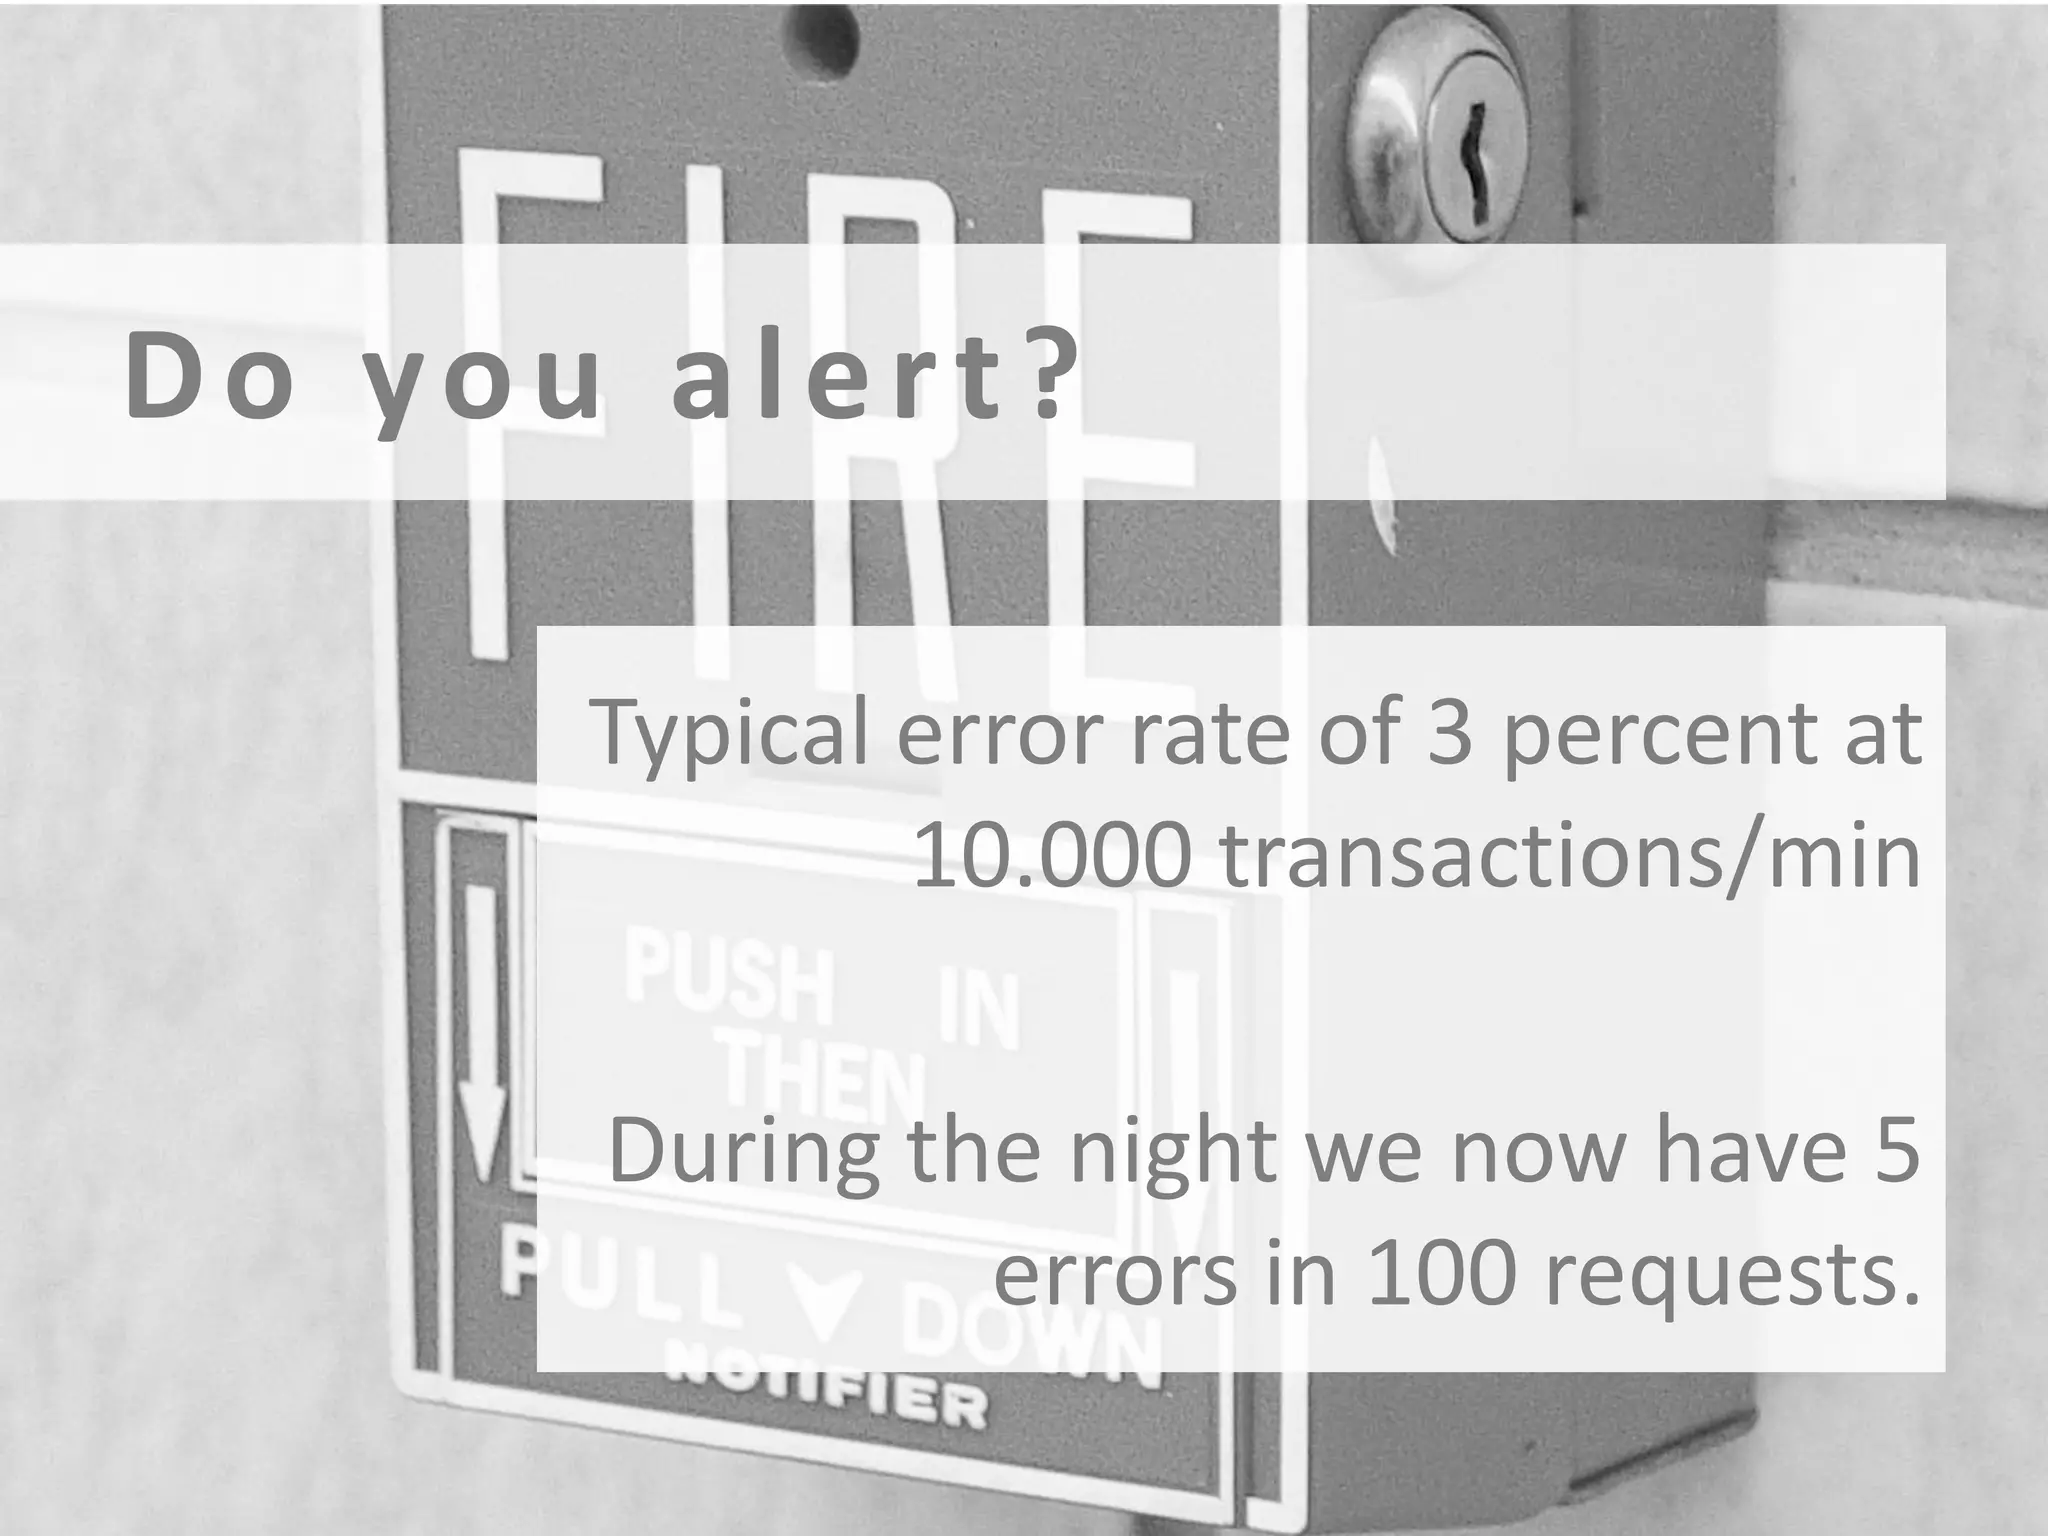
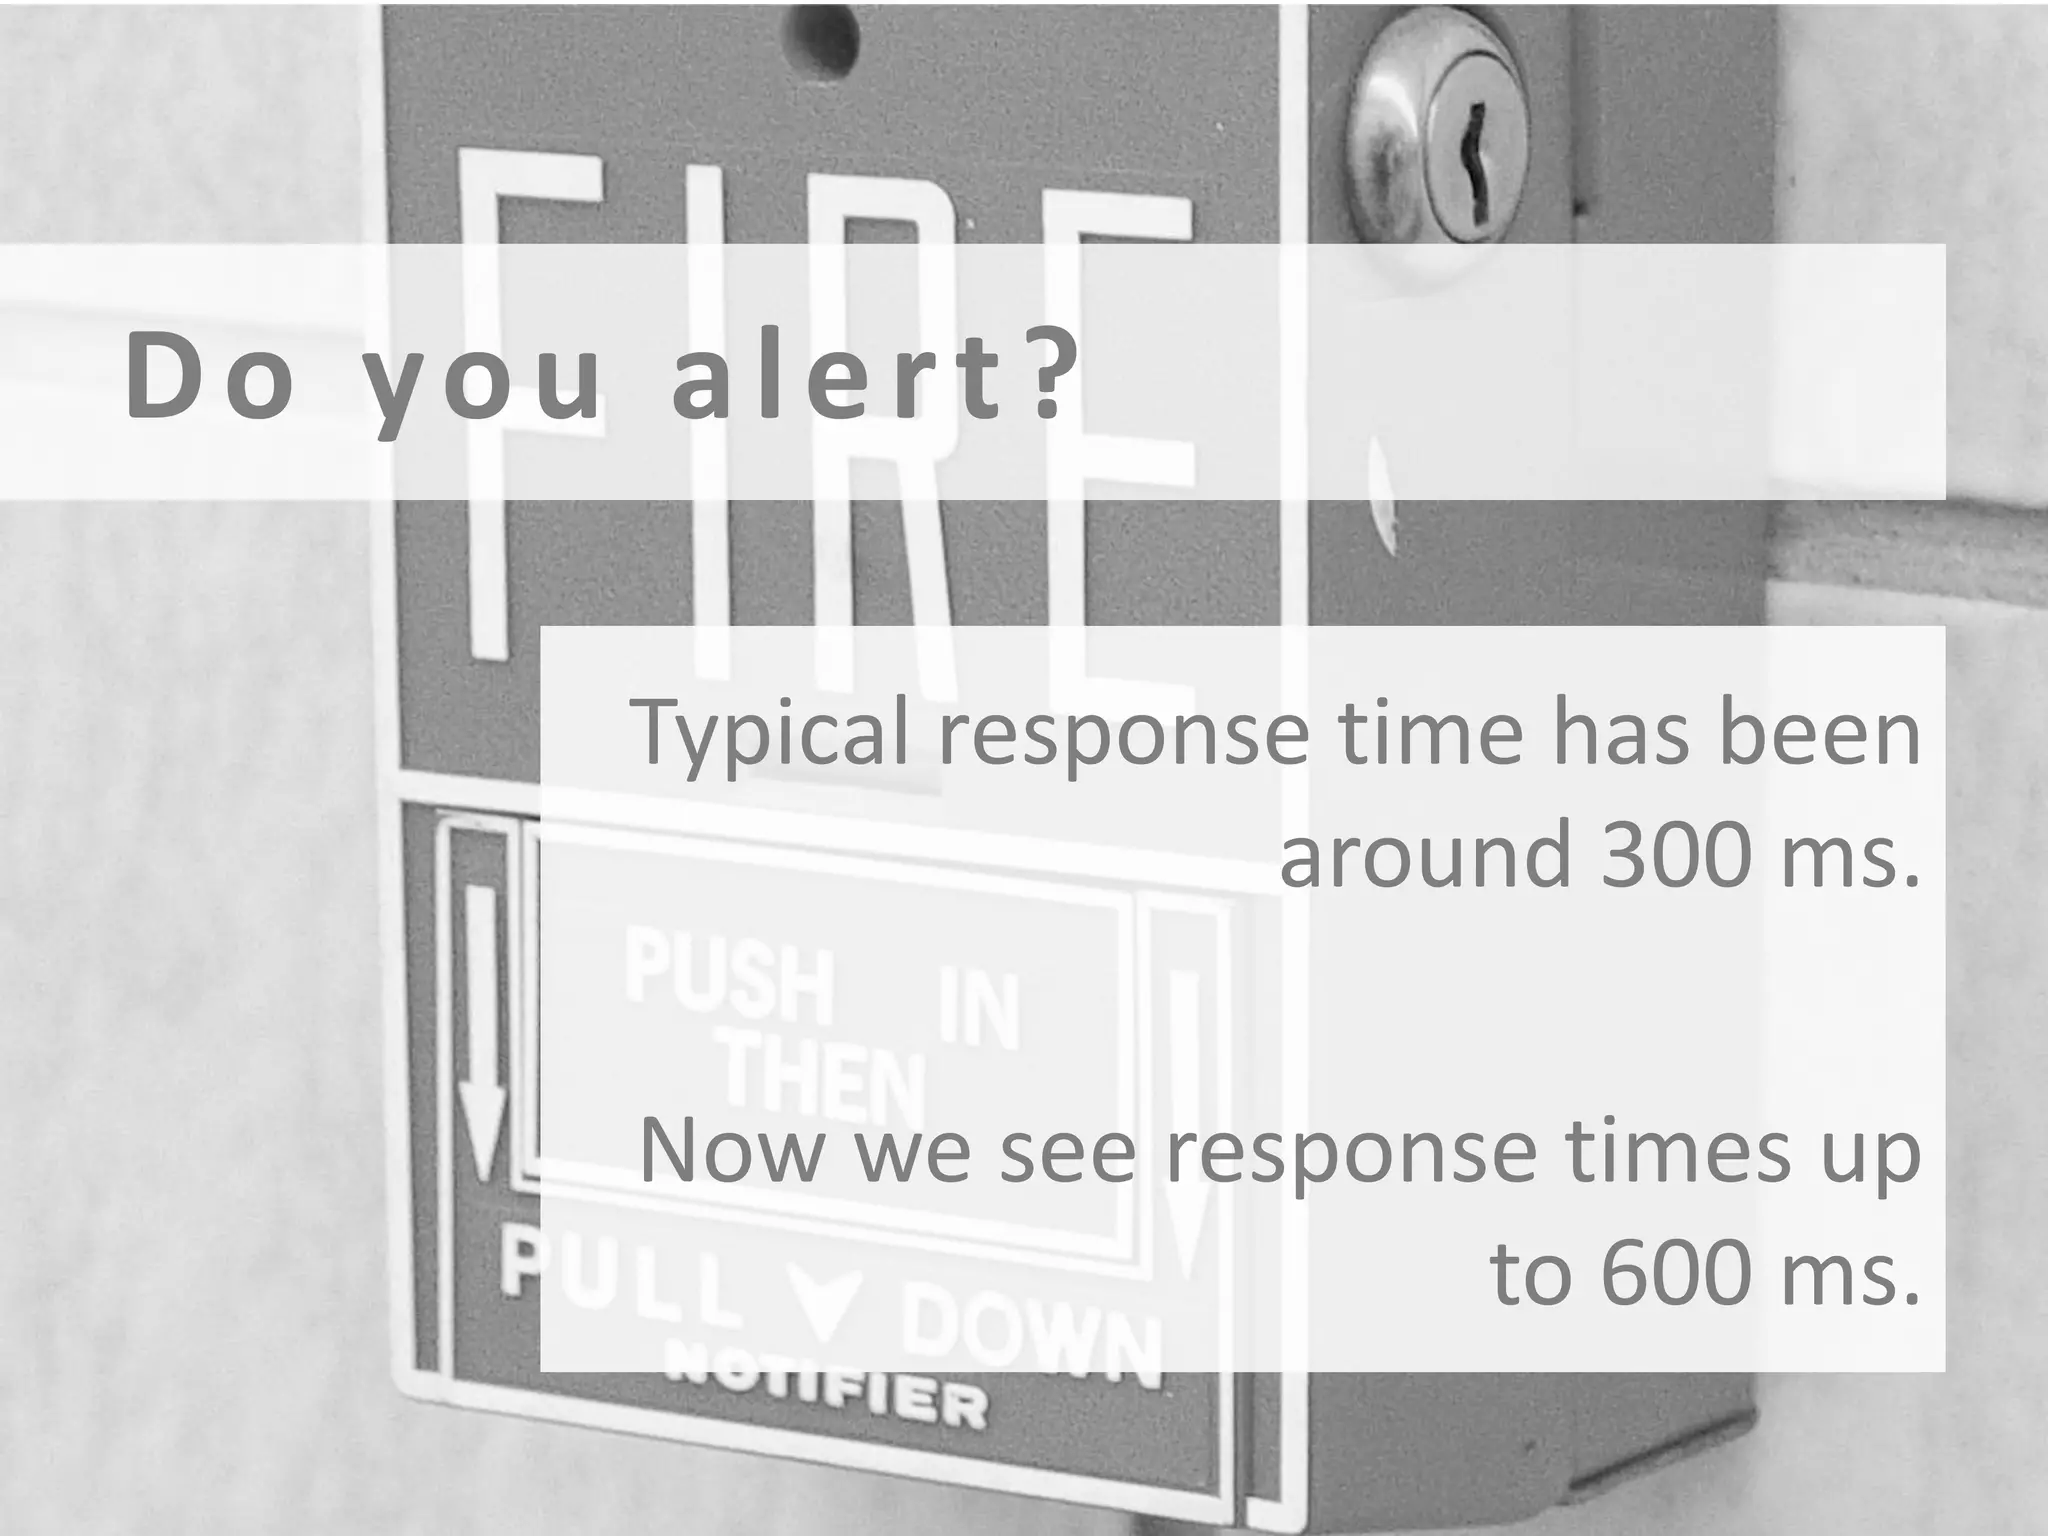
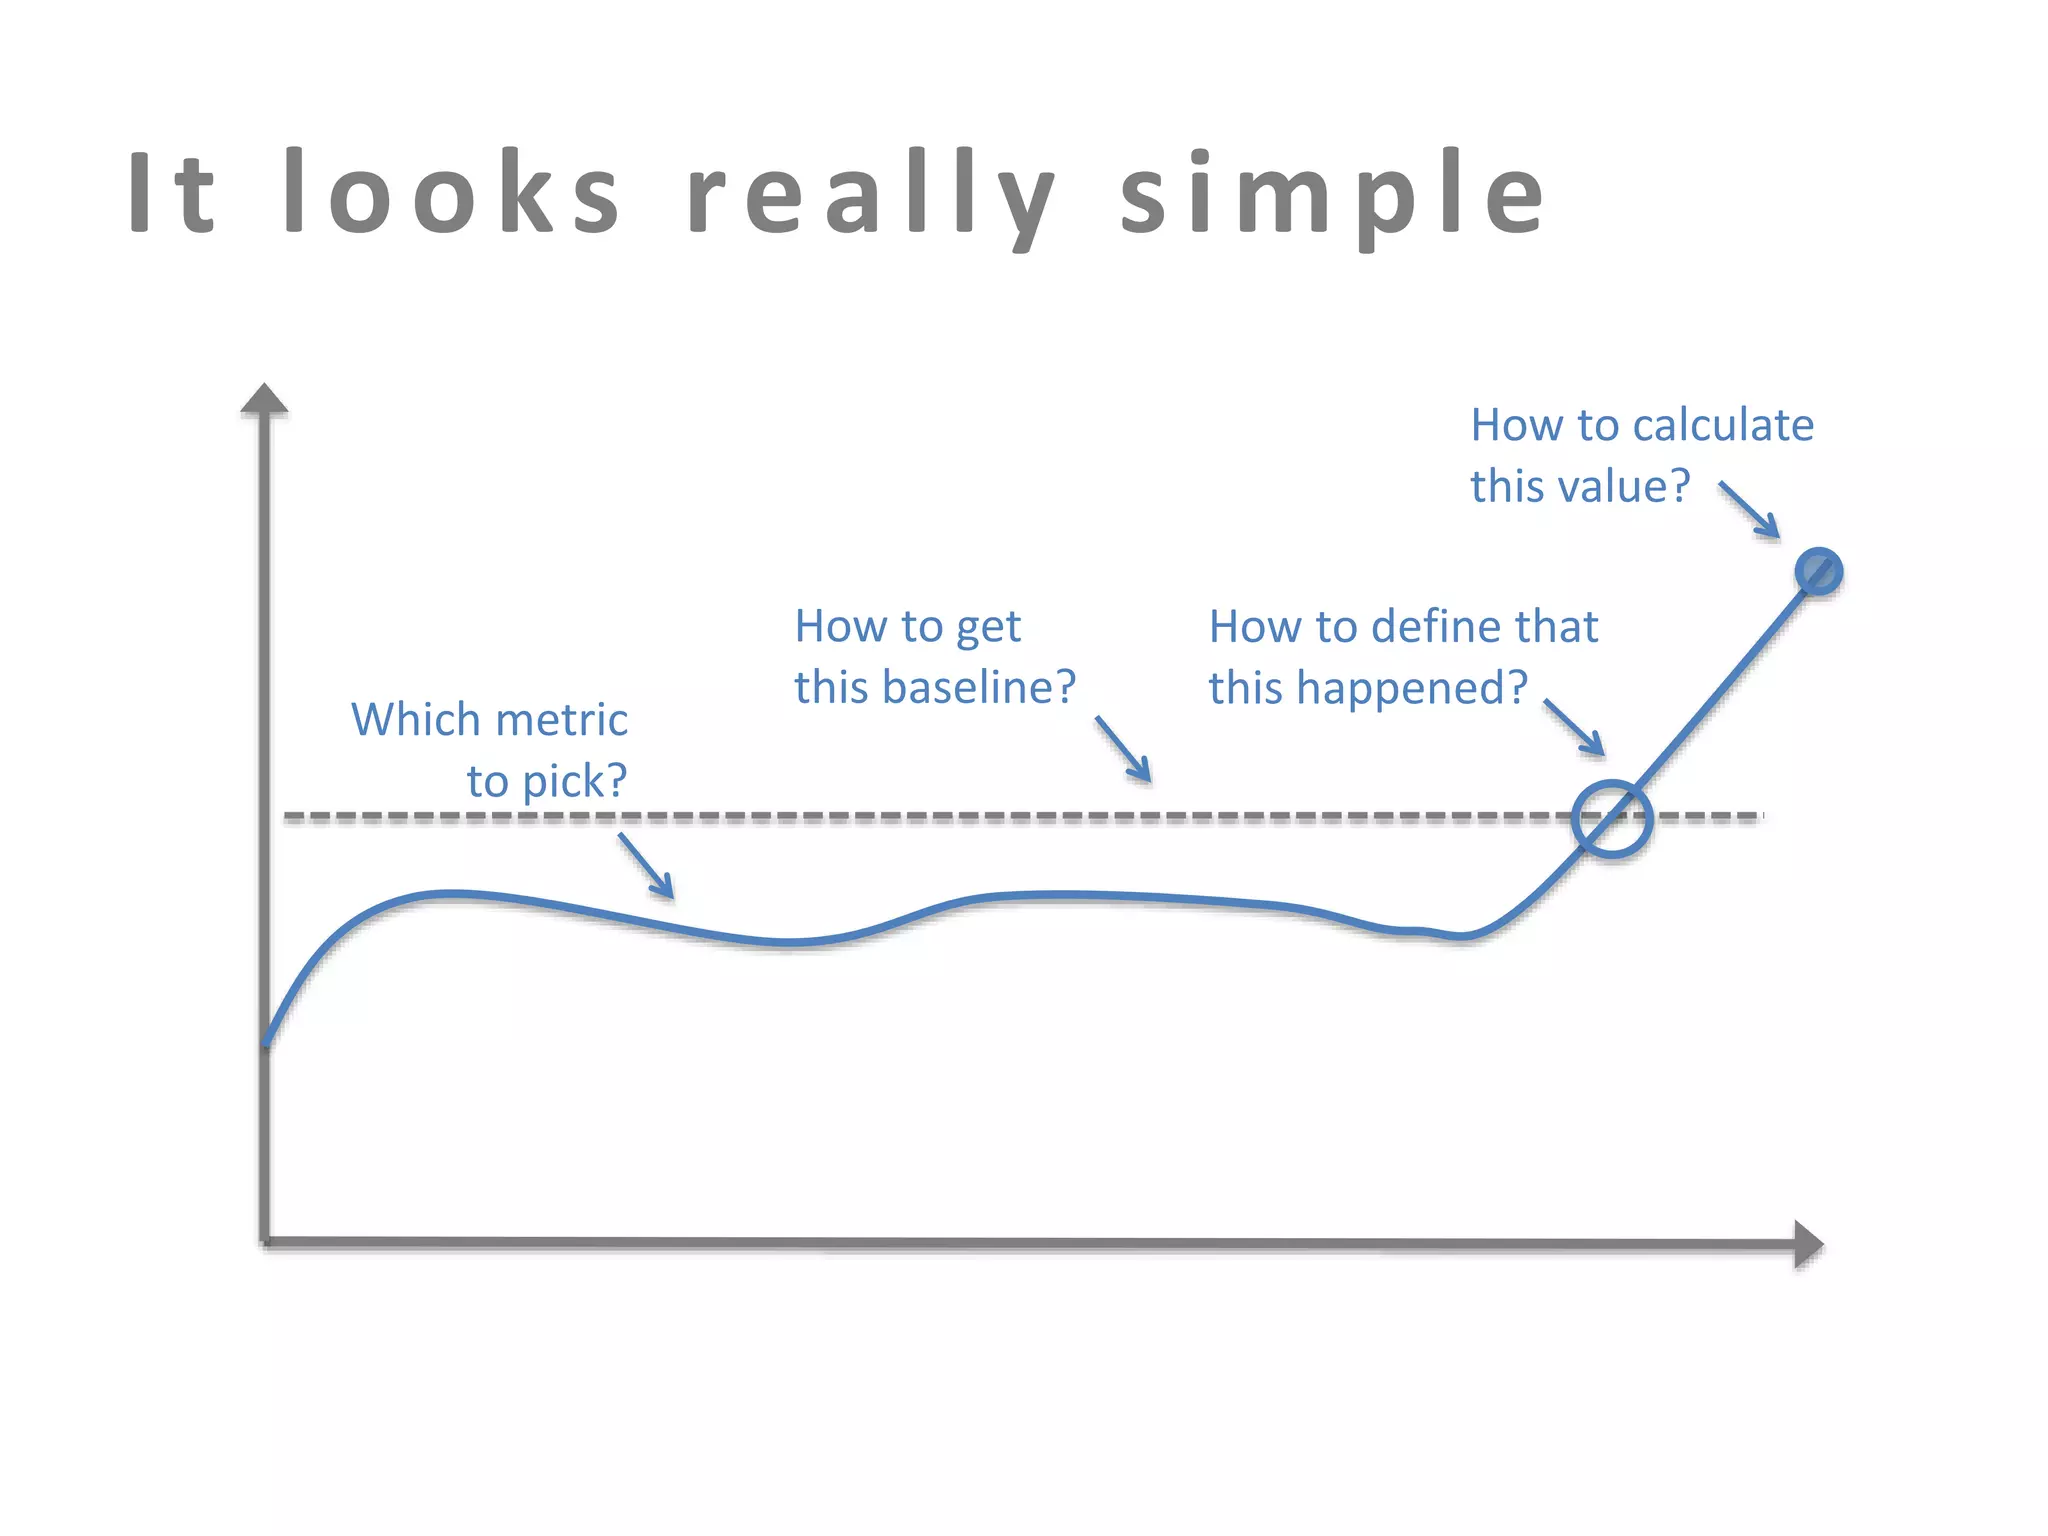
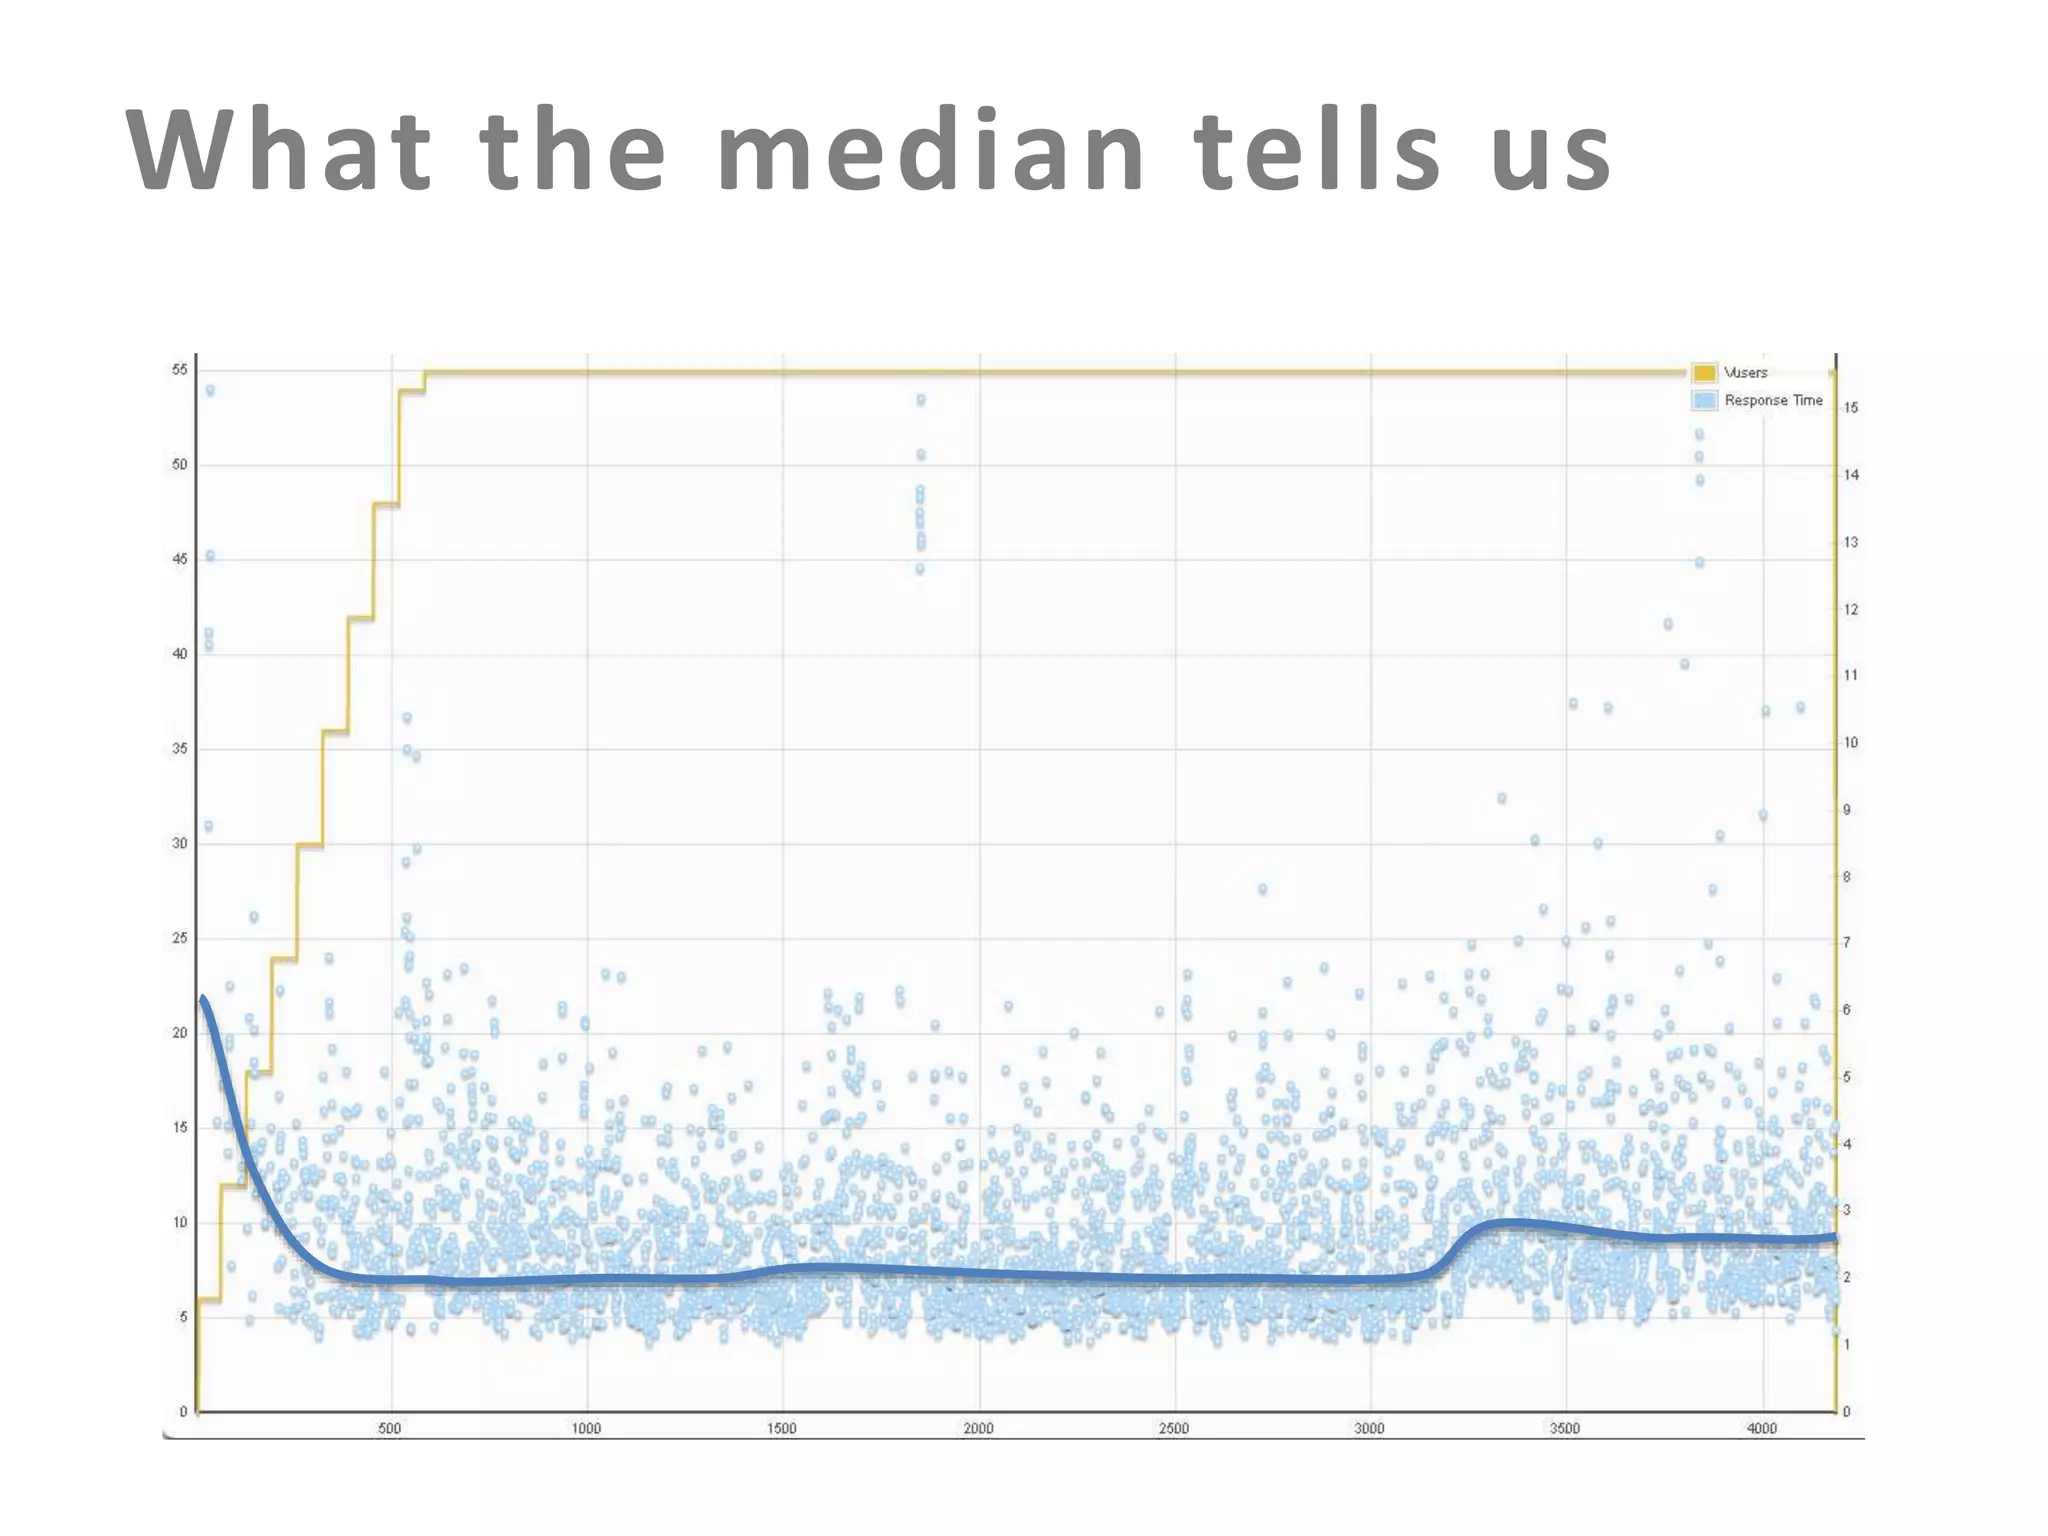
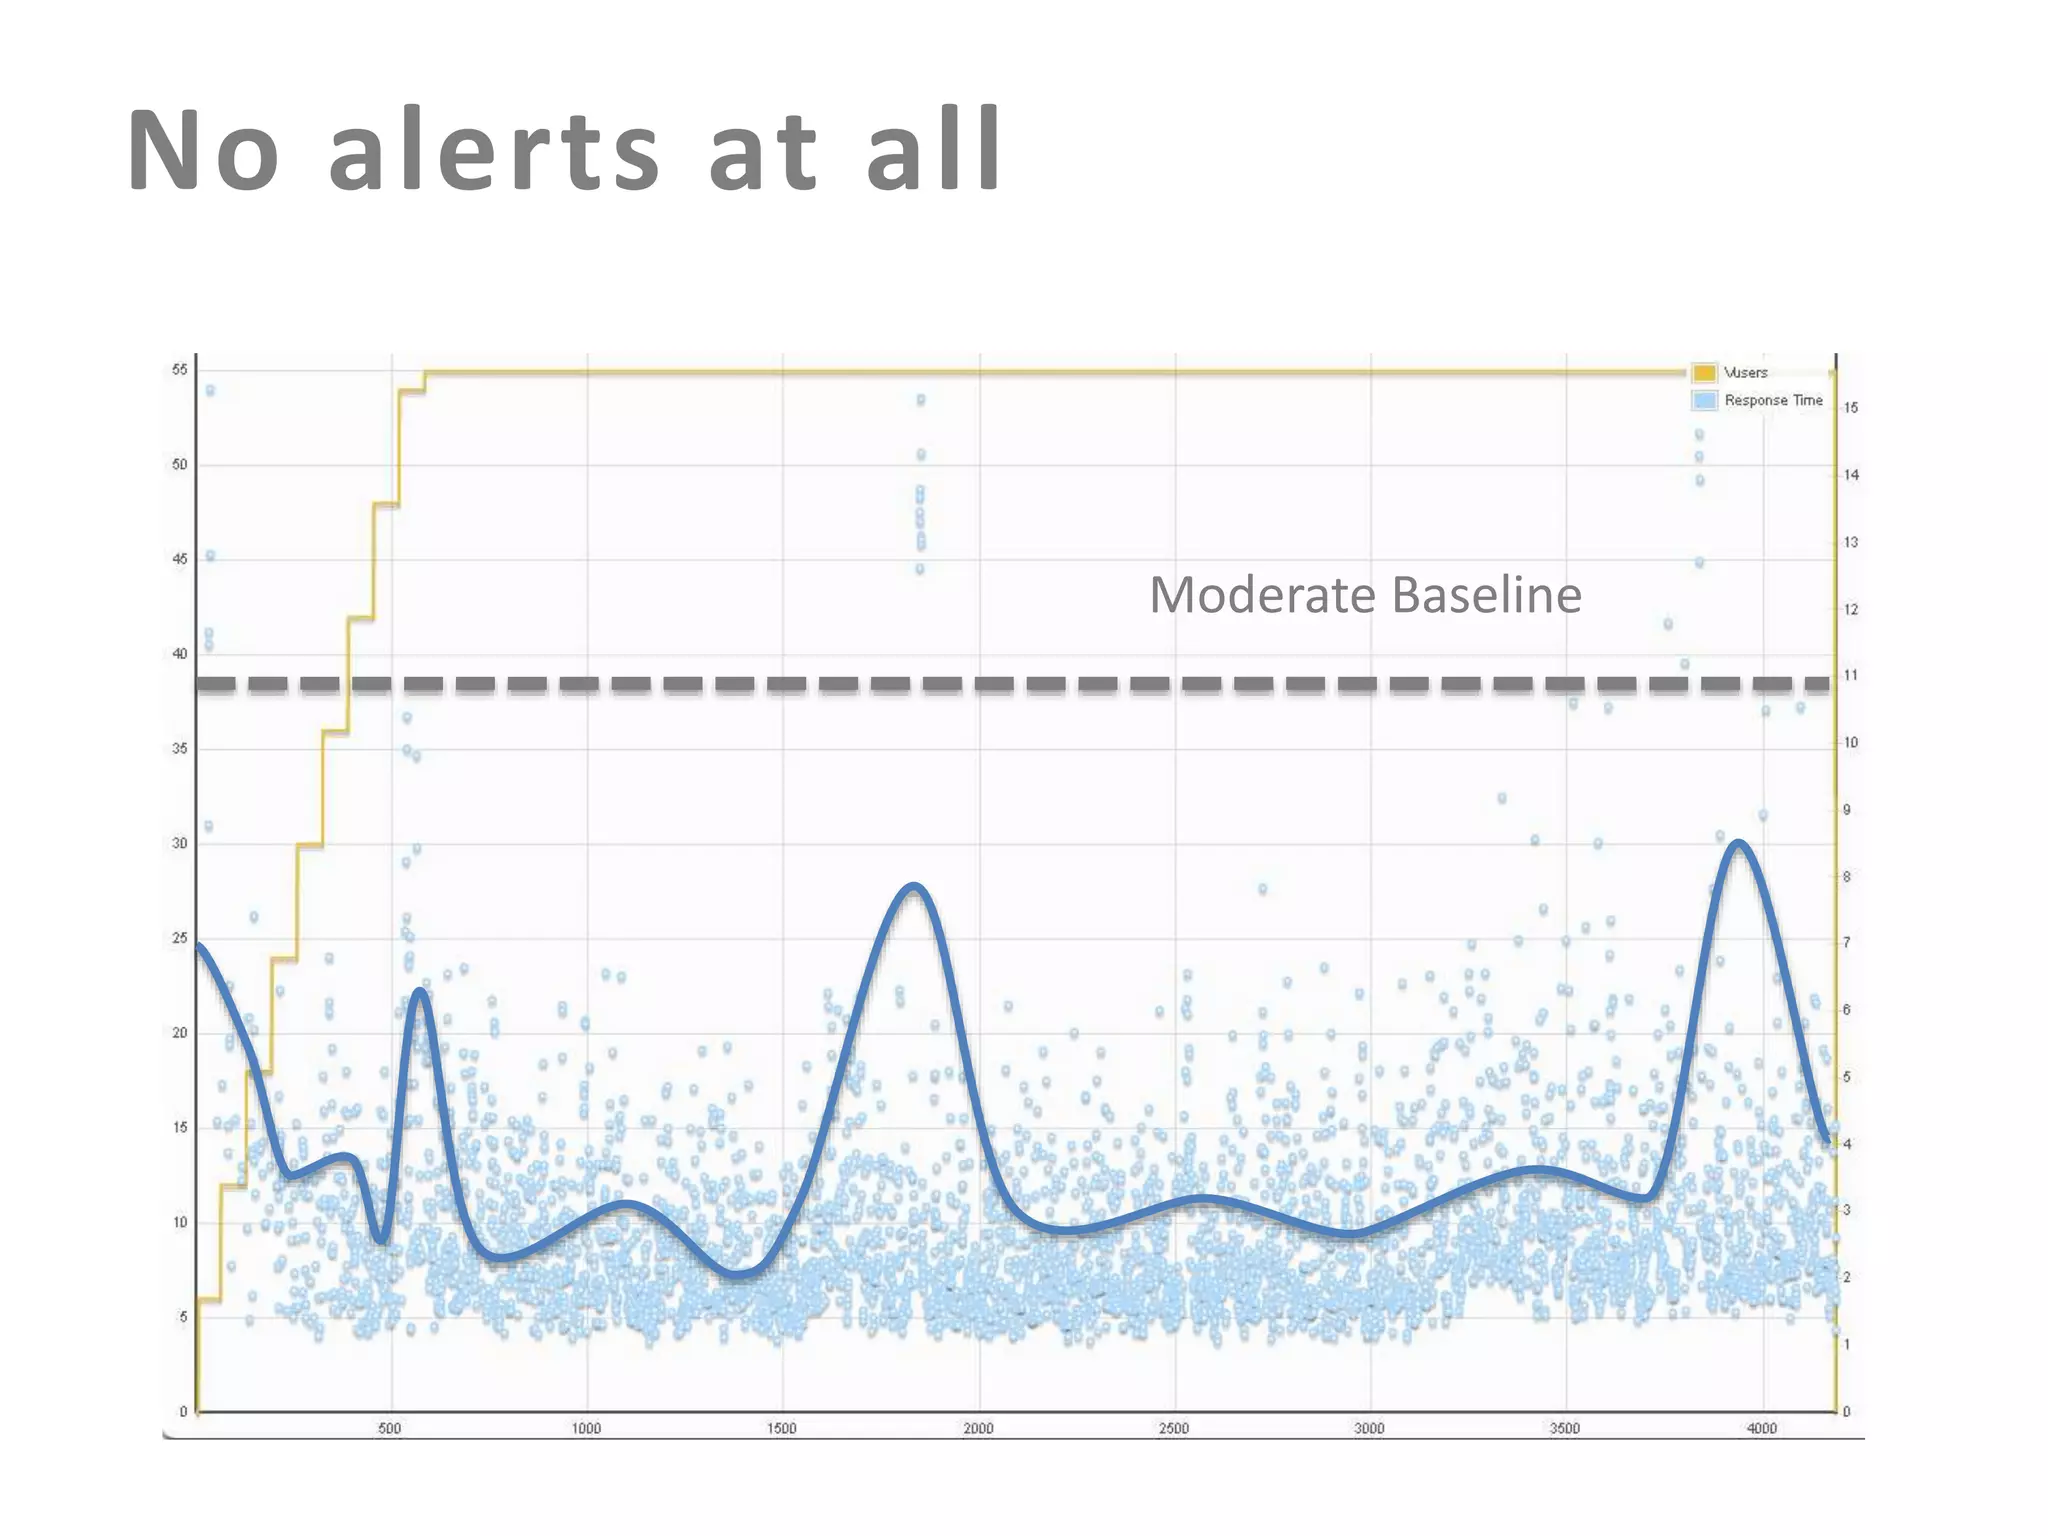
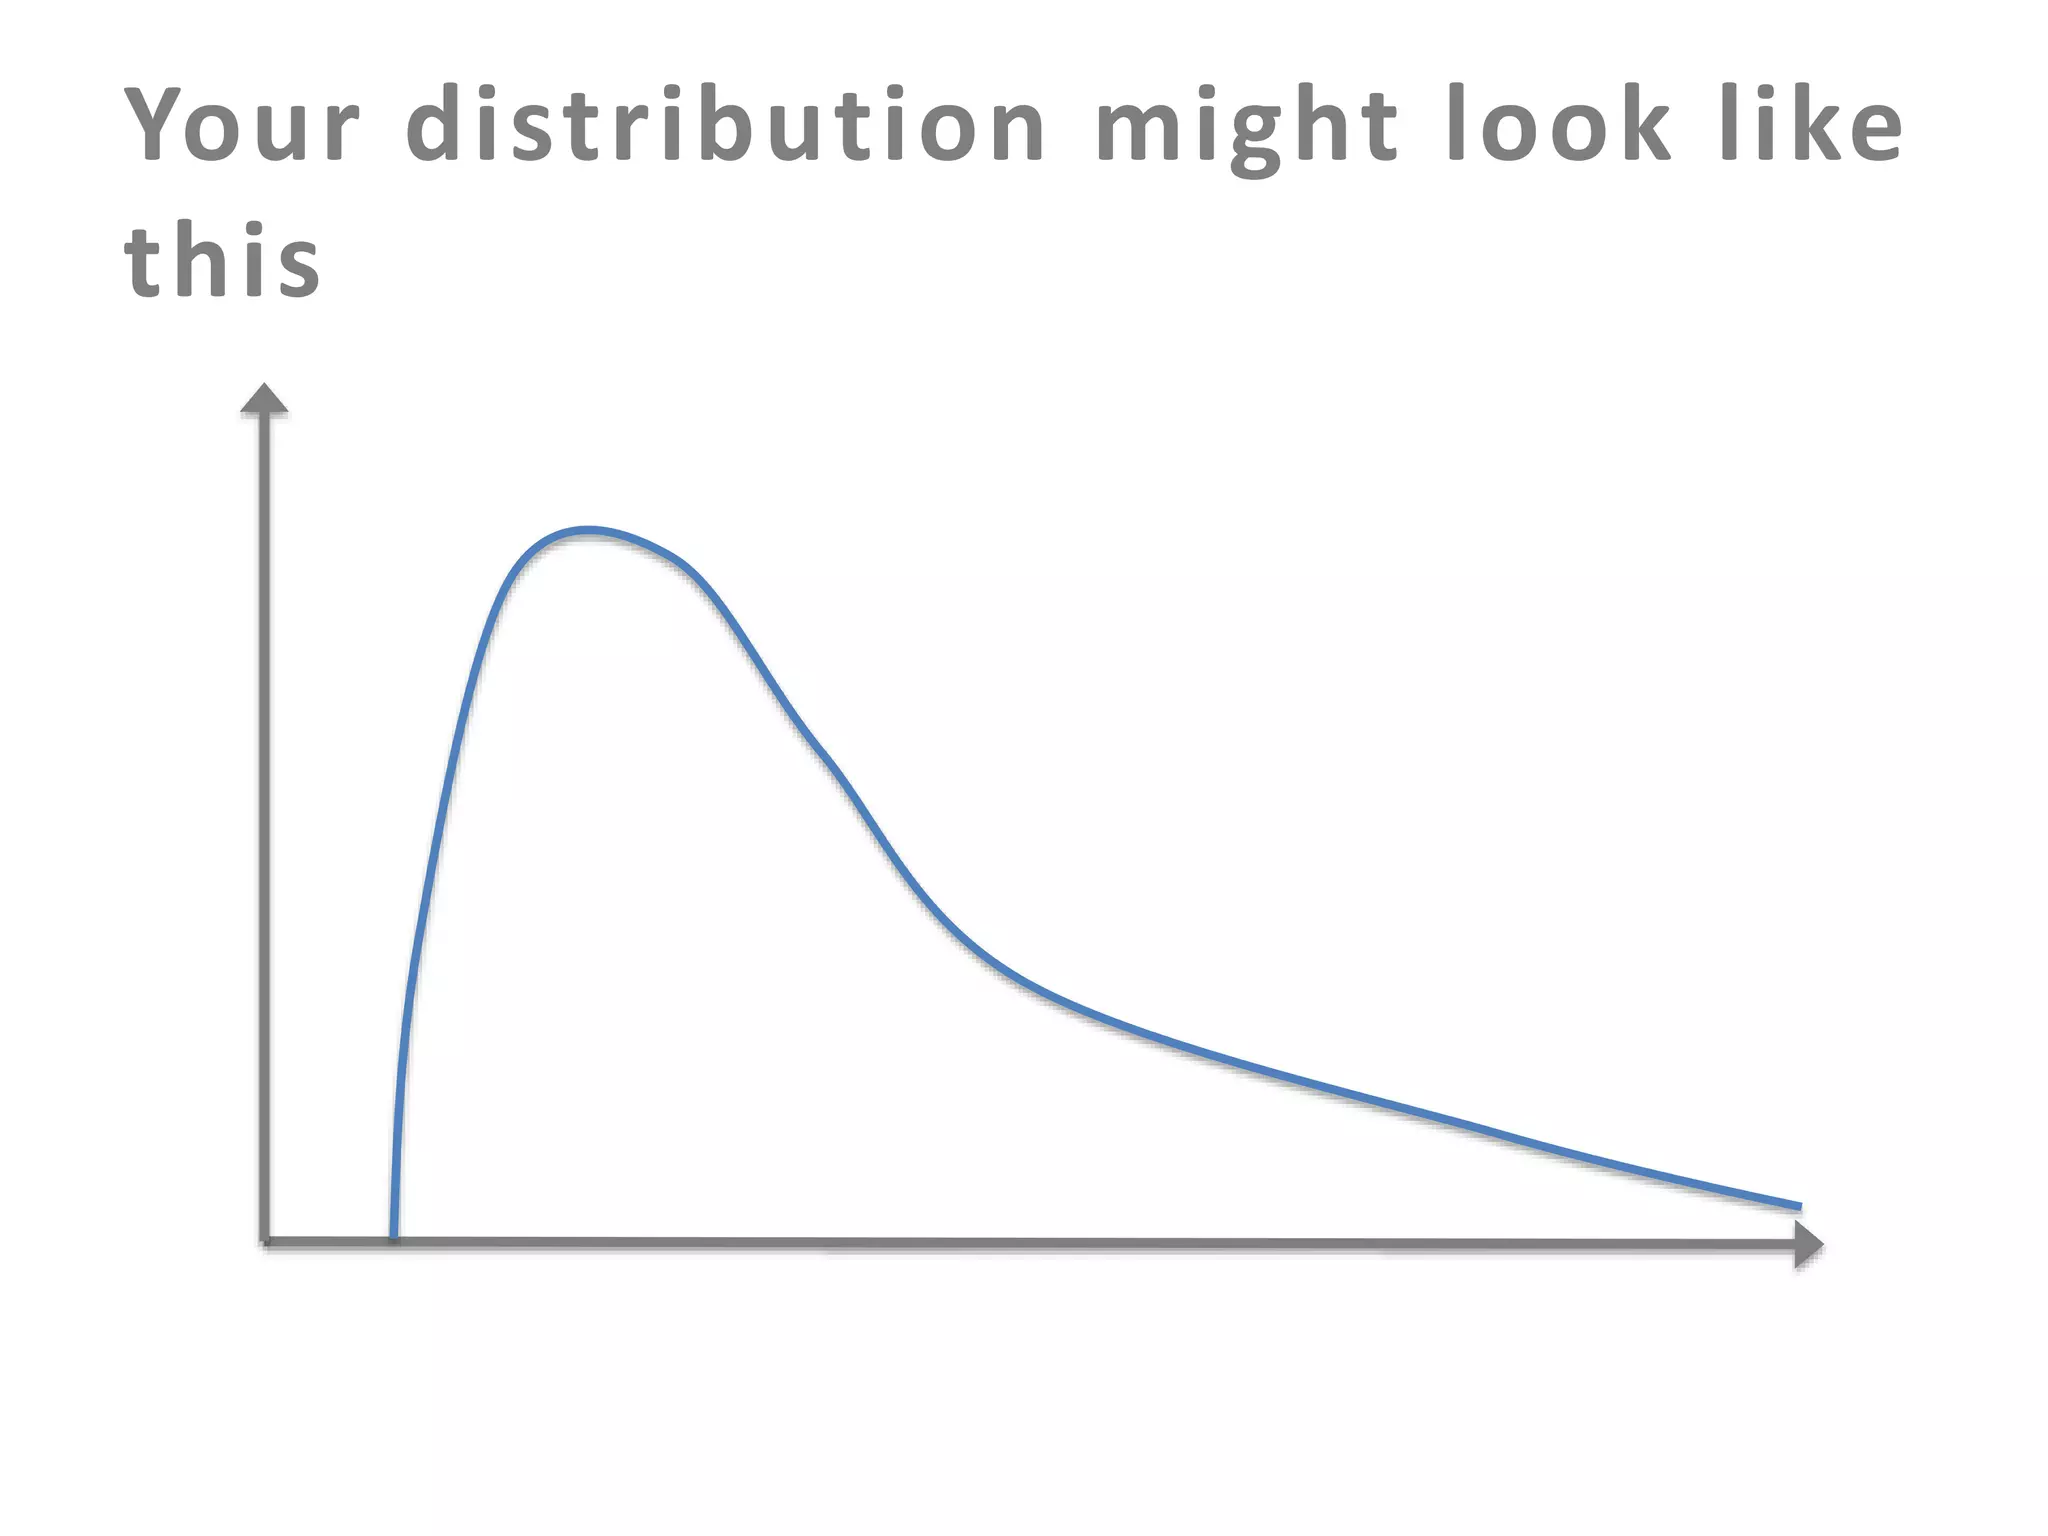
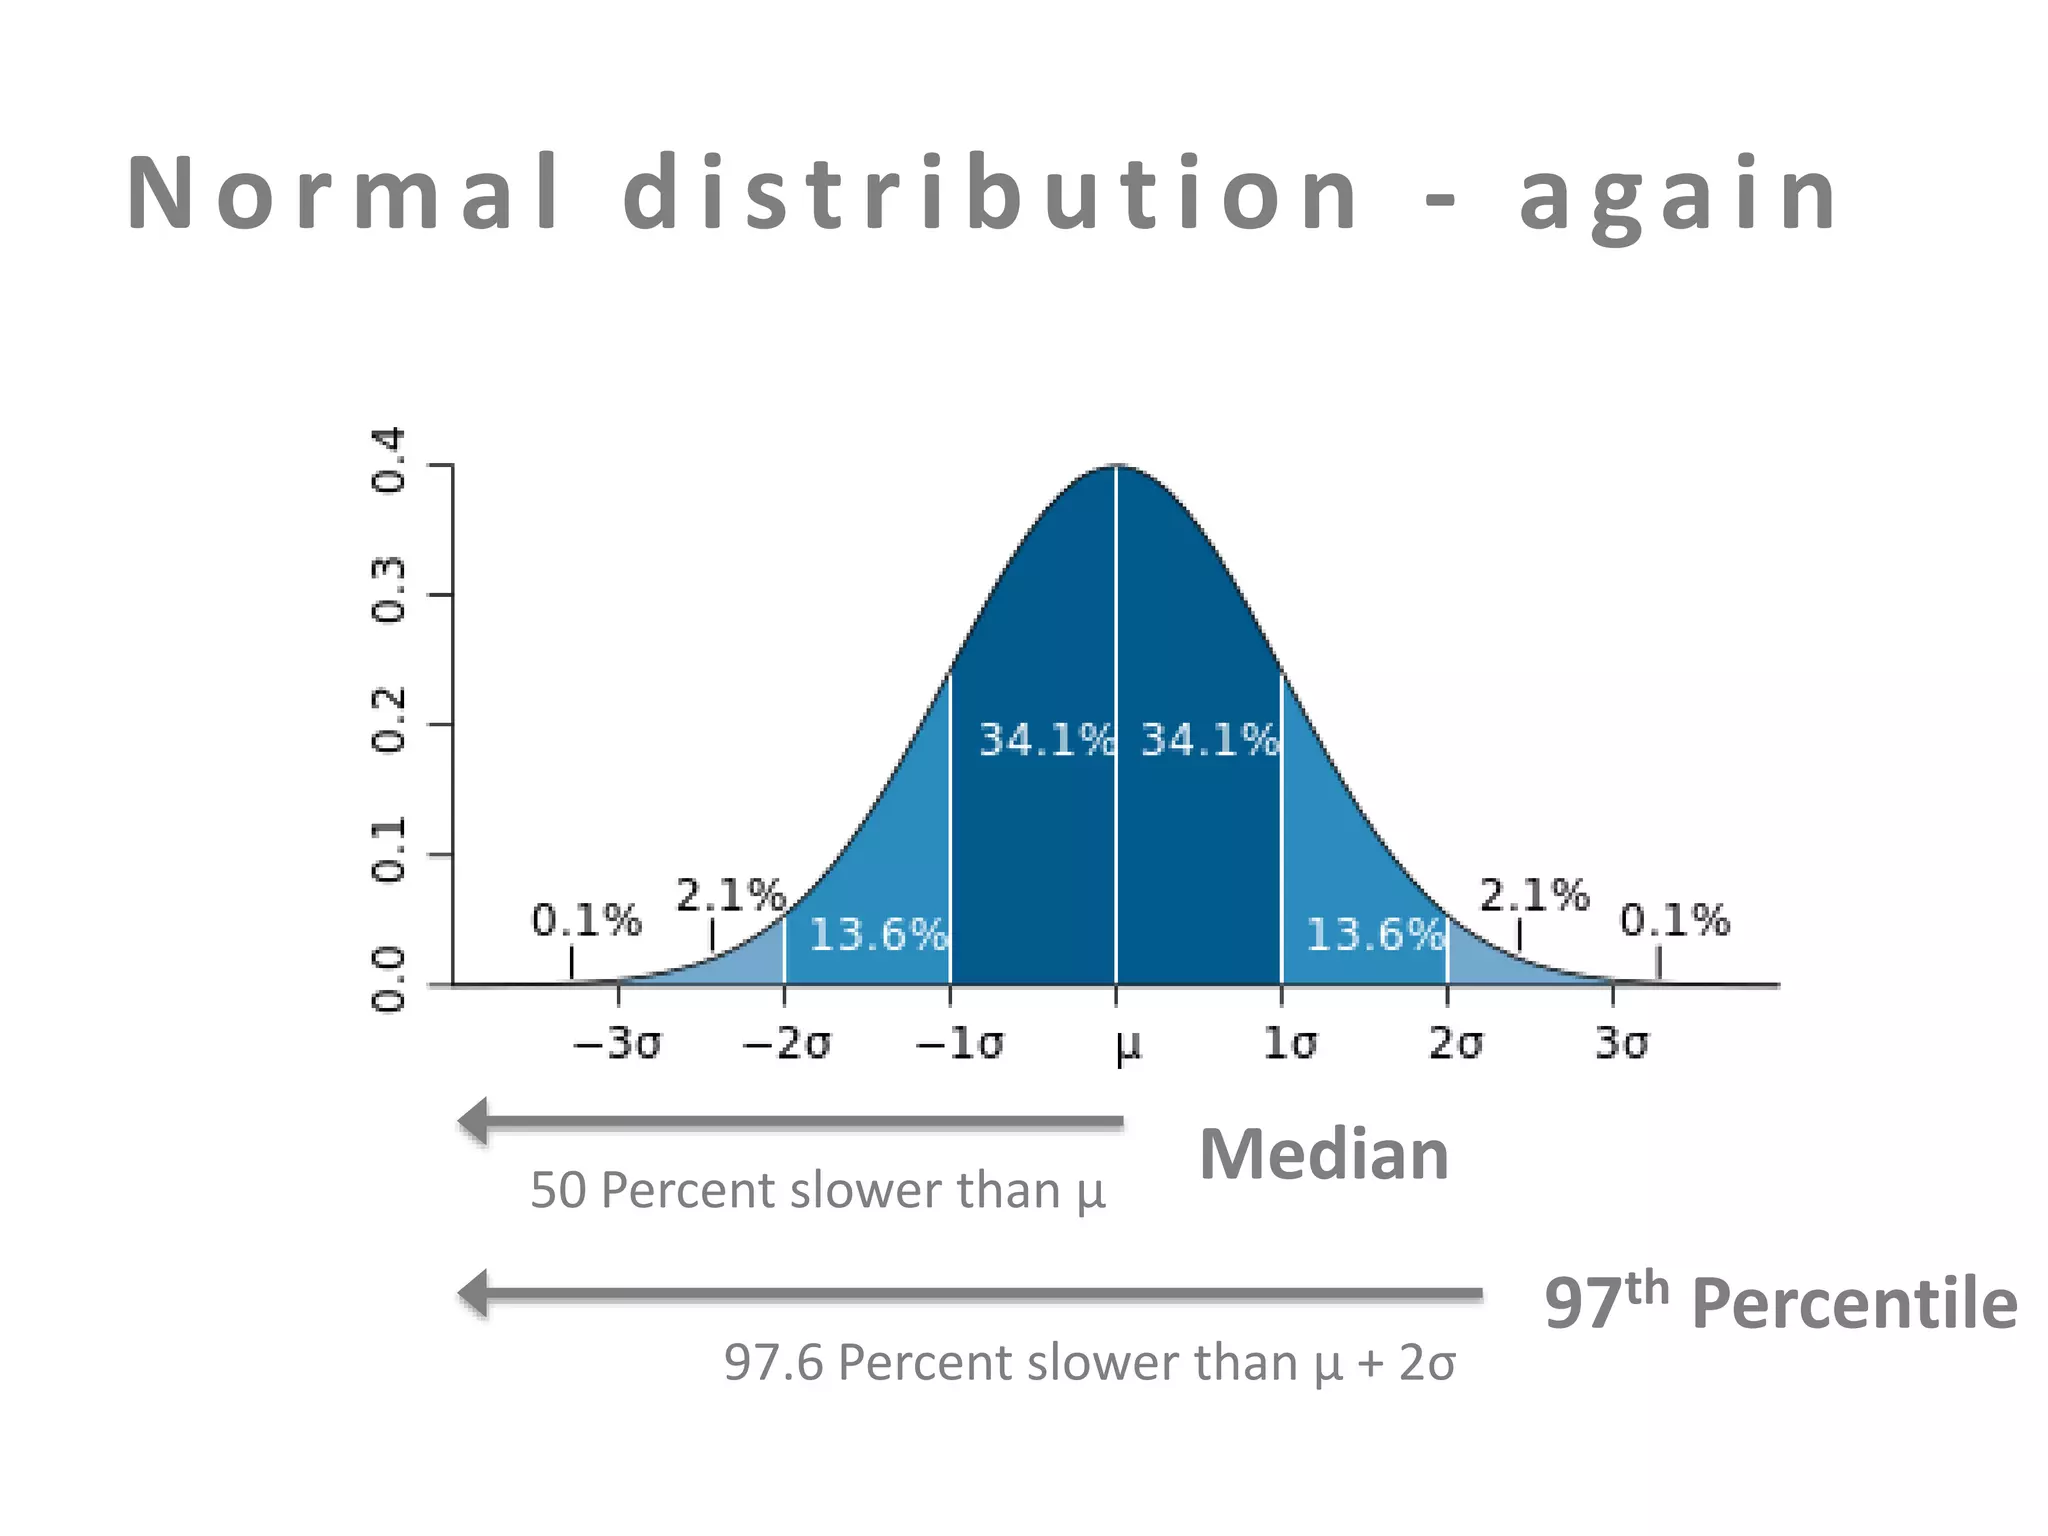
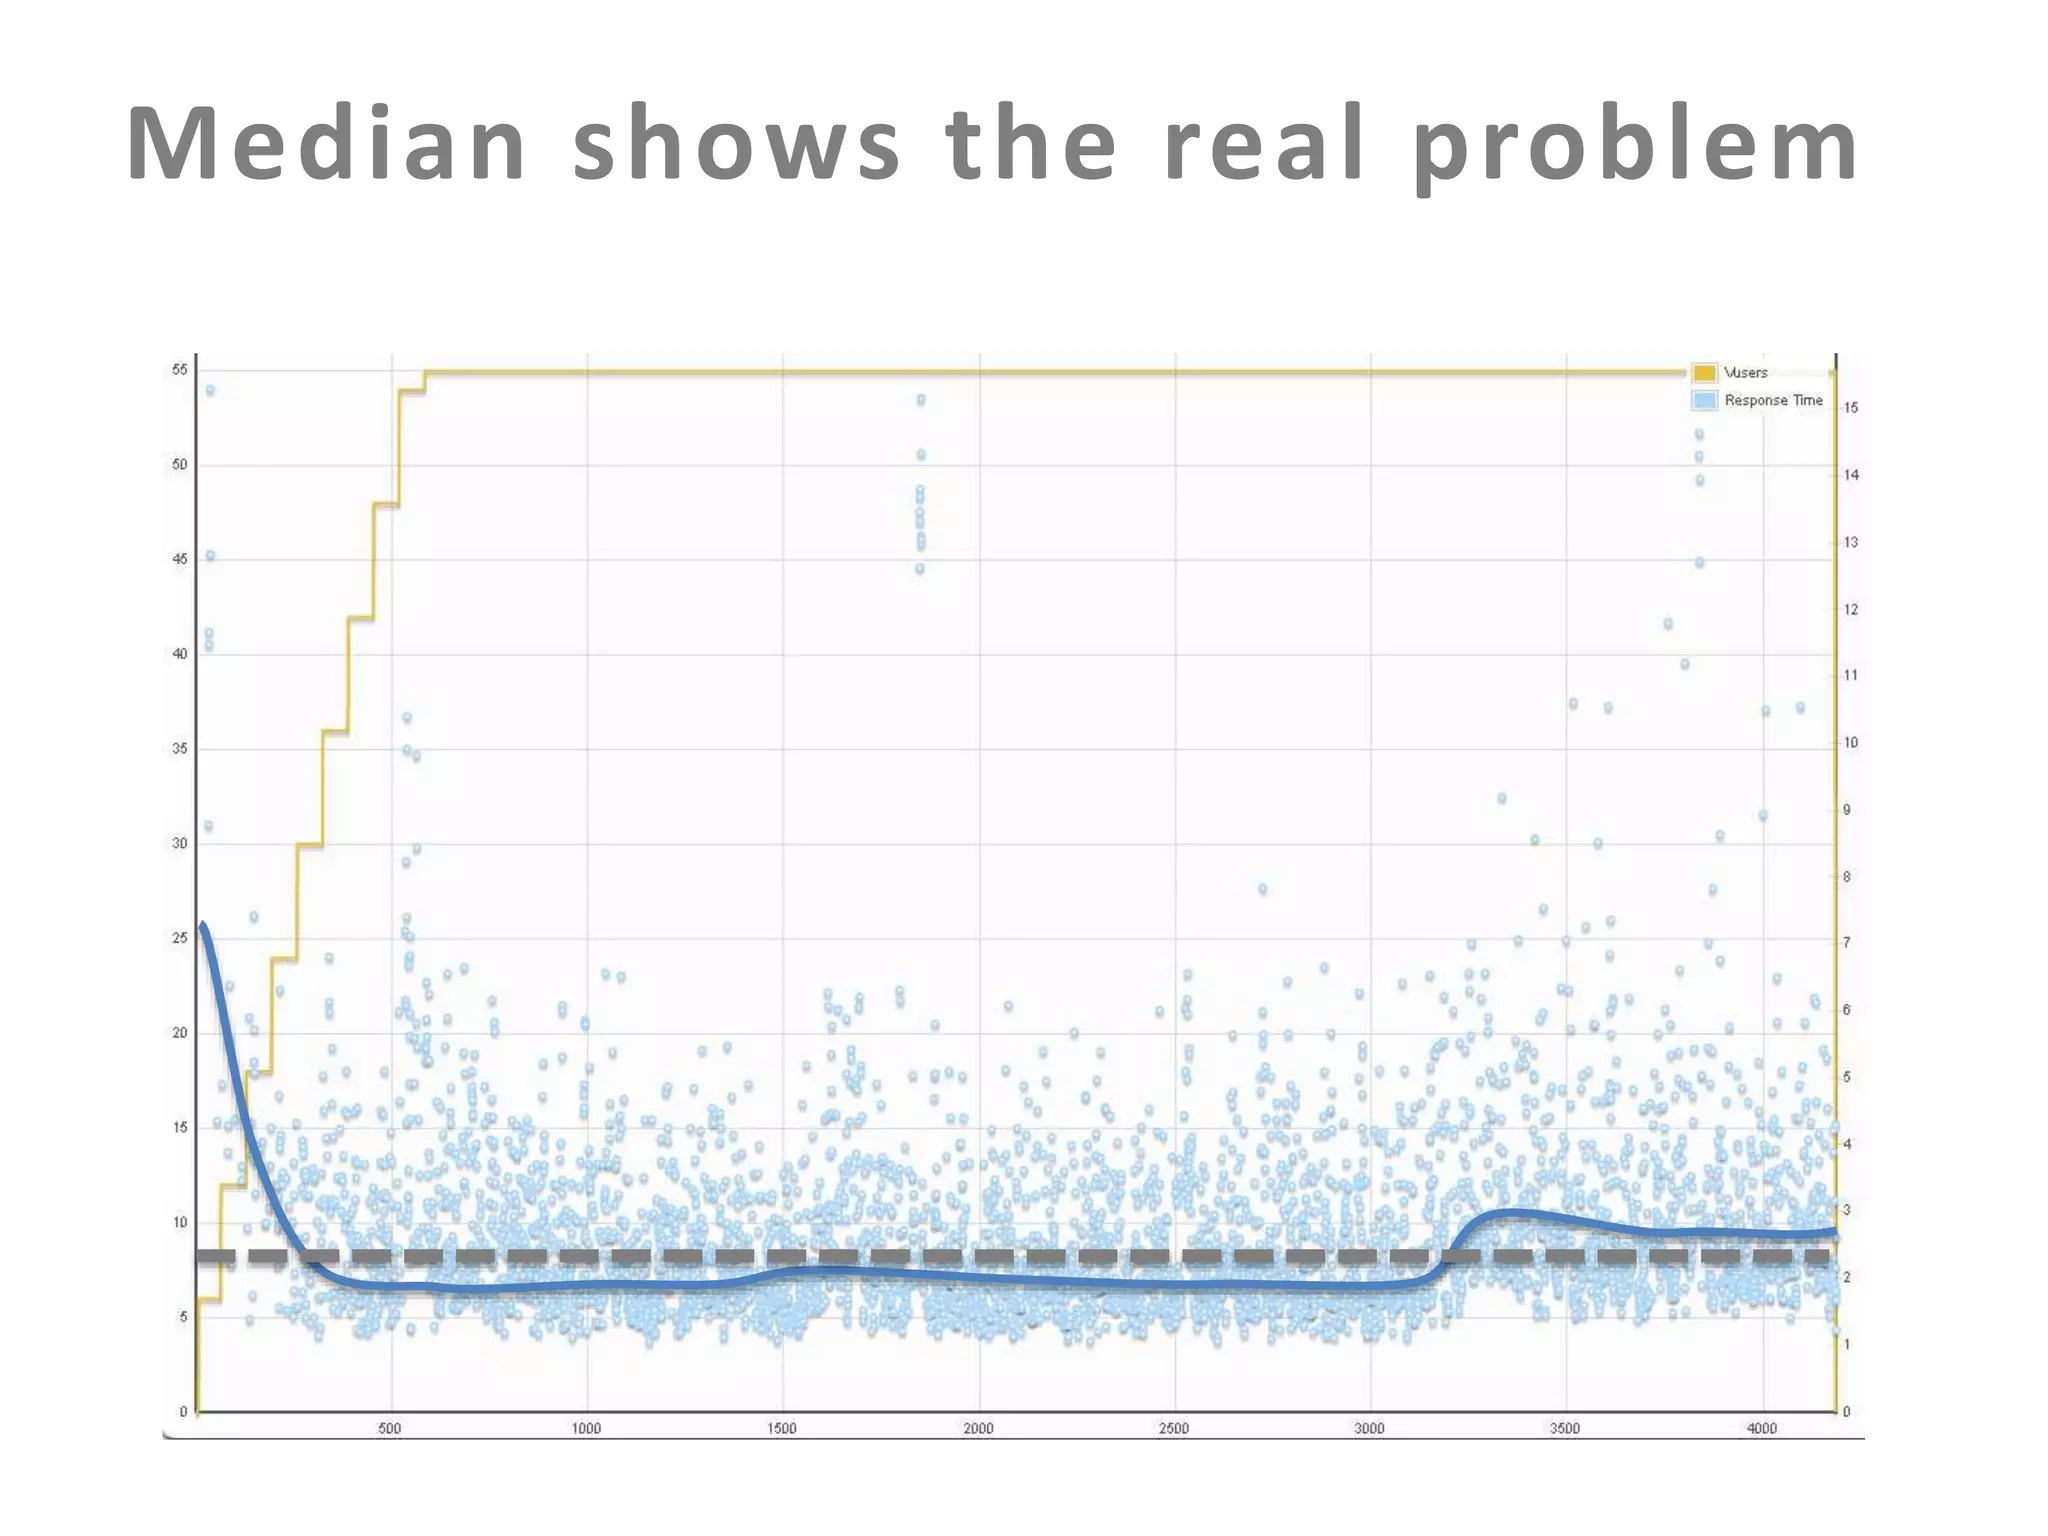
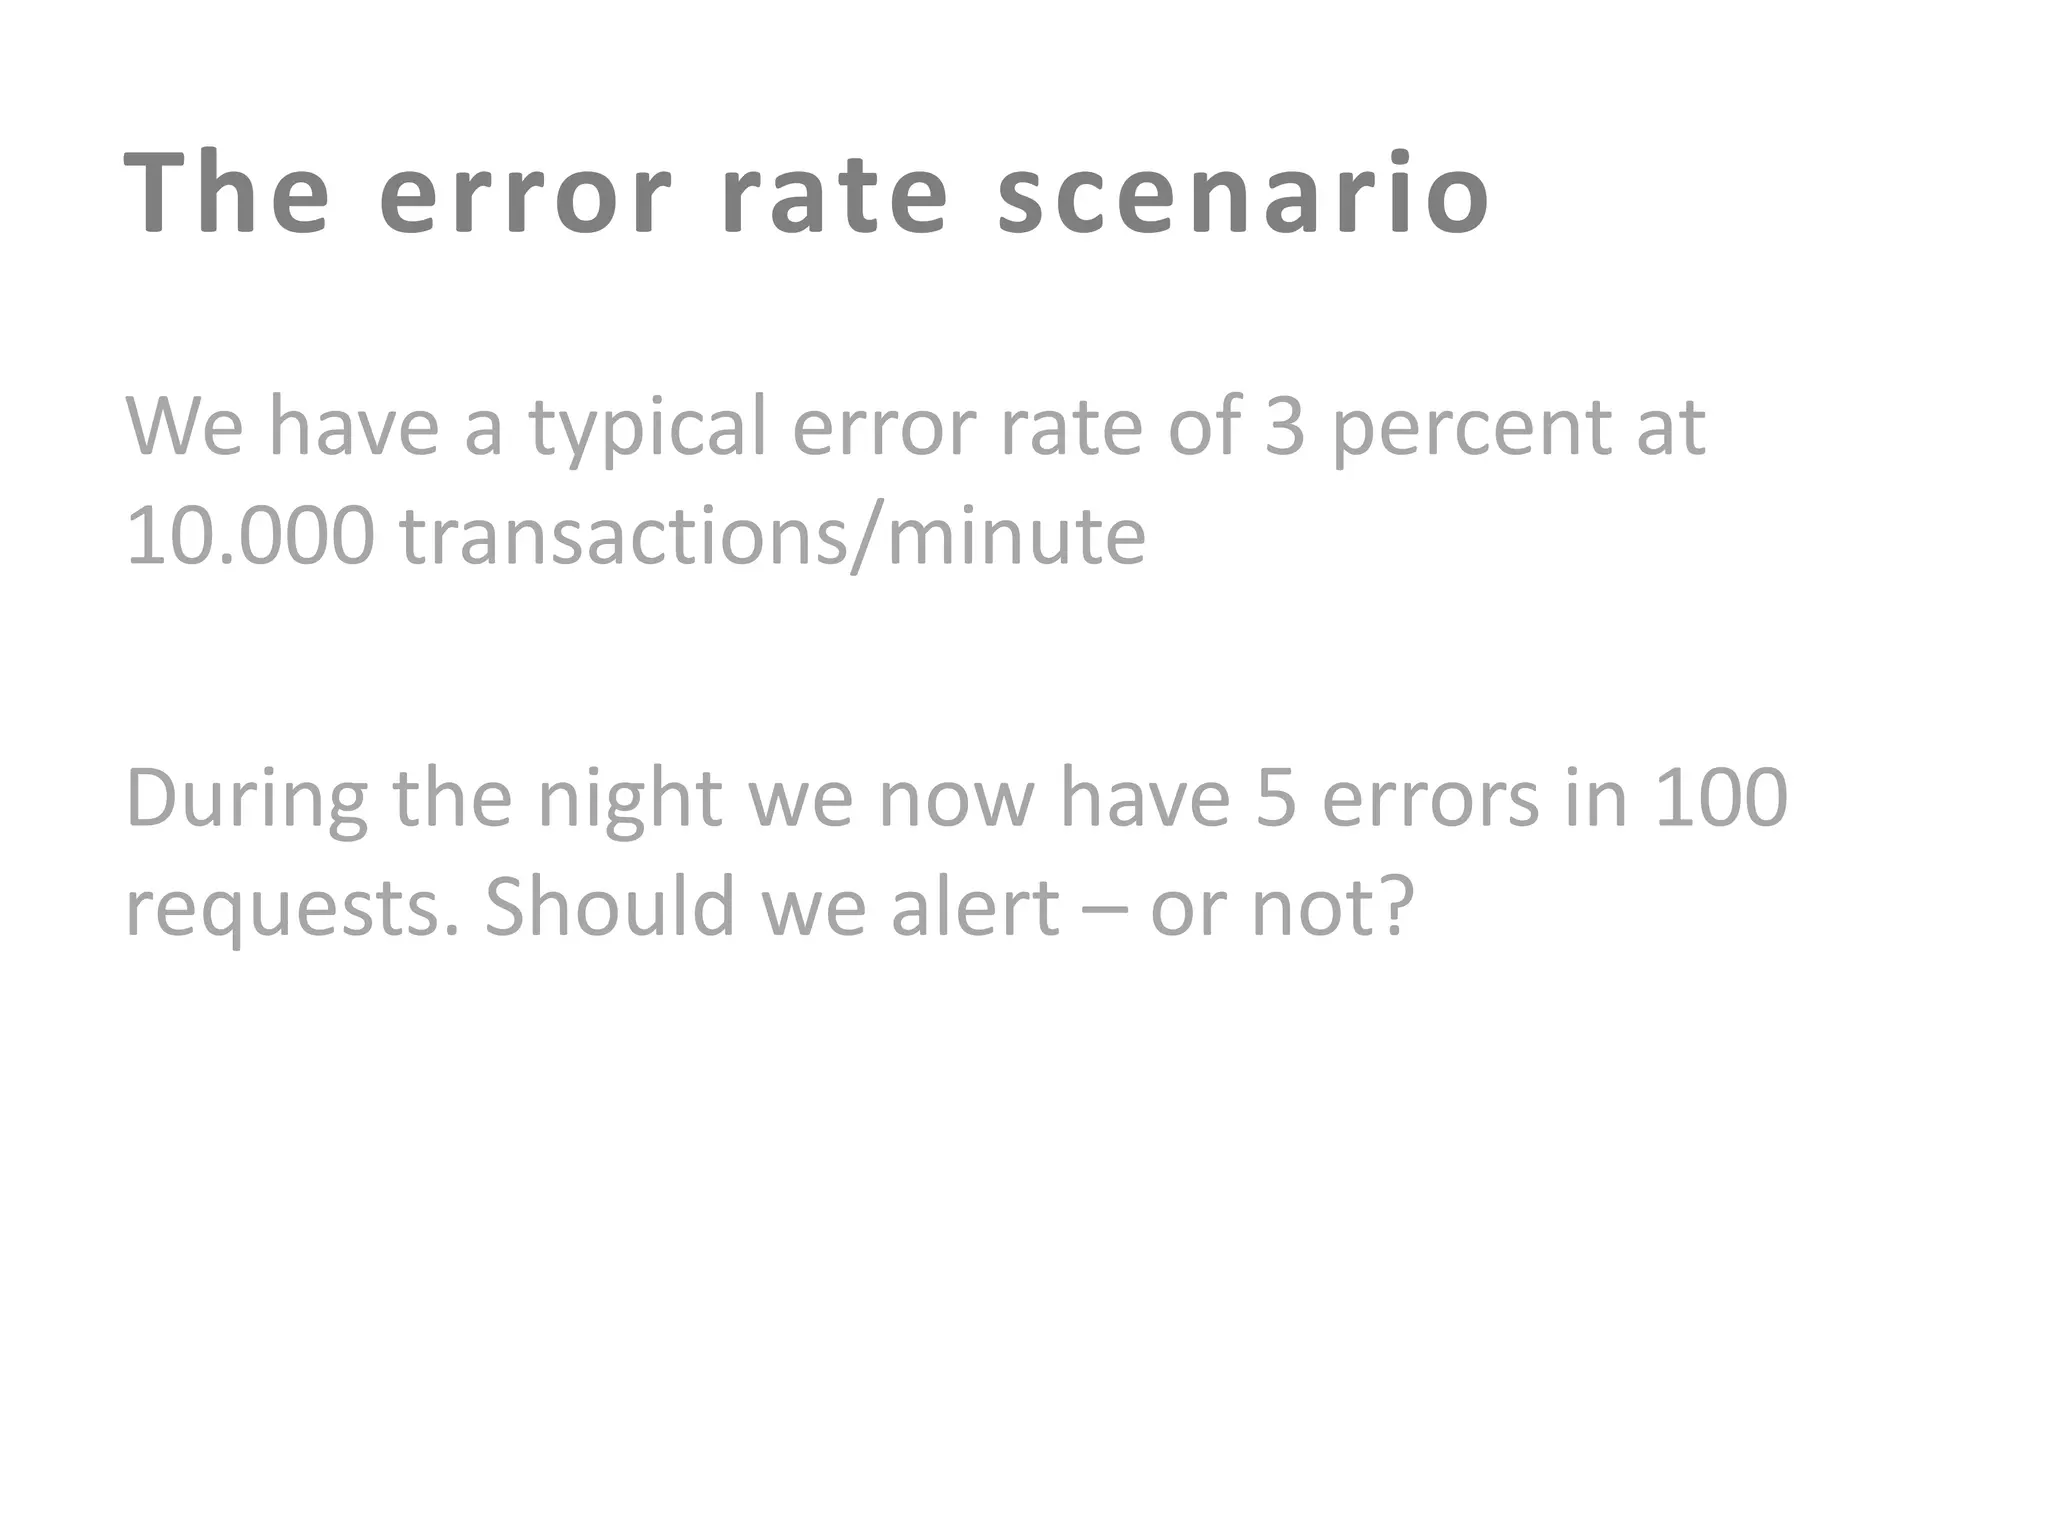
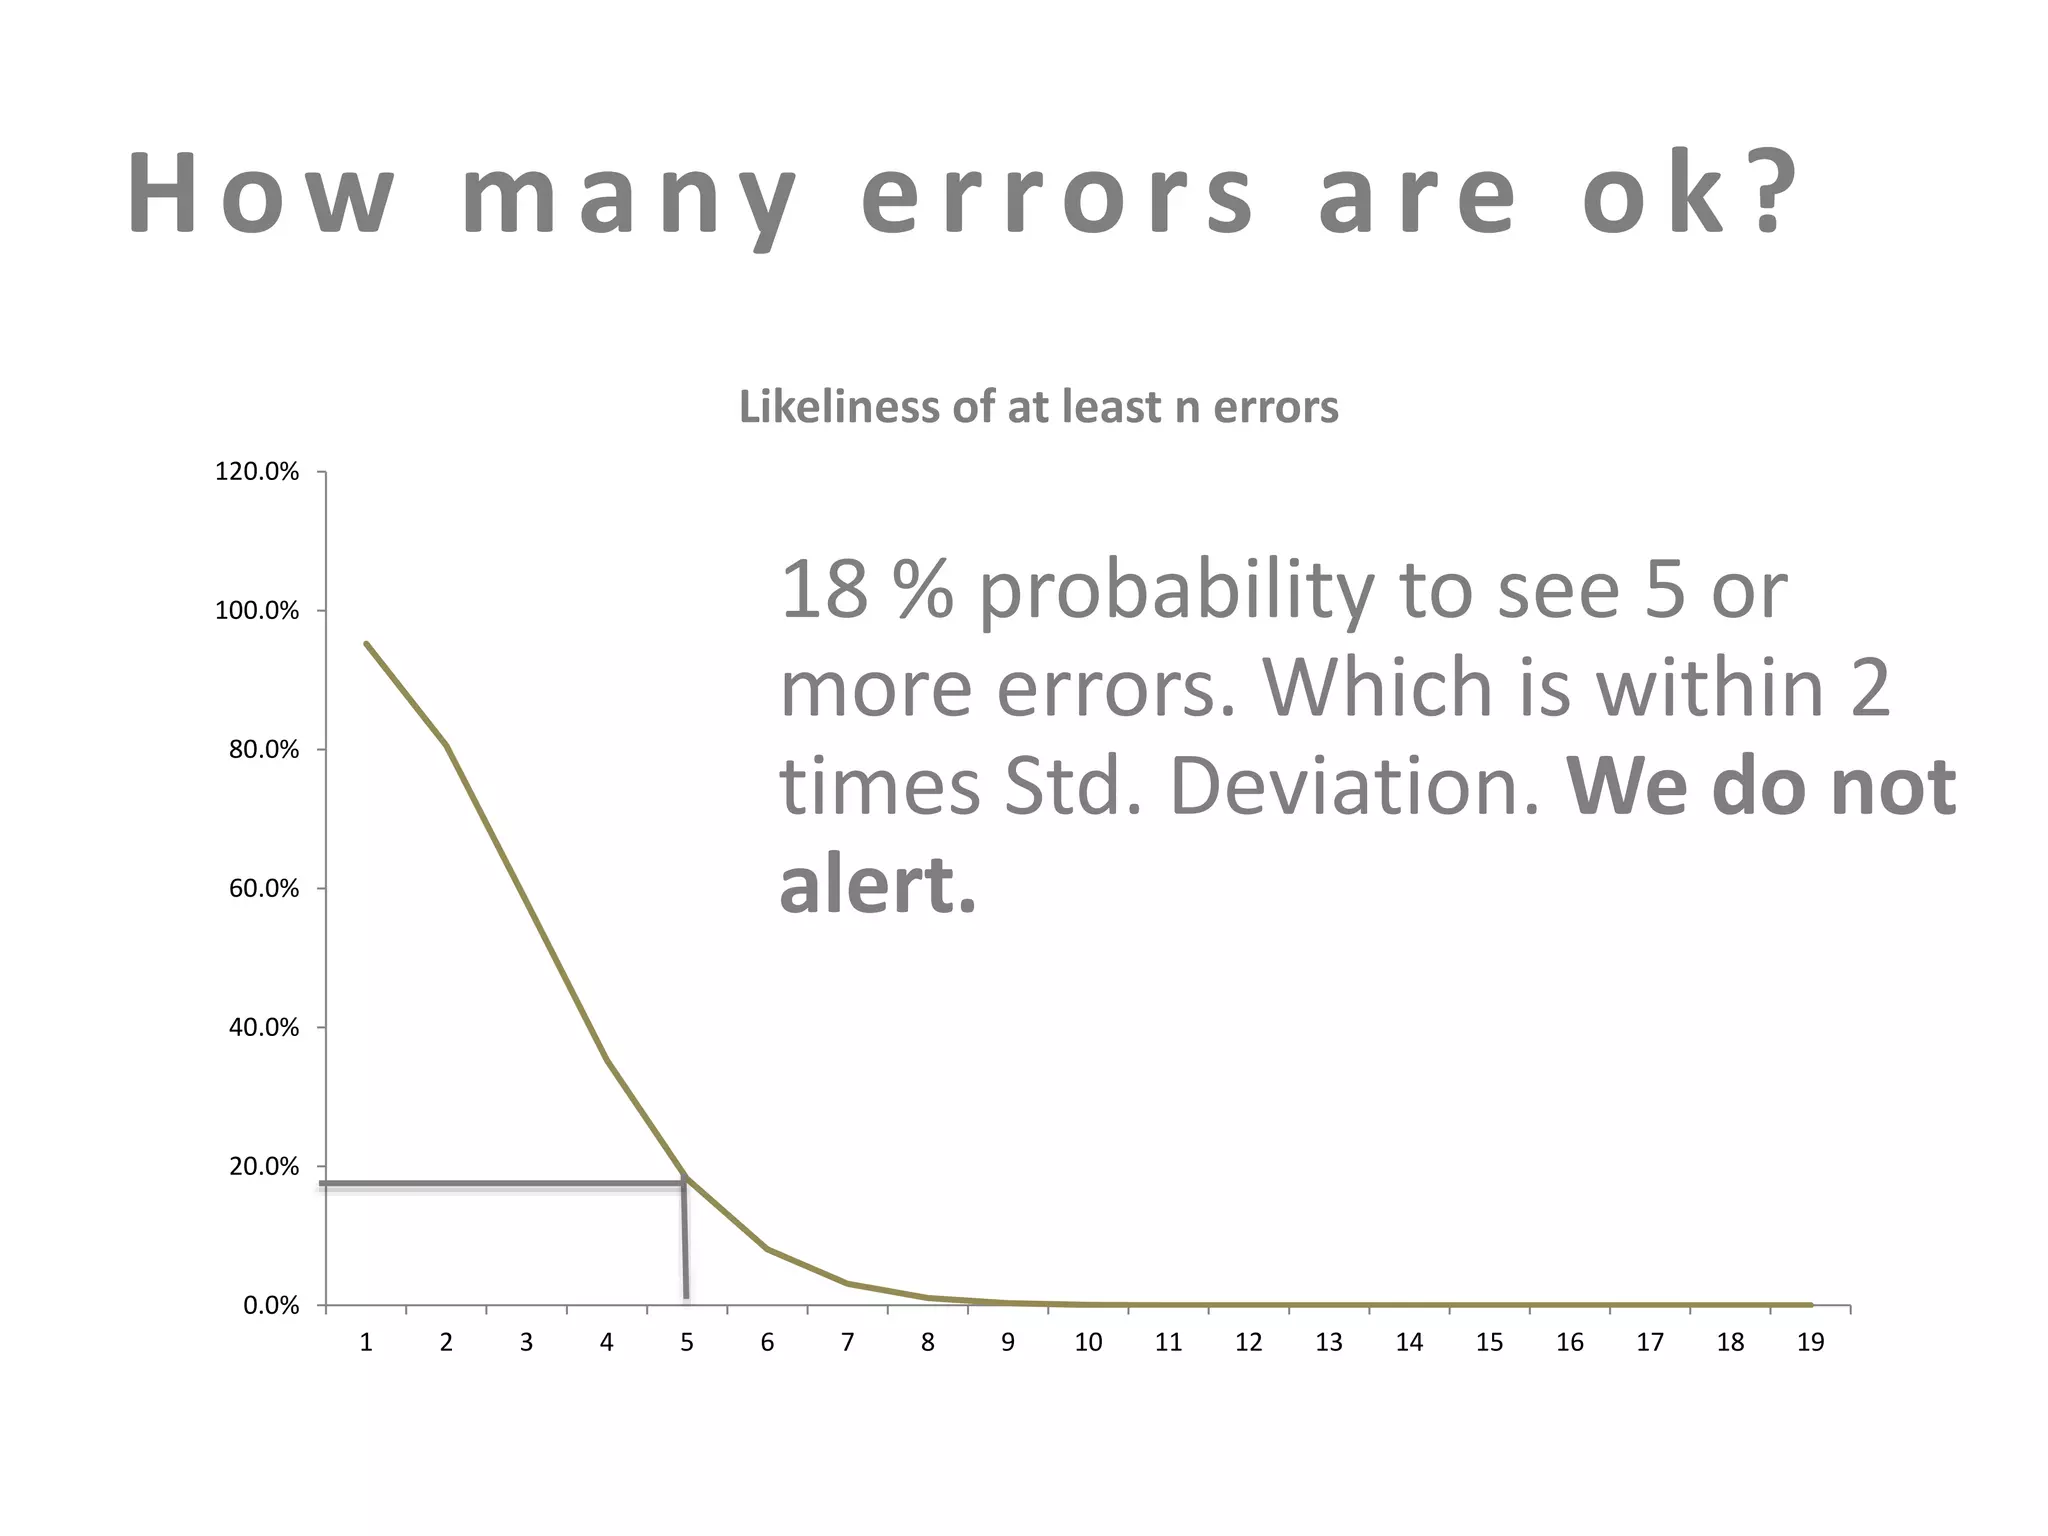
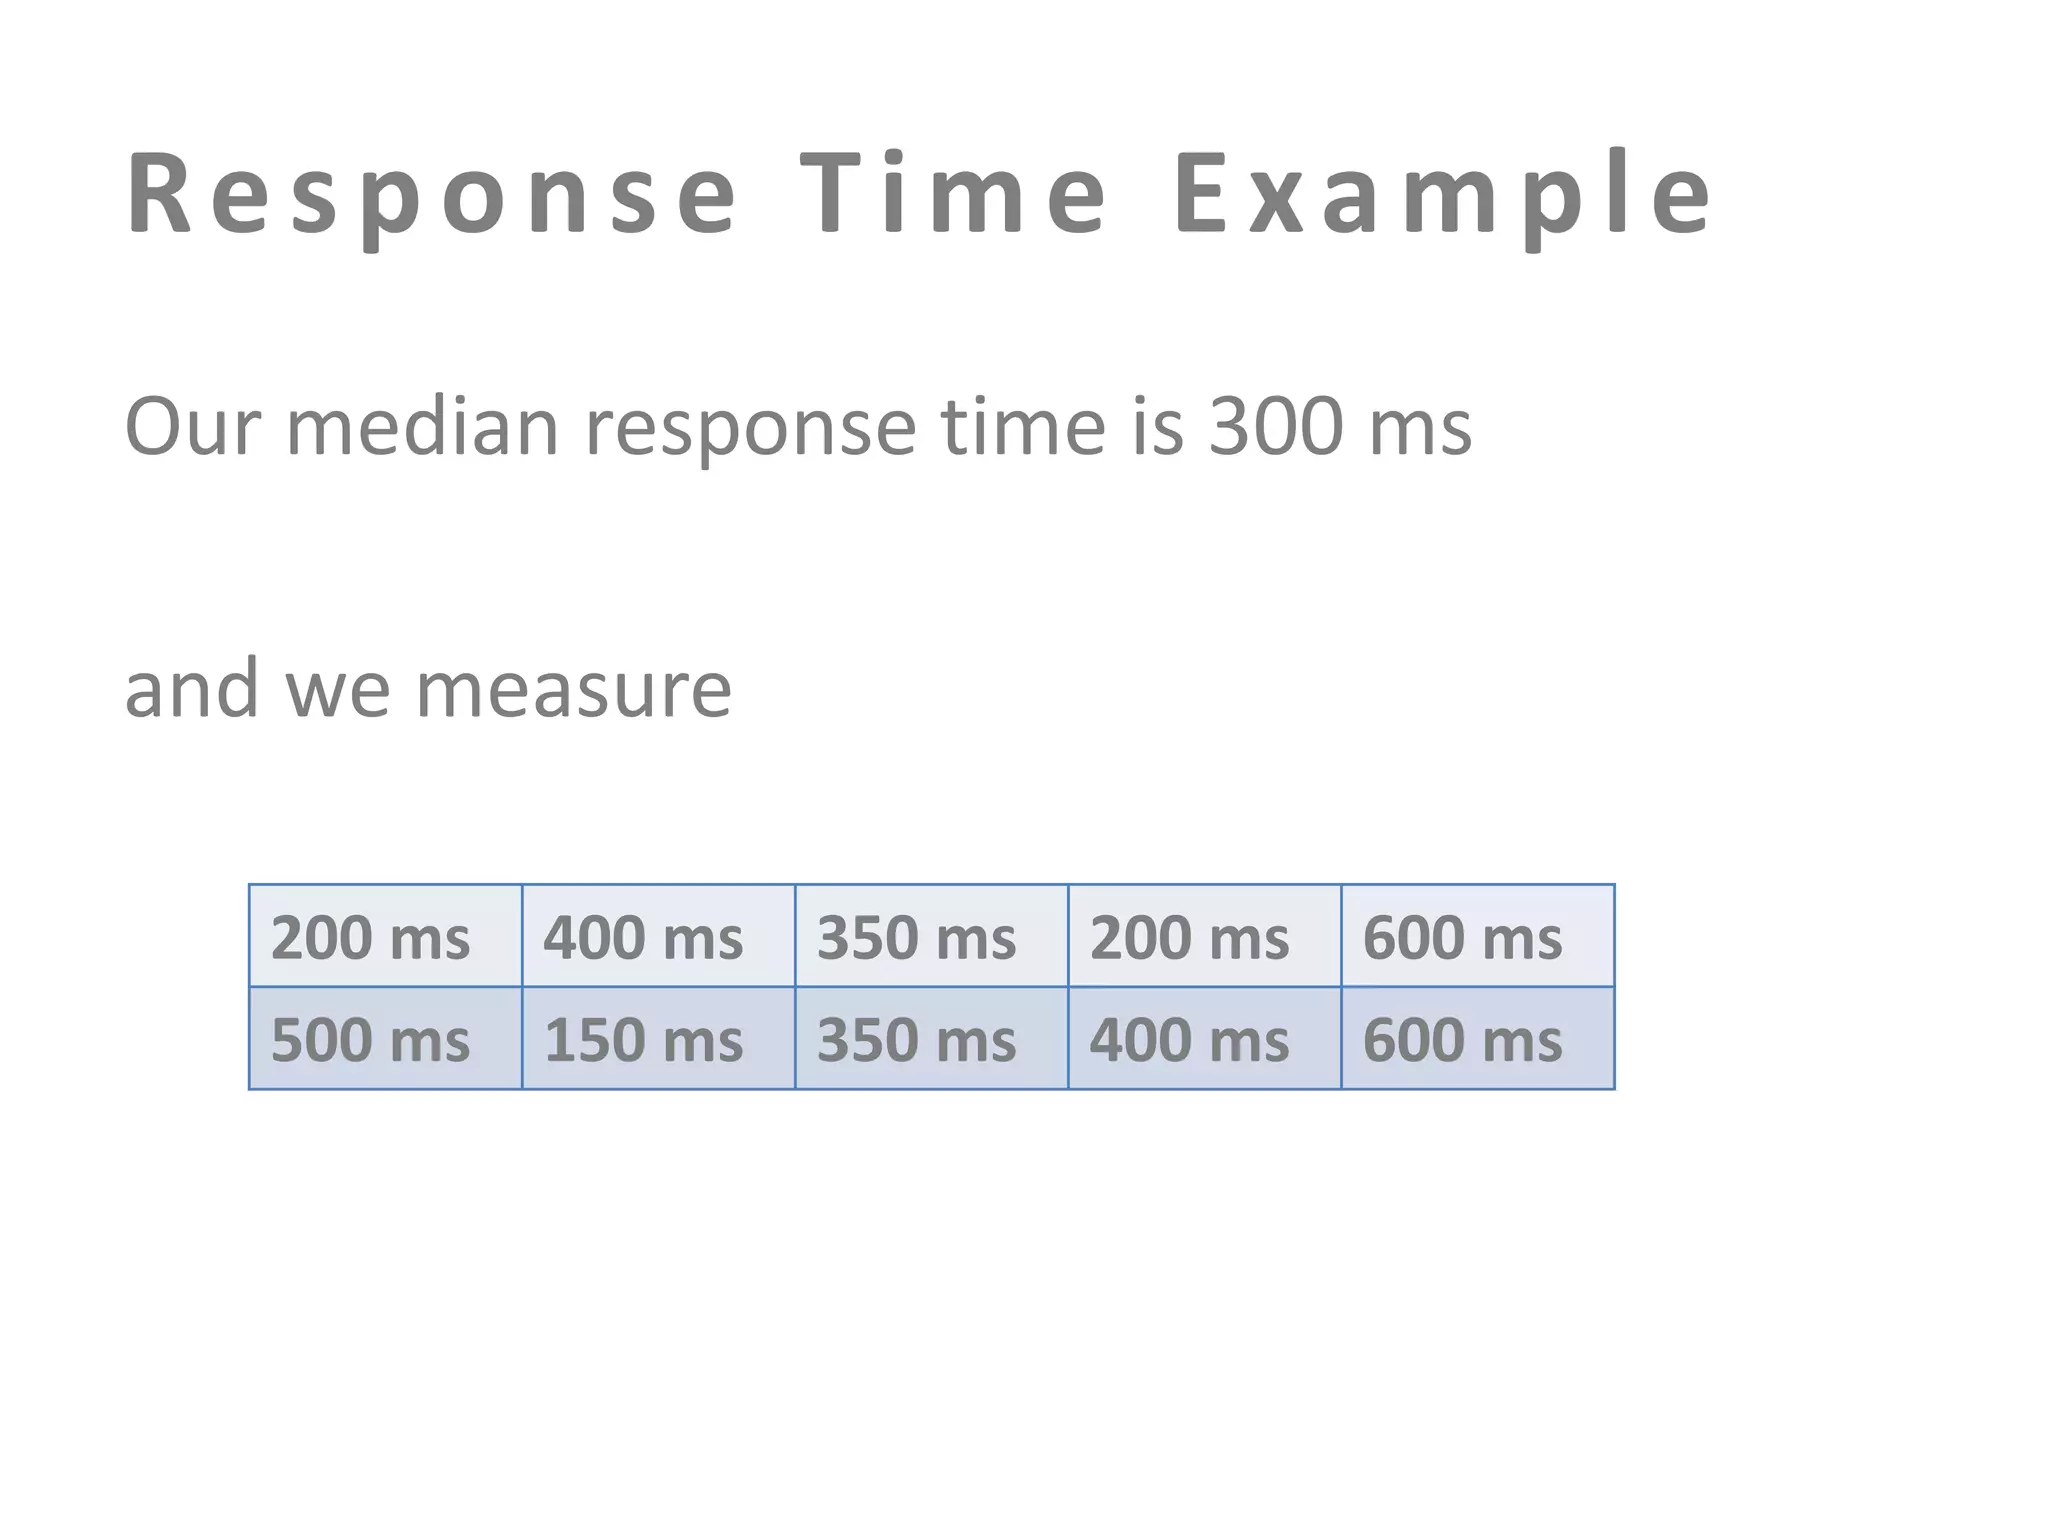
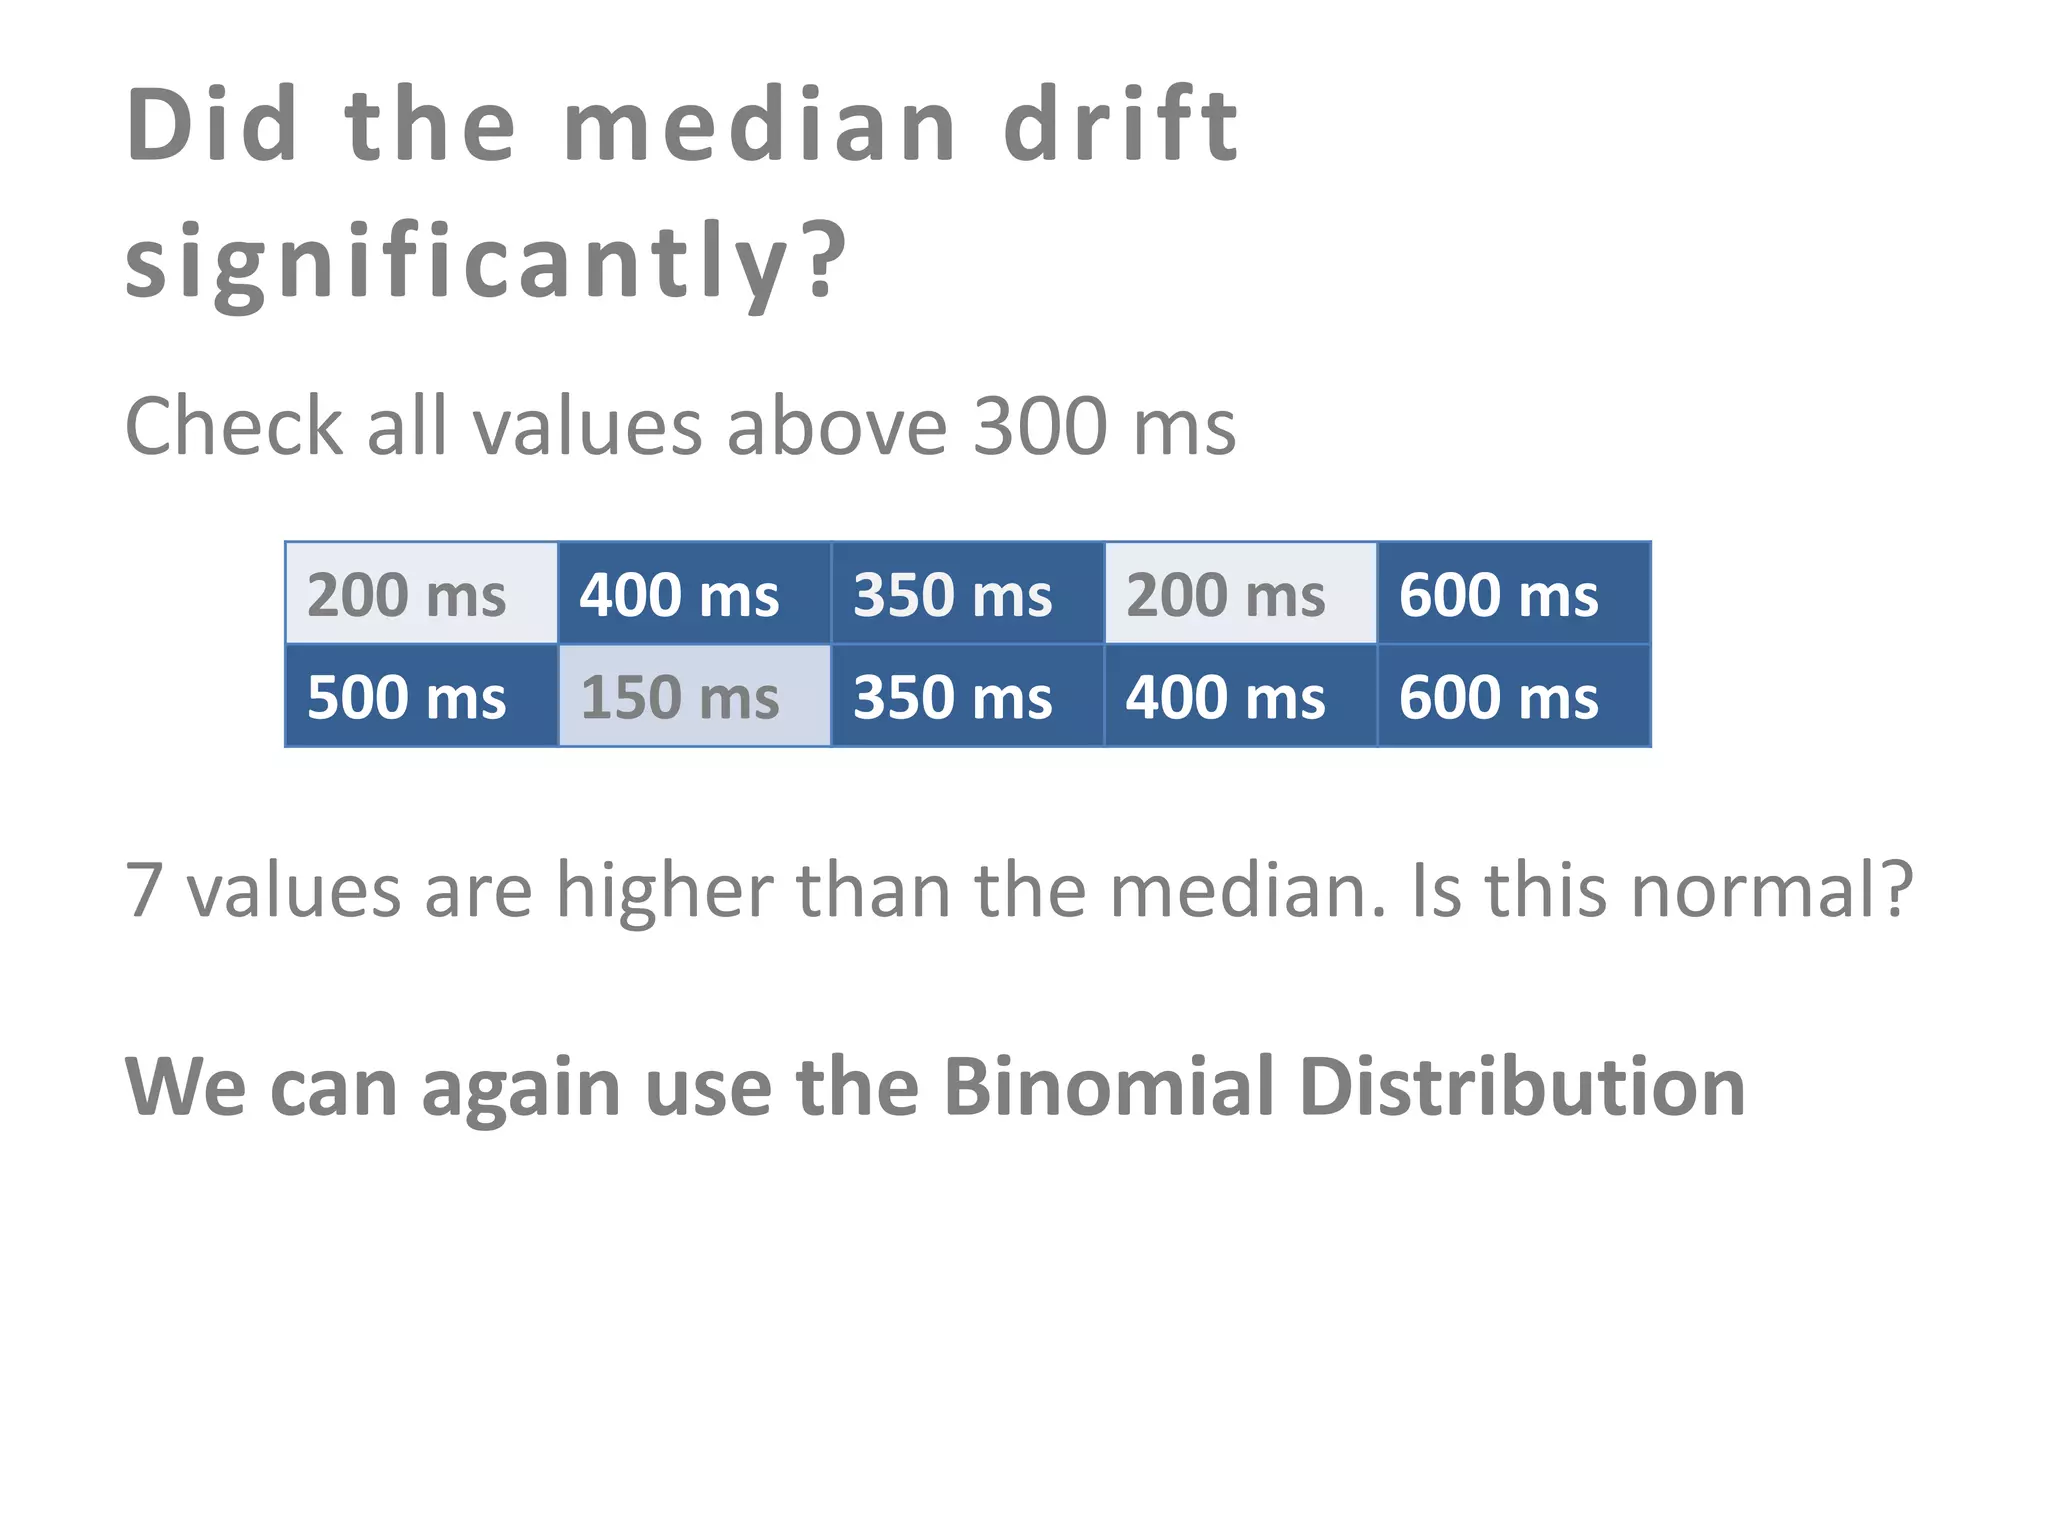
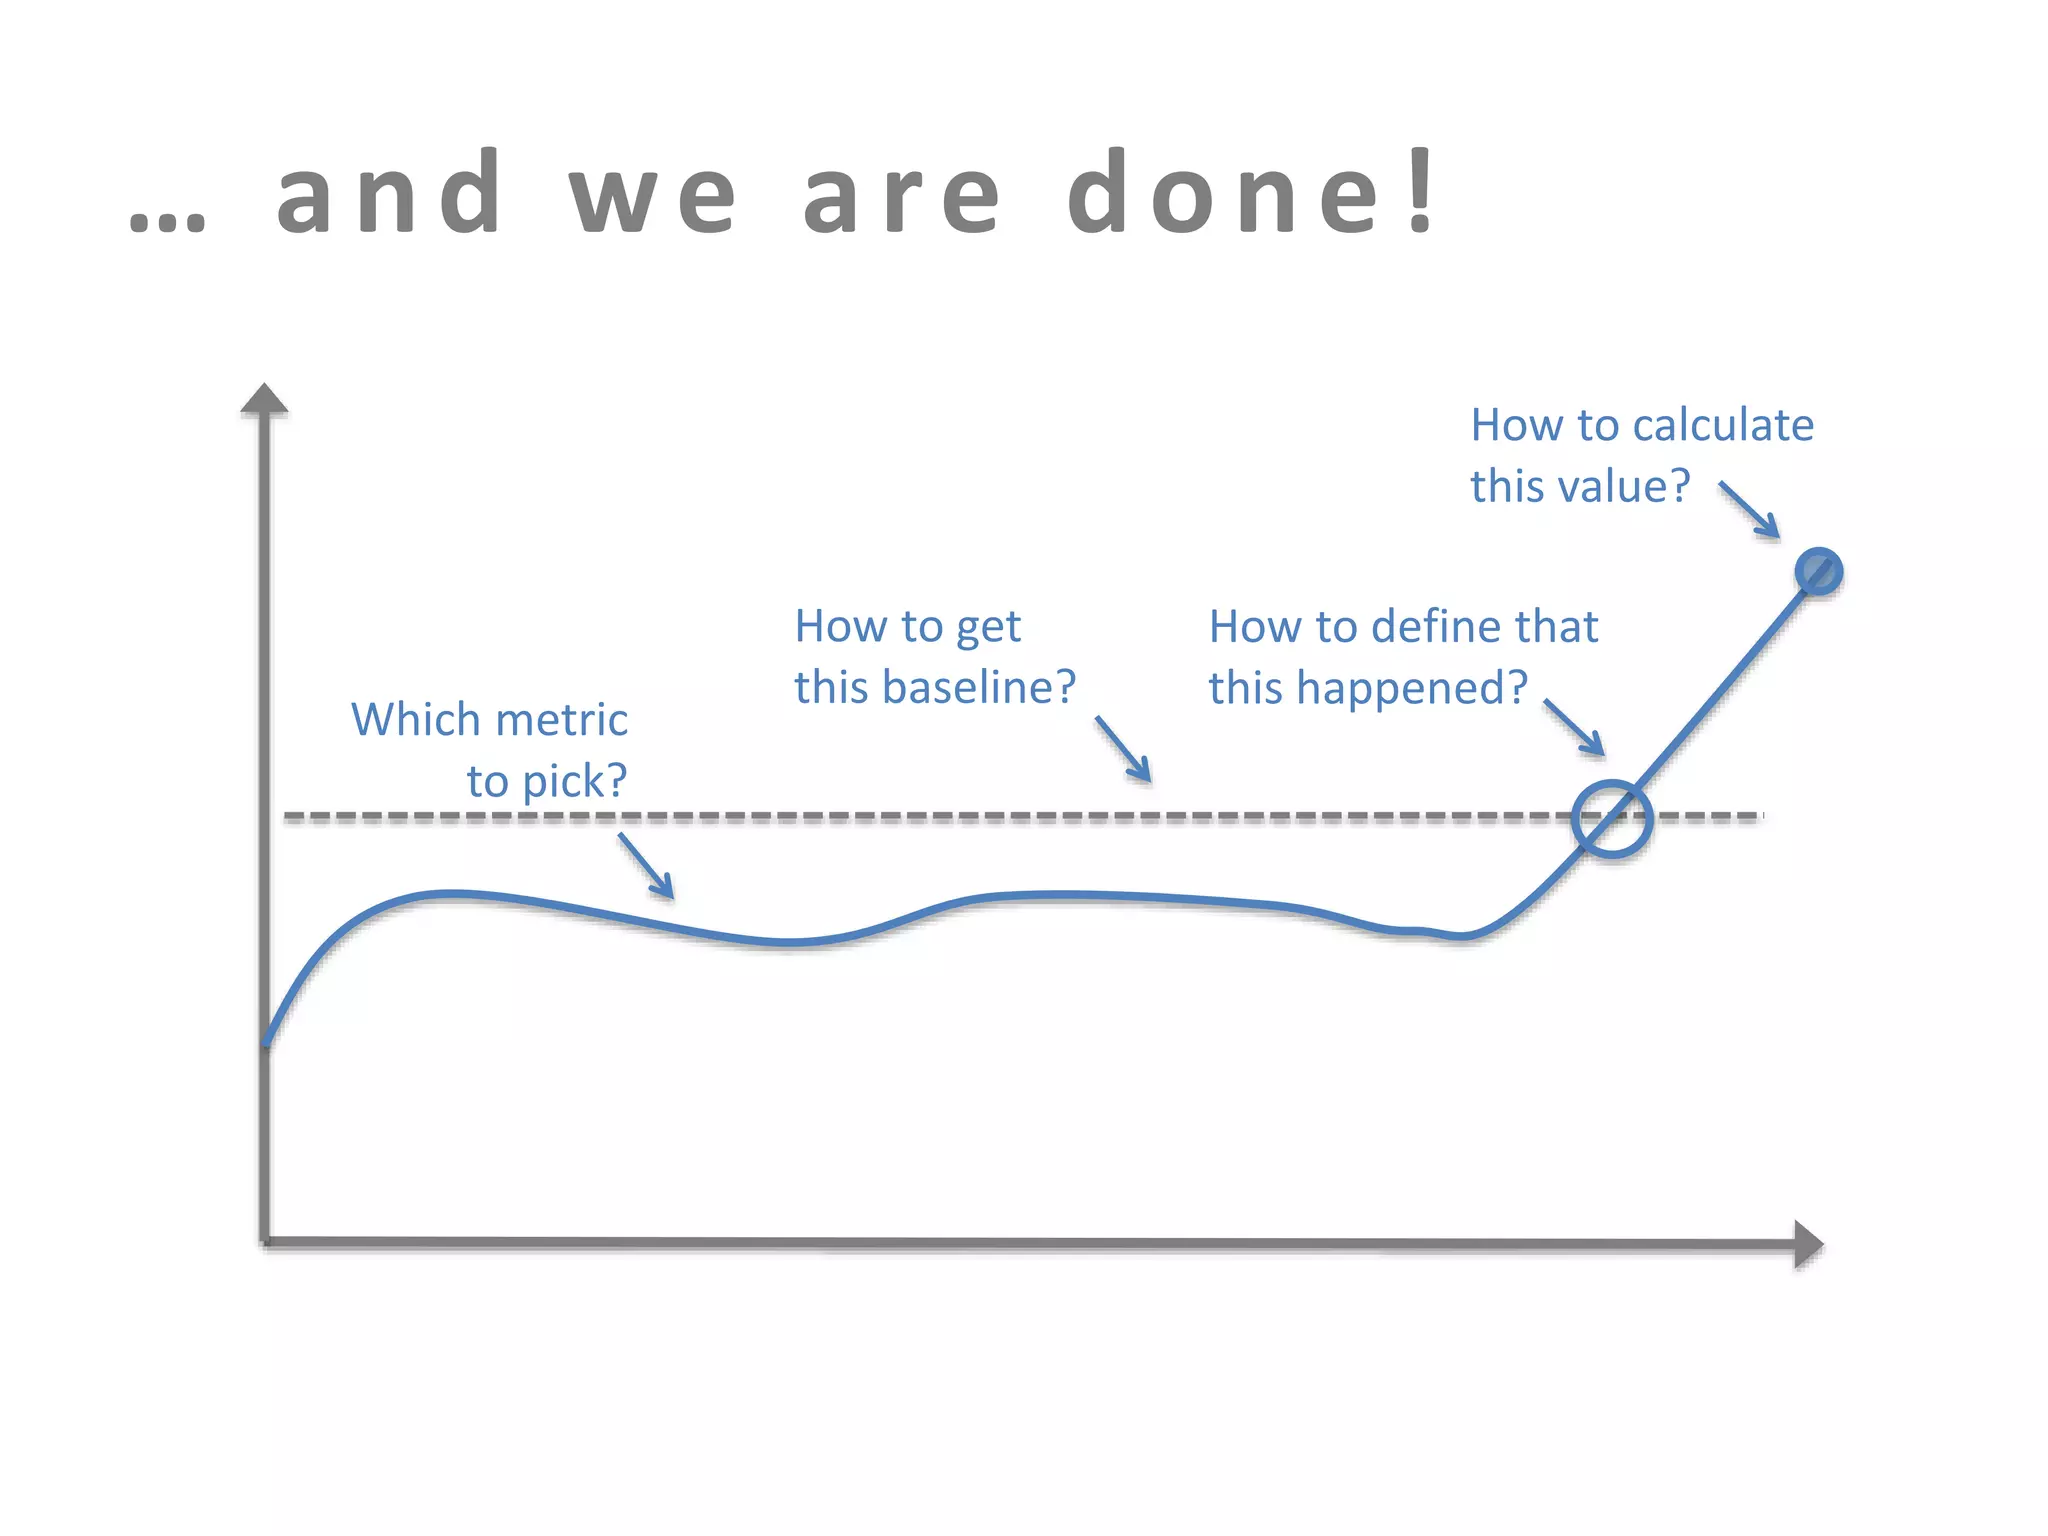
The document discusses building an effective production incident system using statistics. It explains that using the median and percentiles to define a baseline range captures normal system behavior better than trying to fit a specific distribution model. Two examples are provided: 1) Using the binomial distribution to determine if an error rate exceeds expectations. 2) Using percentiles to check if response times have drifted above the median without knowing the underlying distribution. The key is applying statistical methods to objectively determine what constitutes a normal range of values versus a problem requiring alerting.
Social Media use by Italian Critical Care doctors and nurses - 30° SMARTTommaso Scquizzato
Social Media use by Italian Critical Care doctors and nurses
presented at 30° SMART
Thanks to
Carlo D'Apuzzo
Velia Marta Antonini
Arianna Gazzato
Mario Rugna
Matteo Pagagini
Carmine Della Vella
Giuseppe Sfuncia
Forecasting using data workshop slides for the Deliver conference in Winnipeg October 2016. This session introduces practical exercises for probabilistic forecasting. http://www.prdcdeliver.com
Top 10 Tactics for Leveraging Behavioral Science to Enhance Member EngagementRevel
Revel CEO Jeff Fritz and Brad Hunt, Chief Marketing Officer, UnitedHealthcare Medicare & Retirement presented at the 9th Annual RISE Stars Master Class on December 11th in San Diego.
Healthcare consumerism is creating an opportunity for organizations to incorporate data driven tactics from industries like retail and finance and become more effective at influencing member behavior. Based on lessons learned from successful health engagement campaigns combined with Revel’s research on human behavior we’ll provide pragmatic tools and tips that strengthen engagement and enhance the member experience. Areas covered will include:
- Personalization tactics that map the healthcare consumer journey based on their individual preferences.
- Actionable predictive modeling techniques to identify strong campaign strategies and messages.
- Using behavior-based data to select the right messaging channels.
- Ideas for building meaningful, long-lasting relationships with members using consumer-based loyalty practices
7 Cases Where You Can't Afford to Skip Analytics TestingObservePoint
Data isn't inherently true—true data is true. So for your data strategy to work, you need to verify your analytics data is telling the truth.
In 7 Cases Where You Can’t Afford To Skip Analytics Testing, ObservePoint's VP Customer Success Patrick Hillery walks through how to avoid bad data quality at 7 critical breakage points. Hillery explains how to:
How Do You Infect Your Organization With Humane Ops?Matt Stratton
Richard Dawkins described memes as a being a form of cultural propagation, which is a way for people to transmit social memories and cultural ideas to each other. Not unlike the way that DNA and life will spread from location to location, a meme idea will also travel from mind to mind.
Changing the mindset of any organization to a more humane approach to ops - including awareness of alert fatigue, burnout risk, and proactive vs. reactive approaches - can seem impossible.
In this talk, I will discuss how the very DNA of an organization can evolve through the use of actionable communications from all levels - management, strategy, and practitioners. The “virus” of humane ops will infect your organization, providing a more sustainable approach to on-call, incident resolution, post-mortems, and more. There also will be copious references to the Neal Stephenson classic novel, Snow Crash.
After this talk, you will have ideas of practical approaches to effect change in your organization, regardless of your level of influence. While not every group will use the same “viruses”, you will take away a good understanding of where to get started as Patient Zero.
I take our currently implemented real-time analytics platform which makes decisions and takes autonomous action within our environment and repurpose it for a hypothetical solution to a phishing problem at a hypothetical startup.
This presentatiom provides a method of mathematical representation of the traffic flow of network states. Anomalous behavior in this model is represented as a point, not grouped in clusters allocated by the "alpha-stream" process
The definition of normal - An introduction and guide to anomaly detection. Alois Reitbauer
What is normal behaviour?
How are expectations about future behaviour derived from data?
How do anomaly detection algorithms work including trending and seasonality?
How do these algorithms know whether something is an anomaly?
Which algorithms can be used for which type of data?
Five Things I Learned While Building Anomaly Detection Tools - Toufic Boubez ...tboubez
This is my presentation from LISA 2014 in Seattle on November 14, 2014.
Most IT Ops teams only keep an eye on a small fraction of the metrics they collect because analyzing this haystack of data and extracting signal from the noise is not easy and generates too many false positives.
In this talk I will show some of the types of anomalies commonly found in dynamic data center environments and discuss the top 5 things I learned while building algorithms to find them. You will see how various Gaussian based techniques work (and why they don’t!), and we will go into some non-parametric methods that you can use to great advantage.
How Netflix developed anomaly detection algorithm which has been applied in multiple contexts
Robust to prior anomalies
Handle high cardinality dimensions
Handles seasonality
Handle data which is not always normally distributed
Challenge - more anomalies than we can handle from a human perspective
Evaluating Real-Time Anomaly Detection: The Numenta Anomaly BenchmarkNumenta
Subutai Ahmad, VP Research presenting NAB and discussing the need for evaluating real-time anomaly detection algorithms. This presentation was delivered at MLConf (Machine Learning Conference) in San Francisco 2015.
Machine Learning jobs are one of the top emerging jobs in the industry currently, and standing out during an interview is key for landing your desired job. Here are some Machine Learning interview questions you should know about, if you plan to build a successful career in the field.
Monitoring Complex Systems - Chicago Erlang, 2014Brian Troutwine
Imagine being responsible for monitoring 100 servers. Now imagine 1000. Each server has 100 different things to keep track of. What do you pay attention to and what do you ignore? What is important? In this talk Brian will show how Erlang can be used to capture more information without compromising clarity — i.e. to keep track of the forest without loosing site of the trees!
An IT Security Speedometer Approach. The Exposure Index is a model to merge threats- and vulnerability-metrics to one consolidated index value for management reporting. These slides show how to categorize metrics, normalize and weight them in the index system. Further discussion for this model is much appreciated.
Fundamentals for understanding what to look for and how to achieve high data quality. This eBook helps us dispel myths and face the realities of document processing (capture and recognition) in actual production environments:
* What we talk about when we talk about DATA QUALITY
* Understanding the recognition and capture technology options
* Differences between OCR and advanced recognition engines
* Examining case studies in full automation
The case study discusses all the phases of survey work from problem statement to statistical analysis.
Source: Research Methods in Marketing: Survey Research, Harvard Business Review, Rev. September 29, 1986.
Similar to The Dark of Building an Production Incident Syste (20)
Micro Services provide a means to build more flexible infrastructures that can maintained by large and distributed teams. Micro Deployments allow us to constantly evolve our applications step by step in small increments constantly. These paradigms helps us to achieve more agility. At the same time the force us to rethink how we run our DevOps processes. This talk covers the key requirements for DevOps follow the Site Reliability Engineering approach
How fast does a web page need to be in a certain industry. Learn about the characteristics of retail, travel and media sites. See what makes them fast or slow.
Ajax applications are different to classical web applications. This presentation covers performance relevant aspects architectures should consider when building ajax applications
Let's dive deeper into the world of ODC! Ricardo Alves (OutSystems) will join us to tell all about the new Data Fabric. After that, Sezen de Bruijn (OutSystems) will get into the details on how to best design a sturdy architecture within ODC.
GDG Cloud Southlake #33: Boule & Rebala: Effective AppSec in SDLC using Deplo...James Anderson
Effective Application Security in Software Delivery lifecycle using Deployment Firewall and DBOM
The modern software delivery process (or the CI/CD process) includes many tools, distributed teams, open-source code, and cloud platforms. Constant focus on speed to release software to market, along with the traditional slow and manual security checks has caused gaps in continuous security as an important piece in the software supply chain. Today organizations feel more susceptible to external and internal cyber threats due to the vast attack surface in their applications supply chain and the lack of end-to-end governance and risk management.
The software team must secure its software delivery process to avoid vulnerability and security breaches. This needs to be achieved with existing tool chains and without extensive rework of the delivery processes. This talk will present strategies and techniques for providing visibility into the true risk of the existing vulnerabilities, preventing the introduction of security issues in the software, resolving vulnerabilities in production environments quickly, and capturing the deployment bill of materials (DBOM).
Speakers:
Bob Boule
Robert Boule is a technology enthusiast with PASSION for technology and making things work along with a knack for helping others understand how things work. He comes with around 20 years of solution engineering experience in application security, software continuous delivery, and SaaS platforms. He is known for his dynamic presentations in CI/CD and application security integrated in software delivery lifecycle.
Gopinath Rebala
Gopinath Rebala is the CTO of OpsMx, where he has overall responsibility for the machine learning and data processing architectures for Secure Software Delivery. Gopi also has a strong connection with our customers, leading design and architecture for strategic implementations. Gopi is a frequent speaker and well-known leader in continuous delivery and integrating security into software delivery.
Neuro-symbolic is not enough, we need neuro-*semantic*Frank van Harmelen
Neuro-symbolic (NeSy) AI is on the rise. However, simply machine learning on just any symbolic structure is not sufficient to really harvest the gains of NeSy. These will only be gained when the symbolic structures have an actual semantics. I give an operational definition of semantics as “predictable inference”.
All of this illustrated with link prediction over knowledge graphs, but the argument is general.
Smart TV Buyer Insights Survey 2024 by 91mobiles.pdf91mobiles
91mobiles recently conducted a Smart TV Buyer Insights Survey in which we asked over 3,000 respondents about the TV they own, aspects they look at on a new TV, and their TV buying preferences.
GraphRAG is All You need? LLM & Knowledge GraphGuy Korland
Guy Korland, CEO and Co-founder of FalkorDB, will review two articles on the integration of language models with knowledge graphs.
1. Unifying Large Language Models and Knowledge Graphs: A Roadmap.
https://arxiv.org/abs/2306.08302
2. Microsoft Research's GraphRAG paper and a review paper on various uses of knowledge graphs:
https://www.microsoft.com/en-us/research/blog/graphrag-unlocking-llm-discovery-on-narrative-private-data/
Key Trends Shaping the Future of Infrastructure.pdfCheryl Hung
Keynote at DIGIT West Expo, Glasgow on 29 May 2024.
Cheryl Hung, ochery.com
Sr Director, Infrastructure Ecosystem, Arm.
The key trends across hardware, cloud and open-source; exploring how these areas are likely to mature and develop over the short and long-term, and then considering how organisations can position themselves to adapt and thrive.
Epistemic Interaction - tuning interfaces to provide information for AI supportAlan Dix
Paper presented at SYNERGY workshop at AVI 2024, Genoa, Italy. 3rd June 2024
https://alandix.com/academic/papers/synergy2024-epistemic/
As machine learning integrates deeper into human-computer interactions, the concept of epistemic interaction emerges, aiming to refine these interactions to enhance system adaptability. This approach encourages minor, intentional adjustments in user behaviour to enrich the data available for system learning. This paper introduces epistemic interaction within the context of human-system communication, illustrating how deliberate interaction design can improve system understanding and adaptation. Through concrete examples, we demonstrate the potential of epistemic interaction to significantly advance human-computer interaction by leveraging intuitive human communication strategies to inform system design and functionality, offering a novel pathway for enriching user-system engagements.
JMeter webinar - integration with InfluxDB and GrafanaRTTS
Watch this recorded webinar about real-time monitoring of application performance. See how to integrate Apache JMeter, the open-source leader in performance testing, with InfluxDB, the open-source time-series database, and Grafana, the open-source analytics and visualization application.
In this webinar, we will review the benefits of leveraging InfluxDB and Grafana when executing load tests and demonstrate how these tools are used to visualize performance metrics.
Length: 30 minutes
Session Overview
-------------------------------------------
During this webinar, we will cover the following topics while demonstrating the integrations of JMeter, InfluxDB and Grafana:
- What out-of-the-box solutions are available for real-time monitoring JMeter tests?
- What are the benefits of integrating InfluxDB and Grafana into the load testing stack?
- Which features are provided by Grafana?
- Demonstration of InfluxDB and Grafana using a practice web application
To view the webinar recording, go to:
https://www.rttsweb.com/jmeter-integration-webinar
Essentials of Automations: Optimizing FME Workflows with ParametersSafe Software
Are you looking to streamline your workflows and boost your projects’ efficiency? Do you find yourself searching for ways to add flexibility and control over your FME workflows? If so, you’re in the right place.
Join us for an insightful dive into the world of FME parameters, a critical element in optimizing workflow efficiency. This webinar marks the beginning of our three-part “Essentials of Automation” series. This first webinar is designed to equip you with the knowledge and skills to utilize parameters effectively: enhancing the flexibility, maintainability, and user control of your FME projects.
Here’s what you’ll gain:
- Essentials of FME Parameters: Understand the pivotal role of parameters, including Reader/Writer, Transformer, User, and FME Flow categories. Discover how they are the key to unlocking automation and optimization within your workflows.
- Practical Applications in FME Form: Delve into key user parameter types including choice, connections, and file URLs. Allow users to control how a workflow runs, making your workflows more reusable. Learn to import values and deliver the best user experience for your workflows while enhancing accuracy.
- Optimization Strategies in FME Flow: Explore the creation and strategic deployment of parameters in FME Flow, including the use of deployment and geometry parameters, to maximize workflow efficiency.
- Pro Tips for Success: Gain insights on parameterizing connections and leveraging new features like Conditional Visibility for clarity and simplicity.
We’ll wrap up with a glimpse into future webinars, followed by a Q&A session to address your specific questions surrounding this topic.
Don’t miss this opportunity to elevate your FME expertise and drive your projects to new heights of efficiency.
The Art of the Pitch: WordPress Relationships and SalesLaura Byrne
Clients don’t know what they don’t know. What web solutions are right for them? How does WordPress come into the picture? How do you make sure you understand scope and timeline? What do you do if sometime changes?
All these questions and more will be explored as we talk about matching clients’ needs with what your agency offers without pulling teeth or pulling your hair out. Practical tips, and strategies for successful relationship building that leads to closing the deal.
16. Three types of metrics
Capacity Metrics
Define how much of resource is used.
Discrete Metrics
Simple countable things, like errors or users.
Continuous Metrics
Metrics represented by a range of values at any
given time.
29. A baseline is not a number
Baselines define the range of a value combined
with a probability
30. Normal distribution as baseline
Mean: 500 ms
Std. Dev.: 100 ms
0
100
200
300
400
500
600
68 %
400ms – 500 ms
95 %
300ms – 700 ms
99 %
200ms – 800 ms
700
800
900
31. This can go really wrong
“Why alerts suck and monitoring solutions need to become better”
44. Fortunately this is not the
problem we need to solve
We are only talking about missed expectations
45. Let’s look at two scenarios
Errors
Is a certain error rate likely to happen or not?
Response Times
Is a certain increase in response time significant
enough to trigger an incident?
46. The error rate scenario
We have a typical error rate of 3 percent at
10.000 transactions/minute
During the night we now have 5 errors in 100
requests. Should we alert – or not?
49. B i n o m i a l D i st r i b u t i o n
Tells us how likely it is to see n successes in a
certain number of trials
50. How many errors are ok?
Likeliness of at least n errors
120.0%
18 % probability to see 5 or
more errors. Which is within 2
times Std. Deviation. We do not
alert.
100.0%
80.0%
60.0%
40.0%
20.0%
0.0%
1
2
3
4
5
6
7
8
9
10
11
12
13
14
15
16
17
18
19
51. Response Time Example
Our median response time is 300 ms
and we measure
200 ms
500 ms
400 ms
150 ms
350 ms
350 ms
200 ms
400 ms
600 ms
600 ms
53. Did the median drift
significantly?
Check all values above 300 ms
200 ms
500 ms
400 ms
150 ms
350 ms
350 ms
200 ms
400 ms
600 ms
600 ms
7 values are higher than the median. Is this normal?
We can again use the Binomial Distribution
54. Applying the Binomial
Distribution
We have a 50 percent likeliness to see values
above the median.
How likely is is that 7 out of 10 samples are higher?
The probability is 17 percent, so we should not alert.
55. … and we are done!
How to calculate
this value?
Which metric
to pick?
How to get
this baseline?
How to define that
this happened?
56. This was just the beginning
There are many more use things about statistics,
probabilities, testing, ….