


![... now without external dependencies
# of # of Total DNS Connect
Domains Resources Bytes [ms] [ms]
With Third Party Content 26 176 2856 Kb 1286,82 1176,09
Without Third Party
2 59 897 Kb 0,91 22,25
Content](https://image.slidesharecdn.com/holtzbrinck-130418143953-phpapp02/75/The-High-Performance-Web-Application-Lifecycle-17-2048.jpg)
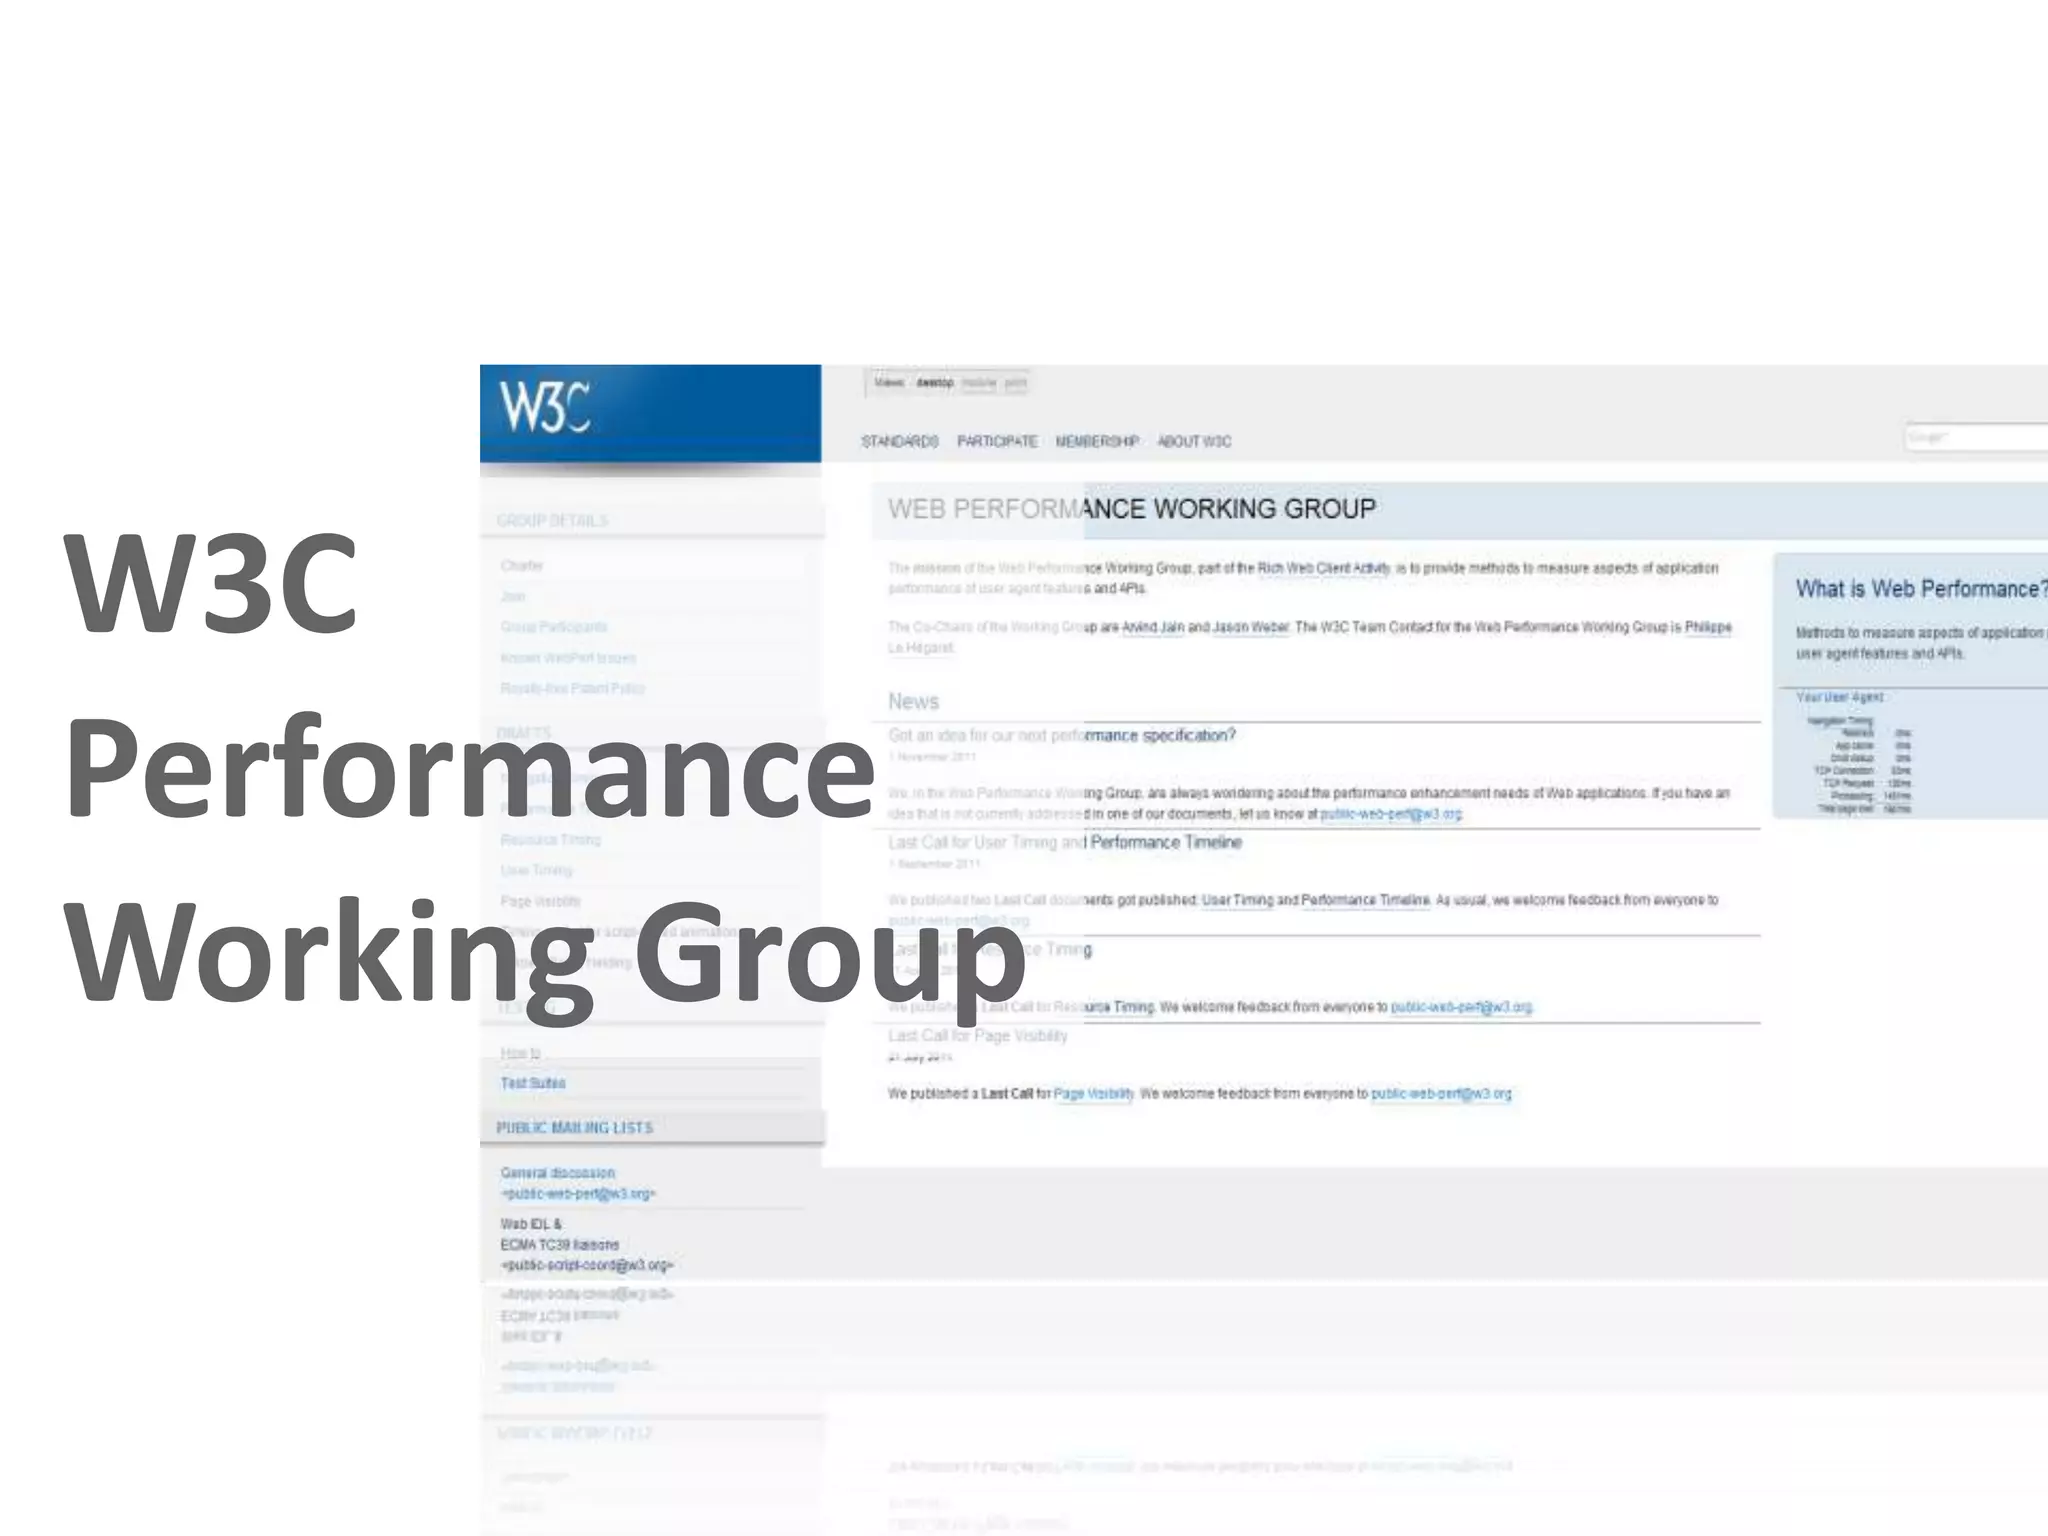
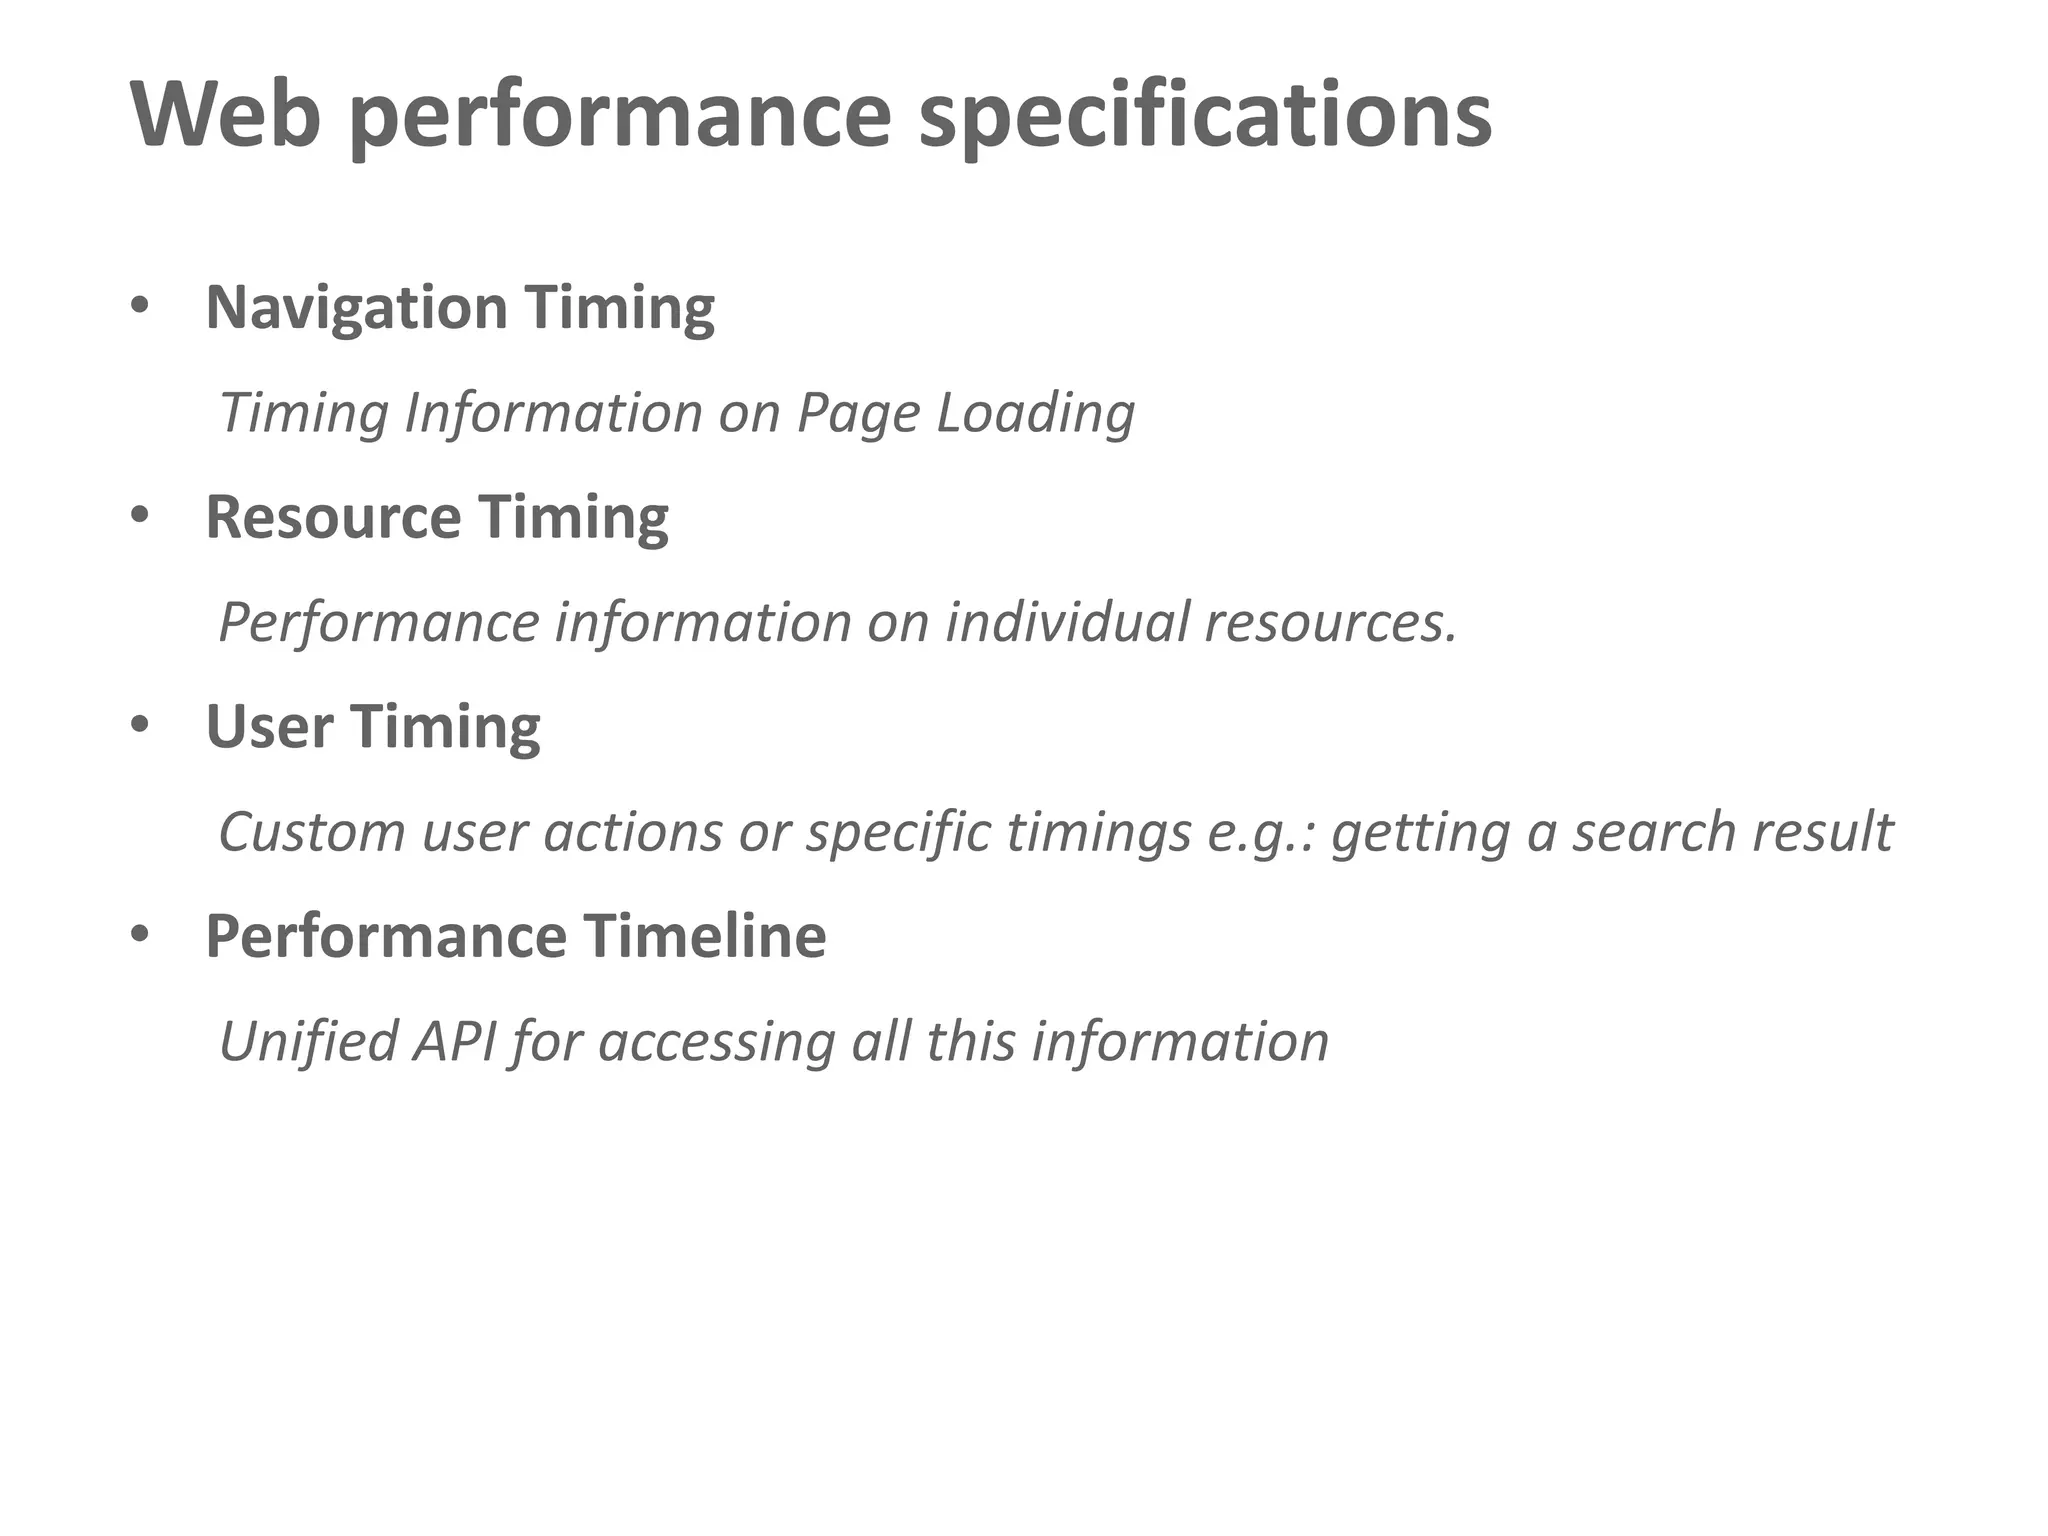
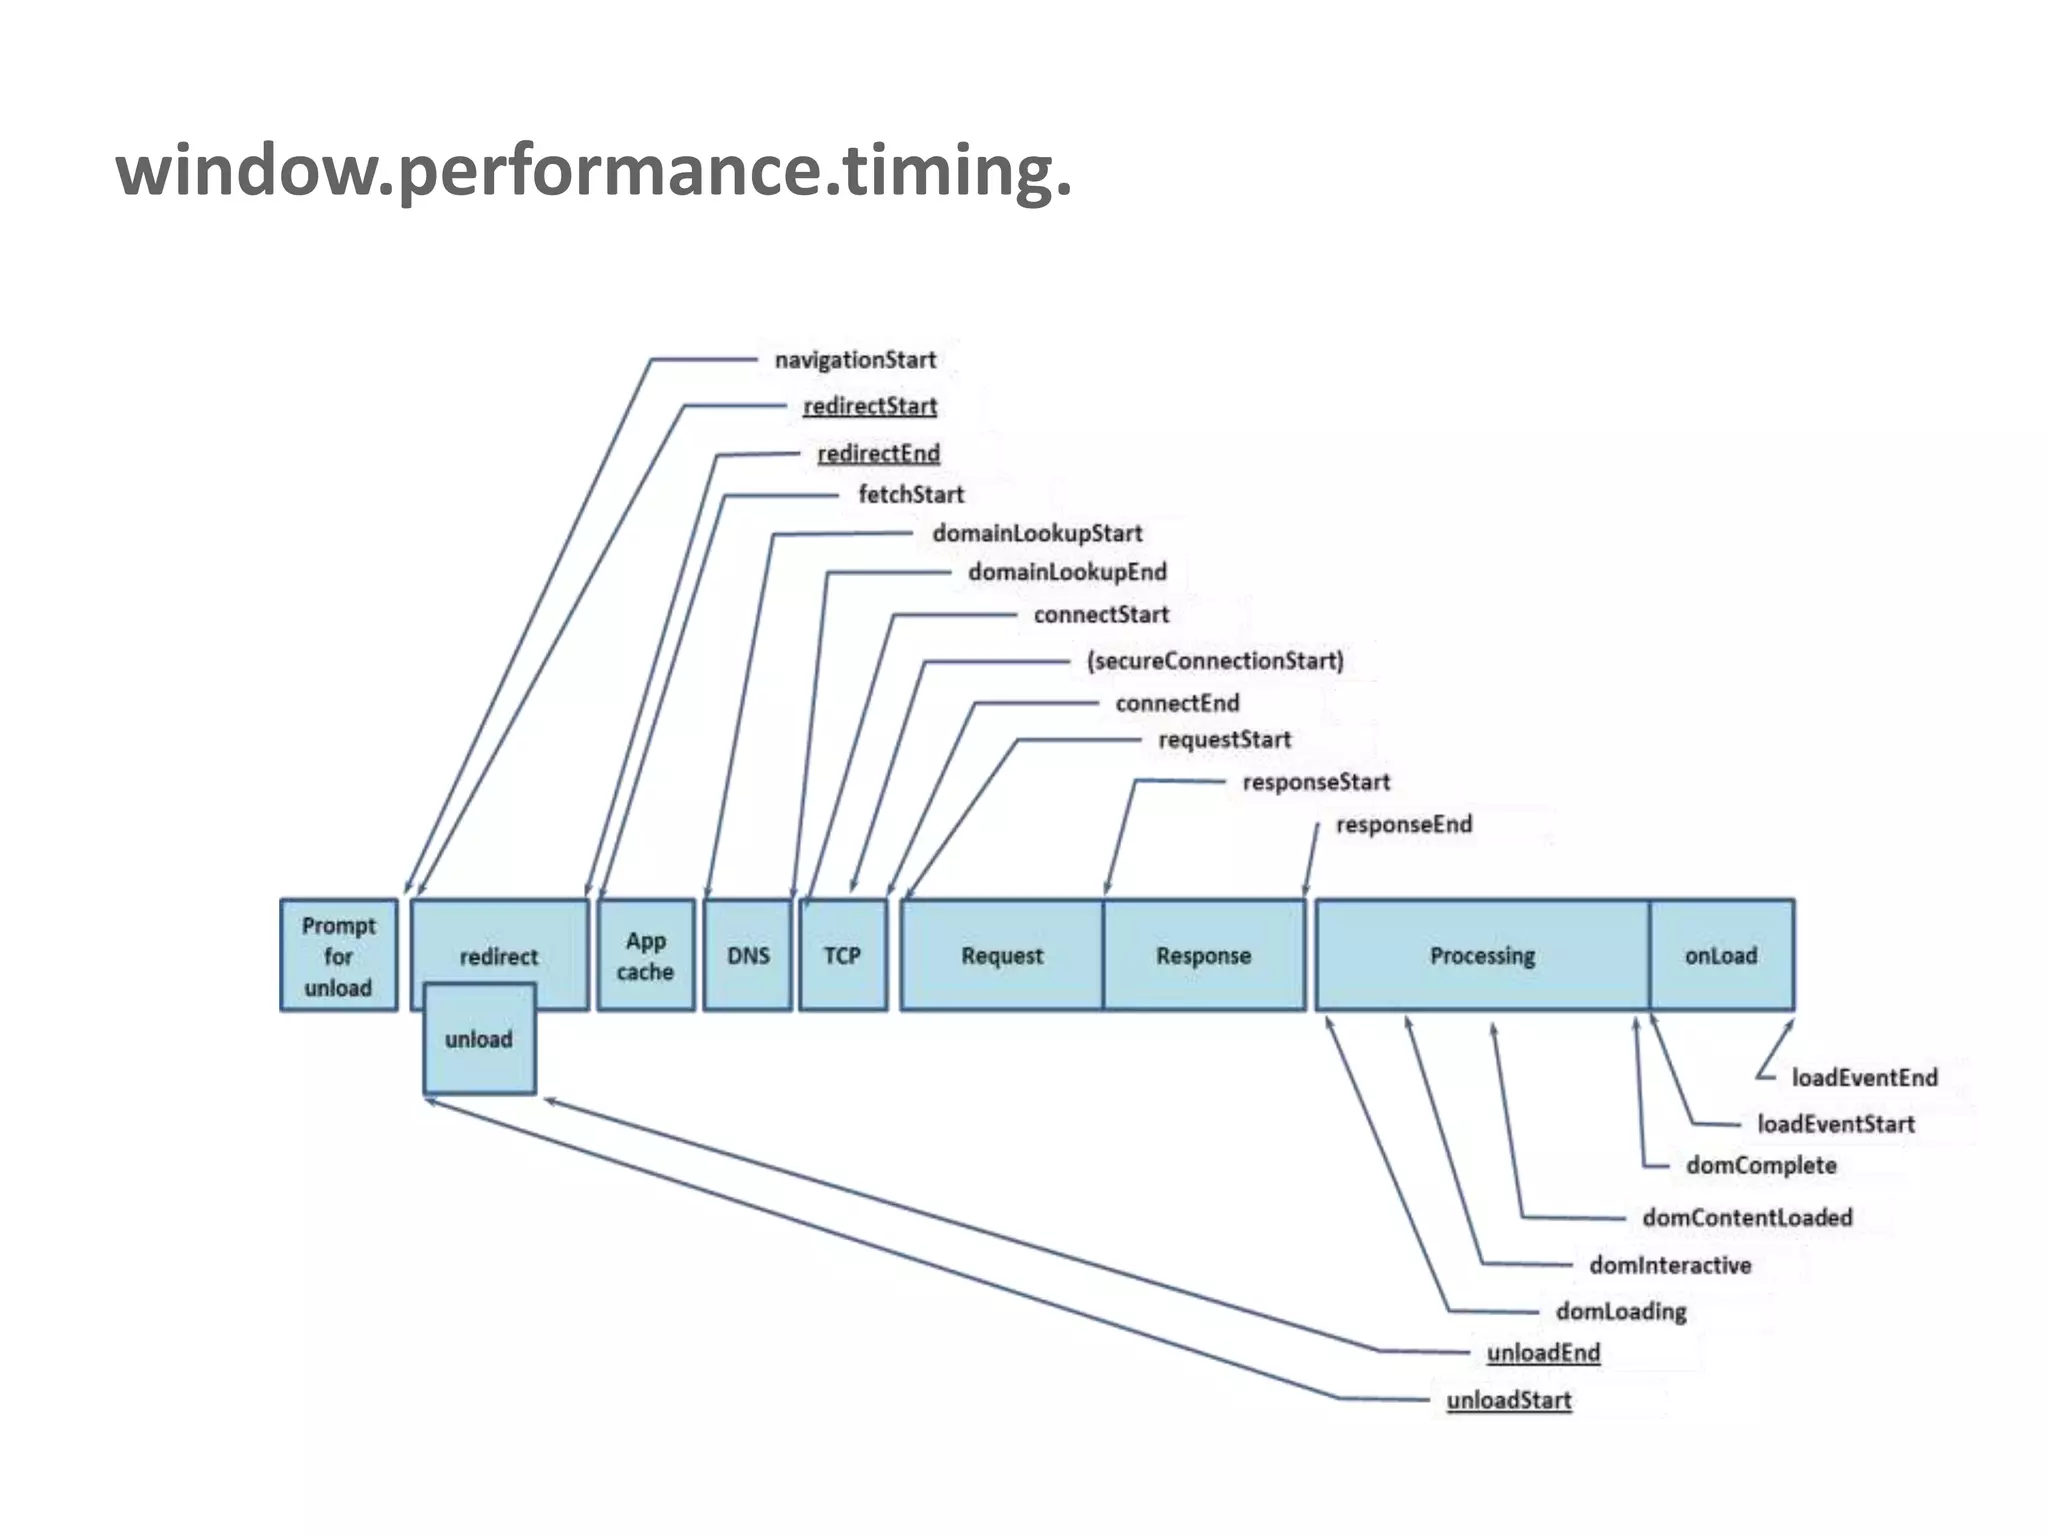
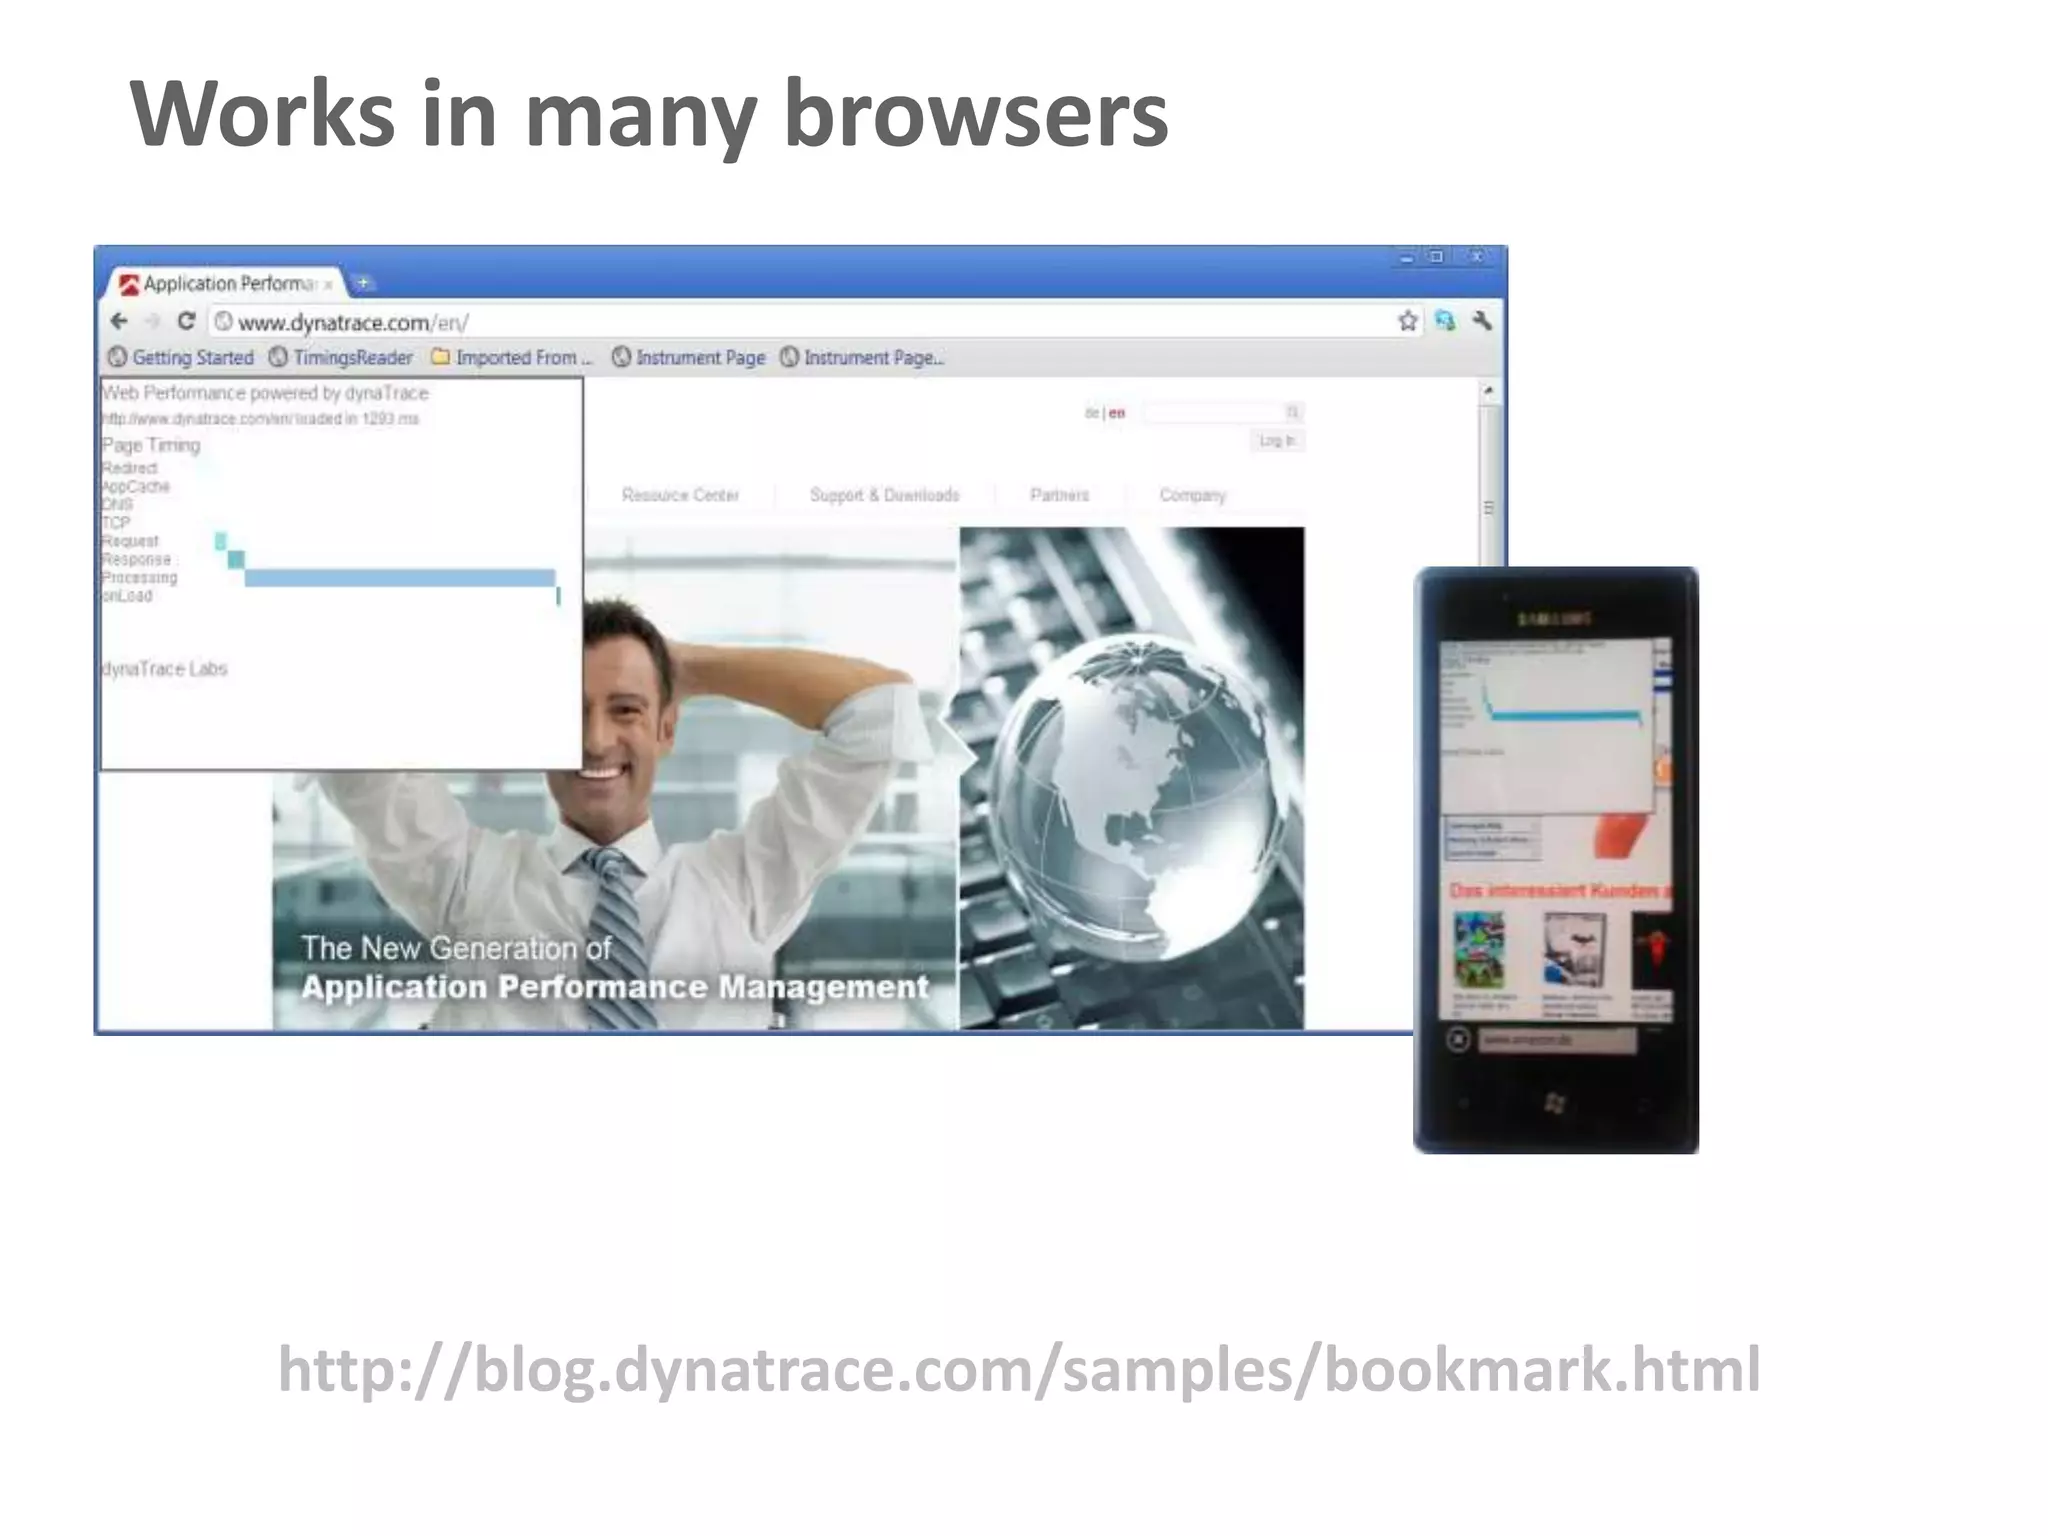
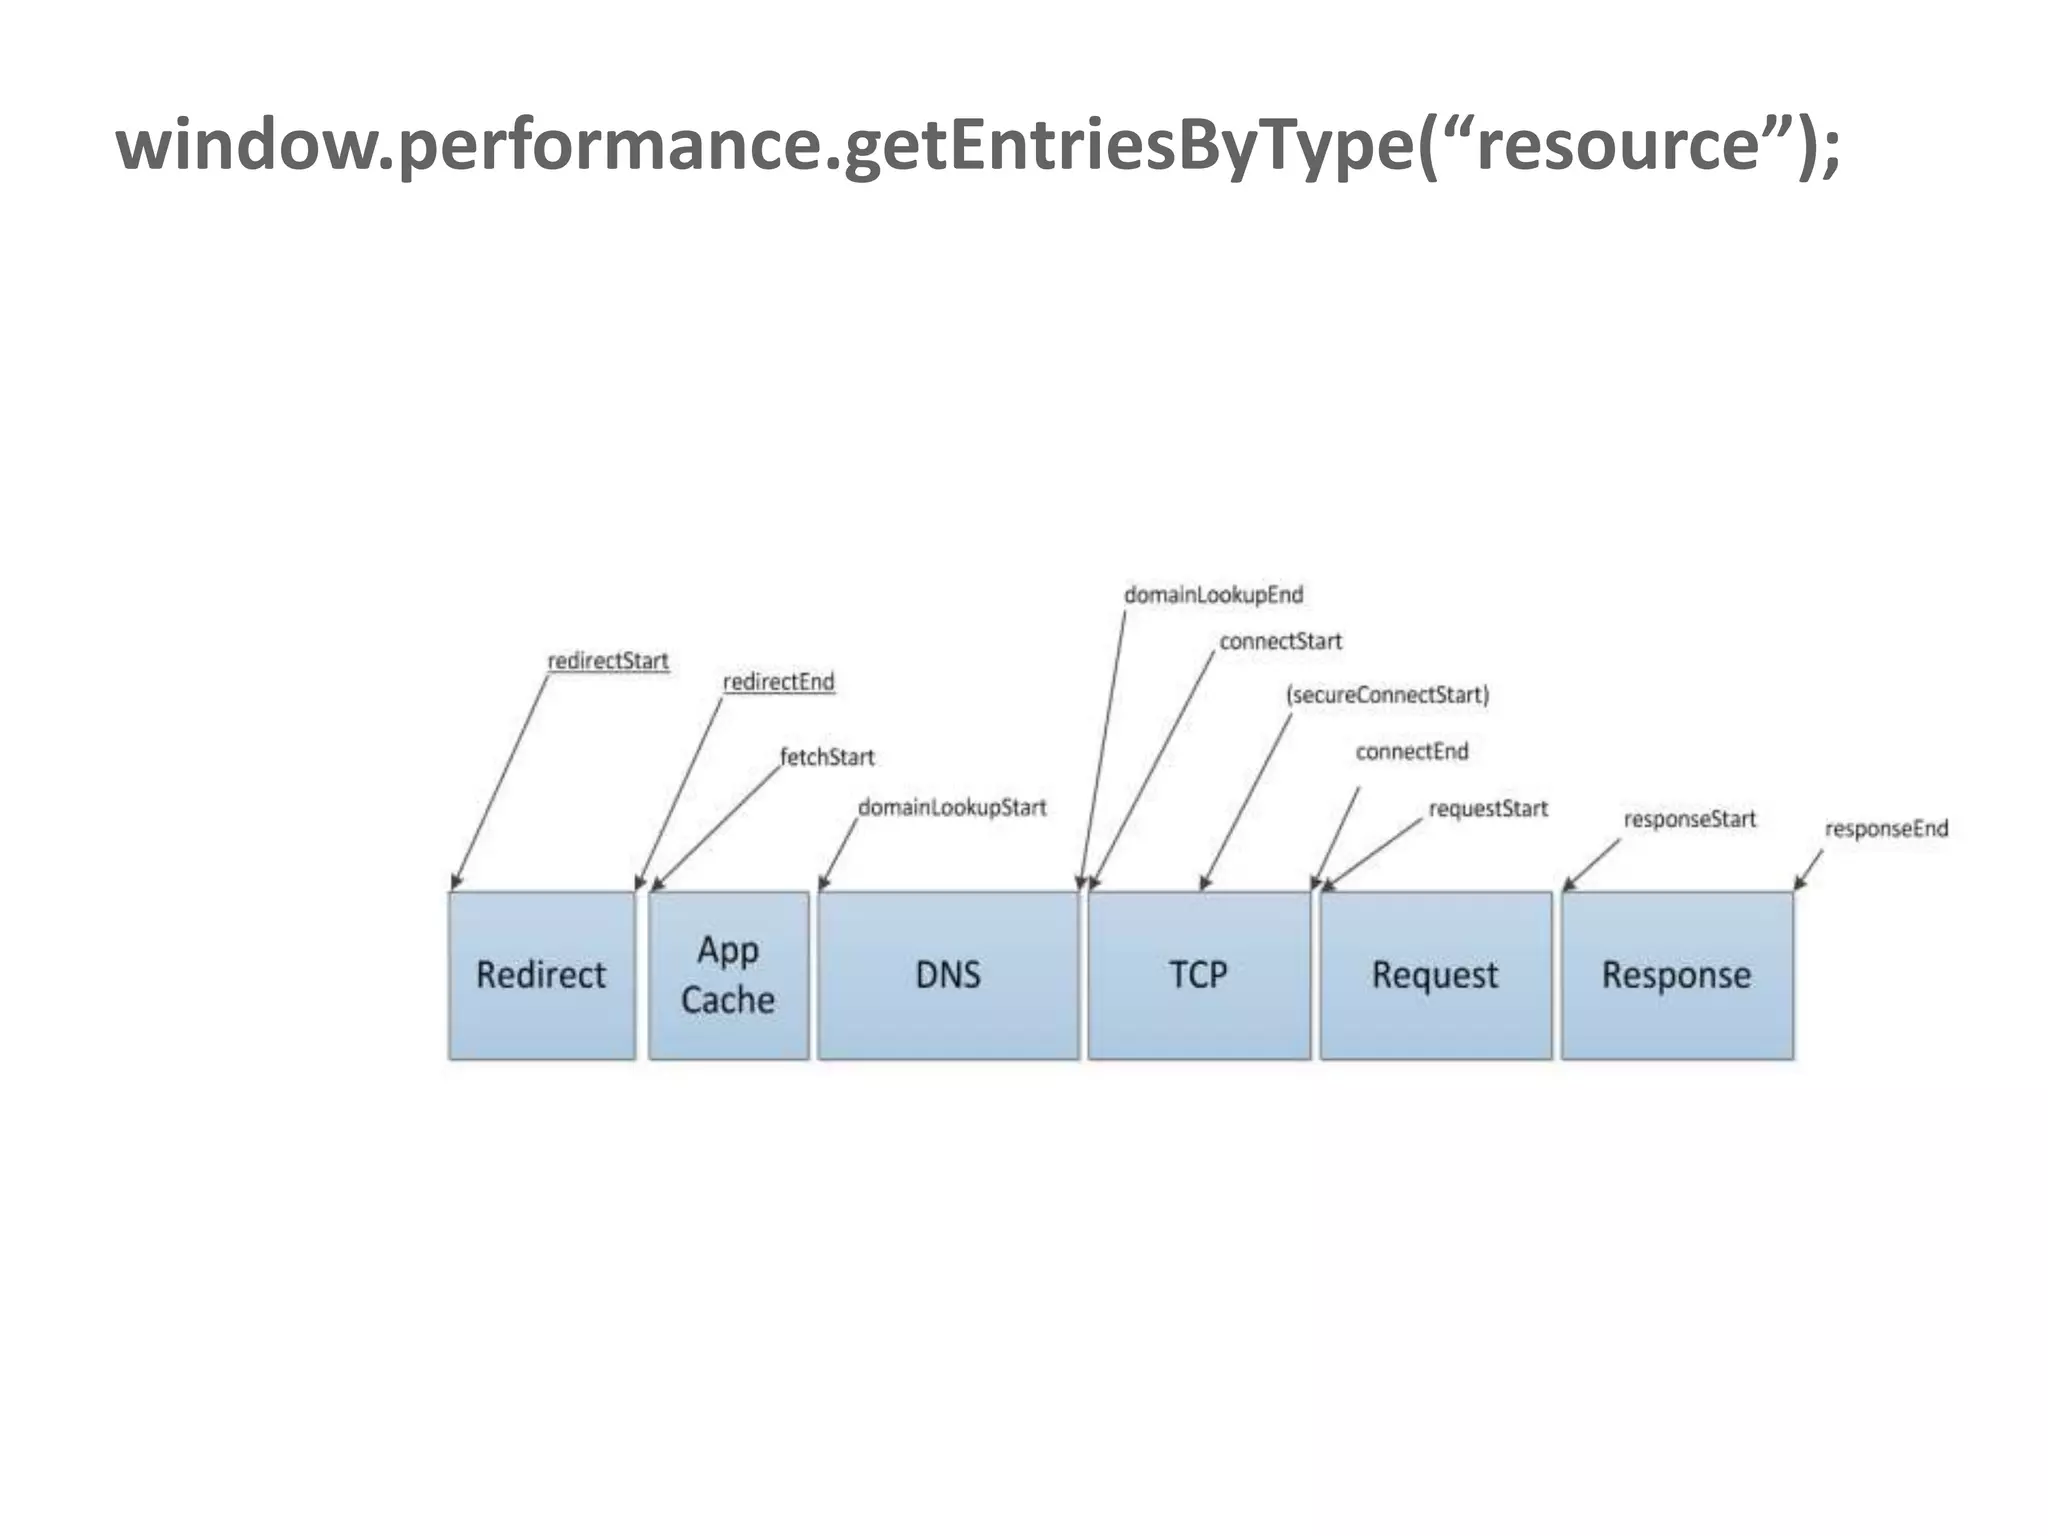
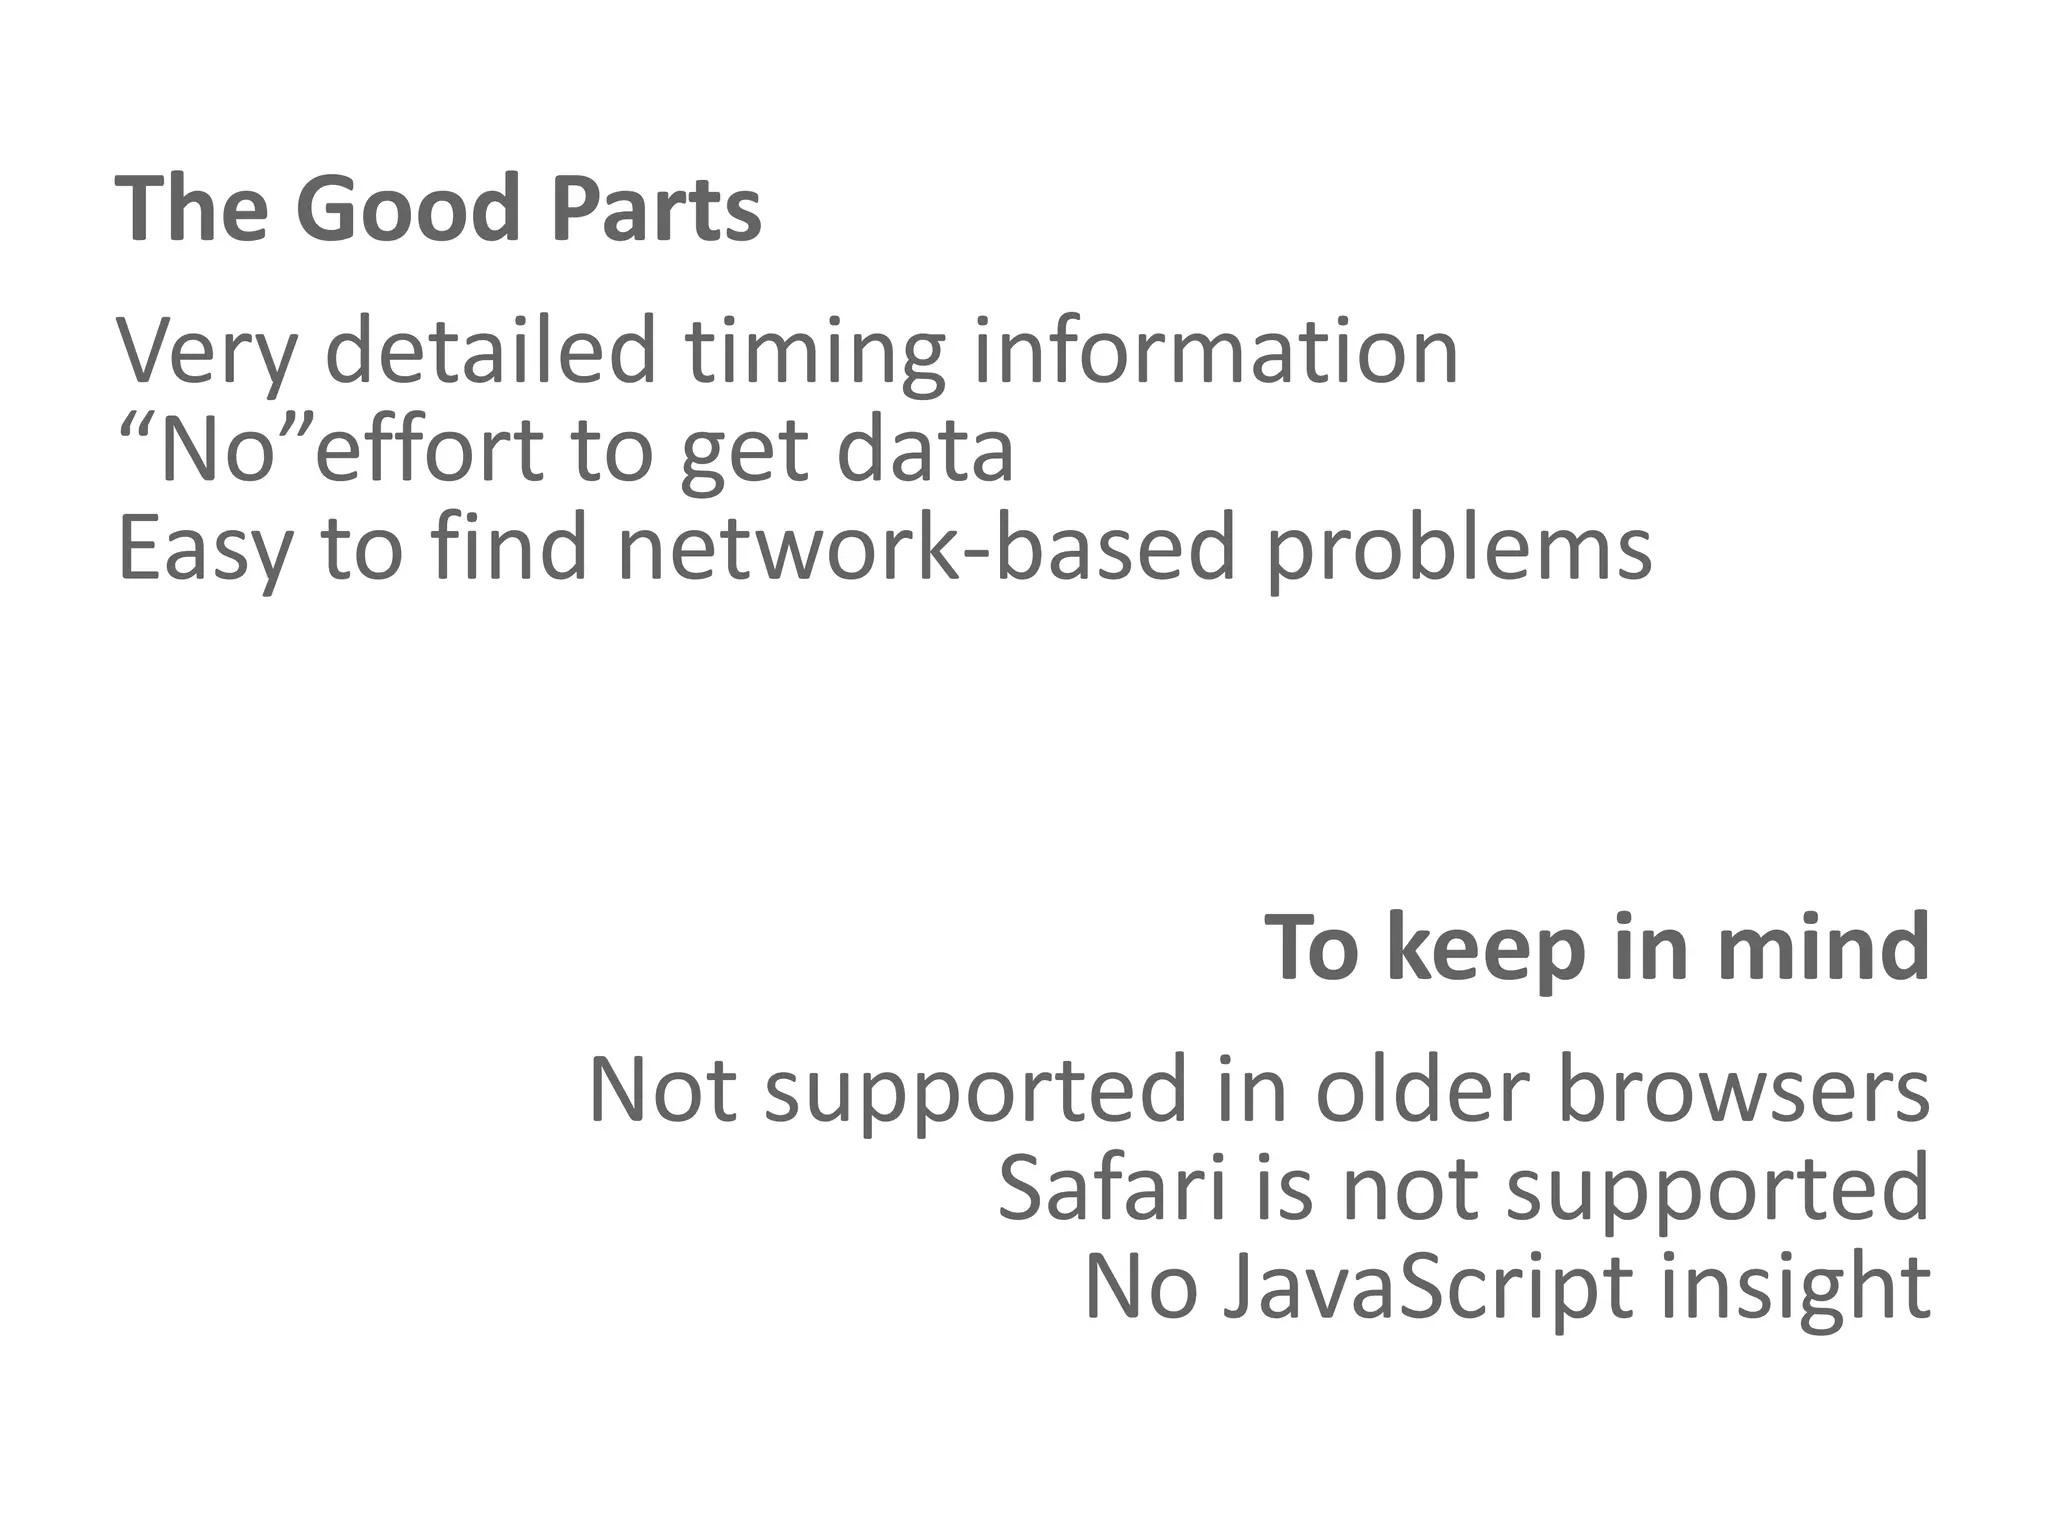
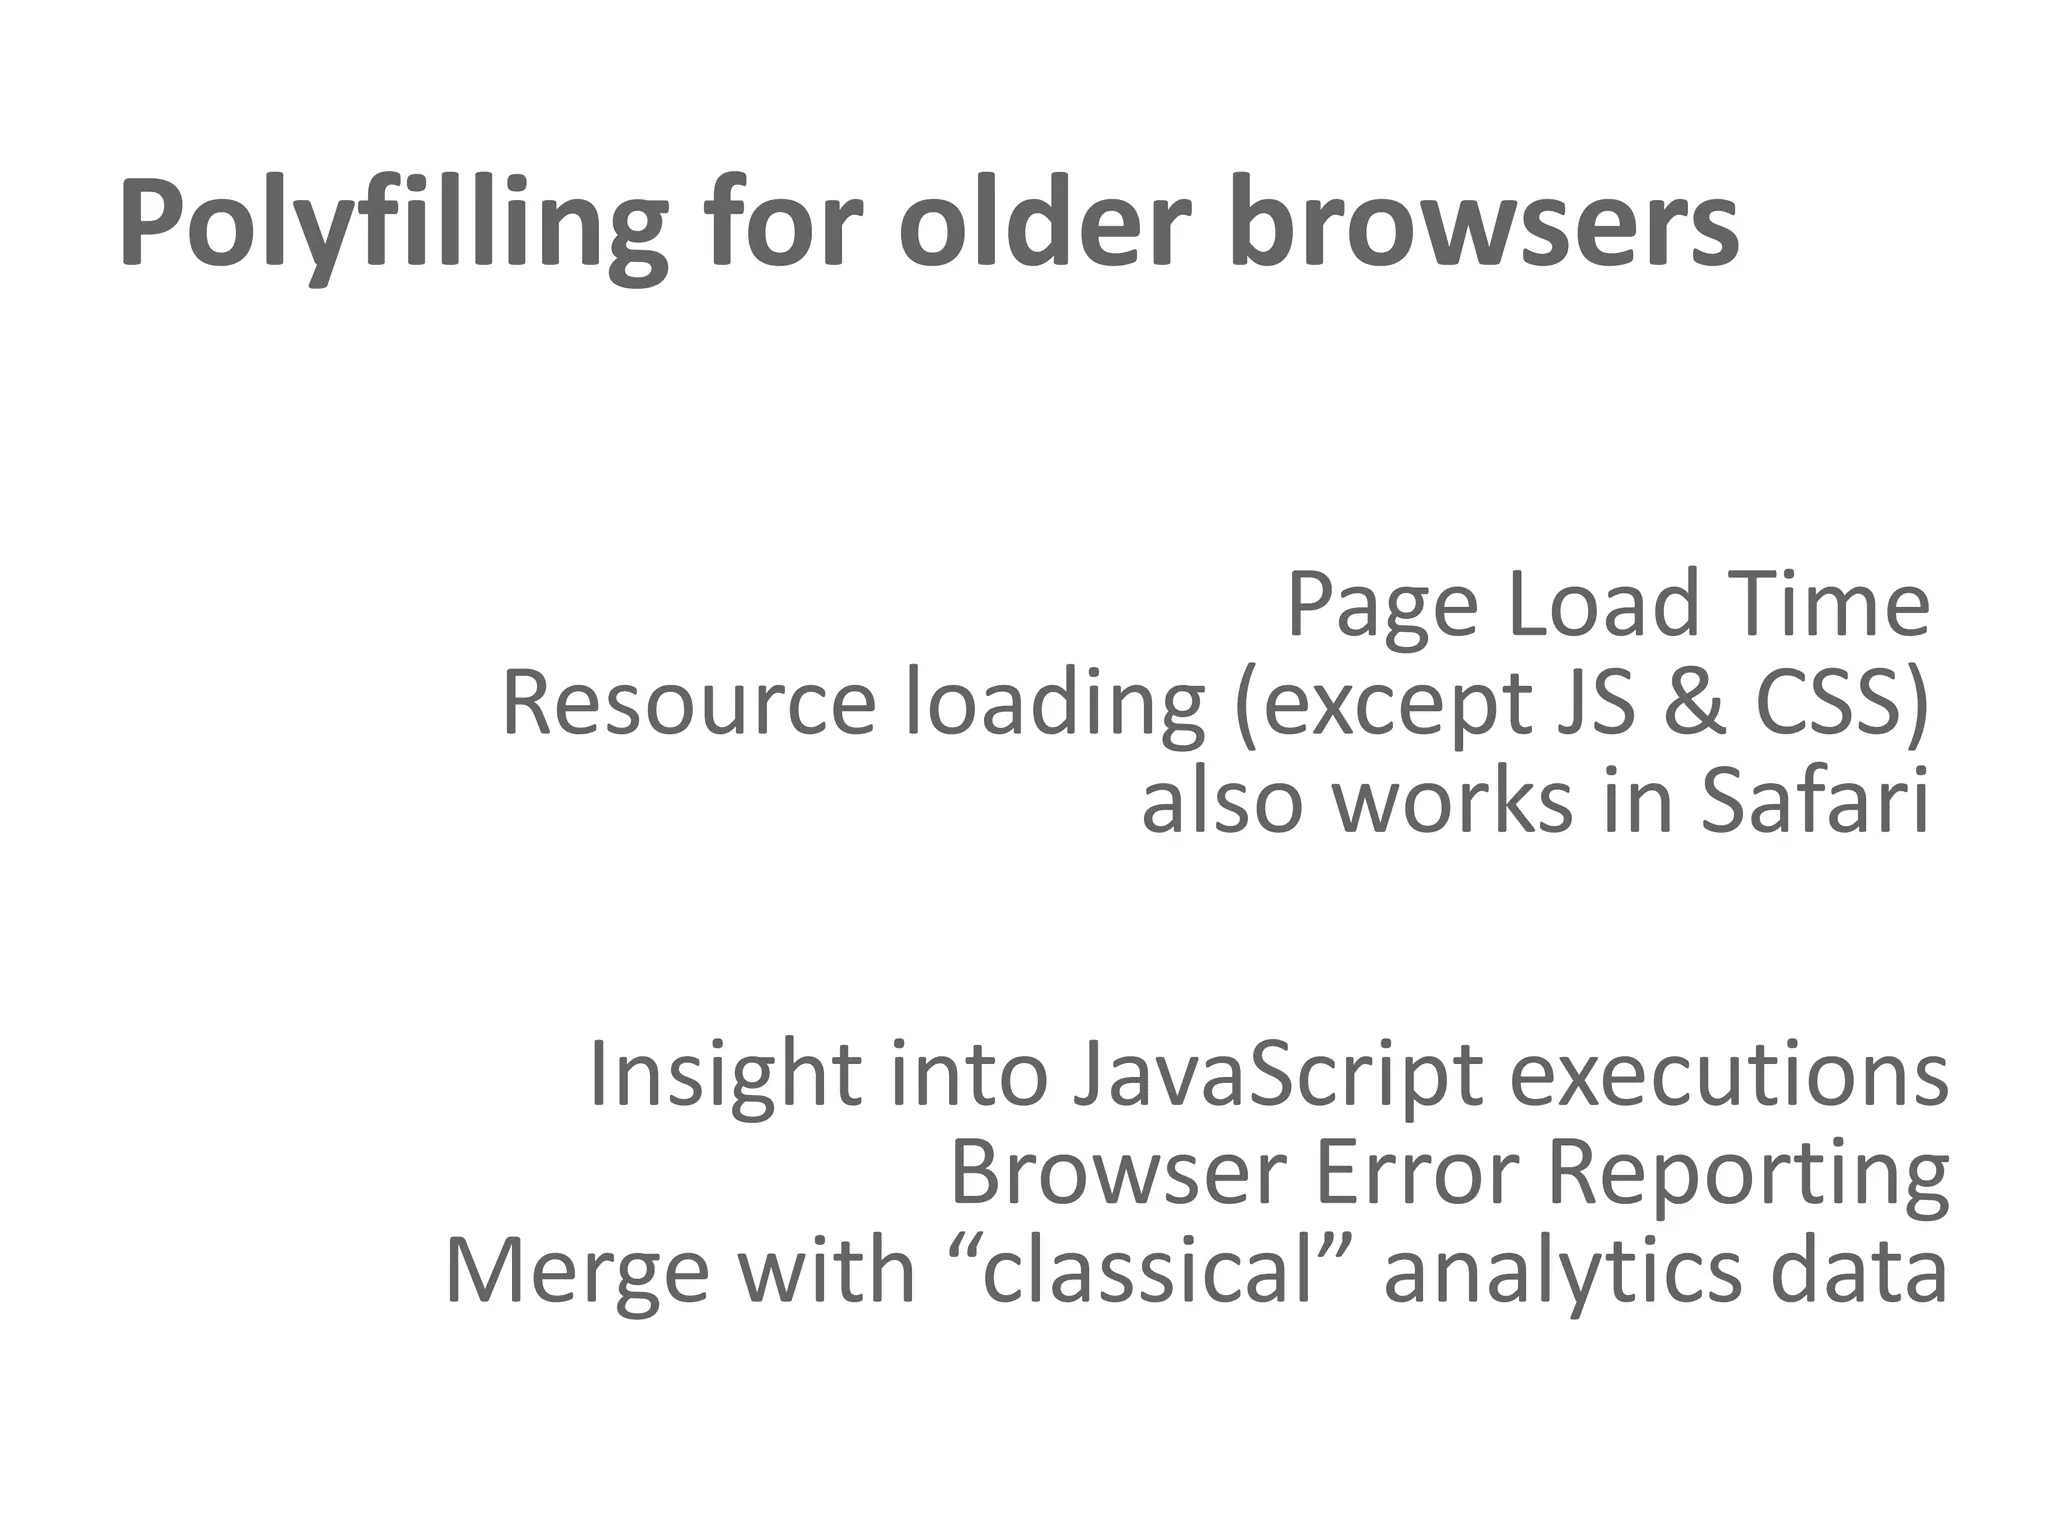

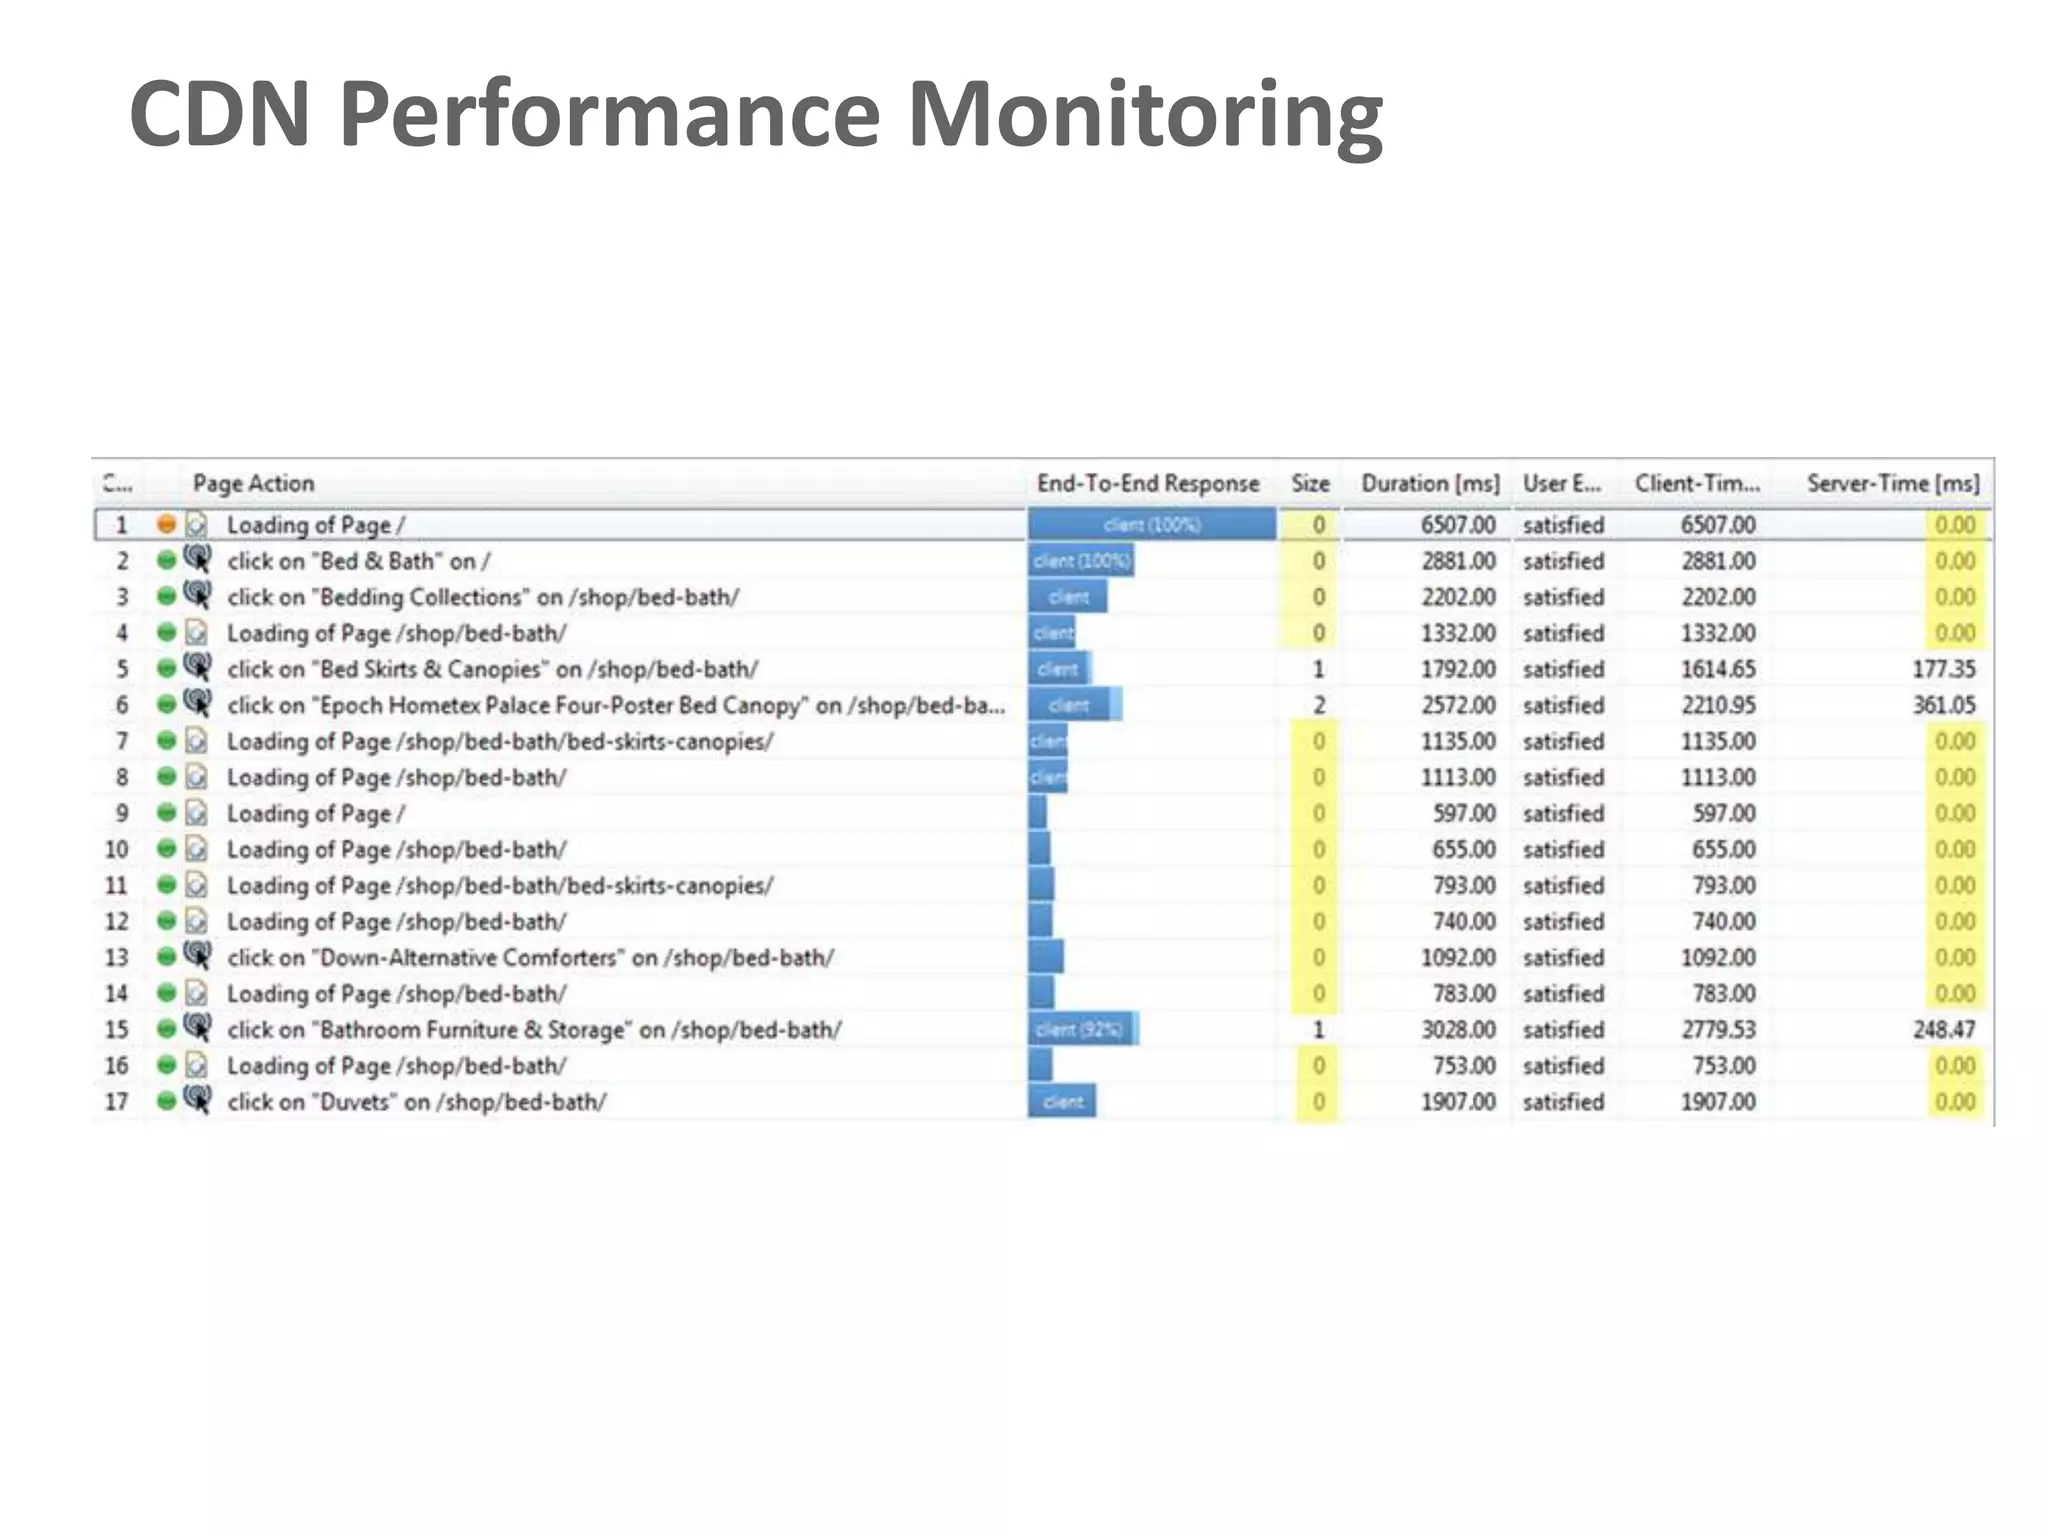
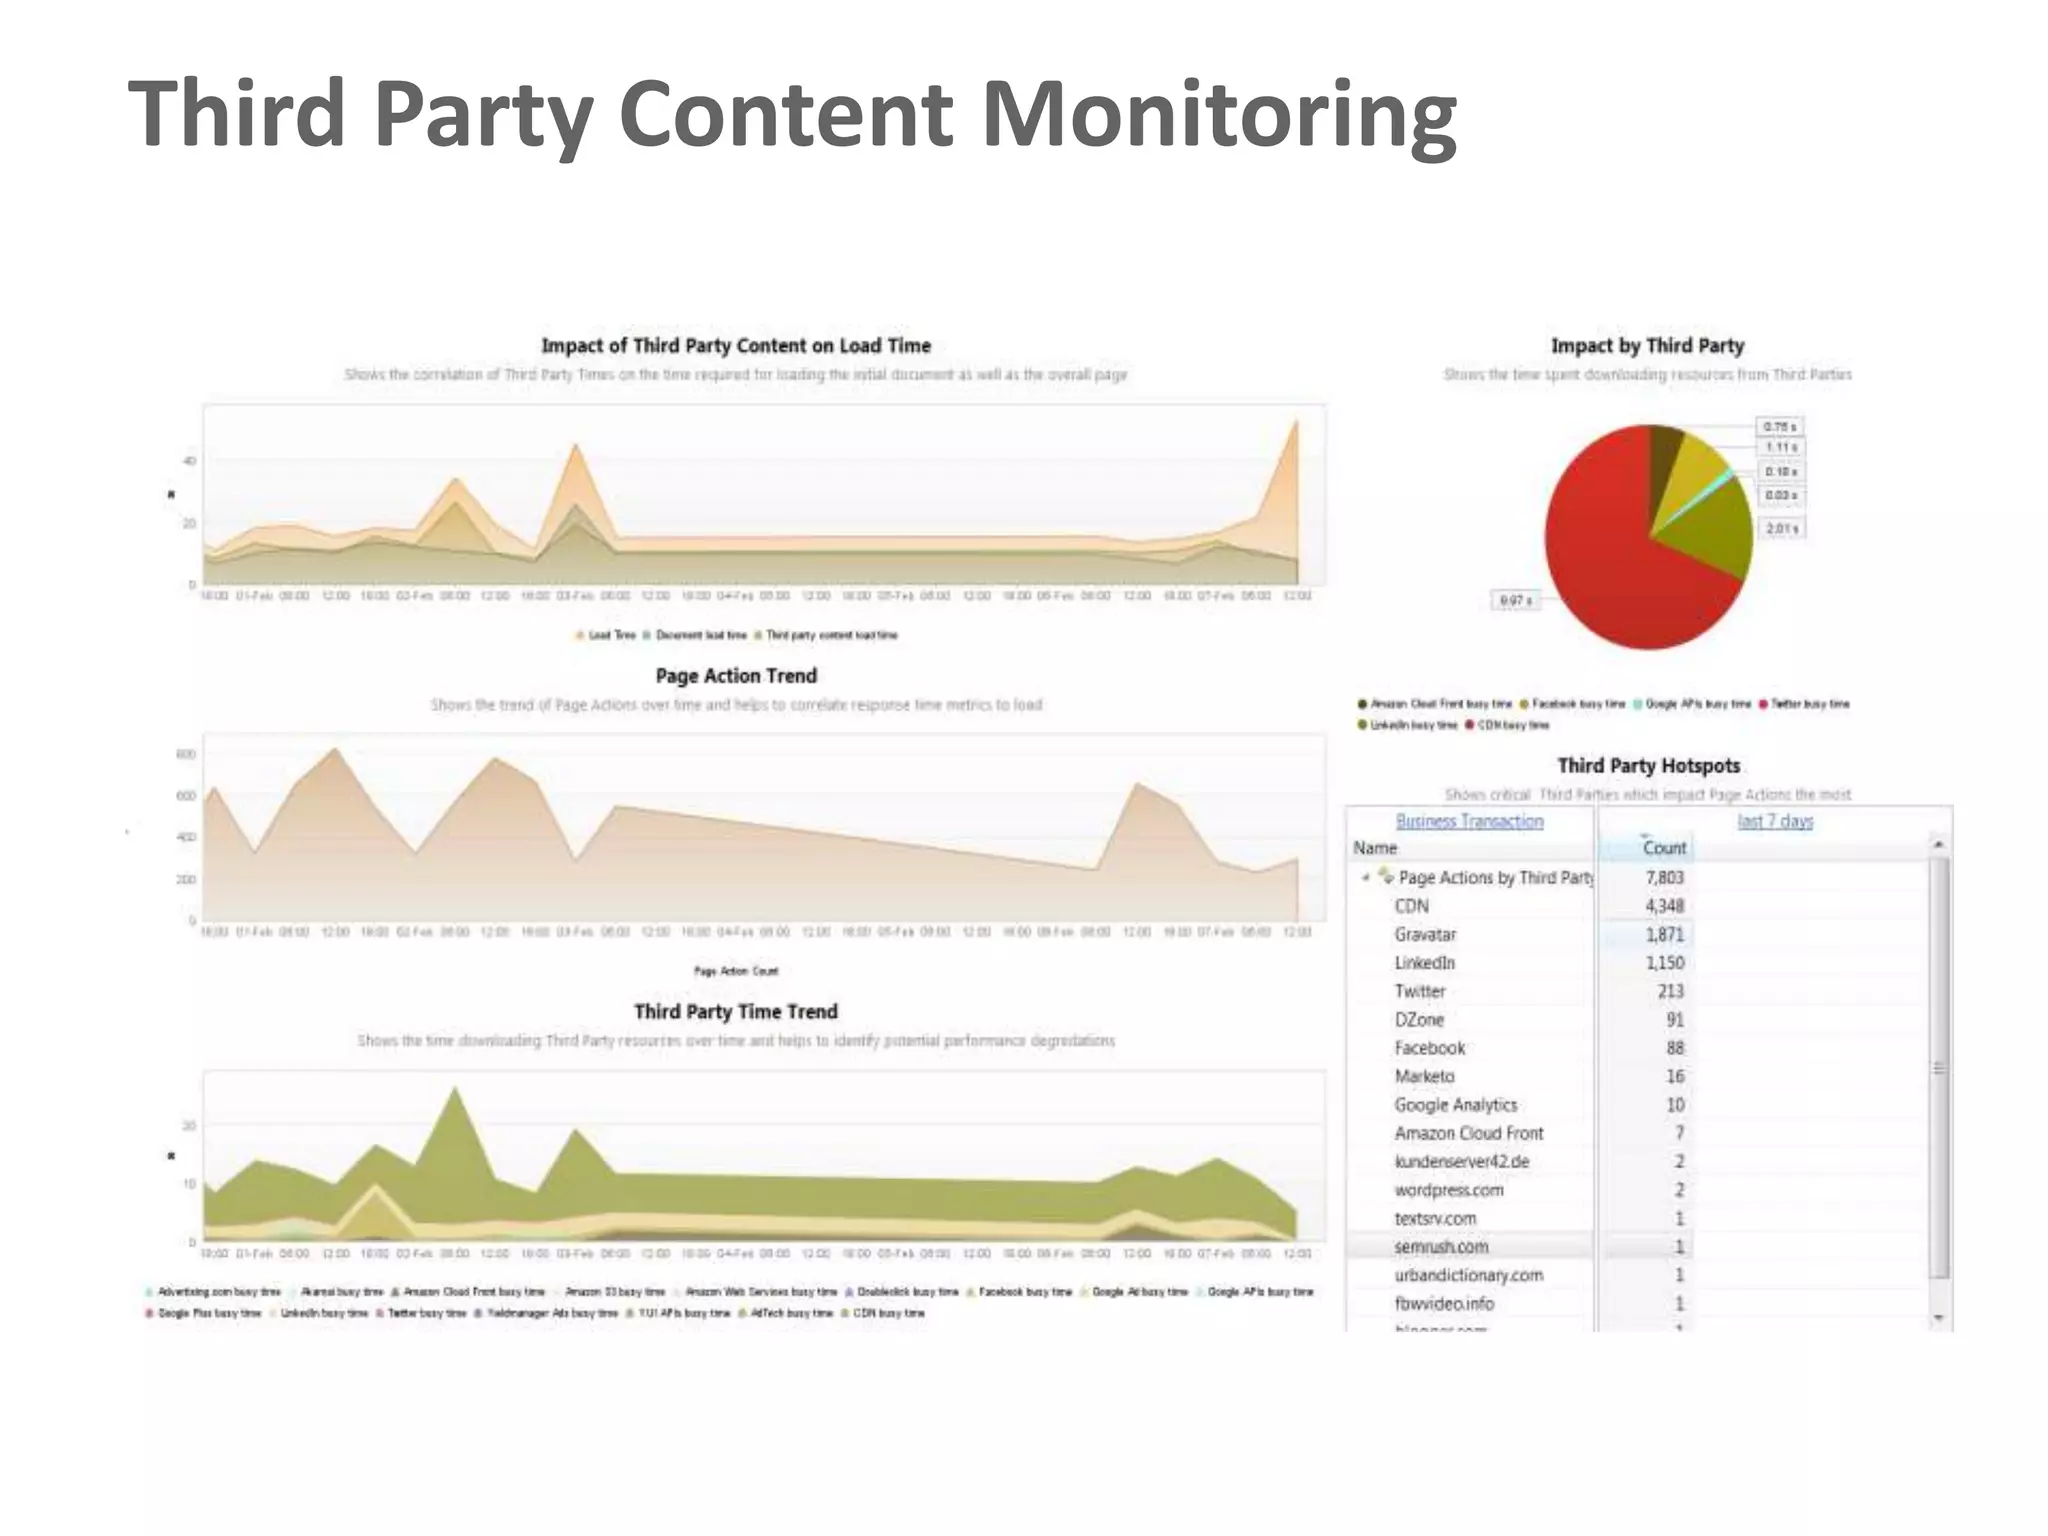
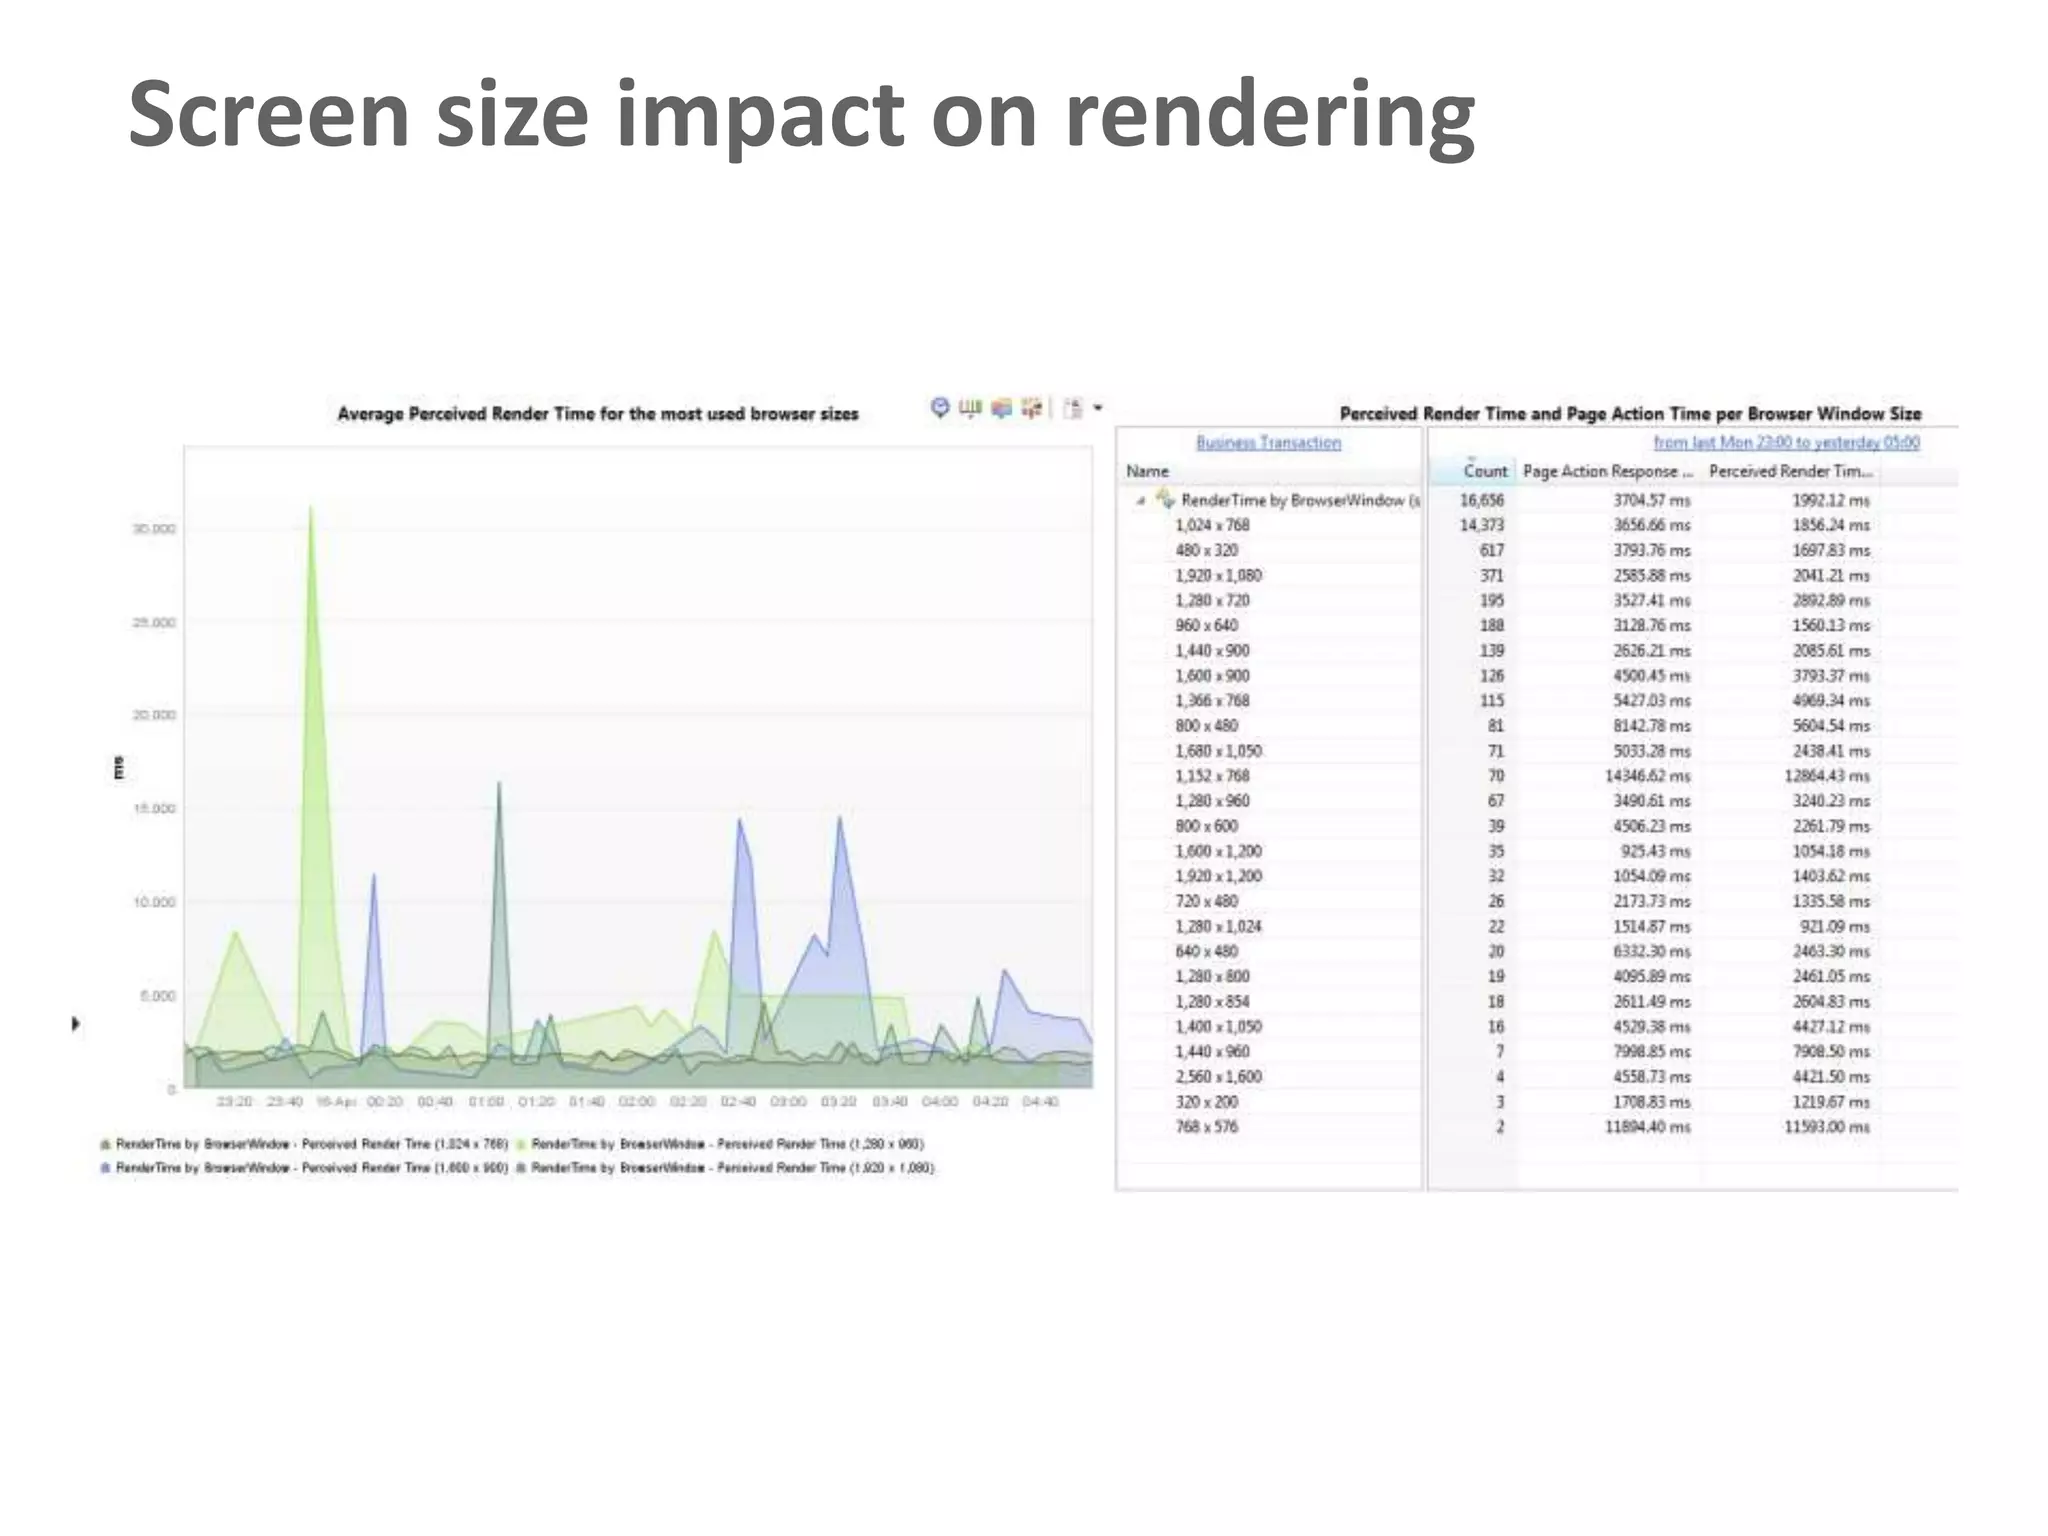
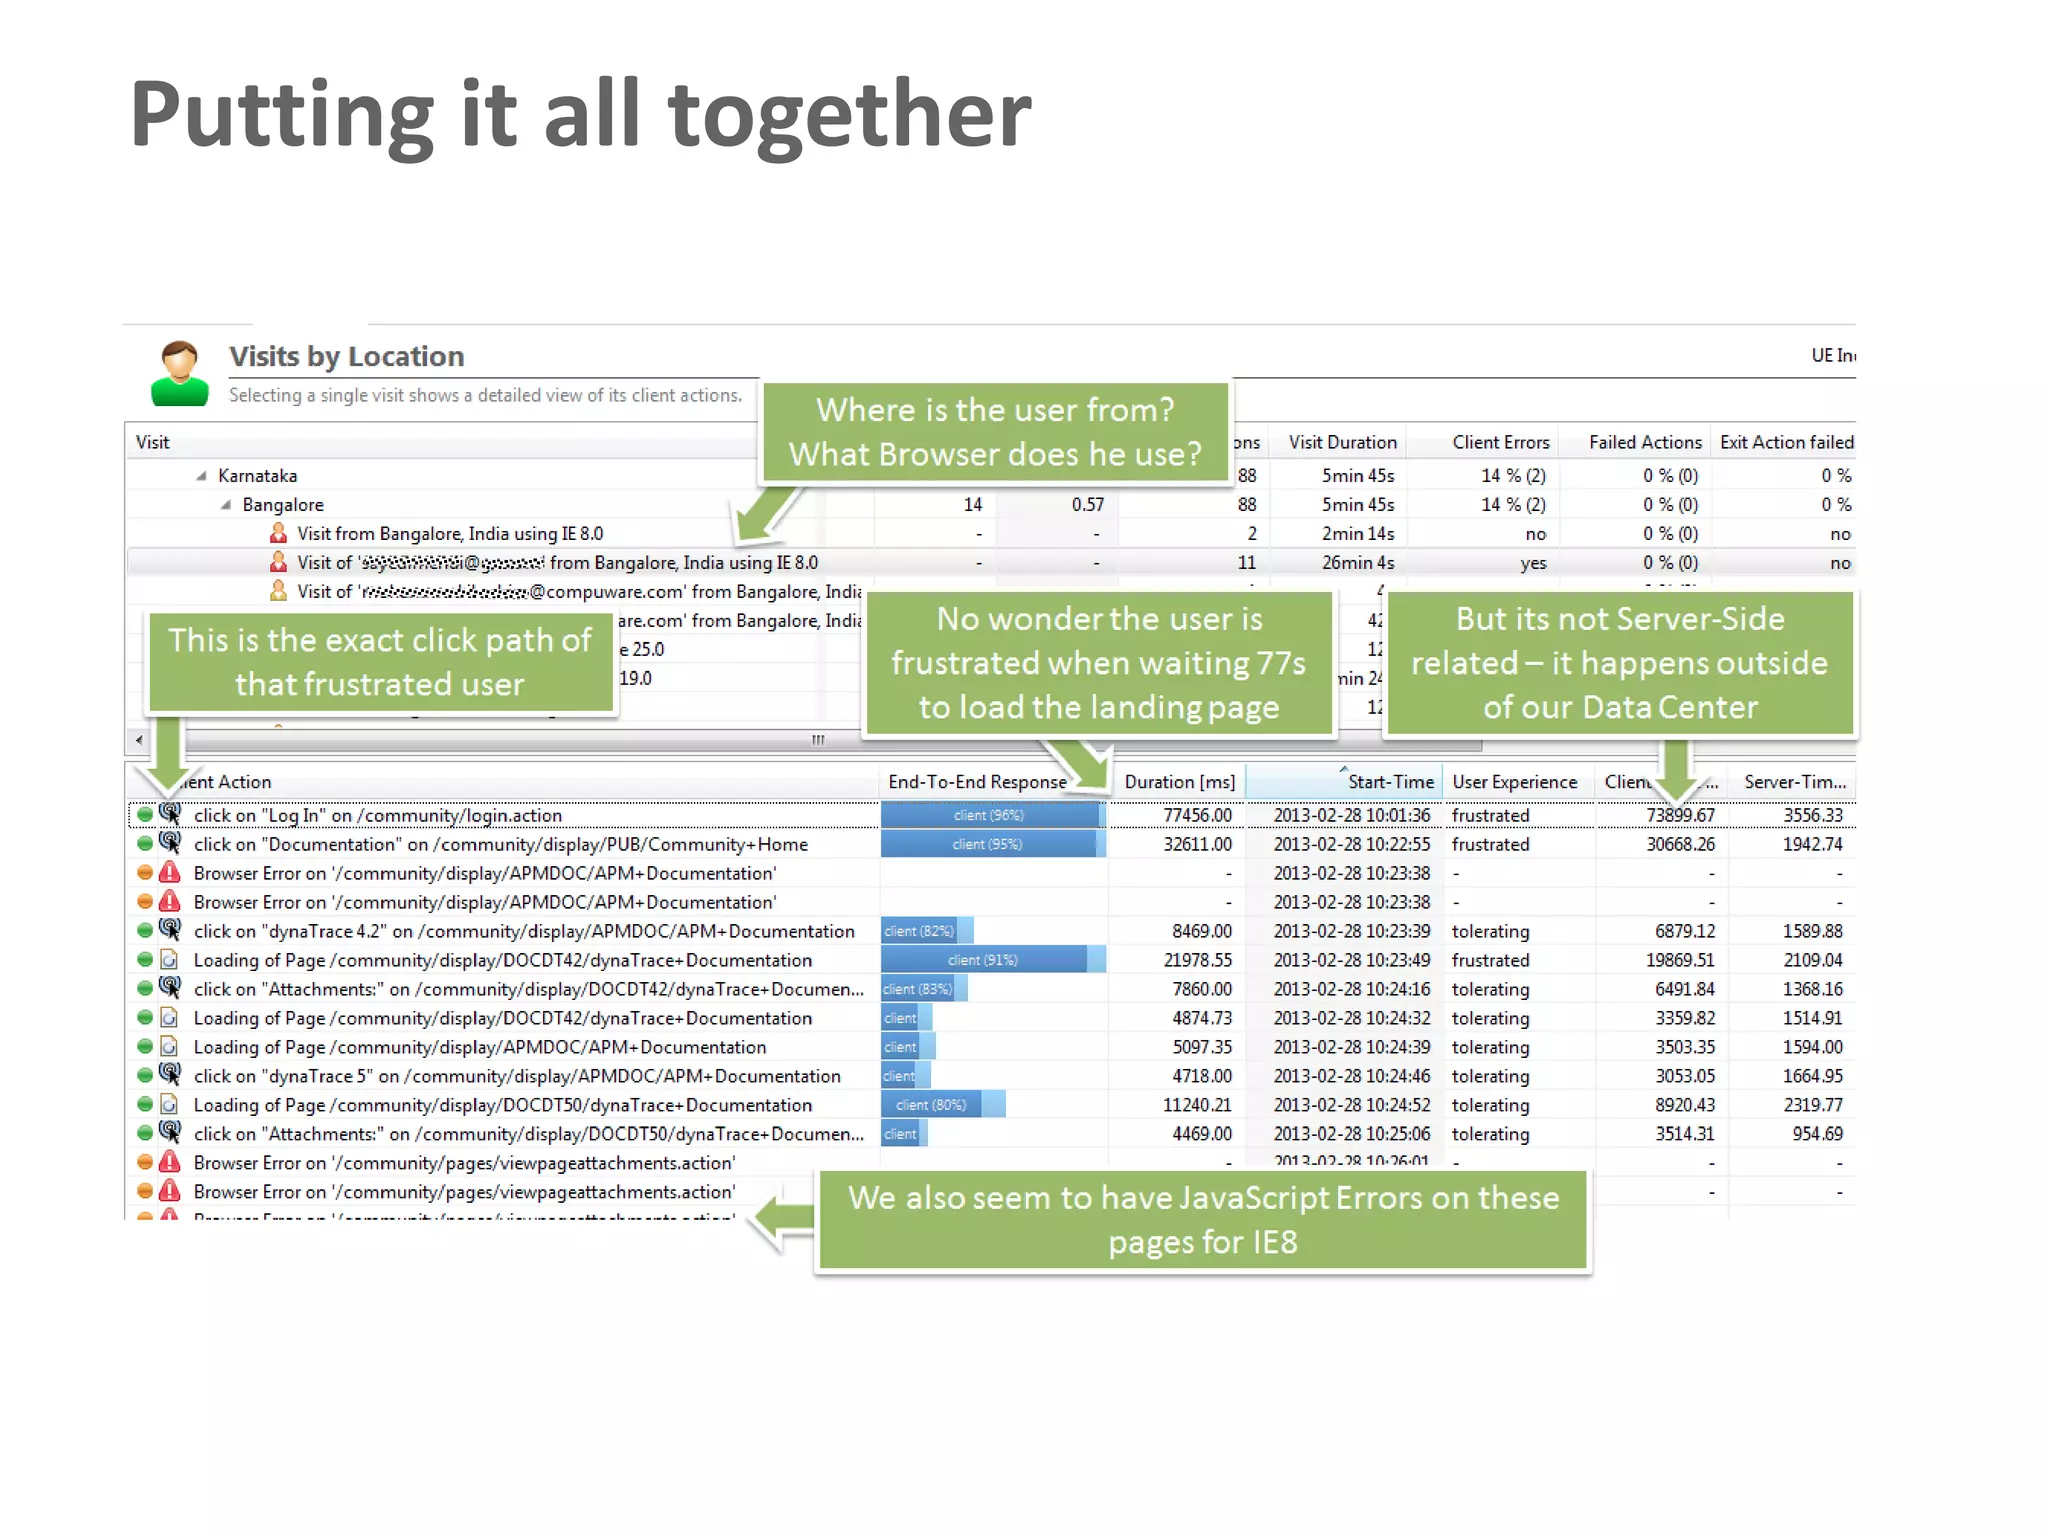

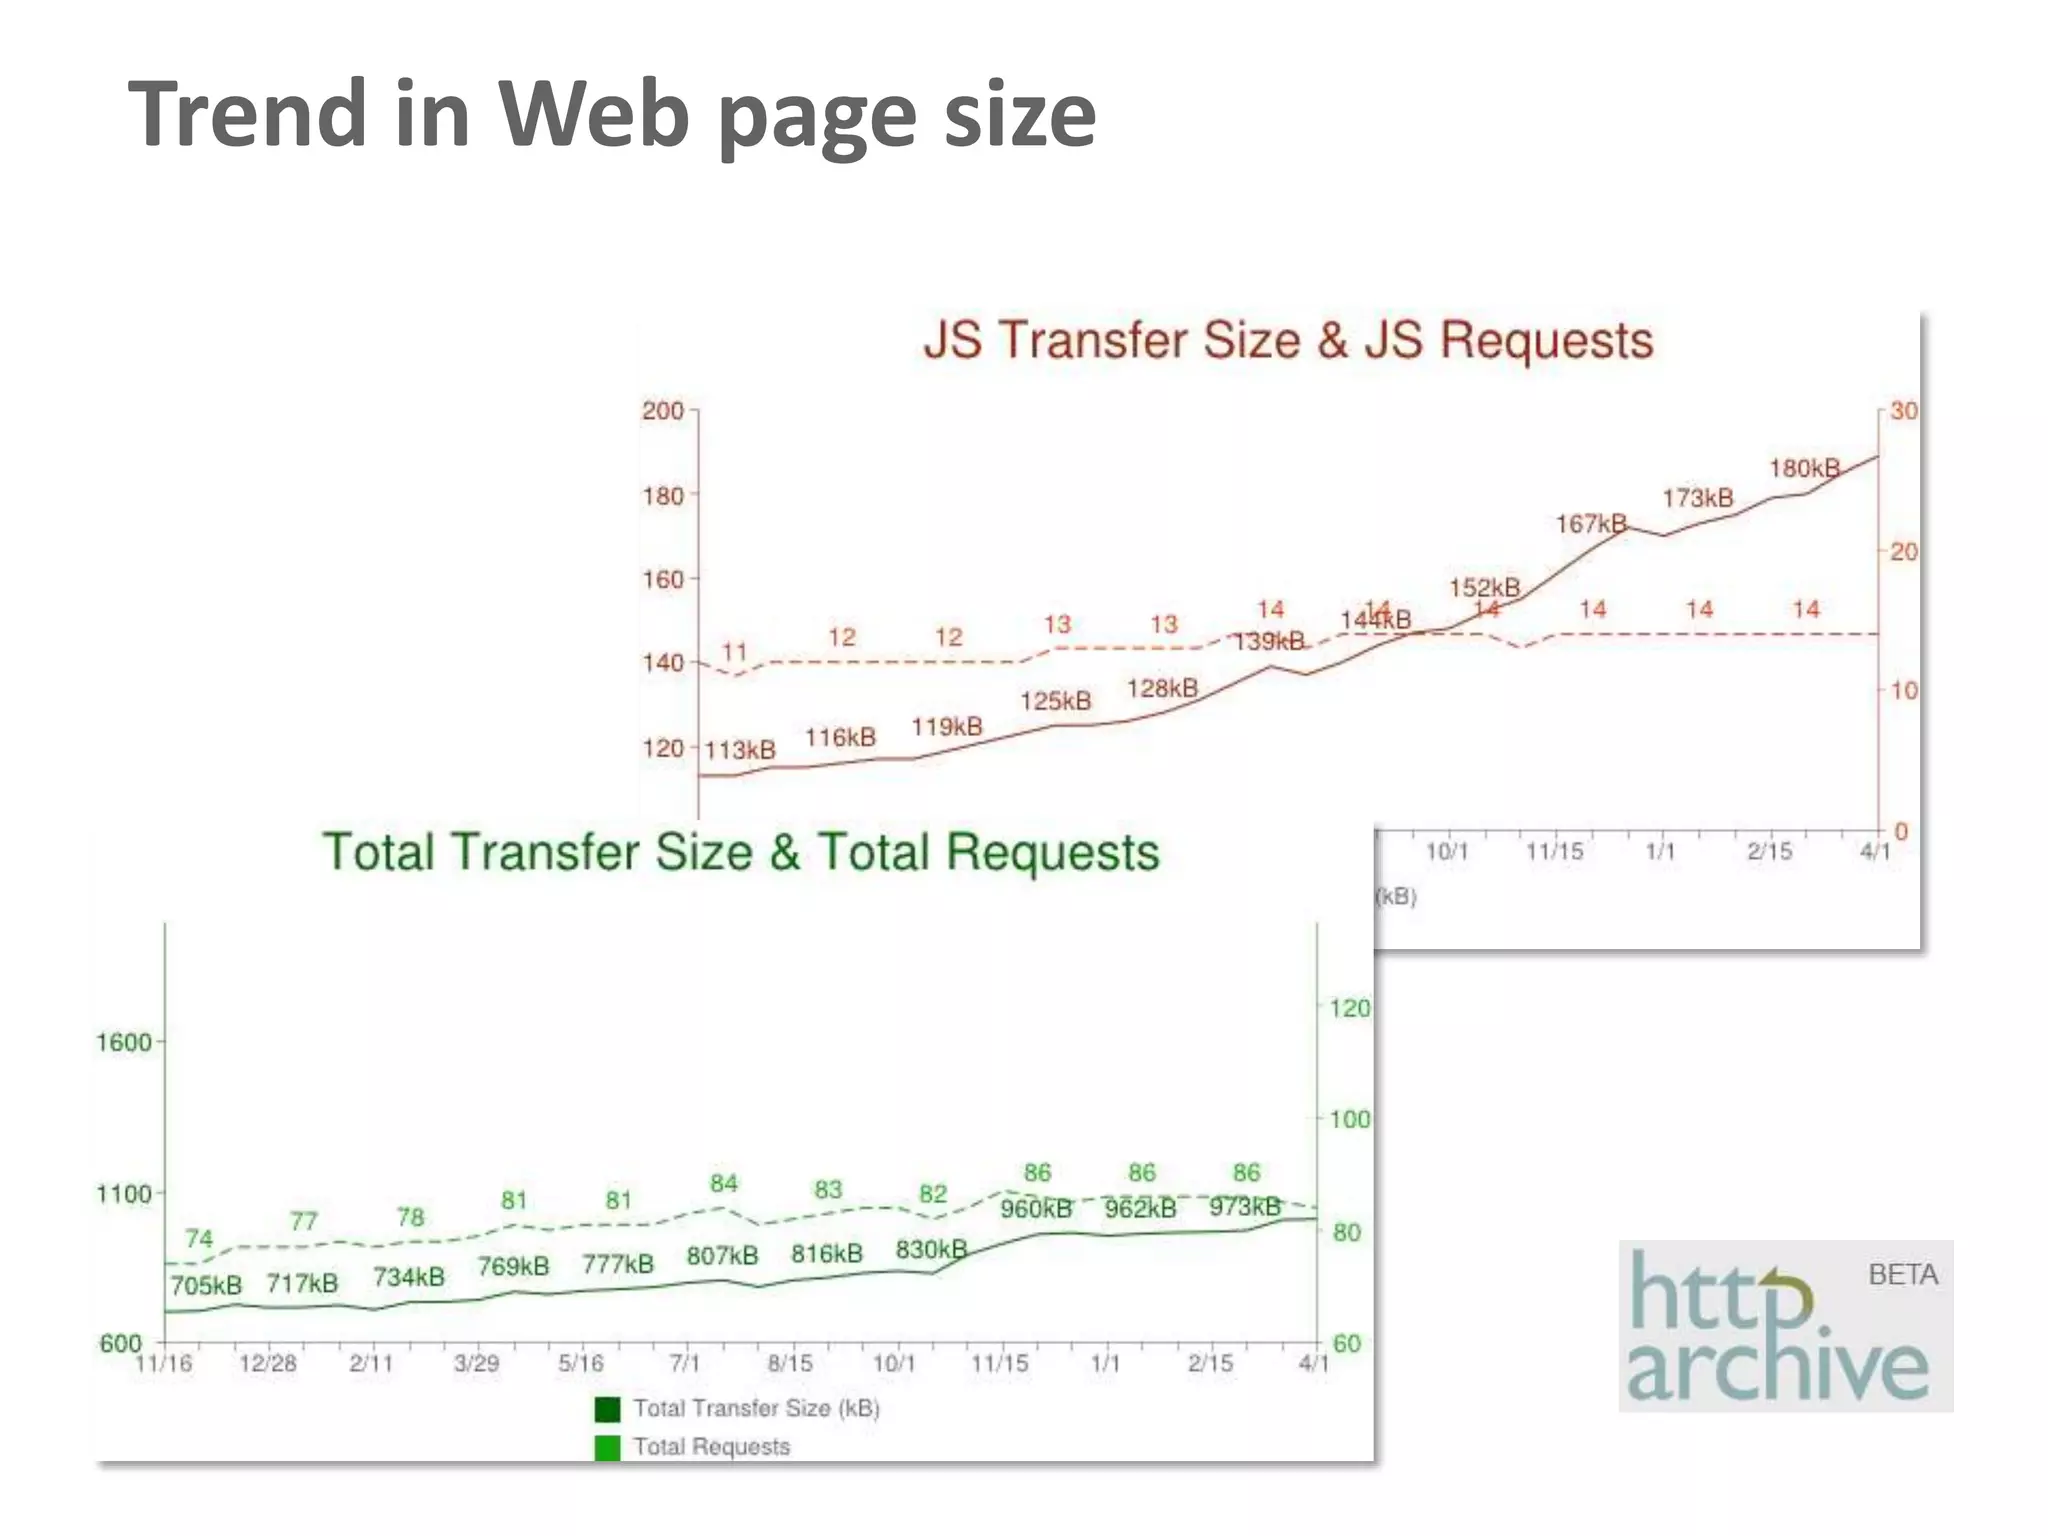
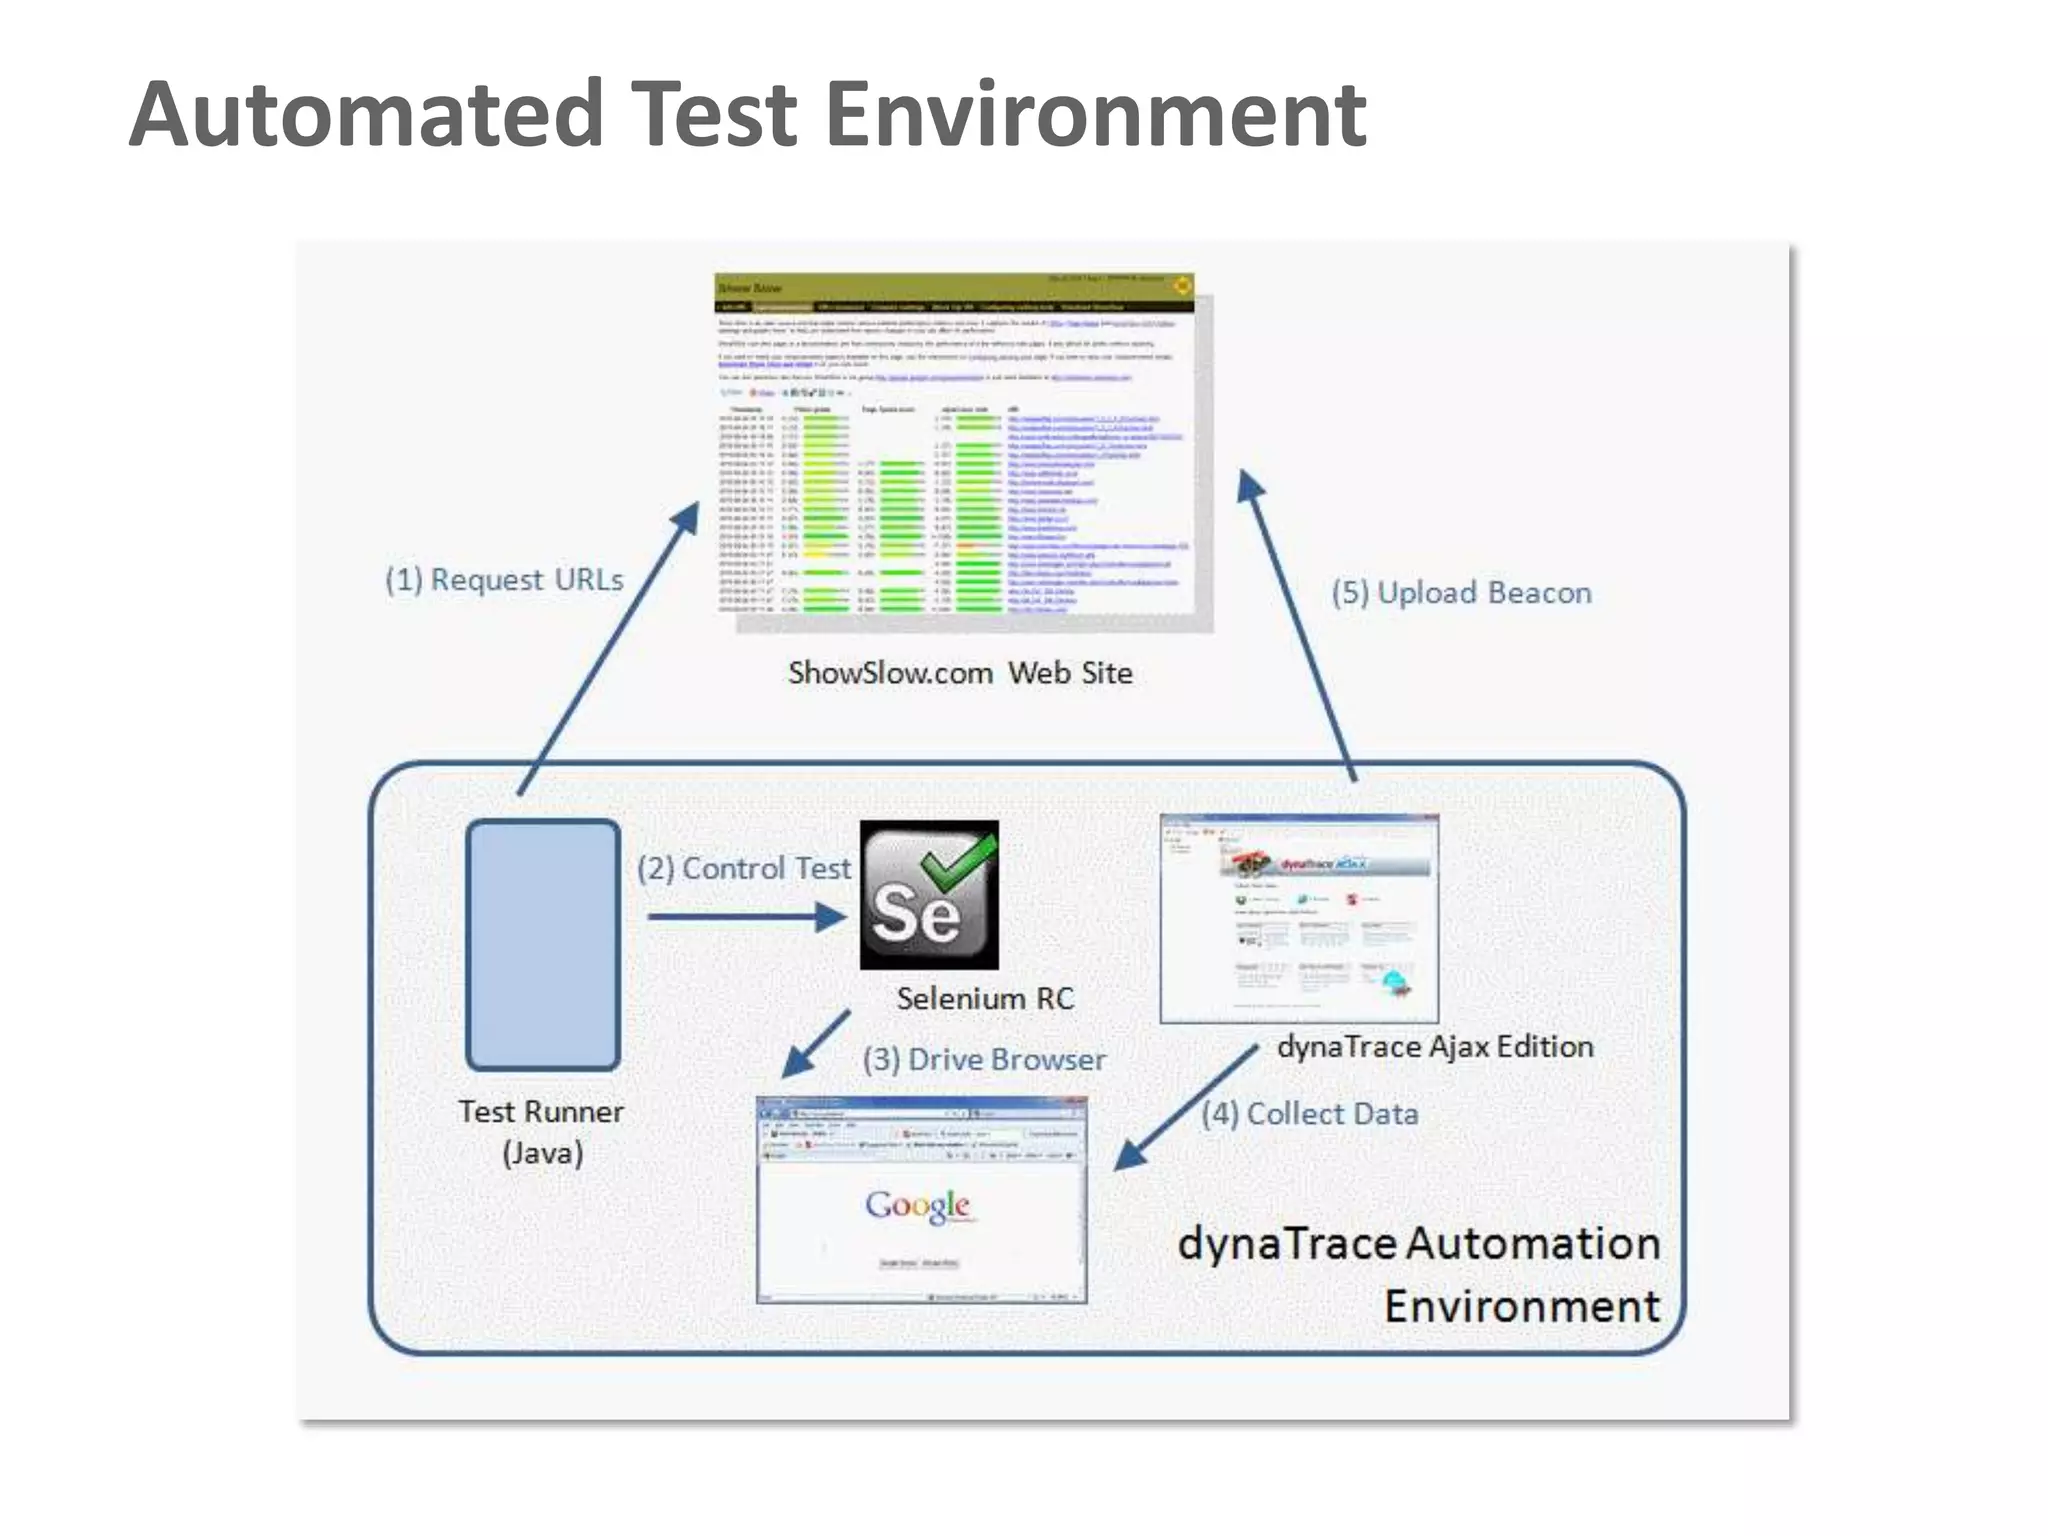
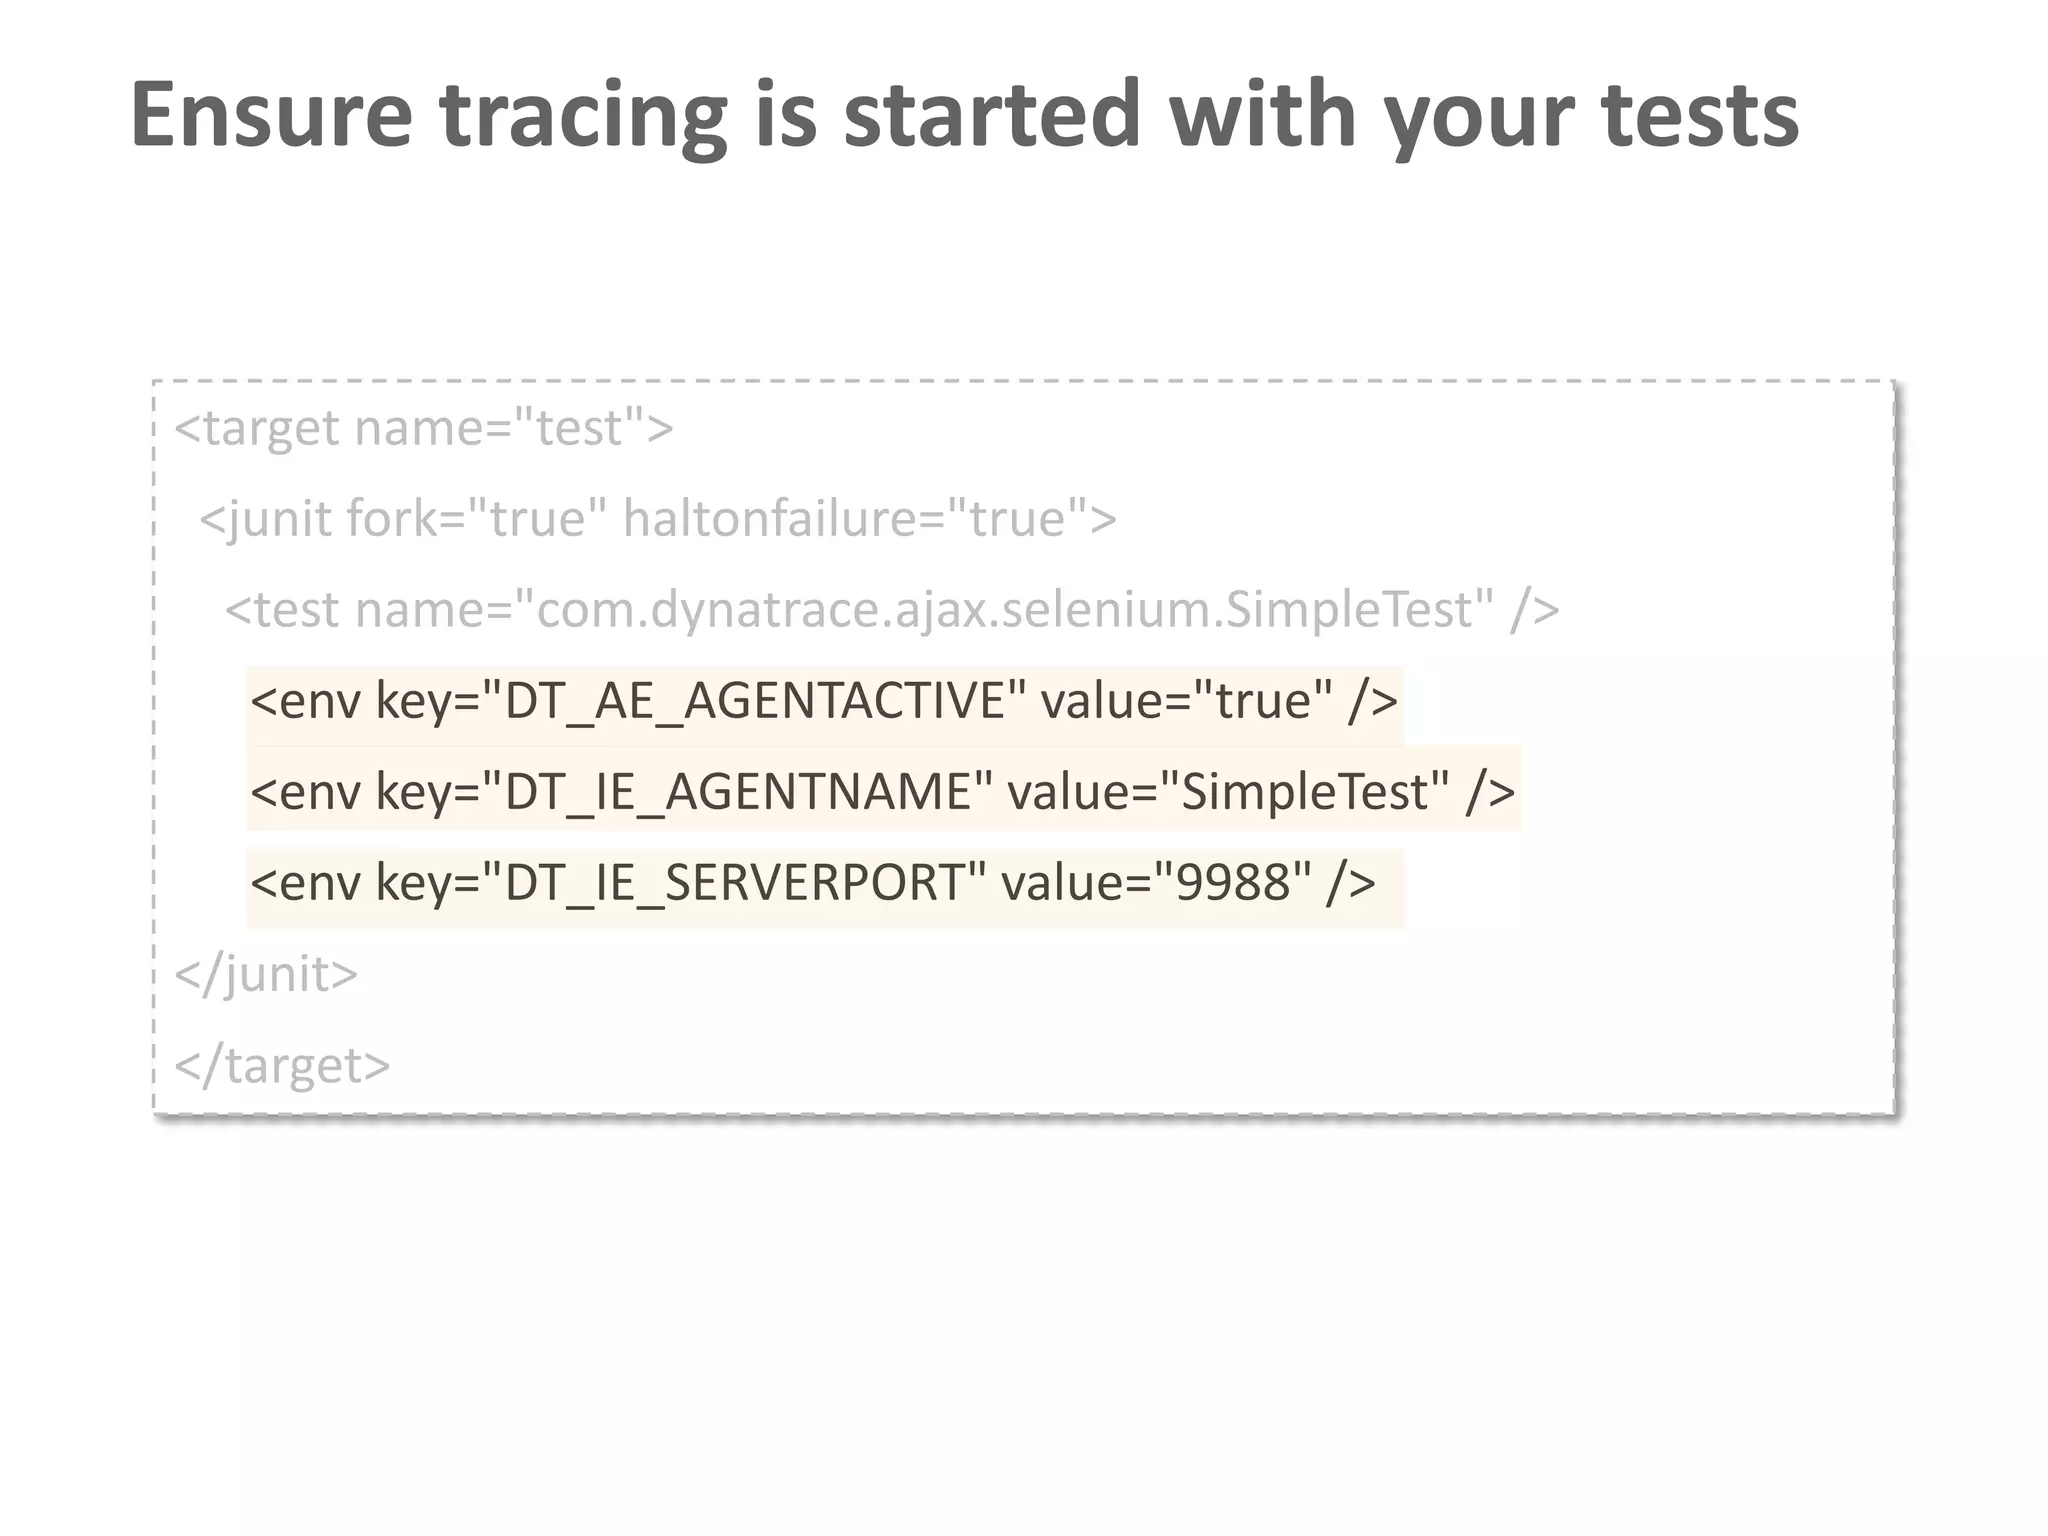
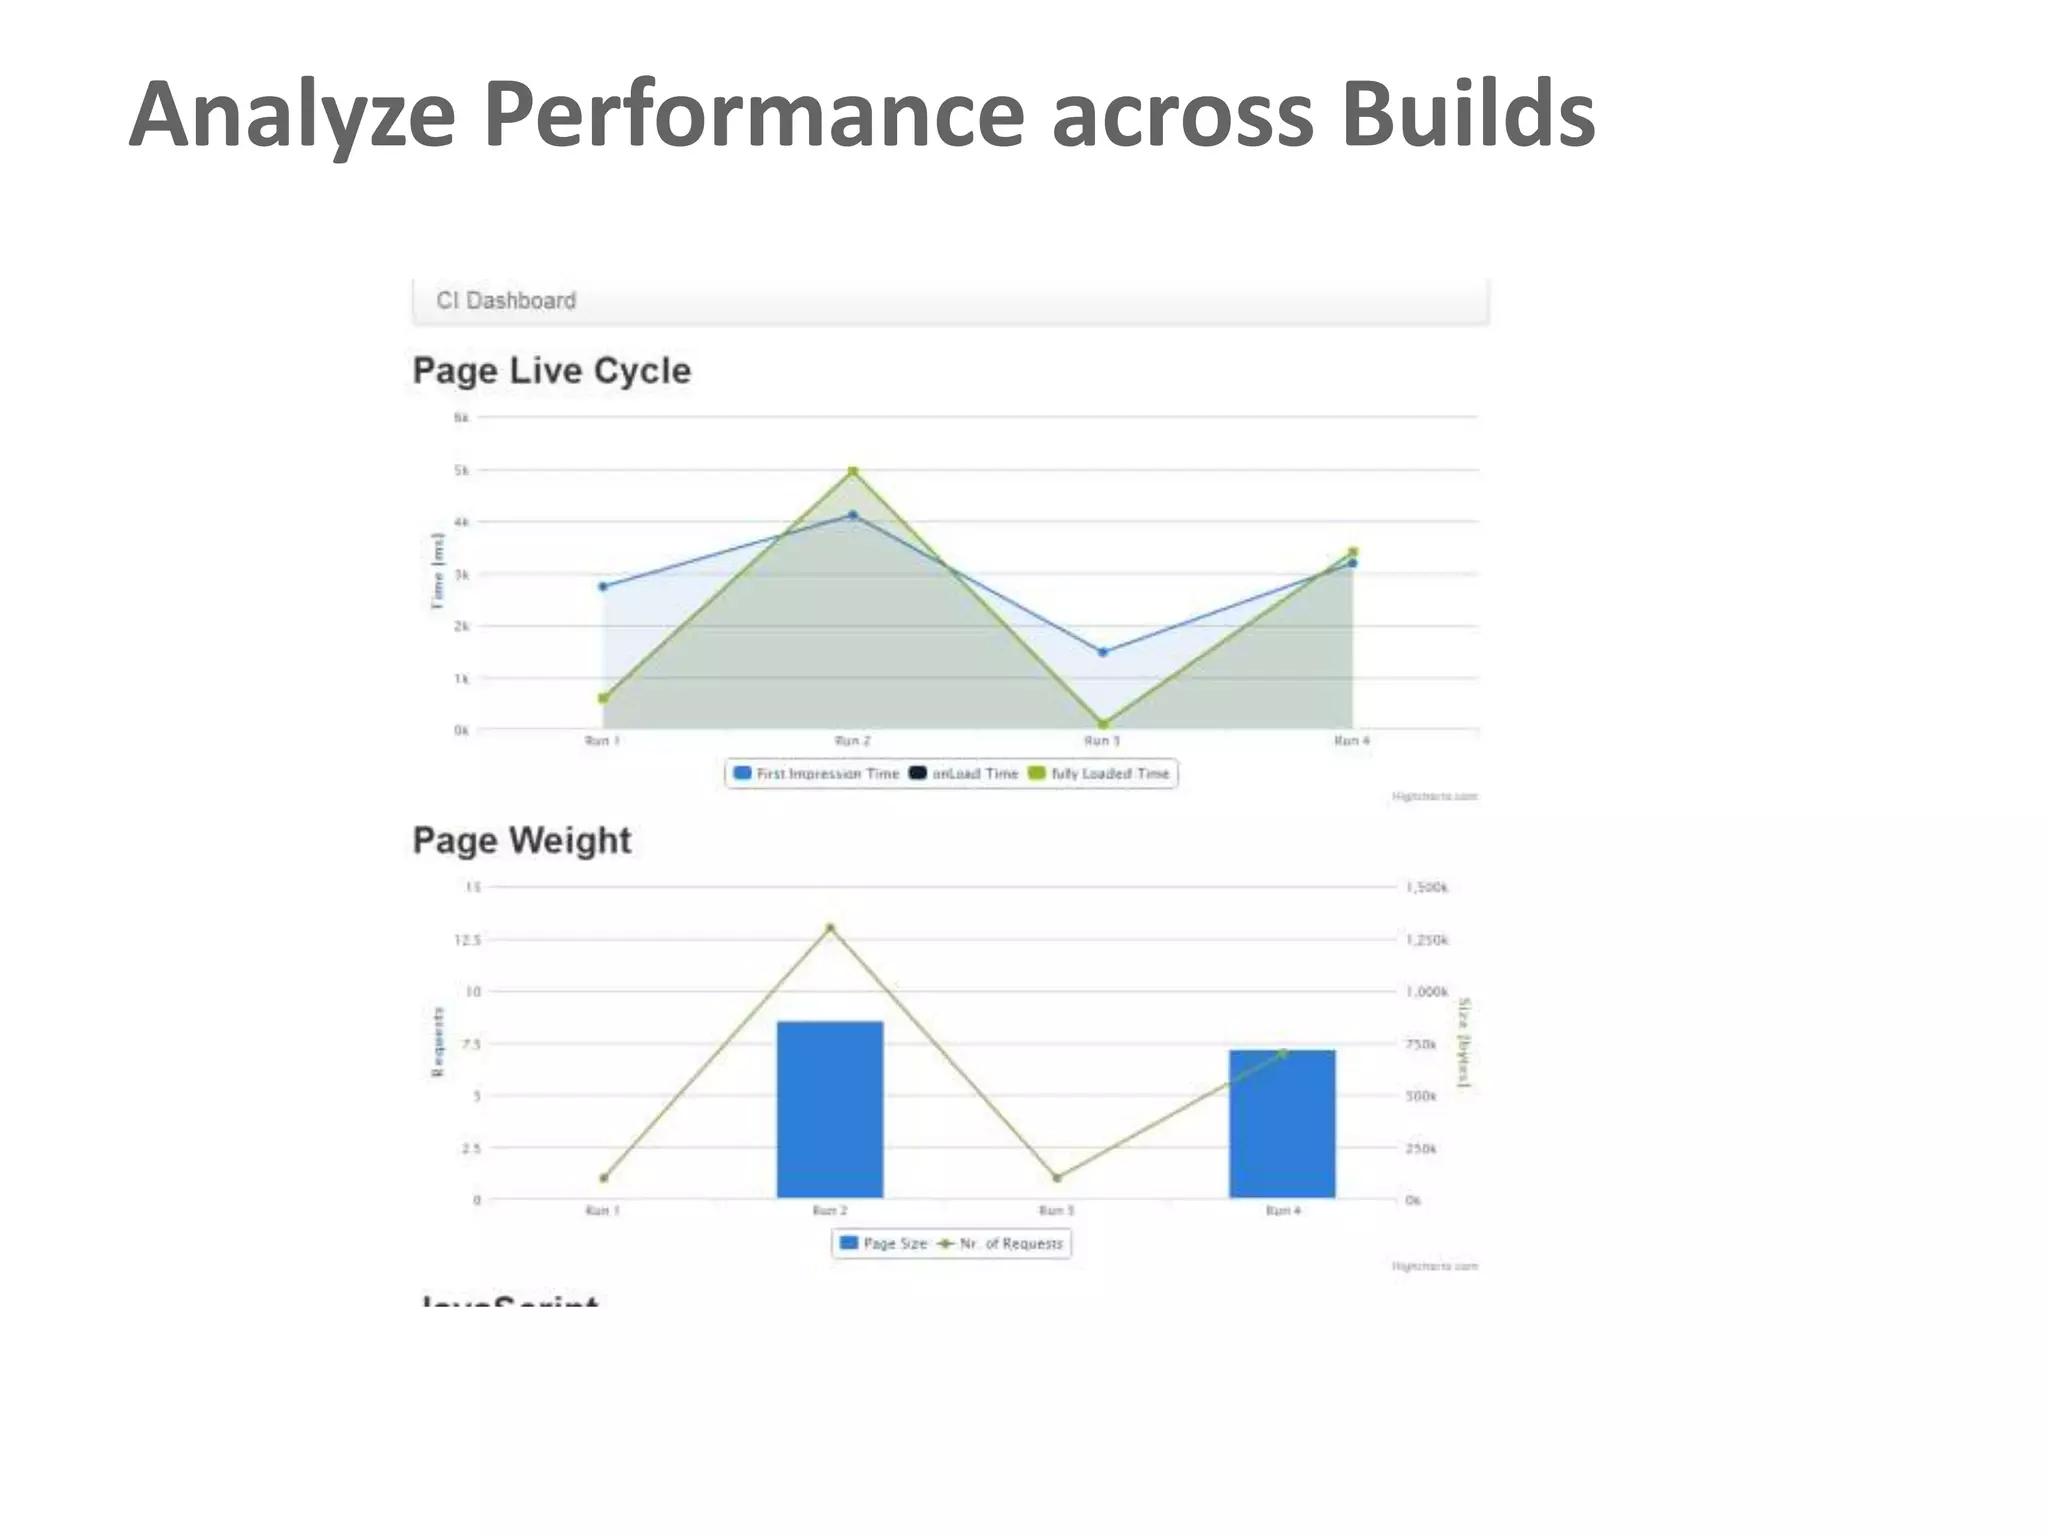
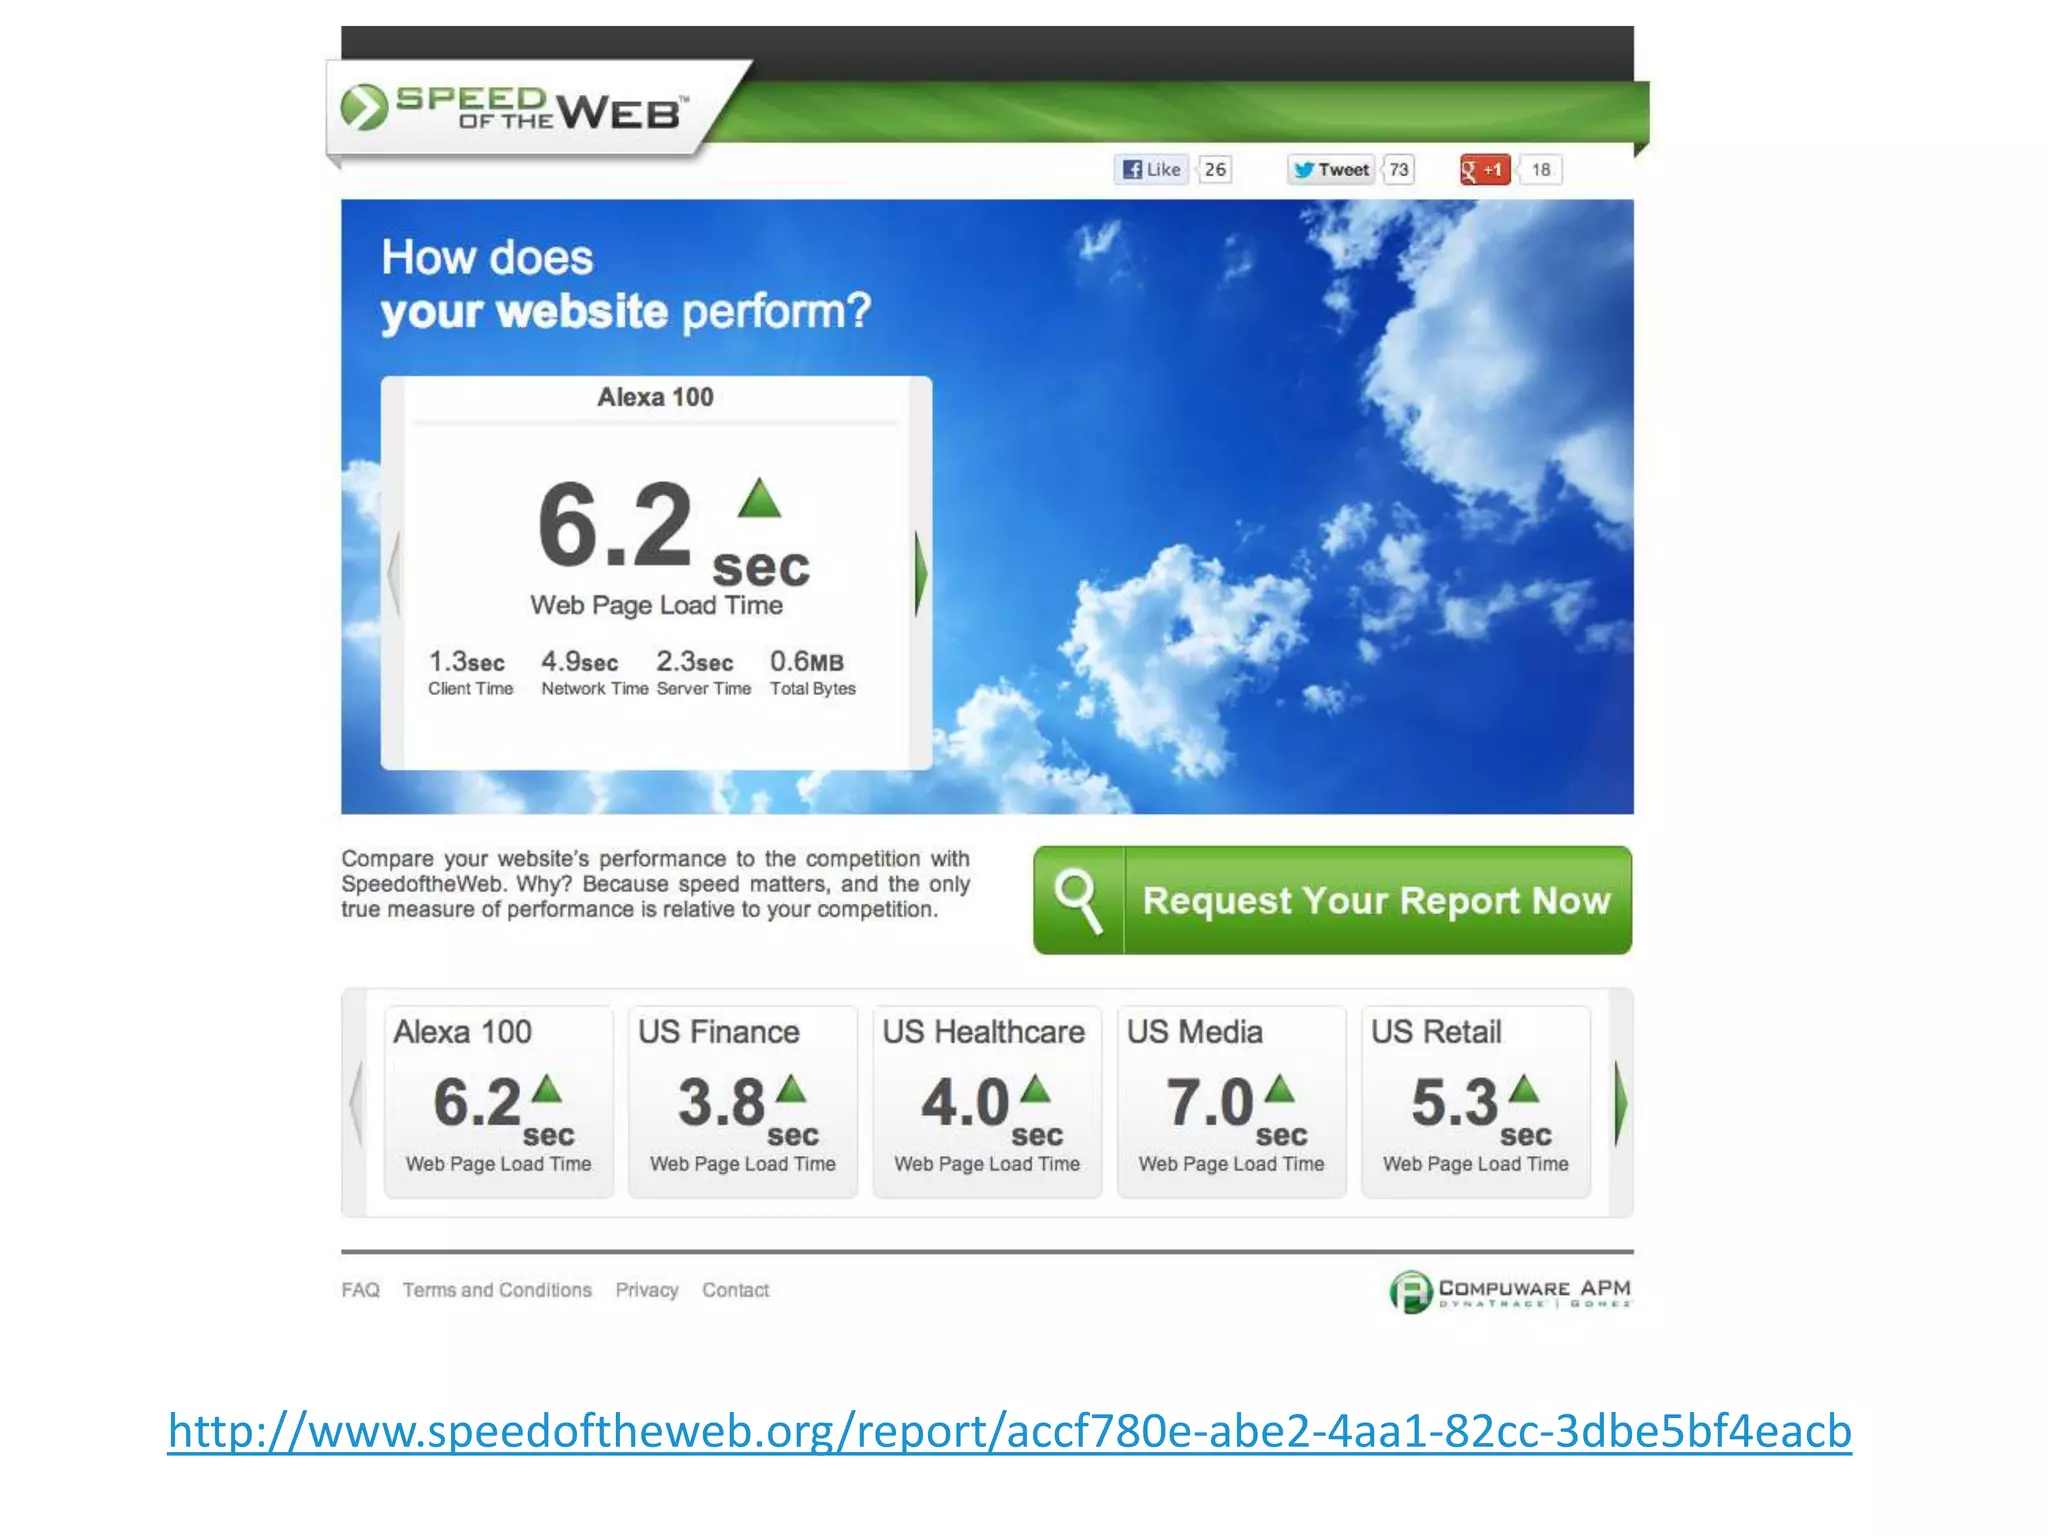
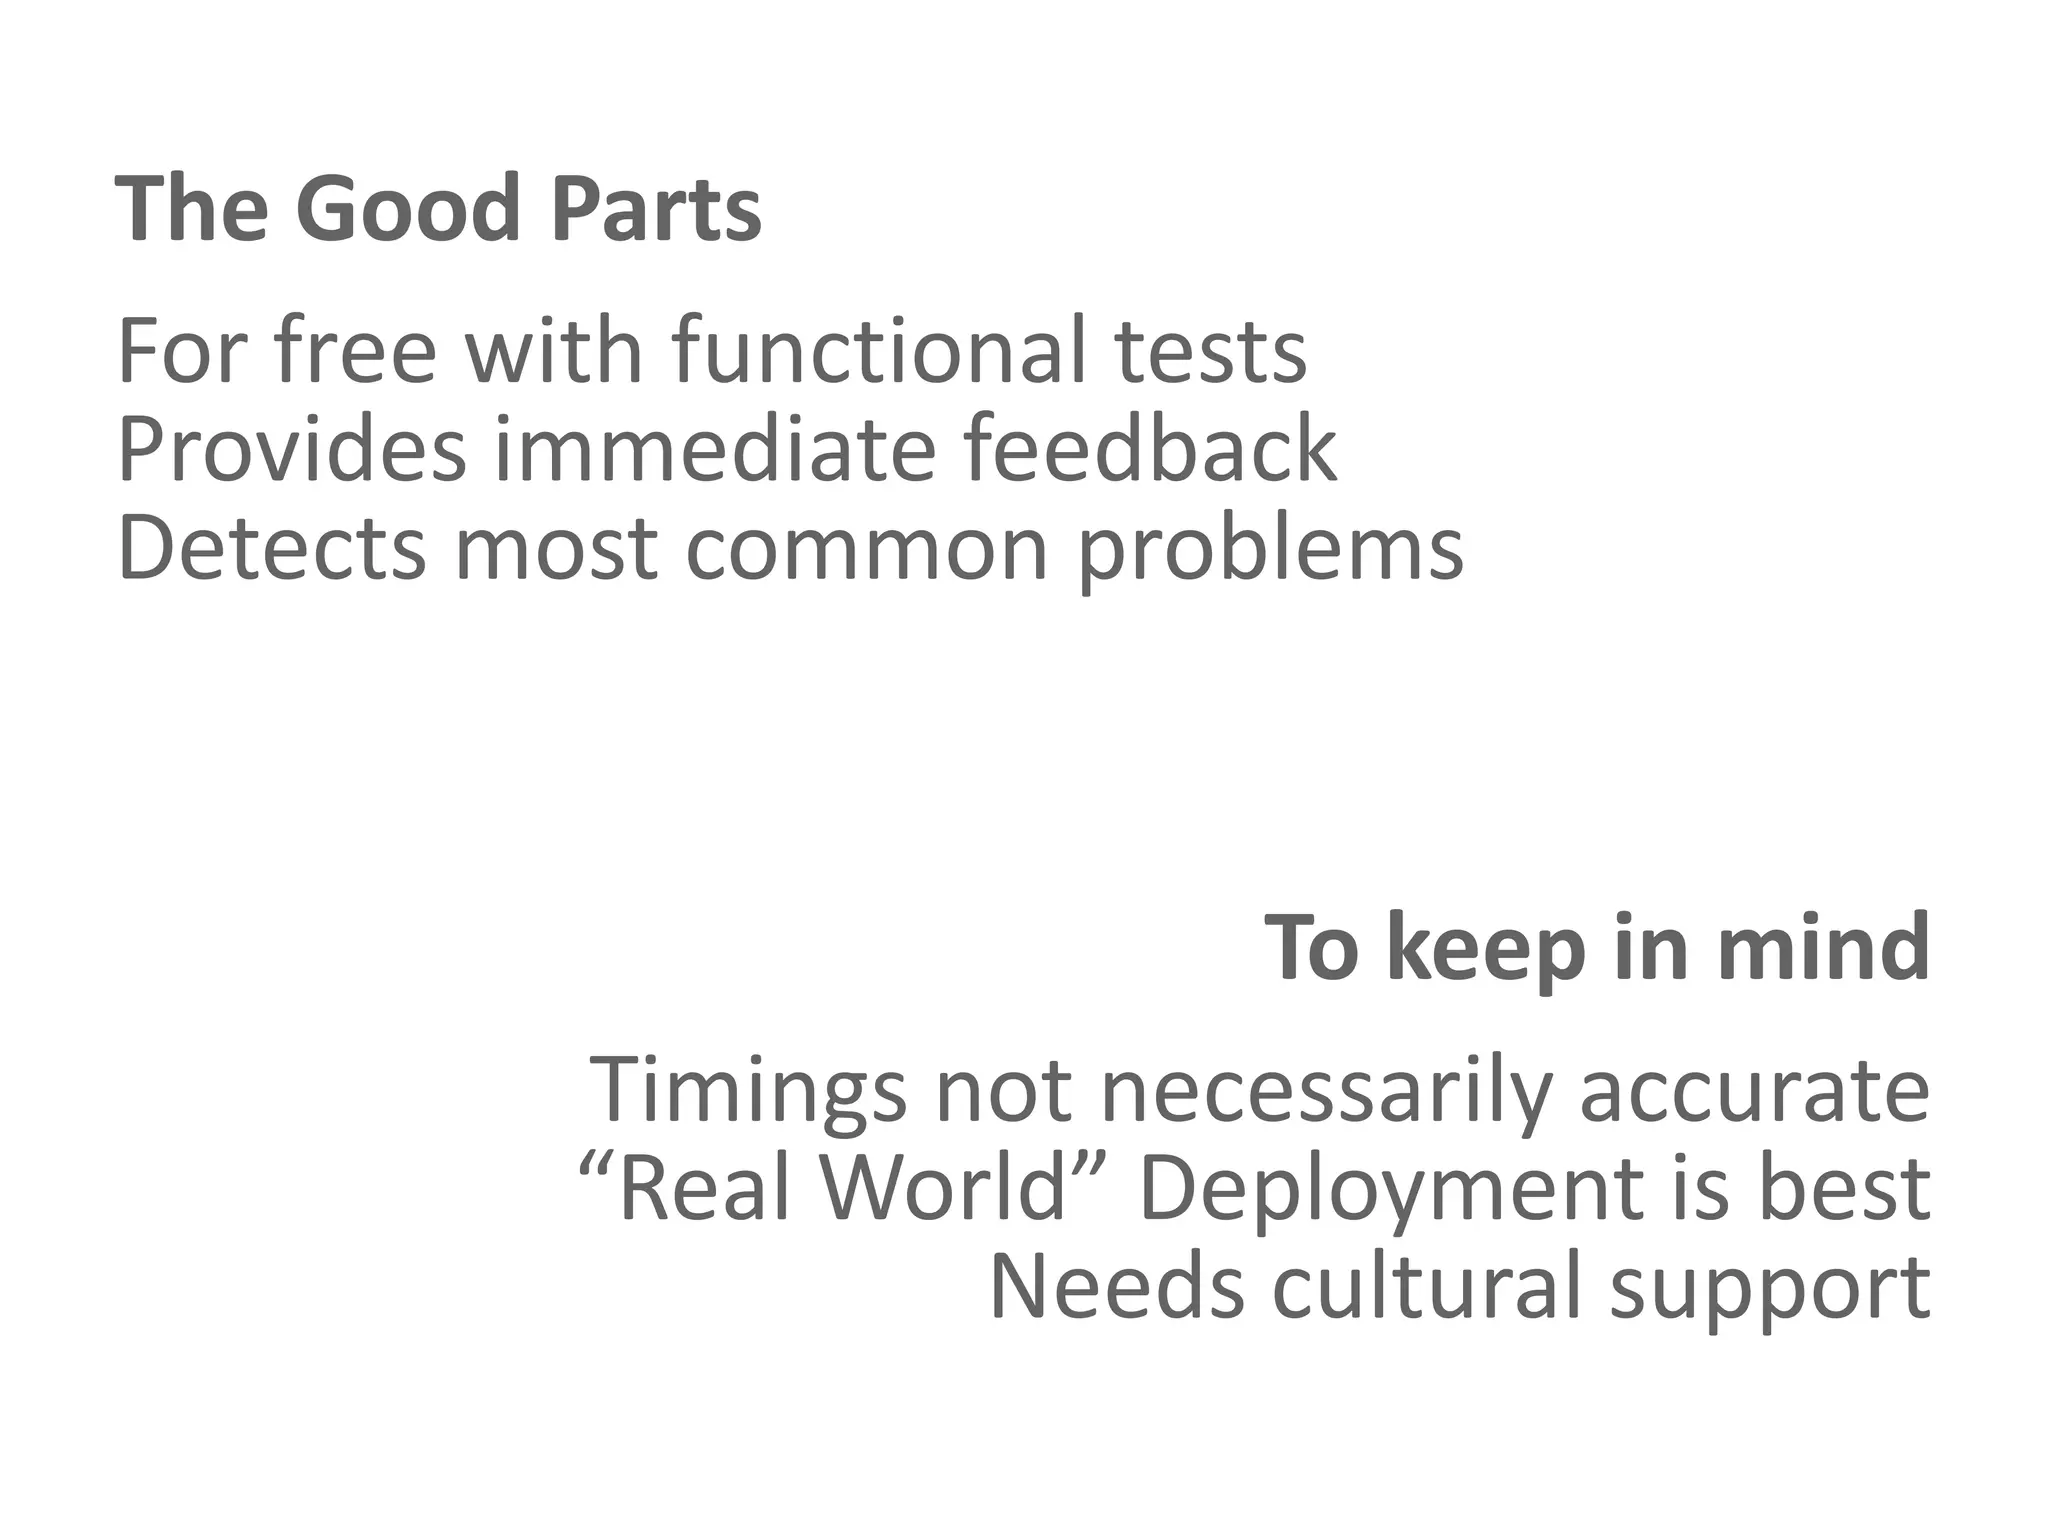
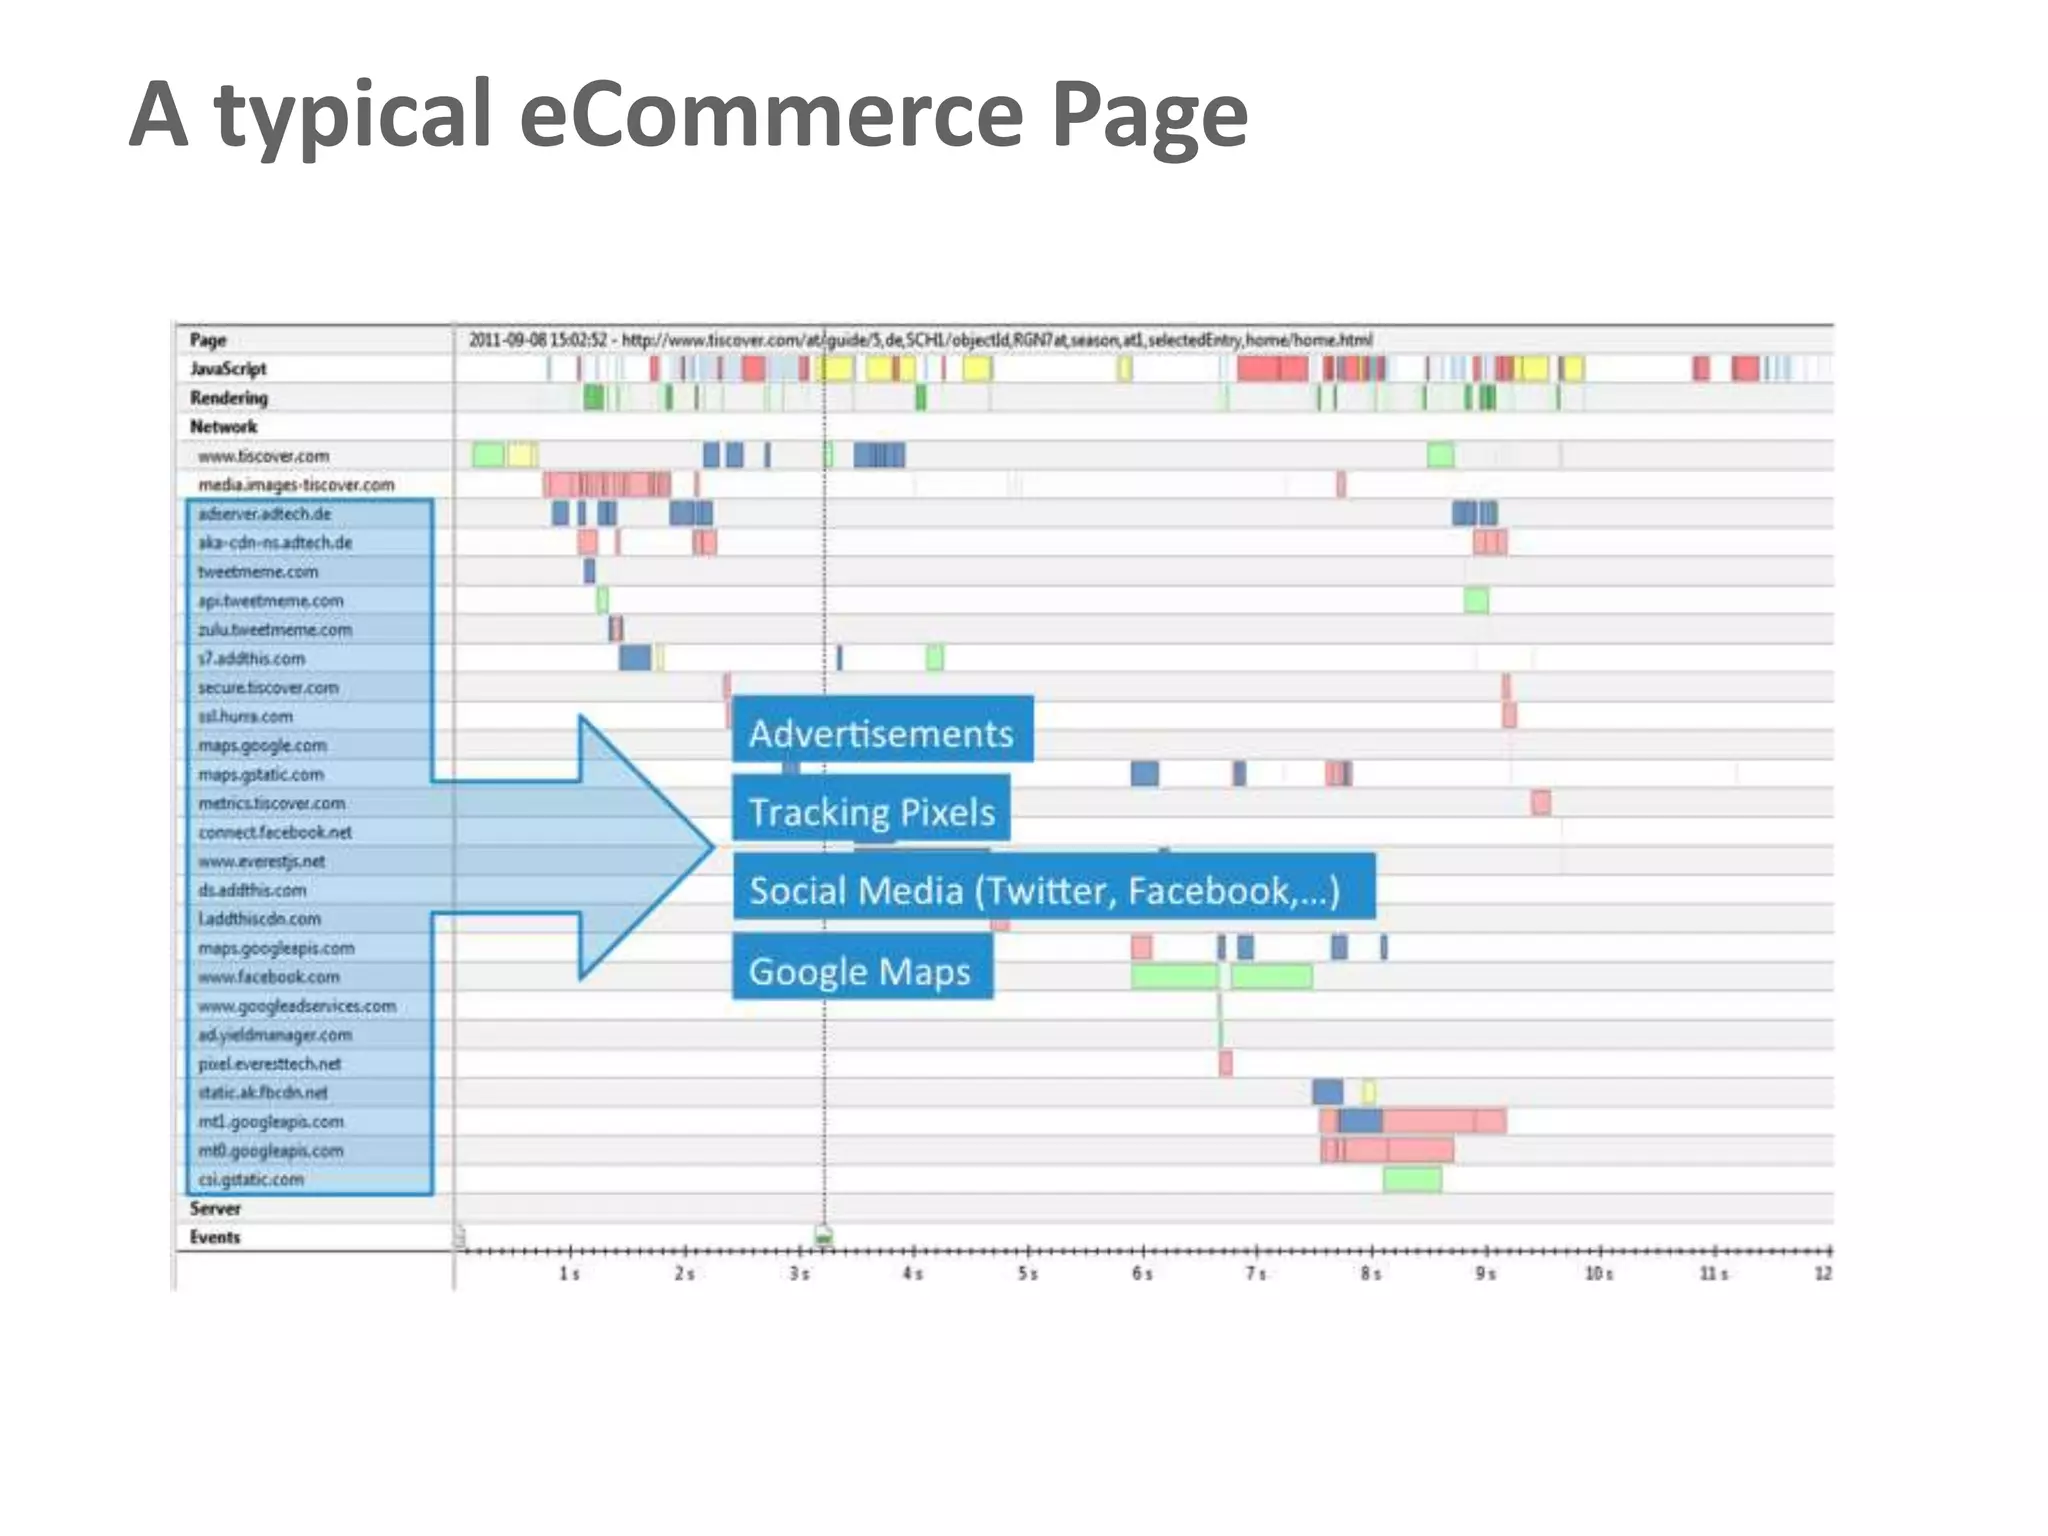
This document discusses high performance web application lifecycles. It covers trends in continuous integration, automated web performance testing, and continuous monitoring in production. Metrics like page load time, resource timing, and third party content load time are discussed. The document also covers browser APIs like Navigation Timing and Performance Timeline that provide performance metrics, and how these can be used to analyze performance across builds and detect common problems. Limitations include lack of support in older browsers and inability to provide insight into JavaScript.