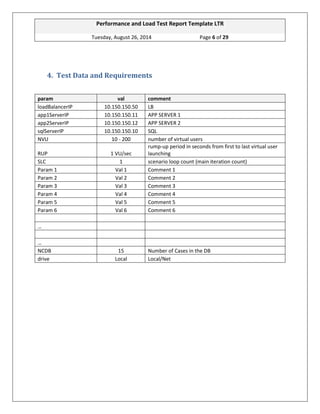
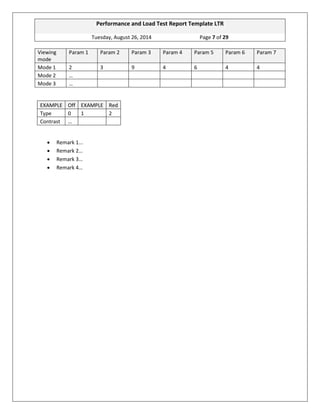
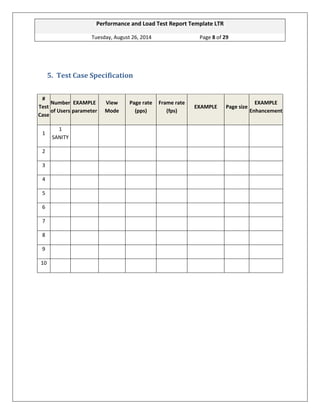
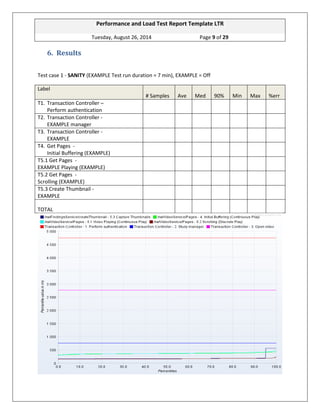
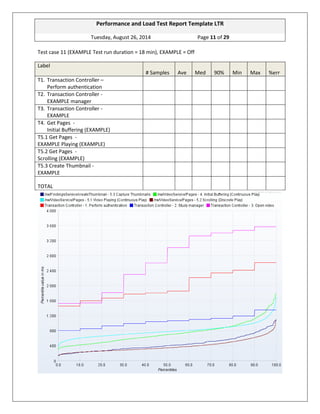
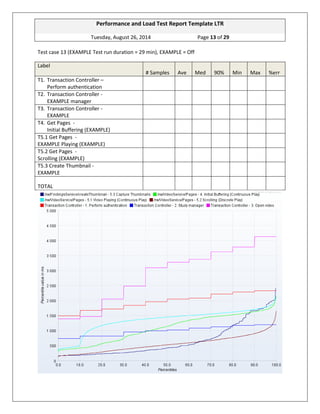
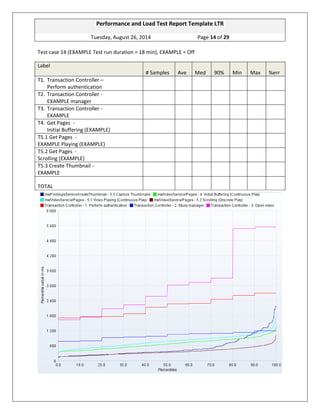
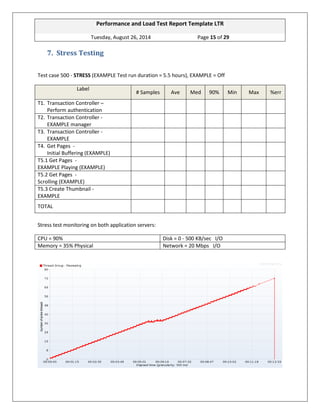
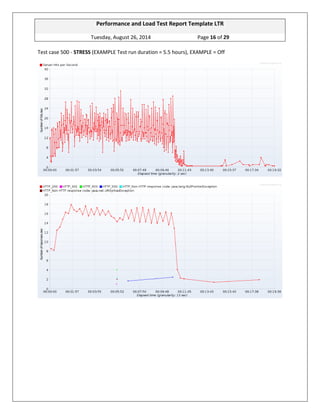
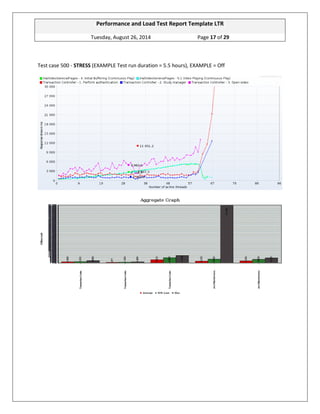
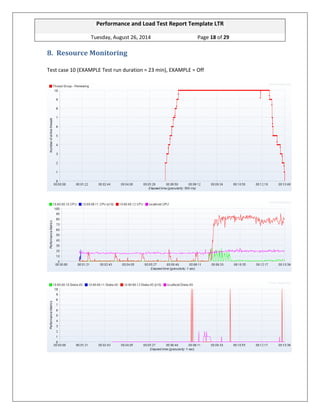
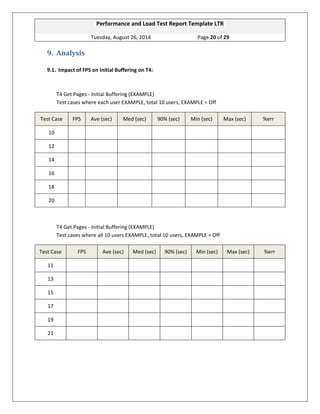
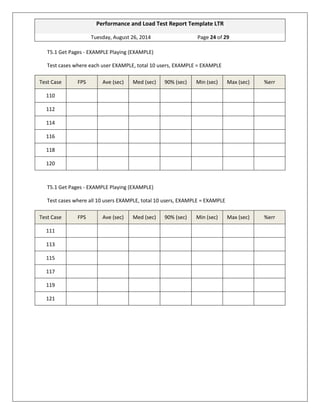
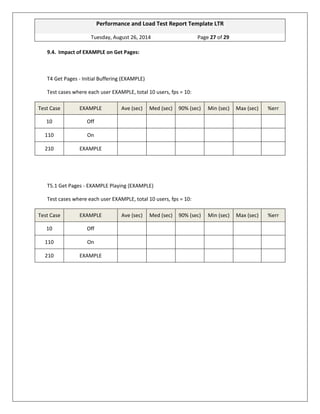
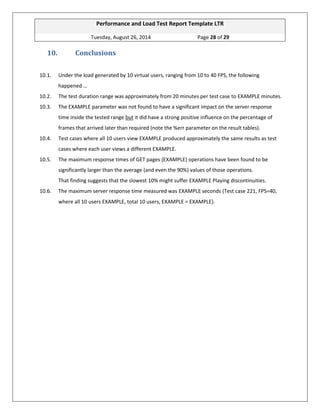
Performance and Load Test Report Template LTR 
Tuesday, August 26, 2014 Page 1 of 29 
Performance and Load Test Report Template LTR 
Prepared by: Shay Ginsbourg, Consultant 
Reviewed by: Dan Jones, Software QA Manager 
Approved by: John Doe, Director of Software Development
Performance and Load Test Report Template LTR 
Tuesday, August 26, 2014 Page 2 of 29 
Contents 
1. Scenario Specification ........................................................................................................................... 3 
2. Load Test Hardware .............................................................................................................................. 4 
3. Load Test Software ............................................................................................................................... 5 
4. Test Data and Requirements ................................................................................................................ 6 
5. Test Case Specification .......................................................................................................................... 8 
6. Results ................................................................................................................................................... 9 
7. Stress Testing ...................................................................................................................................... 15 
8. Resource Monitoring .......................................................................................................................... 18 
9. Analysis ............................................................................................................................................... 20 
10. Conclusions ..................................................................................................................................... 28 
11. References ...................................................................................................................................... 29
Performance and Load Test Report Template LTR 
Tuesday, August 26, 2014 Page 3 of 29 
1. Scenario Specification 
Performance and load testing is normally performed in order to validate multi-client-server complex system. This load test scenario is based on … 
The scenario was created in order to validate that the followings requirements have been met by the current version of the server application: … 
The system topology that is relevant to the performance and load testing procedure was created … 
The following pages provide the settings, results, and conclusions derived from the load tests, as specified.
Performance and Load Test Report Template LTR 
Tuesday, August 26, 2014 Page 4 of 29 
2. Load Test Hardware Load test hardware requirements depend on mainly on the footprint of the virtual client that creates load on the EXAMPLE server side. In the EXAMPLE Web APP system, the client is a Web browser that buffers thousands of EXAMPLES. That creates rather a fat client with huge memory requirements. Running an EXAMPLE load test from CMD w/o JAVA GUI: On a 64-bit LINUX EXAMPLE workstation with 8 GB RAM, 10 concurrent virtual users are below the maximum, sizing approximately 2 GB JAVA.EXE process size. With EXAMPLE JAVA GUI: On a 64-bit LINUX EXAMPLE workstation with 8 GB RAM, approximately 5 concurrent virtual users are the maximum, sizing 4.0-4.5 GB JAVA.EXE process size, depending probably on the EXAMPLE size of the specific video frames that were buffered.
Performance and Load Test Report Template LTR 
Tuesday, August 26, 2014 Page 5 of 29 
3. Load Test Software The selected load generation environment is:  Java Virtual Machine 64-bit on LINUX Ubuntu 14 64-bit,  JMeter version 2.11,  Standard and extra set of JMeter Plug-ins version 1.1.3. The Apache JMeter™ desktop application is open source software, a 100% pure Java application designed to load test functional behavior and measure performance. It was originally designed for testing Web Applications but has since expanded to other test functions. Apache JMeter™ may be used to test performance both on static and dynamic resources (files, Servlets, Perl scripts, Java Objects, Data Bases and Queries, FTP Servers and more). It can be used to simulate a heavy load on a server, network or object to test its strength or to analyze overall performance under different load types. Moreover, it can be used it to make a graphical analysis of performance or to test your server/script/object behavior under heavy concurrent load.
Performance and Load Test Report Template LTR 
Tuesday, August 26, 2014 Page 6 of 29 
4. Test Data and Requirements 
param val comment 
loadBalancerIP 
10.150.150.50 
LB 
app1ServerIP 
10.150.150.11 
APP SERVER 1 
app2ServerIP 
10.150.150.12 
APP SERVER 2 
sqlServerIP 
10.150.150.10 
SQL 
NVU 
10 - 200 
number of virtual users 
RUP 
1 VU/sec 
rump-up period in seconds from first to last virtual user launching 
SLC 
1 
scenario loop count (main iteration count) 
Param 1 
Val 1 
Comment 1 
Param 2 
Val 2 
Comment 2 
Param 3 
Val 3 
Comment 3 
Param 4 
Val 4 
Comment 4 
Param 5 
Val 5 
Comment 5 
Param 6 
Val 6 
Comment 6 
… 
… 
NCDB 
15 
Number of Cases in the DB 
drive 
Local 
Local/Net
Performance and Load Test Report Template LTR 
Tuesday, August 26, 2014 Page 7 of 29 
Viewing mode Param 1 Param 2 Param 3 Param 4 Param 5 Param 6 Param 7 
Mode 1 
2 
3 
9 
4 
6 
4 
4 
Mode 2 
… 
Mode 3 
… 
EXAMPLE Off EXAMPLE Red 
Type 
0 
1 
2 
Contrast 
… 
 Remark 1... 
 Remark 2… 
 Remark 3… 
 Remark 4…
Performance and Load Test Report Template LTR 
Tuesday, August 26, 2014 Page 8 of 29 
5. Test Case Specification 
# Test Case Number of Users EXAMPLE parameter View Mode Page rate (pps) Frame rate (fps) EXAMPLE Page size EXAMPLE Enhancement 
1 
1 SANITY 
2 
3 
4 
5 
6 
7 
8 
9 
10
Performance and Load Test Report Template LTR 
Tuesday, August 26, 2014 Page 9 of 29 
6. Results Test case 1 - SANITY (EXAMPLE Test run duration = 7 min), EXAMPLE = Off Label # Samples Ave Med 90% Min Max %err 
T1. Transaction Controller – Perform authentication 
T2. Transaction Controller - EXAMPLE manager 
T3. Transaction Controller - EXAMPLE 
T4. Get Pages - Initial Buffering (EXAMPLE) 
T5.1 Get Pages - EXAMPLE Playing (EXAMPLE) 
T5.2 Get Pages - Scrolling (EXAMPLE) 
T5.3 Create Thumbnail - EXAMPLE 
TOTAL
Performance and Load Test Report Template LTR 
Tuesday, August 26, 2014 Page 10 of 29 
Test case 10 (EXAMPLE Test run duration = 23 min), EXAMPLE = Off Label # Samples Ave Med 90% Min Max %err 
T1. Transaction Controller – Perform authentication 
T2. Transaction Controller - EXAMPLE manager 
T3. Transaction Controller - EXAMPLE 
T4. Get Pages - Initial Buffering (EXAMPLE) 
T5.1 Get Pages - EXAMPLE Playing (EXAMPLE) 
T5.2 Get Pages - Scrolling (EXAMPLE) 
T5.3 Create Thumbnail - EXAMPLE 
TOTAL
Performance and Load Test Report Template LTR 
Tuesday, August 26, 2014 Page 11 of 29 
Test case 11 (EXAMPLE Test run duration = 18 min), EXAMPLE = Off Label # Samples Ave Med 90% Min Max %err 
T1. Transaction Controller – Perform authentication 
T2. Transaction Controller - EXAMPLE manager 
T3. Transaction Controller - EXAMPLE 
T4. Get Pages - Initial Buffering (EXAMPLE) 
T5.1 Get Pages - EXAMPLE Playing (EXAMPLE) 
T5.2 Get Pages - Scrolling (EXAMPLE) 
T5.3 Create Thumbnail - EXAMPLE 
TOTAL
Performance and Load Test Report Template LTR 
Tuesday, August 26, 2014 Page 12 of 29 
Test case 12 (EXAMPLE Test run duration = 20 min), EXAMPLE = Off Label # Samples Ave Med 90% Min Max %err 
T1. Transaction Controller – Perform authentication 
T2. Transaction Controller - EXAMPLE manager 
T3. Transaction Controller - EXAMPLE 
T4. Get Pages - Initial Buffering (EXAMPLE) 
T5.1 Get Pages - EXAMPLE Playing (EXAMPLE) 
T5.2 Get Pages - Scrolling (EXAMPLE) 
T5.3 Create Thumbnail - EXAMPLE 
TOTAL
Performance and Load Test Report Template LTR 
Tuesday, August 26, 2014 Page 13 of 29 
Test case 13 (EXAMPLE Test run duration = 29 min), EXAMPLE = Off Label # Samples Ave Med 90% Min Max %err 
T1. Transaction Controller – Perform authentication 
T2. Transaction Controller - EXAMPLE manager 
T3. Transaction Controller - EXAMPLE 
T4. Get Pages - Initial Buffering (EXAMPLE) 
T5.1 Get Pages - EXAMPLE Playing (EXAMPLE) 
T5.2 Get Pages - Scrolling (EXAMPLE) 
T5.3 Create Thumbnail - EXAMPLE 
TOTAL
Performance and Load Test Report Template LTR 
Tuesday, August 26, 2014 Page 14 of 29 
Test case 14 (EXAMPLE Test run duration = 18 min), EXAMPLE = Off Label # Samples Ave Med 90% Min Max %err 
T1. Transaction Controller – Perform authentication 
T2. Transaction Controller - EXAMPLE manager 
T3. Transaction Controller - EXAMPLE 
T4. Get Pages - Initial Buffering (EXAMPLE) 
T5.1 Get Pages - EXAMPLE Playing (EXAMPLE) 
T5.2 Get Pages - Scrolling (EXAMPLE) 
T5.3 Create Thumbnail - EXAMPLE 
TOTAL
Performance and Load Test Report Template LTR 
Tuesday, August 26, 2014 Page 15 of 29 
7. Stress Testing Test case 500 - STRESS (EXAMPLE Test run duration = 5.5 hours), EXAMPLE = Off Label # Samples Ave Med 90% Min Max %err 
T1. Transaction Controller – Perform authentication 
T2. Transaction Controller - EXAMPLE manager 
T3. Transaction Controller - EXAMPLE 
T4. Get Pages - Initial Buffering (EXAMPLE) 
T5.1 Get Pages - EXAMPLE Playing (EXAMPLE) 
T5.2 Get Pages - Scrolling (EXAMPLE) 
T5.3 Create Thumbnail - EXAMPLE 
TOTAL 
Stress test monitoring on both application servers: 
CPU = 90% 
Disk = 0 - 500 KB/sec I/O 
Memory = 35% Physical 
Network = 20 Mbps I/O
Performance and Load Test Report Template LTR 
Tuesday, August 26, 2014 Page 16 of 29 
Test case 500 - STRESS (EXAMPLE Test run duration = 5.5 hours), EXAMPLE = Off
Performance and Load Test Report Template LTR 
Tuesday, August 26, 2014 Page 17 of 29 
Test case 500 - STRESS (EXAMPLE Test run duration = 5.5 hours), EXAMPLE = Off
Performance and Load Test Report Template LTR 
Tuesday, August 26, 2014 Page 18 of 29 
8. Resource Monitoring Test case 10 (EXAMPLE Test run duration = 23 min), EXAMPLE = Off
Performance and Load Test Report Template LTR 
Tuesday, August 26, 2014 Page 19 of 29
Performance and Load Test Report Template LTR 
Tuesday, August 26, 2014 Page 20 of 29 
9. Analysis 9.1. Impact of FPS on Initial Buffering on T4: T4 Get Pages - Initial Buffering (EXAMPLE) Test cases where each user EXAMPLE, total 10 users, EXAMPLE = Off Test Case FPS Ave (sec) Med (sec) 90% (sec) Min (sec) Max (sec) %err 
10 
12 
14 
16 
18 
20 
T4 Get Pages - Initial Buffering (EXAMPLE) Test cases where all 10 users EXAMPLE, total 10 users, EXAMPLE = Off Test Case FPS Ave (sec) Med (sec) 90% (sec) Min (sec) Max (sec) %err 
11 
13 
15 
17 
19 
21
Performance and Load Test Report Template LTR 
Tuesday, August 26, 2014 Page 21 of 29 
T4 Get Pages - Initial Buffering (EXAMPLE) Test cases where each user EXAMPLE, total 10 users, EXAMPLE = EXAMPLE Test Case FPS Ave (sec) Med (sec) 90% (sec) Min (sec) Max (sec) %err 
110 
112 
114 
116 
118 
120 
T4 Get Pages - Initial Buffering (EXAMPLE) Test cases where all 10 users EXAMPLE, total 10 users, EXAMPLE = EXAMPLE Test Case FPS Ave (sec) Med (sec) 90% (sec) Min (sec) Max (sec) %err 
111 
113 
115 
117 
119 
121
Performance and Load Test Report Template LTR 
Tuesday, August 26, 2014 Page 22 of 29 
T4 Get Pages - Initial Buffering (EXAMPLE) Test cases where each user EXAMPLE, total 10 users, EXAMPLE = EXAMPLE Test Case FPS Ave (sec) Med (sec) 90% (sec) Min (sec) Max (sec) %err 
210 
212 
214 
216 
218 
220 
T4 Get Pages - Initial Buffering (EXAMPLE) Test cases where all 10 users EXAMPLE, total 10 users, EXAMPLE = EXAMPLE Test Case FPS Ave (sec) Med (sec) 90% (sec) Min (sec) Max (sec) %err 
211 
213 
215 
217 
219 
221
Performance and Load Test Report Template LTR 
Tuesday, August 26, 2014 Page 23 of 29 
9.2. Impact of FPS on EXAMPLE Playing at T5.1: T5.1 Get Pages - EXAMPLE Playing (EXAMPLE) Test cases where each user EXAMPLE, total 10 users, EXAMPLE = Off Test Case FPS Ave (sec) Med (sec) 90% (sec) Min (sec) Max (sec) %err 
10 
12 
14 
16 
18 
20 
T5.1 Get Pages - EXAMPLE Playing (EXAMPLE) Test cases where all 10 users EXAMPLE, total 10 users, EXAMPLE = Off Test Case FPS Ave (sec) Med (sec) 90% (sec) Min (sec) Max (sec) %err 
11 
13 
15 
17 
19 
21
Performance and Load Test Report Template LTR 
Tuesday, August 26, 2014 Page 24 of 29 
T5.1 Get Pages - EXAMPLE Playing (EXAMPLE) Test cases where each user EXAMPLE, total 10 users, EXAMPLE = EXAMPLE Test Case FPS Ave (sec) Med (sec) 90% (sec) Min (sec) Max (sec) %err 
110 
112 
114 
116 
118 
120 
T5.1 Get Pages - EXAMPLE Playing (EXAMPLE) Test cases where all 10 users EXAMPLE, total 10 users, EXAMPLE = EXAMPLE Test Case FPS Ave (sec) Med (sec) 90% (sec) Min (sec) Max (sec) %err 
111 
113 
115 
117 
119 
121
Performance and Load Test Report Template LTR 
Tuesday, August 26, 2014 Page 25 of 29 
T5.1 Get Pages - EXAMPLE Playing (EXAMPLE) Test cases where each user EXAMPLE, total 10 users, EXAMPLE = EXAMPLE Test Case FPS Ave (sec) Med (sec) 90% (sec) Min (sec) Max (sec) %err 
210 
212 
214 
216 
218 
220 
T5.1 Get Pages - EXAMPLE Playing (EXAMPLE) Test cases where all 10 users EXAMPLE, total 10 users, EXAMPLE = EXAMPLE Test Case FPS Ave (sec) Med (sec) 90% (sec) Min (sec) Max (sec) %err 
211 
213 
215 
217 
219 
221
Performance and Load Test Report Template LTR 
Tuesday, August 26, 2014 Page 26 of 29 
9.3. Impact of number of virtual users on Get Pages: T4 Get Pages - Initial Buffering (EXAMPLE) Test cases where each user EXAMPLE, fps = 10: Test Case virtual users Ave (sec) Med (sec) 90% (sec) Min (sec) Max (sec) %err 
315 
10 
310 
311 
312 
T5.1 Get Pages - EXAMPLE Playing (EXAMPLE) Test cases where each user EXAMPLE, fps = 10: Test Case virtual users Ave (sec) Med (sec) 90% (sec) Min (sec) Max (sec) %err 
315 
10 
310 
311 
312
Performance and Load Test Report Template LTR 
Tuesday, August 26, 2014 Page 27 of 29 
9.4. Impact of EXAMPLE on Get Pages: T4 Get Pages - Initial Buffering (EXAMPLE) Test cases where each user EXAMPLE, total 10 users, fps = 10: Test Case EXAMPLE Ave (sec) Med (sec) 90% (sec) Min (sec) Max (sec) %err 
10 
Off 
110 
On 
210 
EXAMPLE 
T5.1 Get Pages - EXAMPLE Playing (EXAMPLE) Test cases where each user EXAMPLE, total 10 users, fps = 10: Test Case EXAMPLE Ave (sec) Med (sec) 90% (sec) Min (sec) Max (sec) %err 
10 
Off 
110 
On 
210 
EXAMPLE
Performance and Load Test Report Template LTR 
Tuesday, August 26, 2014 Page 28 of 29 
10. Conclusions 
10.1. Under the load generated by 10 virtual users, ranging from 10 to 40 FPS, the following happened … 10.2. The test duration range was approximately from 20 minutes per test case to EXAMPLE minutes. 10.3. The EXAMPLE parameter was not found to have a significant impact on the server response time inside the tested range but it did have a strong positive influence on the percentage of frames that arrived later than required (note the %err parameter on the result tables). 10.4. Test cases where all 10 users view EXAMPLE produced approximately the same results as test cases where each user views a different EXAMPLE. 10.5. The maximum response times of GET pages (EXAMPLE) operations have been found to be significantly larger than the average (and even the 90%) values of those operations. That finding suggests that the slowest 10% might suffer EXAMPLE Playing discontinuities. 10.6. The maximum server response time measured was EXAMPLE seconds (Test case 221, FPS=40, where all 10 users EXAMPLE, total 10 users, EXAMPLE = EXAMPLE).
Performance and Load Test Report Template LTR 
Tuesday, August 26, 2014 Page 29 of 29 
11. References 
11.1. Software Performance and Scalability: A Quantitative Approach, Henry H. Liu, Wiley 1st edition, May 26, 2009. 11.2. The Software Verification and Validation: An Engineering and Scientific Approach, Marcus S. Fisher, Springer 2007 edition, December 20, 2006. 11.3. Performance Testing With JMeter 2.9, Bayo Erinle, Packt Publishing, July 26, 2013.

Ginsbourg.com - Performance and Load Test Report Template LTR 1.2

  • 1.
    Performance and LoadTest Report Template LTR Tuesday, August 26, 2014 Page 1 of 29 Performance and Load Test Report Template LTR Prepared by: Shay Ginsbourg, Consultant Reviewed by: Dan Jones, Software QA Manager Approved by: John Doe, Director of Software Development
  • 2.
    Performance and LoadTest Report Template LTR Tuesday, August 26, 2014 Page 2 of 29 Contents 1. Scenario Specification ........................................................................................................................... 3 2. Load Test Hardware .............................................................................................................................. 4 3. Load Test Software ............................................................................................................................... 5 4. Test Data and Requirements ................................................................................................................ 6 5. Test Case Specification .......................................................................................................................... 8 6. Results ................................................................................................................................................... 9 7. Stress Testing ...................................................................................................................................... 15 8. Resource Monitoring .......................................................................................................................... 18 9. Analysis ............................................................................................................................................... 20 10. Conclusions ..................................................................................................................................... 28 11. References ...................................................................................................................................... 29
  • 3.
    Performance and LoadTest Report Template LTR Tuesday, August 26, 2014 Page 3 of 29 1. Scenario Specification Performance and load testing is normally performed in order to validate multi-client-server complex system. This load test scenario is based on … The scenario was created in order to validate that the followings requirements have been met by the current version of the server application: … The system topology that is relevant to the performance and load testing procedure was created … The following pages provide the settings, results, and conclusions derived from the load tests, as specified.
  • 4.
    Performance and LoadTest Report Template LTR Tuesday, August 26, 2014 Page 4 of 29 2. Load Test Hardware Load test hardware requirements depend on mainly on the footprint of the virtual client that creates load on the EXAMPLE server side. In the EXAMPLE Web APP system, the client is a Web browser that buffers thousands of EXAMPLES. That creates rather a fat client with huge memory requirements. Running an EXAMPLE load test from CMD w/o JAVA GUI: On a 64-bit LINUX EXAMPLE workstation with 8 GB RAM, 10 concurrent virtual users are below the maximum, sizing approximately 2 GB JAVA.EXE process size. With EXAMPLE JAVA GUI: On a 64-bit LINUX EXAMPLE workstation with 8 GB RAM, approximately 5 concurrent virtual users are the maximum, sizing 4.0-4.5 GB JAVA.EXE process size, depending probably on the EXAMPLE size of the specific video frames that were buffered.
  • 5.
    Performance and LoadTest Report Template LTR Tuesday, August 26, 2014 Page 5 of 29 3. Load Test Software The selected load generation environment is:  Java Virtual Machine 64-bit on LINUX Ubuntu 14 64-bit,  JMeter version 2.11,  Standard and extra set of JMeter Plug-ins version 1.1.3. The Apache JMeter™ desktop application is open source software, a 100% pure Java application designed to load test functional behavior and measure performance. It was originally designed for testing Web Applications but has since expanded to other test functions. Apache JMeter™ may be used to test performance both on static and dynamic resources (files, Servlets, Perl scripts, Java Objects, Data Bases and Queries, FTP Servers and more). It can be used to simulate a heavy load on a server, network or object to test its strength or to analyze overall performance under different load types. Moreover, it can be used it to make a graphical analysis of performance or to test your server/script/object behavior under heavy concurrent load.
  • 6.
    Performance and LoadTest Report Template LTR Tuesday, August 26, 2014 Page 6 of 29 4. Test Data and Requirements param val comment loadBalancerIP 10.150.150.50 LB app1ServerIP 10.150.150.11 APP SERVER 1 app2ServerIP 10.150.150.12 APP SERVER 2 sqlServerIP 10.150.150.10 SQL NVU 10 - 200 number of virtual users RUP 1 VU/sec rump-up period in seconds from first to last virtual user launching SLC 1 scenario loop count (main iteration count) Param 1 Val 1 Comment 1 Param 2 Val 2 Comment 2 Param 3 Val 3 Comment 3 Param 4 Val 4 Comment 4 Param 5 Val 5 Comment 5 Param 6 Val 6 Comment 6 … … NCDB 15 Number of Cases in the DB drive Local Local/Net
  • 7.
    Performance and LoadTest Report Template LTR Tuesday, August 26, 2014 Page 7 of 29 Viewing mode Param 1 Param 2 Param 3 Param 4 Param 5 Param 6 Param 7 Mode 1 2 3 9 4 6 4 4 Mode 2 … Mode 3 … EXAMPLE Off EXAMPLE Red Type 0 1 2 Contrast …  Remark 1...  Remark 2…  Remark 3…  Remark 4…
  • 8.
    Performance and LoadTest Report Template LTR Tuesday, August 26, 2014 Page 8 of 29 5. Test Case Specification # Test Case Number of Users EXAMPLE parameter View Mode Page rate (pps) Frame rate (fps) EXAMPLE Page size EXAMPLE Enhancement 1 1 SANITY 2 3 4 5 6 7 8 9 10
  • 9.
    Performance and LoadTest Report Template LTR Tuesday, August 26, 2014 Page 9 of 29 6. Results Test case 1 - SANITY (EXAMPLE Test run duration = 7 min), EXAMPLE = Off Label # Samples Ave Med 90% Min Max %err T1. Transaction Controller – Perform authentication T2. Transaction Controller - EXAMPLE manager T3. Transaction Controller - EXAMPLE T4. Get Pages - Initial Buffering (EXAMPLE) T5.1 Get Pages - EXAMPLE Playing (EXAMPLE) T5.2 Get Pages - Scrolling (EXAMPLE) T5.3 Create Thumbnail - EXAMPLE TOTAL
  • 10.
    Performance and LoadTest Report Template LTR Tuesday, August 26, 2014 Page 10 of 29 Test case 10 (EXAMPLE Test run duration = 23 min), EXAMPLE = Off Label # Samples Ave Med 90% Min Max %err T1. Transaction Controller – Perform authentication T2. Transaction Controller - EXAMPLE manager T3. Transaction Controller - EXAMPLE T4. Get Pages - Initial Buffering (EXAMPLE) T5.1 Get Pages - EXAMPLE Playing (EXAMPLE) T5.2 Get Pages - Scrolling (EXAMPLE) T5.3 Create Thumbnail - EXAMPLE TOTAL
  • 11.
    Performance and LoadTest Report Template LTR Tuesday, August 26, 2014 Page 11 of 29 Test case 11 (EXAMPLE Test run duration = 18 min), EXAMPLE = Off Label # Samples Ave Med 90% Min Max %err T1. Transaction Controller – Perform authentication T2. Transaction Controller - EXAMPLE manager T3. Transaction Controller - EXAMPLE T4. Get Pages - Initial Buffering (EXAMPLE) T5.1 Get Pages - EXAMPLE Playing (EXAMPLE) T5.2 Get Pages - Scrolling (EXAMPLE) T5.3 Create Thumbnail - EXAMPLE TOTAL
  • 12.
    Performance and LoadTest Report Template LTR Tuesday, August 26, 2014 Page 12 of 29 Test case 12 (EXAMPLE Test run duration = 20 min), EXAMPLE = Off Label # Samples Ave Med 90% Min Max %err T1. Transaction Controller – Perform authentication T2. Transaction Controller - EXAMPLE manager T3. Transaction Controller - EXAMPLE T4. Get Pages - Initial Buffering (EXAMPLE) T5.1 Get Pages - EXAMPLE Playing (EXAMPLE) T5.2 Get Pages - Scrolling (EXAMPLE) T5.3 Create Thumbnail - EXAMPLE TOTAL
  • 13.
    Performance and LoadTest Report Template LTR Tuesday, August 26, 2014 Page 13 of 29 Test case 13 (EXAMPLE Test run duration = 29 min), EXAMPLE = Off Label # Samples Ave Med 90% Min Max %err T1. Transaction Controller – Perform authentication T2. Transaction Controller - EXAMPLE manager T3. Transaction Controller - EXAMPLE T4. Get Pages - Initial Buffering (EXAMPLE) T5.1 Get Pages - EXAMPLE Playing (EXAMPLE) T5.2 Get Pages - Scrolling (EXAMPLE) T5.3 Create Thumbnail - EXAMPLE TOTAL
  • 14.
    Performance and LoadTest Report Template LTR Tuesday, August 26, 2014 Page 14 of 29 Test case 14 (EXAMPLE Test run duration = 18 min), EXAMPLE = Off Label # Samples Ave Med 90% Min Max %err T1. Transaction Controller – Perform authentication T2. Transaction Controller - EXAMPLE manager T3. Transaction Controller - EXAMPLE T4. Get Pages - Initial Buffering (EXAMPLE) T5.1 Get Pages - EXAMPLE Playing (EXAMPLE) T5.2 Get Pages - Scrolling (EXAMPLE) T5.3 Create Thumbnail - EXAMPLE TOTAL
  • 15.
    Performance and LoadTest Report Template LTR Tuesday, August 26, 2014 Page 15 of 29 7. Stress Testing Test case 500 - STRESS (EXAMPLE Test run duration = 5.5 hours), EXAMPLE = Off Label # Samples Ave Med 90% Min Max %err T1. Transaction Controller – Perform authentication T2. Transaction Controller - EXAMPLE manager T3. Transaction Controller - EXAMPLE T4. Get Pages - Initial Buffering (EXAMPLE) T5.1 Get Pages - EXAMPLE Playing (EXAMPLE) T5.2 Get Pages - Scrolling (EXAMPLE) T5.3 Create Thumbnail - EXAMPLE TOTAL Stress test monitoring on both application servers: CPU = 90% Disk = 0 - 500 KB/sec I/O Memory = 35% Physical Network = 20 Mbps I/O
  • 16.
    Performance and LoadTest Report Template LTR Tuesday, August 26, 2014 Page 16 of 29 Test case 500 - STRESS (EXAMPLE Test run duration = 5.5 hours), EXAMPLE = Off
  • 17.
    Performance and LoadTest Report Template LTR Tuesday, August 26, 2014 Page 17 of 29 Test case 500 - STRESS (EXAMPLE Test run duration = 5.5 hours), EXAMPLE = Off
  • 18.
    Performance and LoadTest Report Template LTR Tuesday, August 26, 2014 Page 18 of 29 8. Resource Monitoring Test case 10 (EXAMPLE Test run duration = 23 min), EXAMPLE = Off
  • 19.
    Performance and LoadTest Report Template LTR Tuesday, August 26, 2014 Page 19 of 29
  • 20.
    Performance and LoadTest Report Template LTR Tuesday, August 26, 2014 Page 20 of 29 9. Analysis 9.1. Impact of FPS on Initial Buffering on T4: T4 Get Pages - Initial Buffering (EXAMPLE) Test cases where each user EXAMPLE, total 10 users, EXAMPLE = Off Test Case FPS Ave (sec) Med (sec) 90% (sec) Min (sec) Max (sec) %err 10 12 14 16 18 20 T4 Get Pages - Initial Buffering (EXAMPLE) Test cases where all 10 users EXAMPLE, total 10 users, EXAMPLE = Off Test Case FPS Ave (sec) Med (sec) 90% (sec) Min (sec) Max (sec) %err 11 13 15 17 19 21
  • 21.
    Performance and LoadTest Report Template LTR Tuesday, August 26, 2014 Page 21 of 29 T4 Get Pages - Initial Buffering (EXAMPLE) Test cases where each user EXAMPLE, total 10 users, EXAMPLE = EXAMPLE Test Case FPS Ave (sec) Med (sec) 90% (sec) Min (sec) Max (sec) %err 110 112 114 116 118 120 T4 Get Pages - Initial Buffering (EXAMPLE) Test cases where all 10 users EXAMPLE, total 10 users, EXAMPLE = EXAMPLE Test Case FPS Ave (sec) Med (sec) 90% (sec) Min (sec) Max (sec) %err 111 113 115 117 119 121
  • 22.
    Performance and LoadTest Report Template LTR Tuesday, August 26, 2014 Page 22 of 29 T4 Get Pages - Initial Buffering (EXAMPLE) Test cases where each user EXAMPLE, total 10 users, EXAMPLE = EXAMPLE Test Case FPS Ave (sec) Med (sec) 90% (sec) Min (sec) Max (sec) %err 210 212 214 216 218 220 T4 Get Pages - Initial Buffering (EXAMPLE) Test cases where all 10 users EXAMPLE, total 10 users, EXAMPLE = EXAMPLE Test Case FPS Ave (sec) Med (sec) 90% (sec) Min (sec) Max (sec) %err 211 213 215 217 219 221
  • 23.
    Performance and LoadTest Report Template LTR Tuesday, August 26, 2014 Page 23 of 29 9.2. Impact of FPS on EXAMPLE Playing at T5.1: T5.1 Get Pages - EXAMPLE Playing (EXAMPLE) Test cases where each user EXAMPLE, total 10 users, EXAMPLE = Off Test Case FPS Ave (sec) Med (sec) 90% (sec) Min (sec) Max (sec) %err 10 12 14 16 18 20 T5.1 Get Pages - EXAMPLE Playing (EXAMPLE) Test cases where all 10 users EXAMPLE, total 10 users, EXAMPLE = Off Test Case FPS Ave (sec) Med (sec) 90% (sec) Min (sec) Max (sec) %err 11 13 15 17 19 21
  • 24.
    Performance and LoadTest Report Template LTR Tuesday, August 26, 2014 Page 24 of 29 T5.1 Get Pages - EXAMPLE Playing (EXAMPLE) Test cases where each user EXAMPLE, total 10 users, EXAMPLE = EXAMPLE Test Case FPS Ave (sec) Med (sec) 90% (sec) Min (sec) Max (sec) %err 110 112 114 116 118 120 T5.1 Get Pages - EXAMPLE Playing (EXAMPLE) Test cases where all 10 users EXAMPLE, total 10 users, EXAMPLE = EXAMPLE Test Case FPS Ave (sec) Med (sec) 90% (sec) Min (sec) Max (sec) %err 111 113 115 117 119 121
  • 25.
    Performance and LoadTest Report Template LTR Tuesday, August 26, 2014 Page 25 of 29 T5.1 Get Pages - EXAMPLE Playing (EXAMPLE) Test cases where each user EXAMPLE, total 10 users, EXAMPLE = EXAMPLE Test Case FPS Ave (sec) Med (sec) 90% (sec) Min (sec) Max (sec) %err 210 212 214 216 218 220 T5.1 Get Pages - EXAMPLE Playing (EXAMPLE) Test cases where all 10 users EXAMPLE, total 10 users, EXAMPLE = EXAMPLE Test Case FPS Ave (sec) Med (sec) 90% (sec) Min (sec) Max (sec) %err 211 213 215 217 219 221
  • 26.
    Performance and LoadTest Report Template LTR Tuesday, August 26, 2014 Page 26 of 29 9.3. Impact of number of virtual users on Get Pages: T4 Get Pages - Initial Buffering (EXAMPLE) Test cases where each user EXAMPLE, fps = 10: Test Case virtual users Ave (sec) Med (sec) 90% (sec) Min (sec) Max (sec) %err 315 10 310 311 312 T5.1 Get Pages - EXAMPLE Playing (EXAMPLE) Test cases where each user EXAMPLE, fps = 10: Test Case virtual users Ave (sec) Med (sec) 90% (sec) Min (sec) Max (sec) %err 315 10 310 311 312
  • 27.
    Performance and LoadTest Report Template LTR Tuesday, August 26, 2014 Page 27 of 29 9.4. Impact of EXAMPLE on Get Pages: T4 Get Pages - Initial Buffering (EXAMPLE) Test cases where each user EXAMPLE, total 10 users, fps = 10: Test Case EXAMPLE Ave (sec) Med (sec) 90% (sec) Min (sec) Max (sec) %err 10 Off 110 On 210 EXAMPLE T5.1 Get Pages - EXAMPLE Playing (EXAMPLE) Test cases where each user EXAMPLE, total 10 users, fps = 10: Test Case EXAMPLE Ave (sec) Med (sec) 90% (sec) Min (sec) Max (sec) %err 10 Off 110 On 210 EXAMPLE
  • 28.
    Performance and LoadTest Report Template LTR Tuesday, August 26, 2014 Page 28 of 29 10. Conclusions 10.1. Under the load generated by 10 virtual users, ranging from 10 to 40 FPS, the following happened … 10.2. The test duration range was approximately from 20 minutes per test case to EXAMPLE minutes. 10.3. The EXAMPLE parameter was not found to have a significant impact on the server response time inside the tested range but it did have a strong positive influence on the percentage of frames that arrived later than required (note the %err parameter on the result tables). 10.4. Test cases where all 10 users view EXAMPLE produced approximately the same results as test cases where each user views a different EXAMPLE. 10.5. The maximum response times of GET pages (EXAMPLE) operations have been found to be significantly larger than the average (and even the 90%) values of those operations. That finding suggests that the slowest 10% might suffer EXAMPLE Playing discontinuities. 10.6. The maximum server response time measured was EXAMPLE seconds (Test case 221, FPS=40, where all 10 users EXAMPLE, total 10 users, EXAMPLE = EXAMPLE).
  • 29.
    Performance and LoadTest Report Template LTR Tuesday, August 26, 2014 Page 29 of 29 11. References 11.1. Software Performance and Scalability: A Quantitative Approach, Henry H. Liu, Wiley 1st edition, May 26, 2009. 11.2. The Software Verification and Validation: An Engineering and Scientific Approach, Marcus S. Fisher, Springer 2007 edition, December 20, 2006. 11.3. Performance Testing With JMeter 2.9, Bayo Erinle, Packt Publishing, July 26, 2013.