The document summarizes a study that used a climate model to predict how climate change may impact the spatial distribution of freshwater snails that transmit parasites in Zimbabwe. The study found:
1) Snail habitat suitability in Zimbabwe varies currently, with some high suitability areas and low suitability areas.
2) Future climate change may cause a reduced spatial distribution of suitable habitat for most snail species by 2100, but the habitat of one snail species may increase by 2055 before declining.
3) Temperature appears to be a main driver of suitable snail habitat and climate change is expected to impact the transmission of parasites that rely on these snail species.
![Background
Schistosomiasis is a major health concern in many parts
of the world where an estimated 207 million people are in-
fected and 779 million are at risk of infection [1,2]; and
85% of the people live in countries south of the Sahara.
The high prevalence of schistosomiasis in Zimbabwe is
well known from a recent national survey carried out in
2010 and 2011 [3]. More than 2.2 million (18%) persons
are estimated to be infected with Schistosoma haemato-
bium, the cause of urinary schistosomiasis and close to
900,000 (7.2%) with S. mansoni causing intestinal schisto-
somiasis [3] (population numbers based on Tatem et al.
[4]). Fascioliasis, caused by Fasciola spp, primarily known
to be of veterinary concern is increasingly recognised to
be responsible for morbidity in humans with estimates of
up to 17 million human infections [1,5-8]. As in most
other parts of the world, the prevalence of human fasciol-
iasis has not been intensively investigated in Zimbabwe,
though prevalence of up to 5% has been reported [9,10].
Fascioliasis affects ruminants and prevalence of 90% has
been reported in cattle in some areas of Zimbabwe [11].
Parasites and the snail intermediate host are poikilo-
therms, and their intrinsic rate of development is dependent
on temperature, which becomes an indirect predictor
of transmission risk, however, other climatic and en-
vironmental factors contribute to the delimitation of their
spatial distribution. Georeferenced collection-points for
snail observations, in combination with environmental
predictors, mainly climatic, were used to develop a model
for prediction of spatial distribution for each of the three
snail species in Zimbabwe, by the use of the Maxent mod-
elling software [12]. The prediction models were parame-
terised with climate projections using the regional climate
model HIRHAM5 [13-16] for periods representative for
present-day climate and two future periods.
A recent study from Zimbabwe substantiated how the
snail distribution has changed in the 24 year period from
1988 to 2012 and that this may be the consequence of a
change in climate [17]. This earlier study focused on short
term climatic changes, i.e. year-to-year variability rather
than the decadal variability which is investigated in this
paper. The question now remains how climate change may
affect snail distribution and consequently the impact of
schistosomiasis and fascioliasis in the future.
The distribution of the aforementioned parasitic infec-
tions is reliant on the presence of their respective inter-
mediate snail host species. Distribution of the snails can
thereby provide information on disease distribution though
the presence of parasites and exposure are also the deter-
mining factors. A unique opportunity of having compre-
hensive data on schistosomiasis and fascioliasis prevalence
from Zimbabwe enabled a translation of the Maxent model
output of habitat suitability into a distribution, i.e. delimi-
tation of area of occupation of the snails.
The aim of the current study was to predict the nation-
wide spatial distribution of three trematode intermediate
snail host species: Bulinus globosus (Morelet 1866), Biom-
phalaria pfeifferi (Kraus 1848) and Lymnaea natalensis
(Kraus 1848) for present-day climate, and to forecast the
distribution in a future climate, based on a climate change
projection model. The overall present and future spatial
distribution of potential suitable snail habitat is reported
for Zimbabwe and the impact of climate change is dis-
cussed. Furthermore, the habitat suitability modelling re-
sults are translated into areas of occupation of the three
snail species.
Methods
Study area and sampling method
Zimbabwe is a landlocked country situated in the south-
ern tropical zone and comprises an area of 390,757 km2
.
Two bio-climatic zones exist, the highveld (1000-1500 m.
a.s.l) and lowveld (500-1000 m.a.s.l.), primarily distin-
guished by high and low rainfall patterns, respectively.
The highveld covers most of central Zimbabwe stretching
in a southwest-northeast direction and the lowveld covers
most of the northwest and southeast. There is a rainy-
(Dec- Feb), post-rainy- (Mar -May), cold-dry- (Jun -Aug),
and hot-dry (Sep -Nov) season [18-21].
Snail data, used in this analysis, originated from a na-
tional snail survey in May and June of 1988, after the
rainy season covering all parts of Zimbabwe (Figure 1)
[22]. Snail collection methods and equipment were as
described by Coulibaly and Madsen [23] and snail identi-
fication was done following keys described by Brown
and Kristensen [24] by expert malacologists in Harare,
Zimbabwe. A total of 18,066 snails representing 19 dif-
ferent species were collected from 364 locations. Bulinus
globosus were found at 121 locations, Bi. pfeifferi at 64,
and 74 locations held L. natalensis. Sampled habitats were
rivers, marshes, pools, dams, springs, and canals at eleva-
tions between 221 to 1.595 m.a.s.l. Collection sites were
georeferenced by attributing the geographical coordinate
of the arithmetic centre of predefined 26.5 km by 26.5 km
grid cells.
Environmental layers
To resolve the topography of Zimbabwe adequately, the
highest possible spatial resolution, is necessary. General
Circulation Models (GCMs) have typical resolutions on
the order of 100 km. The output of the GCM was there-
fore dynamically downscaled, in this case to a target
resolution of 10 km, to drive a regional climate model
(RCM). Due to numerical stability reasons; an intermedi-
ate downscaling step to 44 km was done. Here we con-
sider only the high resolution 10 km data. The RCM is
based on Christensen [13] with subsequent modifica-
tions and improvements described in Lucas-Picher et al.
Pedersen et al. Parasites & Vectors (2014) 7:536 Page 2 of 12](https://image.slidesharecdn.com/ce1a0938-8c9d-4663-af65-77bca3c6c6ad-150317061327-conversion-gate01/85/Pedersen-2014b-2-320.jpg)
![[25] Rae [14], Mottram [15] and Langen [16]. The model-
ling domain for the climate projection model covers
roughly 12 million km2
in eastern Africa between 28°S
and 5°N and between 16°E and 52°E. Simulations with
such high resolution are computationally very resource
and time consuming; therefore we consider here only
three time-slices of 20 years each: 1980-1999 (representa-
tive for present-day climate) and 2046-2065 and 2080-
2099 (representative for future climate), hereafter denoted
“1990”, “2055” and “2090”, respectively. The underlying
scenario is IPCC SRES A1B [26], which is described by
rapid economic growth, a global population of nine billion
by 2050 and a balanced emphasis on fossil and non-fossil
energy sources. We evaluated temperature, rainfall and
humidity for the annual mean and an average for the
months March, April and May, due to the fact that these
months are important to snail population development in
Zimbabwe [27]. Fourteen so-called bioclimatic variables
[28] were calculated by the use of DIVA GIS (www.diva-
gis.org) following Hijmans et al. [29] and Ramírez and
Bueno-Cabrera [30] where after they were analysed for
collinearity, together with March-April-May averages
of precipitation, temperature, and humidity as well as
elevation and soil-pH. Based on an exclusion criterion
of a collinearity factor of 0.70, variables were excluded
from the final model (Additional file 1a, Additional file 2b,
and Additional file 3c): the variable with most partners
not meeting the criteria were excluded. Average precipita-
tion in the period of March-April-May (MAM) (rr) and
average MAM temperature (t2) were chosen above aver-
age MAM of relative humidity (rh) due to rh being de-
rived from the two former. The remaining variables used
in the model are listed in Table 1.
Model implementation
The modelling software, Maxent [12] was used to predict
snail habitat suitability from snail presence data according
to environment and climatic variables. The output from
Maxent was considered as the probability of snail pres-
ence expressed as a map layer of habitat suitability on a
scale of 0 - 1 for non-suitable and suitable habitat, respect-
ively. The environmental data were loaded into Maxent,
covering an area of 10 by 10 arc degrees, encompass-
ing Zimbabwe and parts of neighbouring countries,
and had a resolution of 0.1 by 0.1 arc degrees. Maxent
was set to sample 10,000 background samples from the
Figure 1 Snail sample sites and occurrence of three snail species: red circle Bulinus globosus, semi-circle Biomphalaria pfeifferi, open
square Lymnaea natalensis, and open circle absences.
Pedersen et al. Parasites & Vectors (2014) 7:536 Page 3 of 12](https://image.slidesharecdn.com/ce1a0938-8c9d-4663-af65-77bca3c6c6ad-150317061327-conversion-gate01/85/Pedersen-2014b-3-320.jpg)
![environmental variables, during fitting of the distribu-
tion model. Collection sites holding one or more speci-
men of a snail species were introduced by the ascribed
coordinates of the collection sites. Sites, from where no
specimens of the modelled species were found, were not
used in the model. The average of 10 replicate model runs
was reported and the model initialisation used random
seeds and 10% of the observations were set aside for
model testing.
All commonly accepted ecological zones in the model-
ling domain were present among the snail observation
data to comply with Maxent’s constraint to not predict
into novel eco-zones [31]. Maxent provides a number of
arithmetic products of the predictors denoted as “feature
classes” which, in this study, were limited to “linear” and
“quadratic”, omitting “product”, “threshold”, and “hinge”,
due to the non-intuitive, function of these features, in
terms of snail biology, and due to the non-linear
response of the species to some of the environmental
variables, following the recommendations of Merow
[31]. Area Under the receiver operator characteristic
Curves (AUC) of the test data are reported as an expres-
sion of model performance as suggested by Liu [32], and
is supported by measures of sensitivity and specificity
following recommendations by Hu and Jiang [33]. A
build-in, Jack-knife procedure was used to quantify the
explanatory power of each environmental variable.
The 1990 climate projection data were used to fit
the snail habitat suitability prediction model and subse-
quently parameterised with climate projection data for
2055 and 2090, to produce a climate change impact
prediction.
Results
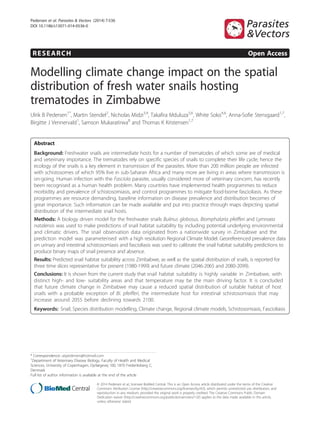
Predicted snail habitat suitability across Zimbabwe for the
three snail species in three different periods are presented
in Figure 2. Results for B. globosus show high suitability in
the highveld for 1990 (Figure 2a), whereas areas to the
southeast and northwest are predicted to be less suitable.
The predictions for 2055 and 2090 (Figure 2b and c) illus-
trate that fewer locations are predicted to be suitable com-
pared to that of 1990, with only few locations of relatively
high suitability outside the eastern highlands of Zimbabwe,
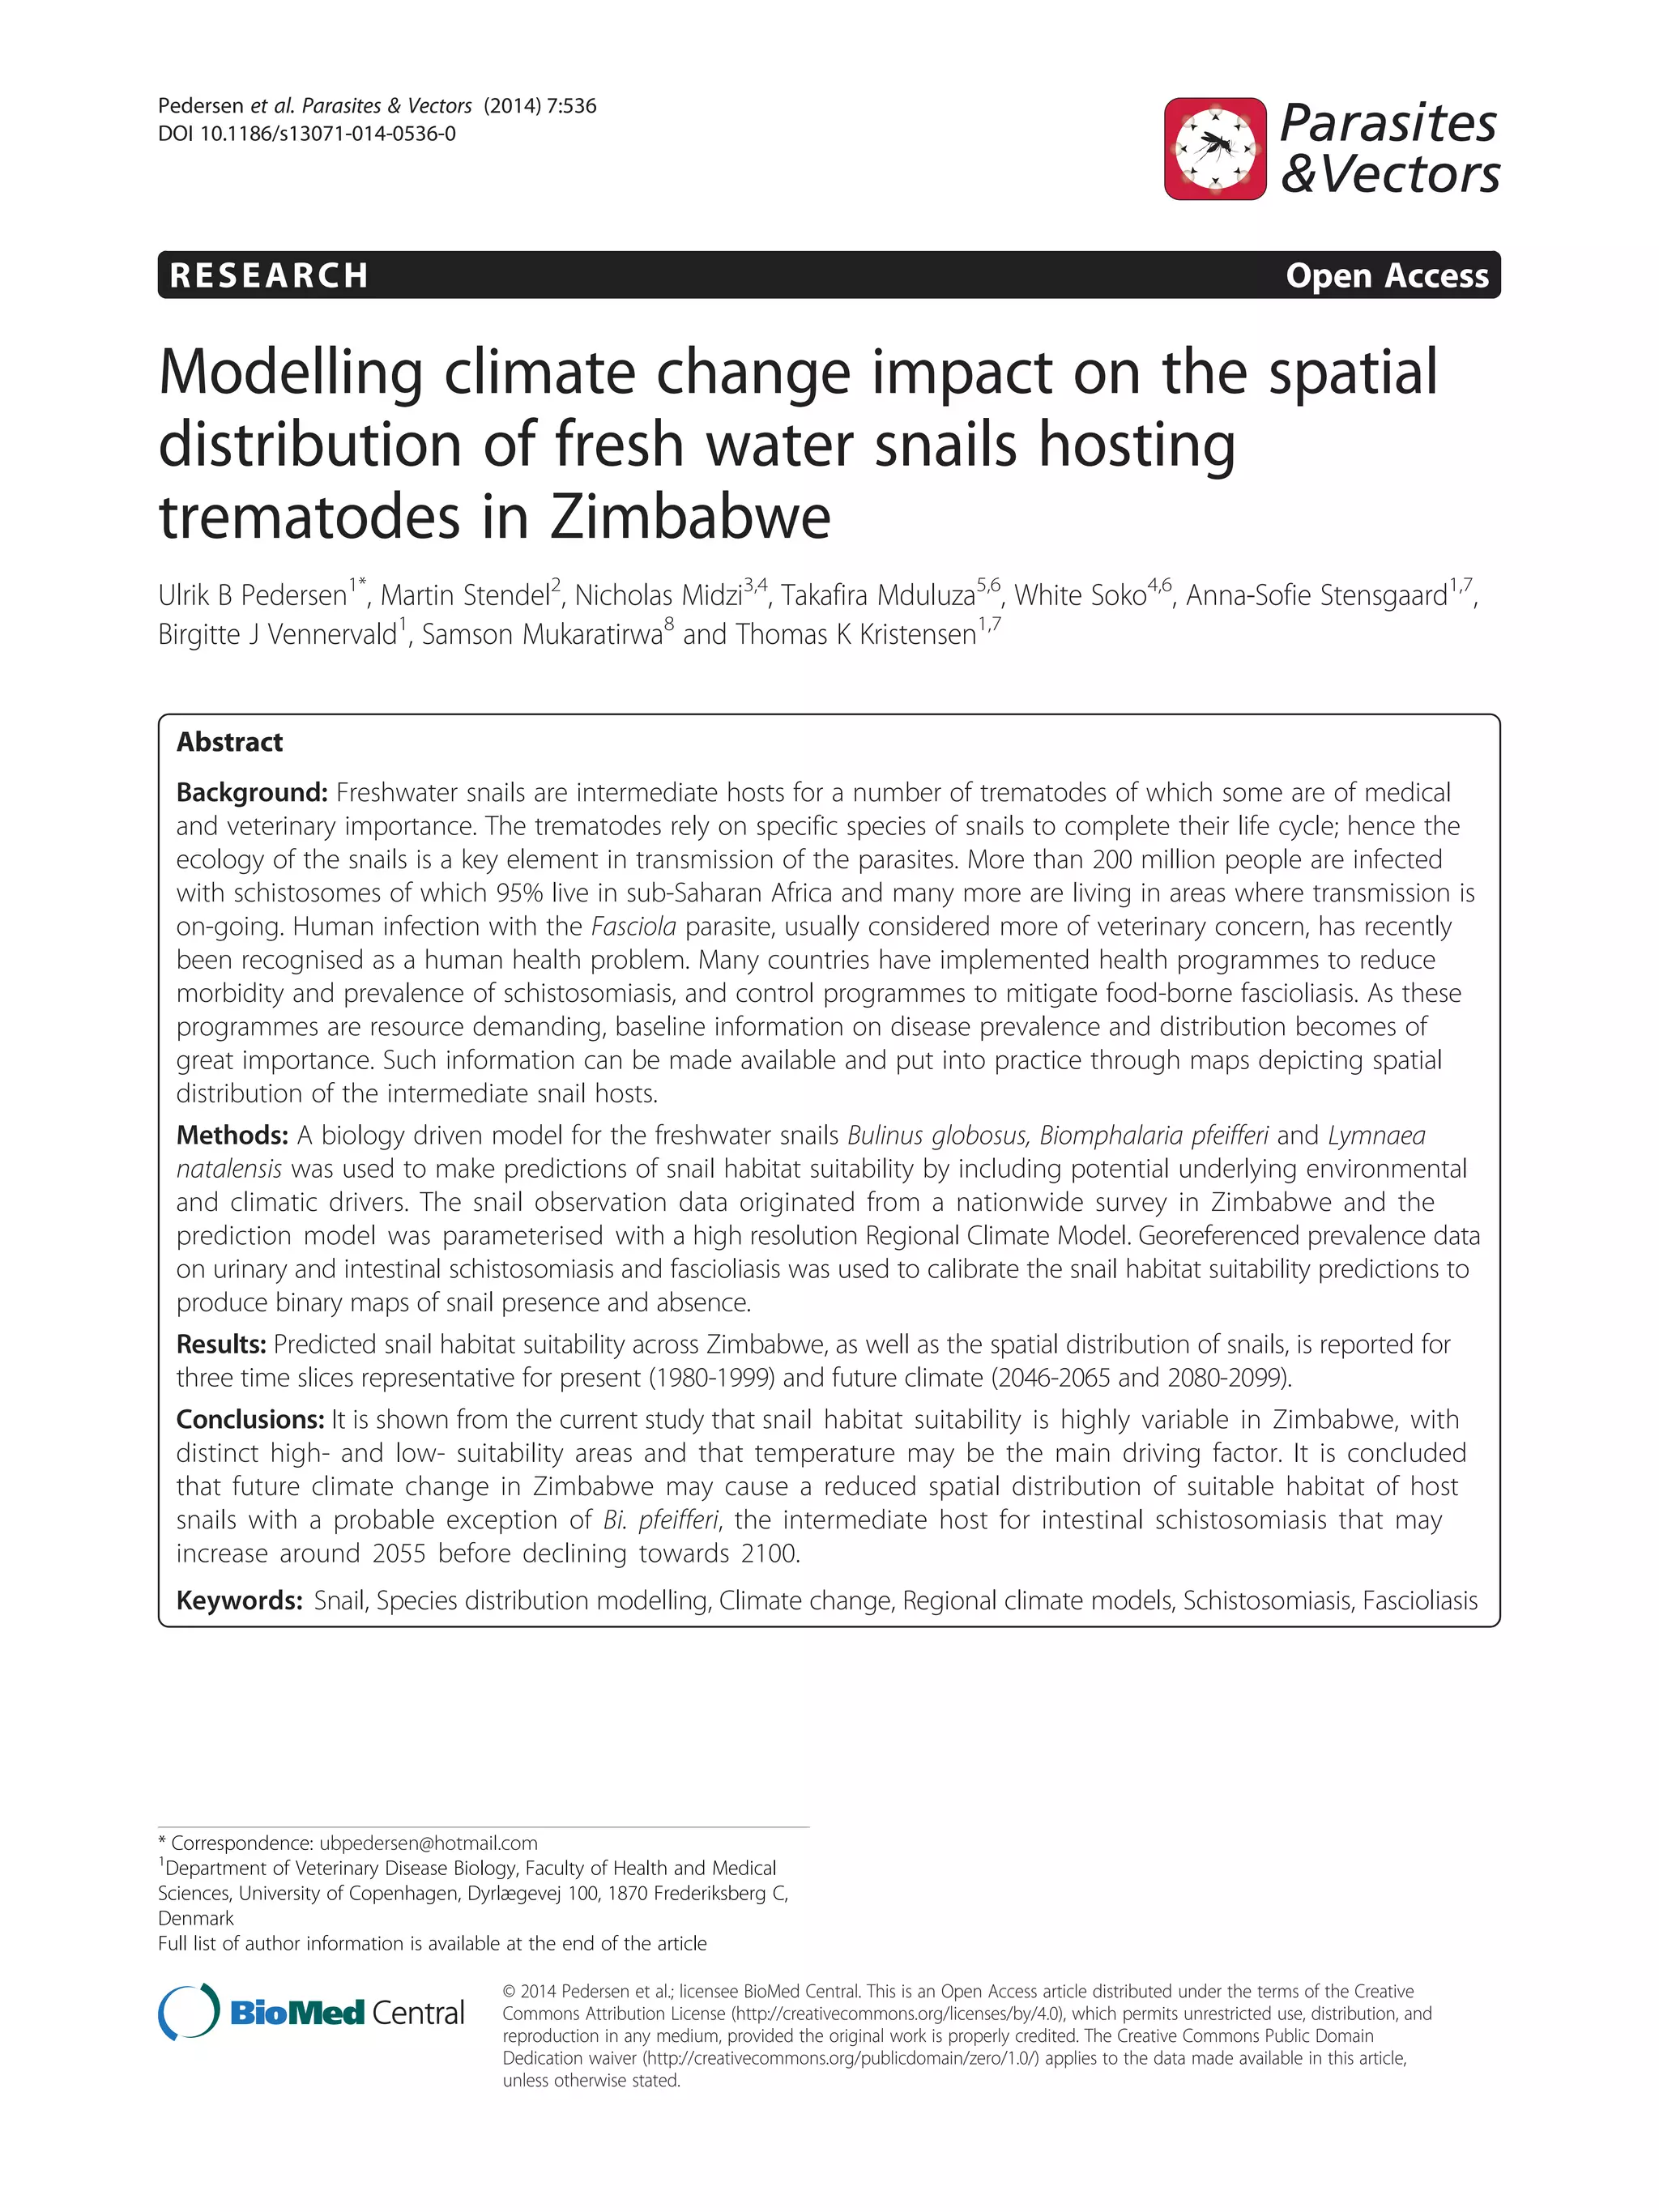
by 2090. The most significant drop in suitability index in
the period from 1990 to 2055 is observed in the central
and southern part of Zimbabwe (Figure 3a), and all parts
of Zimbabwe, including the highveld, is reduced signifi-
cantly between 1990 and 2090 (Figure 3b). Furthermore,
there is a falling trend in habitat suitability in both of
the two interim periods of 1990 to 2055 and 2055 to 2090
(Figure 3a and Figure 3c, respectively).
The prediction of Bi. pfeifferi is depicted in Figure 2d–f.
The highveld and eastern highlands constituted the most
suitable habitat in 1990 with a more distinct gradient be-
tween high- and lowveld compared to that of B. globosus.
All parts of Zimbabwe are predicted to be highly suitable
by 2055 (Figure 2e) forming the basis for increased trans-
mission risk of intestinal schistosomiasis, but with a sig-
nificant reduction toward the end of the century; however,
areas with medium suitability are still present in the
Table 1 Model test statistics
Bulinus globosus Biomphalaria pfeifferi Lymnaea natalensis
Suitability range: 0.00 – 0.81 0.00 – 0.88 0.00 – 0.90
AUC test statistics: 0.737 0.771 0.765
MTSPSLT*: 0.45 0.49 0.43
Sensitivity | specificity: 0.64 | 0.53 0.45 | 0.82 0.48 | 0.77
Variable Variable contribution (%)
Temperature March-April-May 64 49 70
Temperature Seasonality 17 8 13
Precipitation seasonality 4 18 NA
Precipitation of wettest month 11 NA 5
Precipitation of warmest quarter NA NA 4
Precipitation of driest month 2 NA 2
Precipitation of wettest quarter NA 16 NA
Precipitation March, April-May 0 4 5
Temperature of driest quarter NA 3 NA
Precipitation of driest quarter NA 0 NA
pH – soil** 2 3 2
Bold: most contributing variables.
*Maximum training sensitivity plus specificity logistic threshold.
**www.isric.org.
Pedersen et al. Parasites & Vectors (2014) 7:536 Page 4 of 12](https://image.slidesharecdn.com/ce1a0938-8c9d-4663-af65-77bca3c6c6ad-150317061327-conversion-gate01/85/Pedersen-2014b-4-320.jpg)
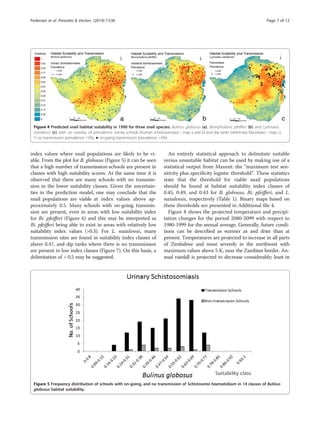
![of 0.64. The ability of the model to predict areas where
snails are absent is fairly good for Bi. pfeifferi and L. nata-
lensis with specificity scores of 0.82, and 0.77, respectively,
whereas the score for B. globosus is low (0.53).
Maxent provides a probability of habitat suitability; al-
though, this does not inform the actual distribution of
snails. Lending information from disease data can help
to identify an approximated index value of habitat suit-
ability that delimits the snail distribution. Raw prevalence
data on schistosomiasis prevalence among school-aged
children from a national survey conducted in 1981
[34], was provided by the National Institute of Health
Research, Zimbabwe. Prevalence of the infection status
was determined using microscopic examination of urine
and faeces samples as described by Taylor and Makura
[34] from randomly selected children at 157 primary
schools representing all regions of Zimbabwe. Fascioliasis
prevalence data in cattle were obtained by microscopy
of faeces sampled at dip tank sites and provided by the
Central Veterinary Laboratory, Zimbabwe. Sampling was
conducted in the period of 1989 to 1993, January-
December, up to 1.747 m.a.s.l. at 197 locations, mainly in
the north-eastern highveld. Overlaying the prevalence data
on the suitability maps, reveals the locations of disease
transmission (here defined as schools or dip tanks with
prevalence above 5%) and the respective suitability index
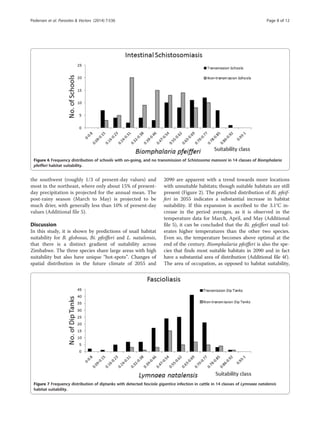
value (Figure 4). Inspecting these prevalence and suitabil-
ity classes on a frequency distribution plot (Figures 5, 6,
and 7) allow visual inspection of infection-status as a func-
tion of suitability and can help to estimate the suitability
Figure 3 Predicted changes in relative habitat suitability index for three species of snails in three time periods (a-i). Blue colours indicate
an increase in habitat suitability, yellow no change, and brown a decrease in suitability.
Pedersen et al. Parasites & Vectors (2014) 7:536 Page 6 of 12](https://image.slidesharecdn.com/ce1a0938-8c9d-4663-af65-77bca3c6c6ad-150317061327-conversion-gate01/85/Pedersen-2014b-6-320.jpg)
![on precipitation (seasonality and precipitation in the wet-
test month).
The AUC statistics indicate an “acceptable” model per-
formance [35] but low sensitivity for Bi. pfeifferi and
L. natalensis, implying that the model is less capable of
predicting where these species are present, whereas more
confidence can be put into the model’s ability to predict
where snails are not likely to be found. For B. globosus the
situation is the opposite with better performance at pre-
dicting true positives as opposed to true negatives.
The quality of input data greatly influences the perform-
ance of any model. Snail occurrence data used in this
study, are “plenty” for Maxent to characterise the environ-
ment at sampling sites [36]. Sampling bias greatly influ-
ences reliability of model output. We do not have control
of sampling procedure but know that many types of habi-
tats have been sampled e.g. ponds, rivers etc. and in most
parts of Zimbabwe. Additionally, we find many absence
observations in the original dataset, suggesting that collec-
tion sites were not chosen after where specific species
were expected to be present. In fact we see that sampling
success rates are similar to that of the authors’ own study
[17] where special attention was paid to sampling bias. En-
vironmental data are of satisfactory resolution though
more variables like e.g. NDVI and Growing Degree Days
may have contributed to model reliability.
Compared to other combinations of GCMs and RCMs,
the present study yields very dry future climate, even
though the precipitation changes in the driving GCM
(not shown) are much smaller. This somewhat counter-
intuitive behaviour can be explained with changes in soil
moisture. In the HIRHAM RCM, soil moisture dries fas-
ter than in the GCM, thus leading to a further increase
in temperature and less precipitation. There are some
indications [37,38] for a decrease of precipitation during
March-May, but the overall model spread is rather large
and the mechanisms are not well understood [39].
The climate model data used in this study is down-
scaled from relatively low-resolution into high resolution
regional fields, but the regional model can evolve freely
apart from the forcing data moving into or out of the
RCM domain from the driving model. Since the driving
data is from a model rather than observations, individual
events cannot be compared directly; however, in a statis-
tical sense such a comparison is possible. Information
on in-year weather extremes could therefore have been
taken into account in this study but due to the data imple-
mentation, using 20 year averages, such weather events
were not present in the data. Extreme events, such as
floods, dry spells, and heat waves would most likely cause
an even further reduction in the snail habitat suitability,
as snails cannot exist in water at higher velocities than
0.3 m/s [40] and they can only survive dry-spells for a lim-
ited period of time [41,42].
The temperature is expressed as ambient temperature at
2 m above ground as opposed to temperature in the habi-
tat water. The correlation between ambient- and water
temperature may change between locations and the rela-
tionship may change in changed climate conditions [43].
Describing alkalinity (pH) of habitat water and its rela-
tion to snail biology has proved complicated. Diurnal
variation, of photosynthesis in the water, faecal contam-
ination, and upstream soil pH influence the snails in a
non-straightforward manner [40,44,45] but the models
still include the pH dataset as a predictor. Furthermore,
the pH dataset used here [46] is based on pH in soil
water and it is possible that geophysical characteristics
are the underlying driver.
Some flaws in the data and modelling implementation
can compromise conclusions on habitat suitability, distri-
bution and impact of climate change. Global Positioning
Systems (GPS) were not readily accessible in 1988 where-
fore sampling locations were simply designated the arith-
metic centre of a predefined grid of 26.5 km by 26.5 km.
The consequence is that the collection sites and the envir-
onmental variables (10 km by 10 km resolution) are misa-
ligned at some locations. There is a number of reasons
why this is not considered to conflict with the conclusions
of the modelling results: i) the variables most often have
similar values in neighbouring cells, ii) variables are aver-
ages taken over a 20 year period, iii) and in some cases, av-
erages over three months.
Conclusions
The presence of intermediate host snails is pivotal for
disease transmission but at the same time it is not the
only element in the parasite life cycle. Climatic variables
and the geophysical environment also influence directly
on the schistosome and Fasciola parasites’ free living
life stages i.e. egg, miracidia, cercaria, and metacercaria
(Fasciola). Thus, when discussing snail habitat suitabil-
ity as predictor for schistosomiasis and fascioliasis,
modelling of cercaria survival could be included to give
an advantage such as exemplified by Stensgaard [47] and
Valencia-Lopez [48], where development rate of the cer-
caria in relation to temperature was included.
In the present study the models based on snail pres-
ence data and climatic/environmental input data for two
different time periods suggested that snail populations
will experience less favourable conditions in Zimbabwe in
the future, except for Bi. pfeifferi in mid-century. Some
populations within Zimbabwe are already at the edge of
their range of occupation, wherefore some populations are
likely to disappear and consequently parts of Zimbabwe
could become free of transmission of schistosomiasis and
fascioliasis, though it may be speculated that a series of
more favourable years in a generally unfavourable climate
period can lead to re-establishment of snail
Pedersen et al. Parasites & Vectors (2014) 7:536 Page 10 of 12](https://image.slidesharecdn.com/ce1a0938-8c9d-4663-af65-77bca3c6c6ad-150317061327-conversion-gate01/85/Pedersen-2014b-10-320.jpg)
![population and subsequently transmission. An important
factor would be the rate of reestablishment of snail popu-
lations, and parasite re-introduction. Snails are known to
spread fast by eggs being transported by aquatic birds on
feet or in plumage [49-52] and parasites can be introduced
rapidly by infected human and animals. C Appleton and
H Madsen [53] describe the re-emergence of schistosom-
iasis in a community in South Africa where it is indicated
that the reintroduction correlated with climate fluctua-
tions. In-depth studies on re-emergence of disease, includ-
ing timelines and climate, based on the biological studies
of snails and parasites and change in the environment can
provide knowledge on the challenges in the future.
Finally, climate change may drive schistosomiasis and
fascioliasis towards elimination in Zimbabwe in the far
future of 2090, although other factors such as land-use
changes, transmission awareness and interventions may
play an important role on the distribution and may in
fact overrule that of climate.
Additional files
Additional file 1: Collinearity analysis for environmental and
climatic factors for Bulinus globosus. rr = average precipitation in
the period March-April-May. t2 = average temperature in the period
March-April-May. rh = average relative humidity in the period March-April-May.
Elevation = elevation. pH = pH. BIO1 = Annual Mean Temperature.
BIO4 = Temperature Seasonality (standard deviation *100). BIO8 = Mean
Temperature of Wettest Quarter. BIO9 = Mean Temperature of Driest
Quarter. BIO10 = Mean Temperature of Warmest Quarter. BIO11 = Mean
Temperature of Coldest Quarter. BIO12 = Annual Precipitation. BIO13 =
Precipitation of Wettest Month. BIO14 = Precipitation of Driest Month.
BIO15 = Precipitation Seasonality (Coefficient of Variation). BIO16 = Precipitation
of Wettest Quarter. BIO17 = Precipitation of Driest Quarter. BIO18 =
Precipitation of Warmest Quarter. BIO19 = Precipitation of Coldest Quarter.
Additional file 2: Collinearity analysis for environmental and
climatic factors for Biomphalaria pfeifferi. rr = average precipitation
in the period March-April-May. t2 = average temperature in the
period March-April-May. rh = average relative humidity in the period
March-April-May. Elevation = elevation. pH = pH. BIO1 = Annual Mean
Temperature. BIO4 = Temperature Seasonality (standard deviation *100).
BIO8 = Mean Temperature of Wettest Quarter. BIO9 = Mean Temperature
of Driest Quarter. BIO10 = Mean Temperature of Warmest Quarter. BIO11 =
Mean Temperature of Coldest Quarter. BIO12 = Annual Precipitation.
BIO13 = Precipitation of Wettest Month. BIO14 = Precipitation of Driest
Month. BIO15 = Precipitation Seasonality (Coefficient of Variation).
BIO16 = Precipitation of Wettest Quarter. BIO17 = Precipitation of Driest
Quarter. BIO18 = Precipitation of Warmest Quarter. BIO19 = Precipitation of
Coldest Quarter.
Additional file 3: Collinearity analysis for environmental and
climatic factors for Lymnaea natalensis. rr = average precipitation in
the period March-April-May. t2 = average temperature in the period
March-April-May. rh = average relative humidity in the period March-April-May.
Elevation = elevation. pH = pH. BIO1 = Annual Mean Temperature.
BIO4 = Temperature Seasonality (standard deviation *100). BIO8 = Mean
Temperature of Wettest Quarter. BIO9 = Mean Temperature of Driest
Quarter. BIO10 = Mean Temperature of Warmest Quarter. BIO11 = Mean
Temperature of Coldest Quarter. BIO12 = Annual Precipitation.
BIO13 = Precipitation of Wettest Month. BIO14 = Precipitation of Driest
Month. BIO15 = Precipitation Seasonality (Coefficient of Variation).
BIO16 = Precipitation of Wettest Quarter. BIO17 = Precipitation of Driest
Quarter. BIO18 = Precipitation of Warmest Quarter. BIO19 = Precipitation of
Coldest Quarter.
Additional file 4: Figure 2a-i. Binary maps of presence (red) and
absence (blue) for three snail species at three time periods.
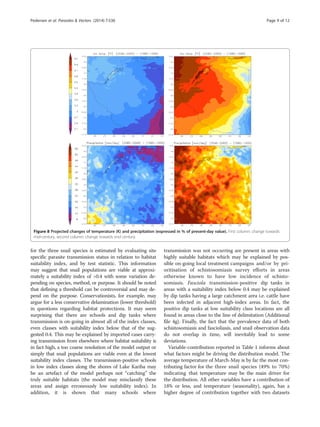
Additional file 5: Precipitation and temperature (March-April-May
averages) for three time-slices: 1980-1999, 2046-2065, and 2080-2099.
Competing interests
The authors declare that they have no competing interests.
Authors’ contribution
UP and TK conceived and designed the study. MS performed climate
simulations with the HIRHAM5 climate model and provided present-day
and future projected climate input data. NM, TM, and WS facilitated
implementation of human prevalence data. AS contributed to statistical
analyses and drafting of manuscript. BV helped drafting the manuscript
especially health related sections and SM contributed to malacological
sections. All authors read and approved the final manuscript.
Acknowledgements
National Institute of Health Research, Ministry of Health and Child Care,
Harare, Zimbabwe is acknowledged for kindly providing schistosomiasis
prevalence data.
Author details
1
Department of Veterinary Disease Biology, Faculty of Health and Medical
Sciences, University of Copenhagen, Dyrlægevej 100, 1870 Frederiksberg C,
Denmark. 2
Danish Meteorological Institute, Copenhagen, Denmark.
3
Department of Medical Microbiology, University of Zimbabwe, College of
Health Sciences, Harare, Zimbabwe. 4
National Institute of Health Research,
Ministry of Health and Child Care, Causeway, Harare, Zimbabwe.
5
Department of Biochemistry, University of Zimbabwe, Harare, Zimbabwe.
6
School of Laboratory Medicine and Medical Sciences, University of
KwaZulu-Natal, KwaZulu-Natal, South Africa. 7
Center for Macroecology,
Evolution and Climate, Natural History Museum of Denmark, University of
Copenhagen, Copenhagen, Denmark. 8
School of Life Sciences, University of
KwaZulu-Natal, KwaZulu-Natal, South Africa.
Received: 6 June 2014 Accepted: 11 November 2014
References
1. Fürst T, Keiser J, Utzinger J: Global burden of human food-borne
trematodiasis: a systematic review and meta-analysis. Lancet Infect Dis
2012, 12(3):210–221.
2. Chitsulo L, Engels D, Montresor A, Savioli L: The global status of
schistosomiasis and its control. Acta Trop 2000, 77(1):41–51.
3. Midzi N, Mduluza T, Chimbari MJ, Tshuma C, Charimari L, Mhlanga G,
Manangazira P, Munyati SM, Phiri I, Mutambu SL: Distribution of
Schistosomiasis and Soil Transmitted Helminthiasis in Zimbabwe:
Towards a National Plan of Action for Control and Elimination.
PLoS Negl Trop Dis 2014, 8(8):e3014.
4. Tatem A, Adamo S, Bharti N, Burgert C, Castro M, Dorelien A, Fink G, Linard C,
John M, Montana L, Montgomery M, Nelson A, Noor A, Pindolia D, Yetman G,
Balk D: Mapping populations at risk: improving spatial demographic data
for infectious disease modeling and metric derivation. Population Health
Metrics 2012, 10(1):8.
5. Keiser J, Utzinger J: Emerging foodborne trematodiasis. Emerg Infect Dis
2005, 11(10):1507–1514.
6. Mas-Coma S: Human fascioliasis: Epidemiological patterns in human
endemic areas of South America, Africa and Asia. Southeast Asian J Trop
Med Public Health 2004, 35(1 (suppl)):1–11.
7. Hopkins DR: Homing in on helminths. Am J Trop Med Hyg 1992,
46(6):626–634.
8. Rim HJ, Farag HF, Sornmani S, Cross JH: Food-borne trematodes: Ignored
or emerging? Parasitol Today 1994, 10(6):207–209.
9. Goldsmid JM: Studies on intestinal helminths in African patients at
Harari Central Hospital, Rhodesia. Trans R Soc Trop Med Hyg 1968,
62(5):619–629.
10. Hammond JA: Human infection with the liver fluke Fasciola gigantica.
Trans R Soc Trop Med Hyg 1974, 68(3):253–254.
Pedersen et al. Parasites & Vectors (2014) 7:536 Page 11 of 12](https://image.slidesharecdn.com/ce1a0938-8c9d-4663-af65-77bca3c6c6ad-150317061327-conversion-gate01/85/Pedersen-2014b-11-320.jpg)