1. BIO2422 Avian biodiversity report
March 13, 2014
Investigating the effects of urbanisation on
avian biodiversity in South West England
Introduction
It istraditionallythoughtamongecologiststhat
urbanisationwillleadtoadecrease inbiodiversity,
due to perturbationssuchashabitatloss,
fragmentation,pollution,invasive speciesand
disruptionof nutrientcycles(Batten1972, Hutto
1988, Pautassoetal 2011, Blair 1996). Here,we
investigateavianspatial andtemporal diversityby
comparingresultsfrom surveystakenatthe Penryn
and Streathamcampusesof the Universityof Exeter in
2013 and 2014.
Methods
Four surveyswere undertakenbetween2013 and
2014 at the PenrynandStreathamcampusesof the
University of Exeter.Small groupsof students took
transectwalksaroundcampus of approximately1
hour andrecordedeachindividual birdtheysaw.Each
grouptook the same route around campusbut were
spacedabout10 minutesapart, andwere therefore
treatedas semi-independentreplicates. The groups
were splitintooddandeven-numberedgroups,which
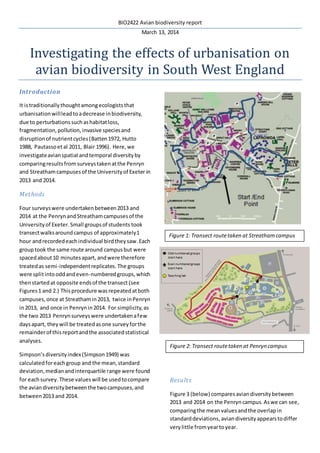
thenstartedat opposite endsof the transect (see
Figures1 and 2.) Thisprocedure wasrepeatedatboth
campuses,once at Streathamin2013, twice inPenryn
in2013, and once in Penrynin2014. For simplicity,as
the two 2013 Penrynsurveyswere undertakenafew
daysapart, theywill be treatedasone surveyforthe
remainderof thisreportandthe associatedstatistical
analyses.
Simpson’sdiversityindex(Simpson1949) was
calculatedforeachgroup and the mean,standard
deviation,medianandinterquartile range were found
for eachsurvey. These valueswill be usedtocompare
the aviandiversitybetweenthe twocampuses,and
between2013 and 2014.
Results
Figure 3 (below) comparesaviandiversitybetween
2013 and 2014 on the Penryncampus.Aswe can see,
comparingthe meanvaluesandthe overlapin
standarddeviations, aviandiversityappearstodiffer
verylittle fromyeartoyear.
Figure 1: Transect routetaken at Streathamcampus
Figure 2: Transect routetaken at Penryn campus
2. BIO2422 Avian biodiversity report
March 13, 2014
Figure 4 (above) comparesaviandiversitybetween
the two locations.Inorderto make a fairer
comparison,onlythe surveysfrom2013 were
included. (Asyoucansee fromTable 1, the valuesare
verysimilarandso thisadjustmentmade little
difference tothe final graph.) Aswiththe first
comparison,there islittle significant difference
betweenaviandiversityonthe twocampuses. There
isalso extensive overlapbetweenstandarddeviations
whichisfurtherevidence againstasignificant
difference betweenthe twocampuses. The meanand
medianare alsoverysimilarandthe standard
deviationand interquartile range are quite small
whichsuggeststhatthe data is evenlydistributed
aboutthe mean.
Survey Mean D value Standard
deviation
MedianD value Interquartile
range
Streatham 2013 0.852 0.032 0.855 0.033
Penryn2013 0.861 0.034 0.861 0.062
Penryn2014 0.841 0.053 0.843 0.034
Figure 3: Comparison of
avian diversity between
2013 and 2014. The mean
valuesforD (Simpson’s
diversity index) are plotted in
blue,along with the
standard deviation,while
the median and interquartile
rangeare plotted in red.
Only the surveysfromthe
Penryn campuswereused in
this comparison.
Table 1: The mean, standard deviation, median and interquartile range for the three surveys.
Figure 4: Comparison of
avian diversity between the
two study sites. The mean
valuesforD (Simpson’s
diversity index) are plotted in
blue,along with the
standard deviation,while
the median and interquartile
rangeare plotted in red.
Only the surveysfrom2013
were used in this
comparison.
3. BIO2422 Avian biodiversity report
March 13, 2014
Discussion
There wasverylittle noticeable change indiversity
between2013 and 2014 on the Penryncampus.As
thisissuch a short time-frame,thisisnotsurprising.
However,the speciescompositionwasnotanalysed,
and so,eventhoughthe diversityindex isthe same,a
differentcommunitycompositionmayexistbetween
years.
Contraryto what we expected, the diversityindices
betweenthe two locations weremarkedlysimilar;but
there maybe manyreasonsforthis. Firstly,there
were manyconfoundingvariablesand issueswiththe
studythat couldhave affectedthe results. One of the
biggestproblemswiththisstudywasthatof
pseudoreplication –we treatedourdata as
independenteventhoughtheywereunlikelytobe. It
ispossible thatdifferentgroups sawthe same birds
and evenwithingroupsthe same birds mayhave
beenrecordedmultiple times(especiallylarge birds
such as seagulls.)Similarly,noteverybirdhadan
equal chance of beingseen andrecorded.Largeror
more conspicuousbirdssuchas gulls,corvidsand
waterfowl were more likelytobe seenthansmaller
passerines.There were alsodifferencesineffortand
accuracy of sampling.Some studentswere betterat
speciesidentificationthanothers,andsome spent
more time accuratelyidentifyingindividual birds,
whereasothersspentmore time sampling. Comparing
the two maps(Figures1 & 2) it alsoappearsthat the
Streathamtransectwas muchlongerthanin Penryn.
Thiscouldalso leadtoan increasedsamplingarea
(andtherefore effort)anddifferencesinthe diversity
of habitatssampled. There wasalsolittle information
on the time of day, season,andweatherconditionsof
each surveyandso itis possible thatthese were also
confoundingvariablesthatwere notadequately
analysed.Anotherpossible factoristhe locationof
the two studysites;ExeterandPenrynmaynaturally
differinaviandiversity.However,aswe cansee in
Figure 5, the two areashave similar,lowlevelsof
speciesrichness(here usedasasurrogate for
diversity.)
Anothermain issue withthe studyisthe basic
assumptionthatStreathamcampusisan ‘urban’
environmentandthatPenrynis‘rural’.Infact,
Streathamcampusis situatedjustoutside of the main
city,Exeter,andisrenownedforitsgardensand
grounds. It isa registeredbotanical garden,containsa
varietyof differenthabitats(ExeterUniversity(a))and
isactivelymanagedtoencourage andmaintain
biodiversity (ExeterUniversity(b)).Therefore,itis
relativelyunrepresentative of anEnglishurban
environment.Penryncampusisalsonotentirelyrural;
the Universityitself isbuiltonthe campusandthe
groundsare alsoactivelymanagedandplantedwith
manyexoticspeciessuchasrhododendronsthatdo
not accuratelyrepresentarural Englishhabitat.
Streathamcampusalsoboasts a large varietyof exotic
plants;andthese affectbiodiversity. Millsetal found
that the densityof native birdspeciesandnative
vegetationwere positivelycorrelated,andexoticbird
densitieswere correlatedwiththatof exoticplants
(Millsetal,1989, as citedbyBlair 1996). Therefore,it
ispossible thatthe highabundance of non-native
speciesof plantsonbothcampusesaffectedthe
compositionof species,butnotnecessarilythe
diversity.A furtherstudywouldbe requiredanalysing
the compositionof birdspeciesonboth sitestosee if
thisistrue. Bothcampusescouldperhapsmore
accuratelybe describedas‘suburban’or‘urbanized.’
Figure 5: Species
richnessof birdsin
Britain (where
darkershades
indicate higher
richness – Williams
et al 1996)
4. BIO2422 Avian biodiversity report
March 13, 2014
If this isthe case; the levelsof highbiodiversityfound
at both campusesmaybe betterexplained.
High levels of avian diversity in a
suburban environment
Thoughthe original thinkingwasthaturbanisation
wouldhave negative effectsonbiodiversity, more
recentstudieshave foundthatintermediatelevelsof
urbanisationcanactuallyhave positiveeffectson
speciesdiversity,richness&abundance (Blair1996,
Bock etal 2008, Pautassoetal 2011). For example,
Bock etal (2008) foundthat inopen,arid
environments suburbandevelopmentscanact as an
‘oasis’forbirdlife,providingwater,foodandnesting
sitesinan otherwise barrenenvironment.Itisunlikely
that birdsinBritainwouldsufferfromalack of water,
howeverthe provisionof resourcesinthe formof bird
feedersandnestboxesinsuburbangardensare likely
to benefitbirds. The general increaseinenergy
availabilityandheterogeneityinurbanisedhabitats
may alsoallowthe co-existenceof more species
(Pautassoetal 2011). Blairalsonotesthat just
because there isa highabundance of a certainspecies
at a site doesnot necessarilymeanthatitisa self-
sustainingpopulation,anditispossible thatthismay
be the case witheitherof ourstudysites(Blair1996).
He alsosuggeststhe ideathata moderate level of
disturbance (suchasthose seeninmanagedsuburban
areas suchas our studysites) canincrease species
diversitybyrestrictingthe populationsize of the
dominantspeciesandallowingthe rarer,less
competitivespeciestoco-exist(Blair1996).
Recommendations for amendments and
future studies
Pseudoreplicationhasbeenhighlightedhere asone of
the maindownfallsof thisstudy.Toreduce or avoid
thisproblem,one couldmake several different
amendmentstothe study.If the groupshad stayedat
individualsitesandsampled,insteadof all groups
samplingalongthe whole transectsimultaneously,
thiswouldreduce the likelihoodof twogroupsseeing
the same birds(as well asreducingthe disturbance to
the birds.) However,withthismethodthe problemof
differencesinsamplingeffortandabilitywouldstill
persistsoperhapsa studydesigninwhichone ortwo
‘experts’samplingwouldproduce more reliableand
accurate data. Anyfuture studywouldalsohave to
ensure thatthe area or transect lengthsampledwas
equal onboth sites,thatthe time of day andyear
were the same,andthat the sitesmore suitablyfitted
the categoriesof ‘rural’and‘urban.’
A wayto achieve this,andto reduce the confounding
variablesbetweensitessuchasclimate wouldbe to
analyse differentlevelsof urbanisationinthe same
area,eitherona temporal (before andafter
urbanisation) orspatial scale(gradientanalysisasused
inBlair,1996). This has the addedbenefitof aneasier
comparisonbetweenstudysites.
More objective meansof samplingwouldalsobe
beneficial byincreasingaccuracyand reducingbias.
Thiscouldbe achievedbymethodssuchasthe use of
camera traps,mist-nettingornest-box analysis.
However,these methodshave the limitationof only
beingapplicabletocertaingroupsor speciesof birds
(e.g.passerines.) Although,thesecould perhapsbe
usedas a surrogate for total birddiversity. A more
objective wayof defining‘rural’and‘urban’
environmentsshouldalsobe used,suchasmeasuring
concrete coveror vegetation.These measureswould
alsomake the study mucheasiertoreplicate (Blair,
1996).
A future studymayalsoconsidermeasuringsome
otherinterestingvariables,suchasthe levelsof
speciesrarity,endemismorinvasiveness withinand
betweenstudysitesasthese cancontribute towardsa
site’sconservationvalue.A broaderanalysisof
populationswouldalsobe useful tosee if theyare
self-sustainingandif thisdiffersbetweensites andif
the productivity(e.g. reproductive rates) differ(Blair
1996).
References
Batten,L. A. (1972). Breedingbirdspeciesdiversityin
relationtoincreasingurbanisation. Bird Study,19(3),
157-166.
Blair,R. B. (1996). Landuse andavianspeciesdiversity
alongan urban gradient. Ecologicalapplications,6(2),
506-519.
5. BIO2422 Avian biodiversity report
March 13, 2014
Bock, C.E., Jones,Z.F., & Bock, J.H. (2008). The oasis
effect:response of birdstoexurbandevelopmentina
southwesternsavanna. EcologicalApplications,18(5),
1093-1106.
ExeterUniversity(a) “StreathamCampus”[Online]
Available:
http://www.exeter.ac.uk/visit/campuses/streatham/
(11/03/2014)
ExeterUniversity(b) “Biodiversity”[Online] Available:
http://www.exeter.ac.uk/visit/campuses/gardens/bio
diversity/#d.en.136587 (11/03/2014)
Hutto,R. L. (1988). Is tropical deforestation
responsible forthe reporteddeclinesinneotropical
migrantpopulations. American Birds,42(3),375-379.
Pautasso,M., Böhning‐Gaese,K.,Clergeau,P.,Cueto,
V.R., Dinetti,M.,Fernández‐Juricic,E., Kaisanlahti‐
Jokimäki,M.L. & Cantarello,E.(2011). Global
macroecologyof birdassemblagesinurbanizedand
semi‐natural ecosystems. GlobalEcology and
Biogeography,20(3),426-436.
Simpson,E.H. (1949). Measurementof diversity.
Nature.
Williams,P.,Gibbons,D.,Margules,C.,Rebelo,A.,
Humphries,C.,&Pressey,R.(1996). A comparisonof
richnesshotspots,rarityhotspots,and
complementaryareasforconservingdiversityof
Britishbirds. ConservationBiology,10(1),155-174.