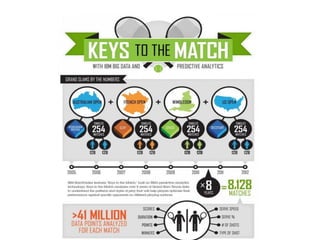
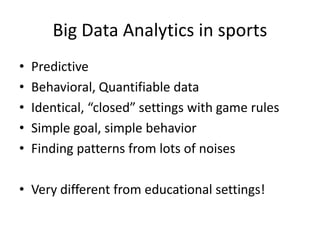
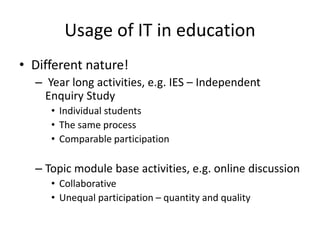
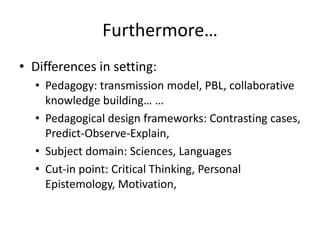
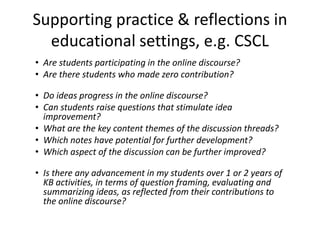
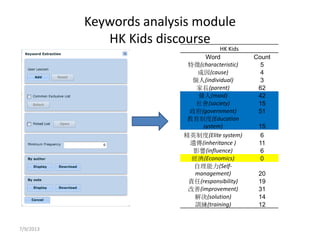
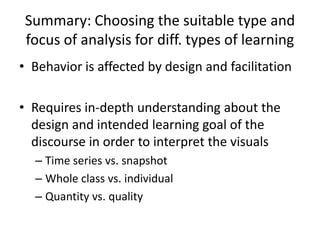
Visualization and Data Presentation
of Pedagogy, Learning Process &
Outcome
Johnny Yuen
BIG
DATA
The IBM SLAMTRACKER
Big Data Analytics in sports
• Predictive
• Behavioral, Quantifiable data
• Identical, “closed” settings with game rules
• Simple goal, simple behavior
• Finding patterns from lots of noises
• Very different from educational settings!
Usage of IT in education
• Different nature!
– Year long activities, e.g. IES – Independent
Enquiry Study
• Individual students
• The same process
• Comparable participation
– Topic module base activities, e.g. online discussion
• Collaborative
• Unequal participation – quantity and quality
Furthermore…
• Differences in setting:
• Pedagogy: transmission model, PBL, collaborative
knowledge building… …
• Pedagogical design frameworks: Contrasting cases,
Predict-Observe-Explain,
• Subject domain: Sciences, Languages
• Cut-in point: Critical Thinking, Personal
Epistemology, Motivation,
Supporting practice & reflections in
educational settings, e.g. CSCL
• Are students participating in the online discourse?
• Are there students who made zero contribution?
• Do ideas progress in the online discourse?
• Can students raise questions that stimulate idea
improvement?
• What are the key content themes of the discussion threads?
• Which notes have potential for further development?
• Which aspect of the discussion can be further improved?
• Is there any advancement in my students over 1 or 2 years of
KB activities, in terms of question framing, evaluating and
summarizing ideas, as reflected from their contributions to
the online discourse?
COLODA
18 Feb 2012
Successful Pedagogies for Inquiry &
Knowledge Building

Collaborative Analysis Project

  Discussion data from any discussion
platform in XML format
Individual
Participatory
Statistics
Keywords
Analysis
Researcher codings &
further analyses
Threads
Analysis
Social
Networks


Downloadable as MS Excel (.xls) format for charts
or works with other student data
Collaborators
Outputs can be organized into diff. levels…
18 Feb 2012
Successful Pedagogies for Inquiry &
Knowledge Building
: Individual students
: notes
: discussion threads
: discussion views
: date or week
Individual participatory statistics
18 Feb 2012
Successful Pedagogies for Inquiry &
Knowledge Building
Number of Scaffolds UsedNumber of Notes Created
Percentage of notes read Percentage of Notes LinkedNumber of Revisions
Social Network Analysis
18 Feb 2012
Successful Pedagogies for Inquiry &
Knowledge Building
Year 1
Year 2
Year 3
Threads analysis module:
7/9/2013
0
0.5
1
1.5
2
2.5
3
Year 1 Year 2
Depthofdiscussionthread
6.5
7
7.5
Year 1 Year 2Numberofnotes
Average Number of Notes per Thread
Average Depth of Discussion Thread
Examples of question types
• Attribute
– What is the size of the smallest whale?
– Where is the notice?
• Definition
– What is energy crisis?
– What does global warming refer to?
• Verification
– Is it safe to drink the water only through looking at it?
– Is carbon dioxide toxic and harmful?
Examples of question types
• Procedure
– How to make a water filter?
• Reason
– Why do water become brown color?
– Why do we need to save water?
• Mechanism
– How can we protect these animals?
– How do planktons give birth to the next
generation?
Researcher Coding
Types of questions raised in the discourse
18 Feb 2012
Successful Pedagogies for Inquiry &
Knowledge Building
Keywords analysis module
HK Kids discourse
HK Kids
Word Count
特徵(characteristic) 5
成因(cause) 4
個人(individual) 3
家長(parent) 62
傭人(maid) 42
社會(society) 15
政府(government) 51
教育制度(Education
system) 15
精英制度(Elite system) 6
遺傳(inheritance ) 11
影響(influence) 6
經濟(Economics) 0
自理能力(Self-
management) 20
責任(responsibility) 19
改善(improvement) 31
解決(solution) 14
訓練(training) 12
7/9/2013
Summary: Choosing the suitable type and
focus of analysis for diff. types of learning
• Behavior is affected by design and facilitation
• Requires in-depth understanding about the
design and intended learning goal of the
discourse in order to interpret the visuals
– Time series vs. snapshot
– Whole class vs. individual
– Quantity vs. quality

Visualization and Data Presentation of Pedagogy, Learning Process & Outcome

  • 1.
    Visualization and DataPresentation of Pedagogy, Learning Process & Outcome Johnny Yuen
  • 2.
  • 3.
  • 5.
    Big Data Analyticsin sports • Predictive • Behavioral, Quantifiable data • Identical, “closed” settings with game rules • Simple goal, simple behavior • Finding patterns from lots of noises • Very different from educational settings!
  • 6.
    Usage of ITin education • Different nature! – Year long activities, e.g. IES – Independent Enquiry Study • Individual students • The same process • Comparable participation – Topic module base activities, e.g. online discussion • Collaborative • Unequal participation – quantity and quality
  • 7.
    Furthermore… • Differences insetting: • Pedagogy: transmission model, PBL, collaborative knowledge building… … • Pedagogical design frameworks: Contrasting cases, Predict-Observe-Explain, • Subject domain: Sciences, Languages • Cut-in point: Critical Thinking, Personal Epistemology, Motivation,
  • 8.
    Supporting practice &reflections in educational settings, e.g. CSCL • Are students participating in the online discourse? • Are there students who made zero contribution? • Do ideas progress in the online discourse? • Can students raise questions that stimulate idea improvement? • What are the key content themes of the discussion threads? • Which notes have potential for further development? • Which aspect of the discussion can be further improved? • Is there any advancement in my students over 1 or 2 years of KB activities, in terms of question framing, evaluating and summarizing ideas, as reflected from their contributions to the online discourse?
  • 9.
    COLODA 18 Feb 2012 SuccessfulPedagogies for Inquiry & Knowledge Building  Collaborative Analysis Project    Discussion data from any discussion platform in XML format Individual Participatory Statistics Keywords Analysis Researcher codings & further analyses Threads Analysis Social Networks   Downloadable as MS Excel (.xls) format for charts or works with other student data Collaborators
  • 10.
    Outputs can beorganized into diff. levels… 18 Feb 2012 Successful Pedagogies for Inquiry & Knowledge Building : Individual students : notes : discussion threads : discussion views : date or week
  • 11.
    Individual participatory statistics 18Feb 2012 Successful Pedagogies for Inquiry & Knowledge Building Number of Scaffolds UsedNumber of Notes Created Percentage of notes read Percentage of Notes LinkedNumber of Revisions
  • 12.
    Social Network Analysis 18Feb 2012 Successful Pedagogies for Inquiry & Knowledge Building Year 1 Year 2 Year 3
  • 13.
    Threads analysis module: 7/9/2013 0 0.5 1 1.5 2 2.5 3 Year1 Year 2 Depthofdiscussionthread 6.5 7 7.5 Year 1 Year 2Numberofnotes Average Number of Notes per Thread Average Depth of Discussion Thread
  • 14.
    Examples of questiontypes • Attribute – What is the size of the smallest whale? – Where is the notice? • Definition – What is energy crisis? – What does global warming refer to? • Verification – Is it safe to drink the water only through looking at it? – Is carbon dioxide toxic and harmful?
  • 15.
    Examples of questiontypes • Procedure – How to make a water filter? • Reason – Why do water become brown color? – Why do we need to save water? • Mechanism – How can we protect these animals? – How do planktons give birth to the next generation?
  • 16.
    Researcher Coding Types ofquestions raised in the discourse 18 Feb 2012 Successful Pedagogies for Inquiry & Knowledge Building
  • 17.
    Keywords analysis module HKKids discourse HK Kids Word Count 特徵(characteristic) 5 成因(cause) 4 個人(individual) 3 家長(parent) 62 傭人(maid) 42 社會(society) 15 政府(government) 51 教育制度(Education system) 15 精英制度(Elite system) 6 遺傳(inheritance ) 11 影響(influence) 6 經濟(Economics) 0 自理能力(Self- management) 20 責任(responsibility) 19 改善(improvement) 31 解決(solution) 14 訓練(training) 12 7/9/2013
  • 18.
    Summary: Choosing thesuitable type and focus of analysis for diff. types of learning • Behavior is affected by design and facilitation • Requires in-depth understanding about the design and intended learning goal of the discourse in order to interpret the visuals – Time series vs. snapshot – Whole class vs. individual – Quantity vs. quality