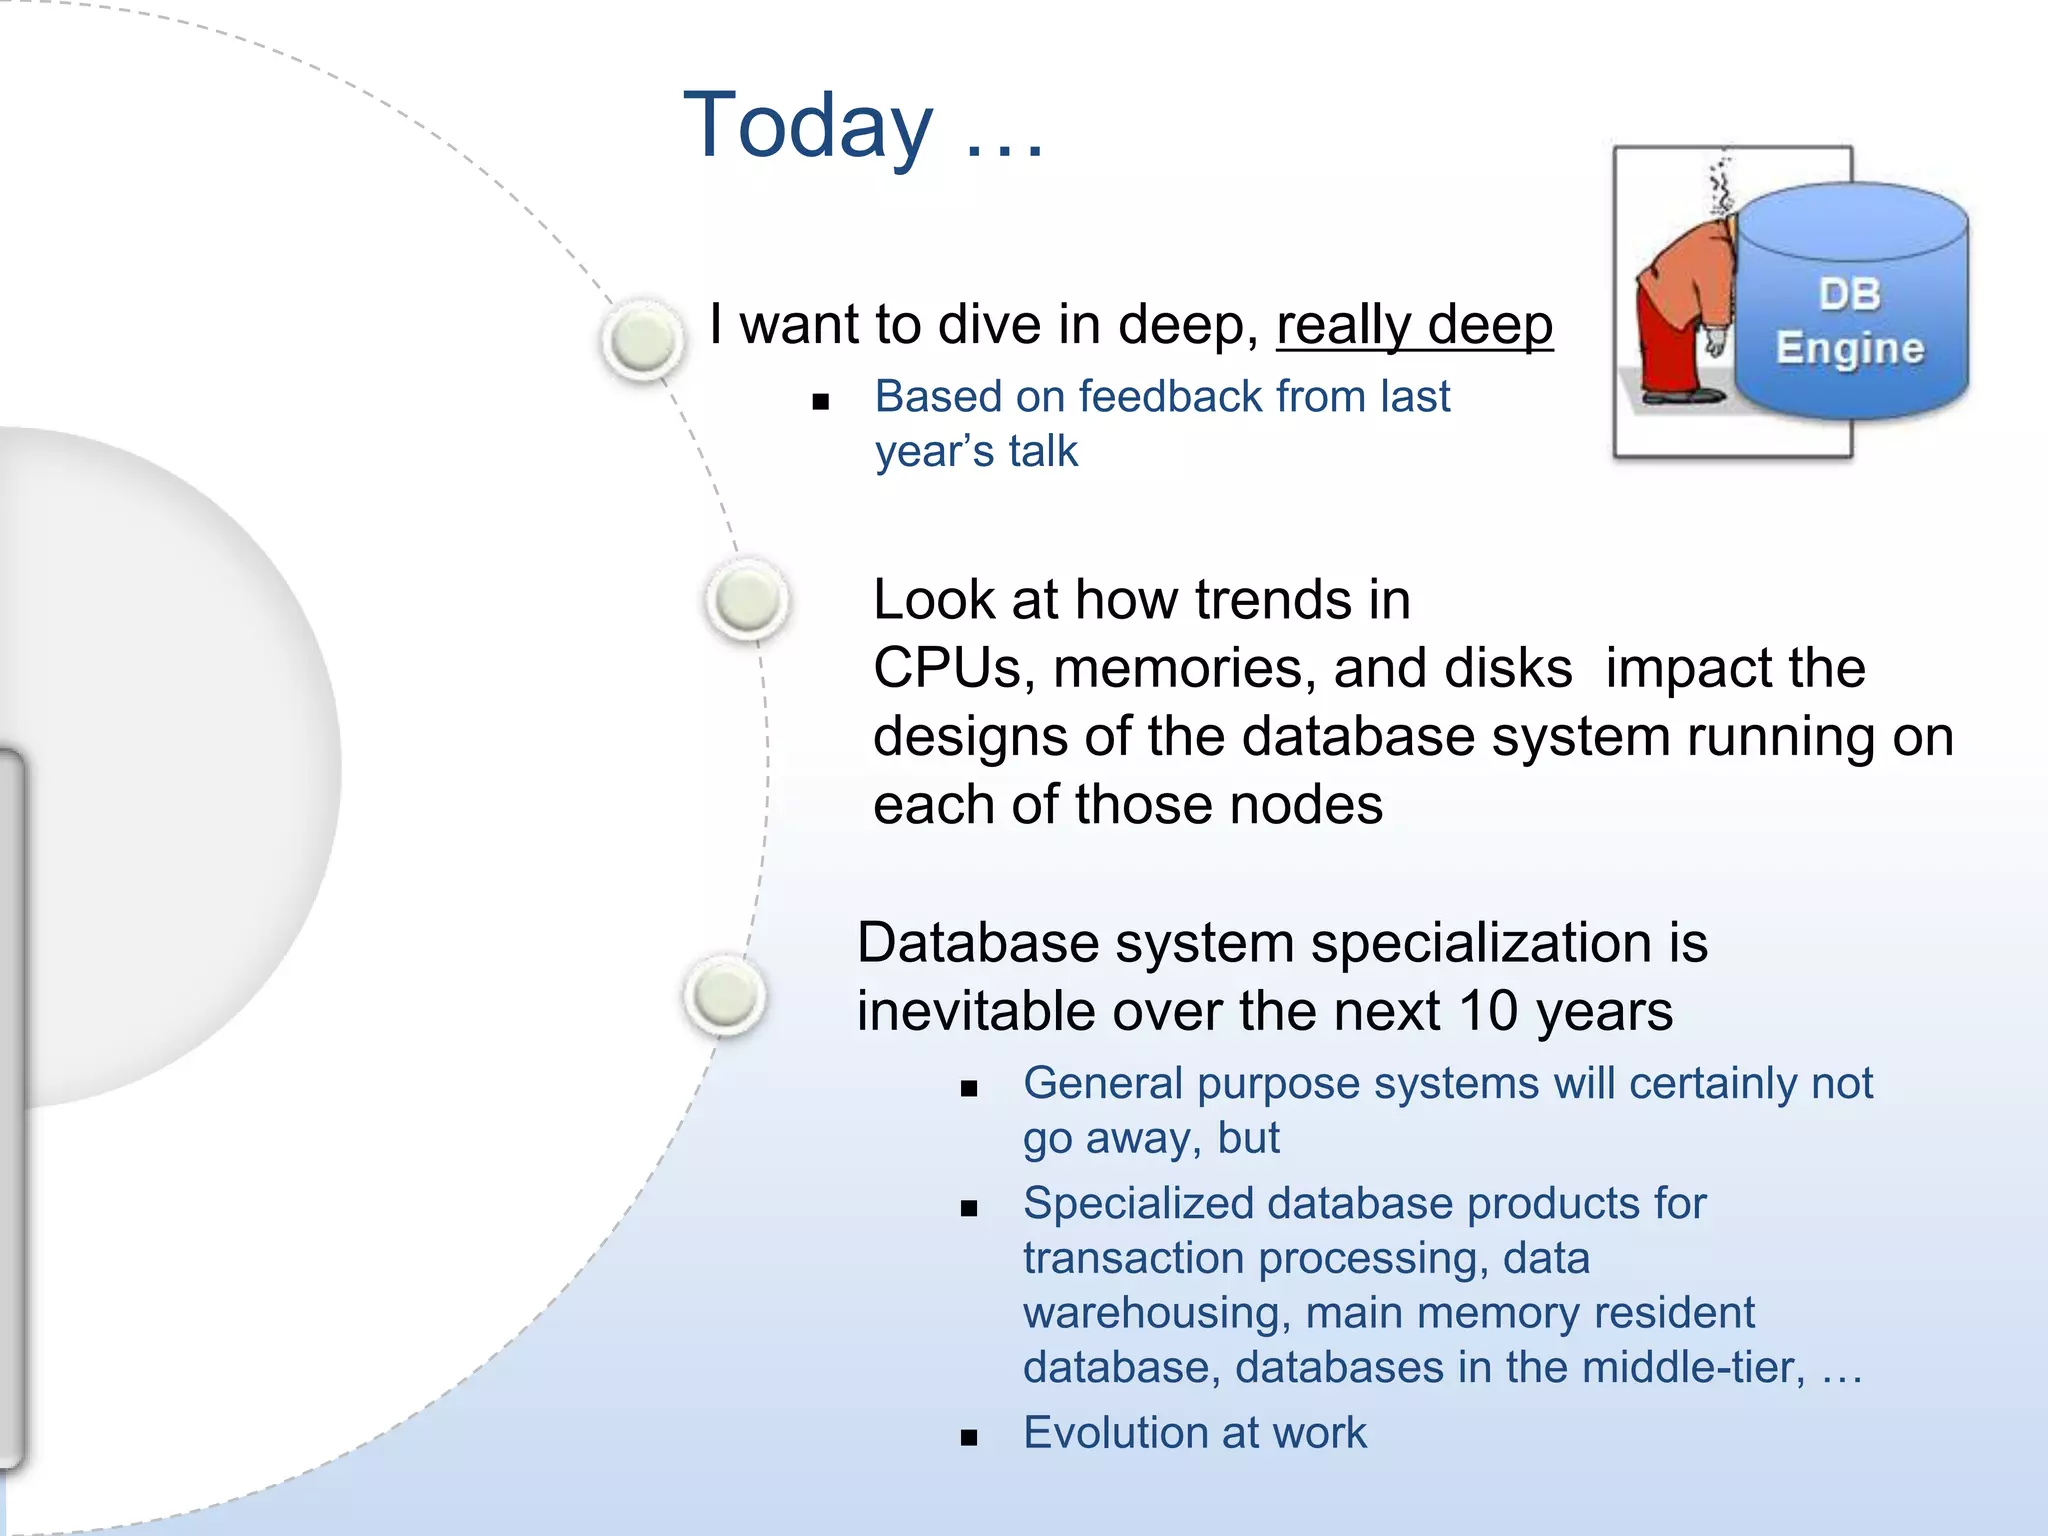
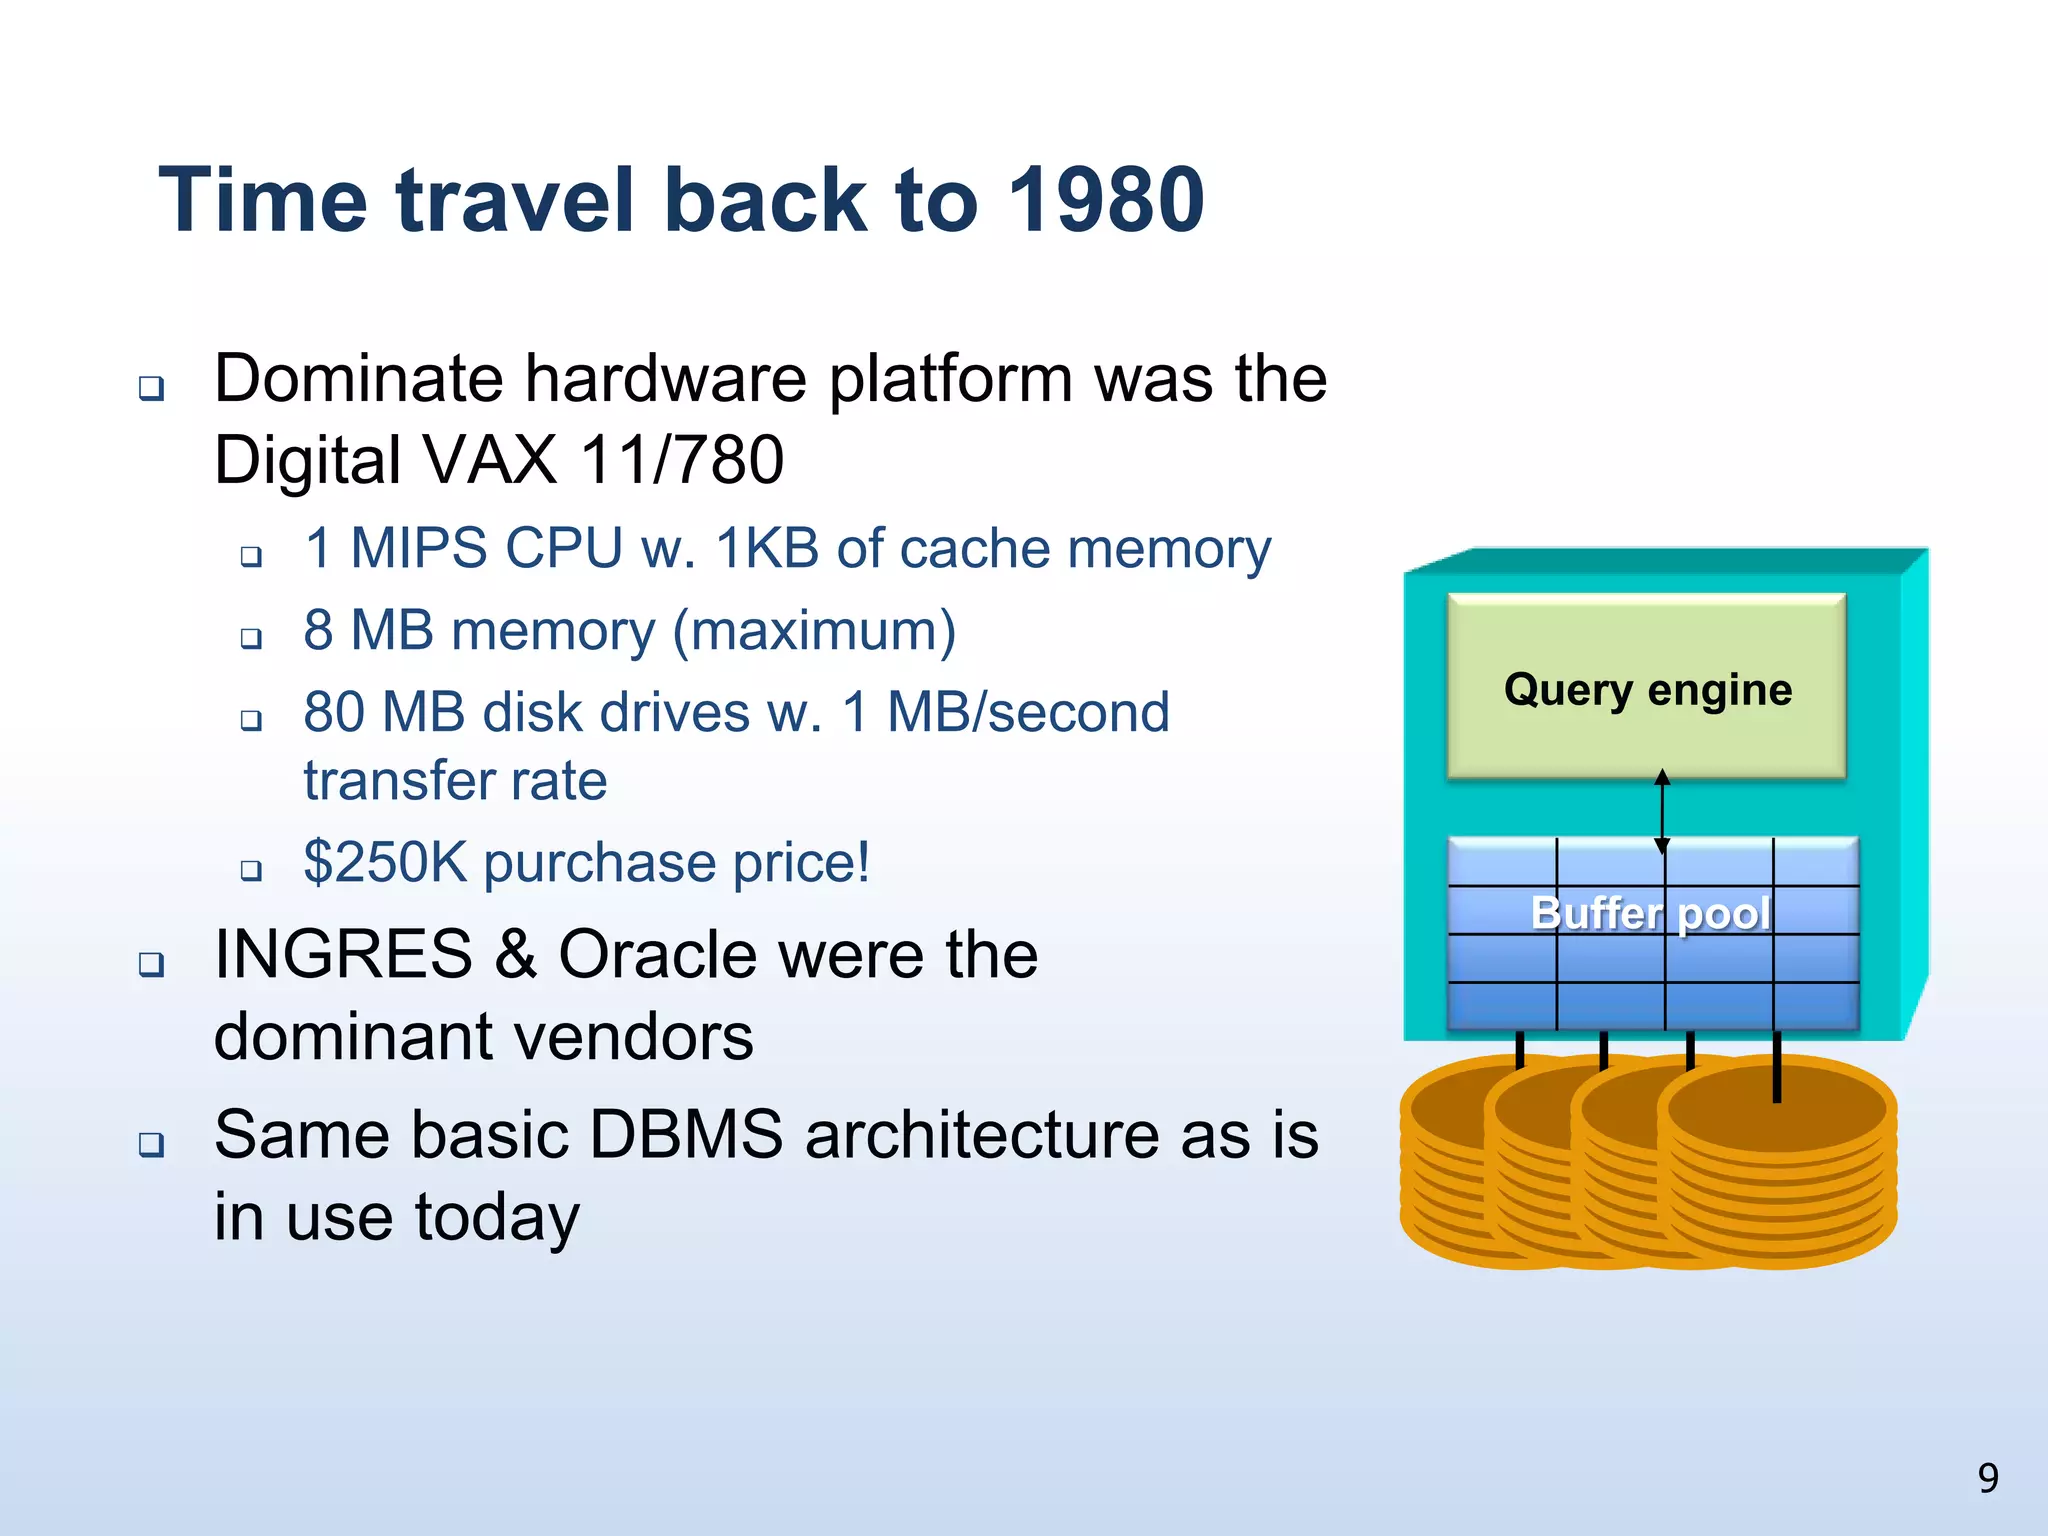
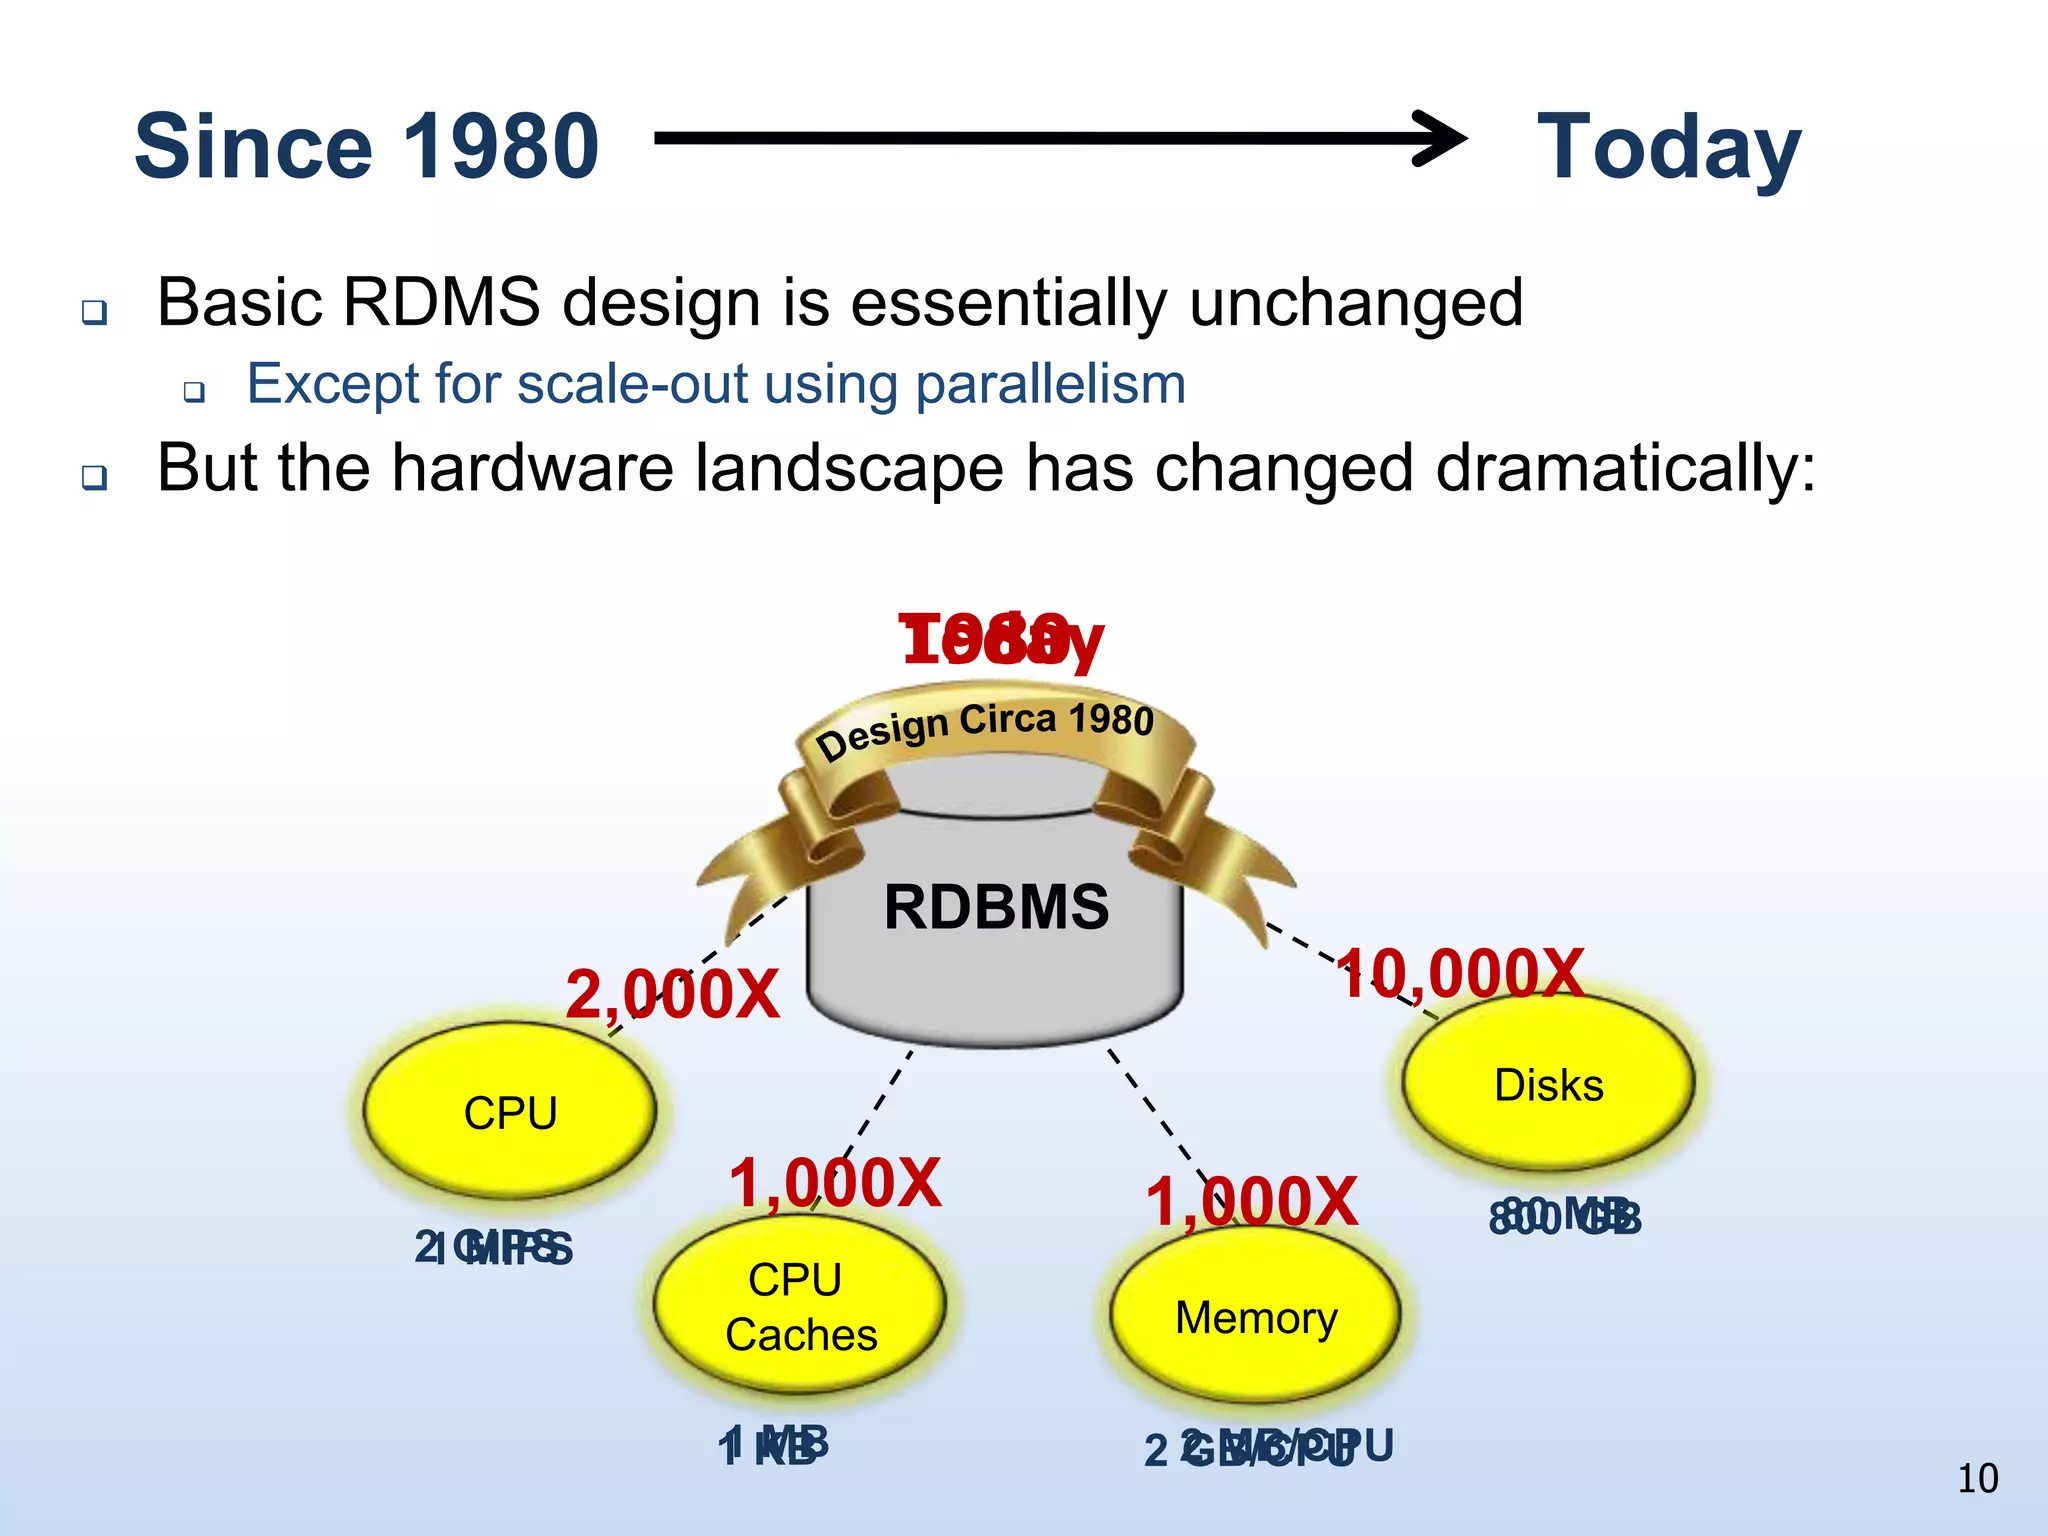
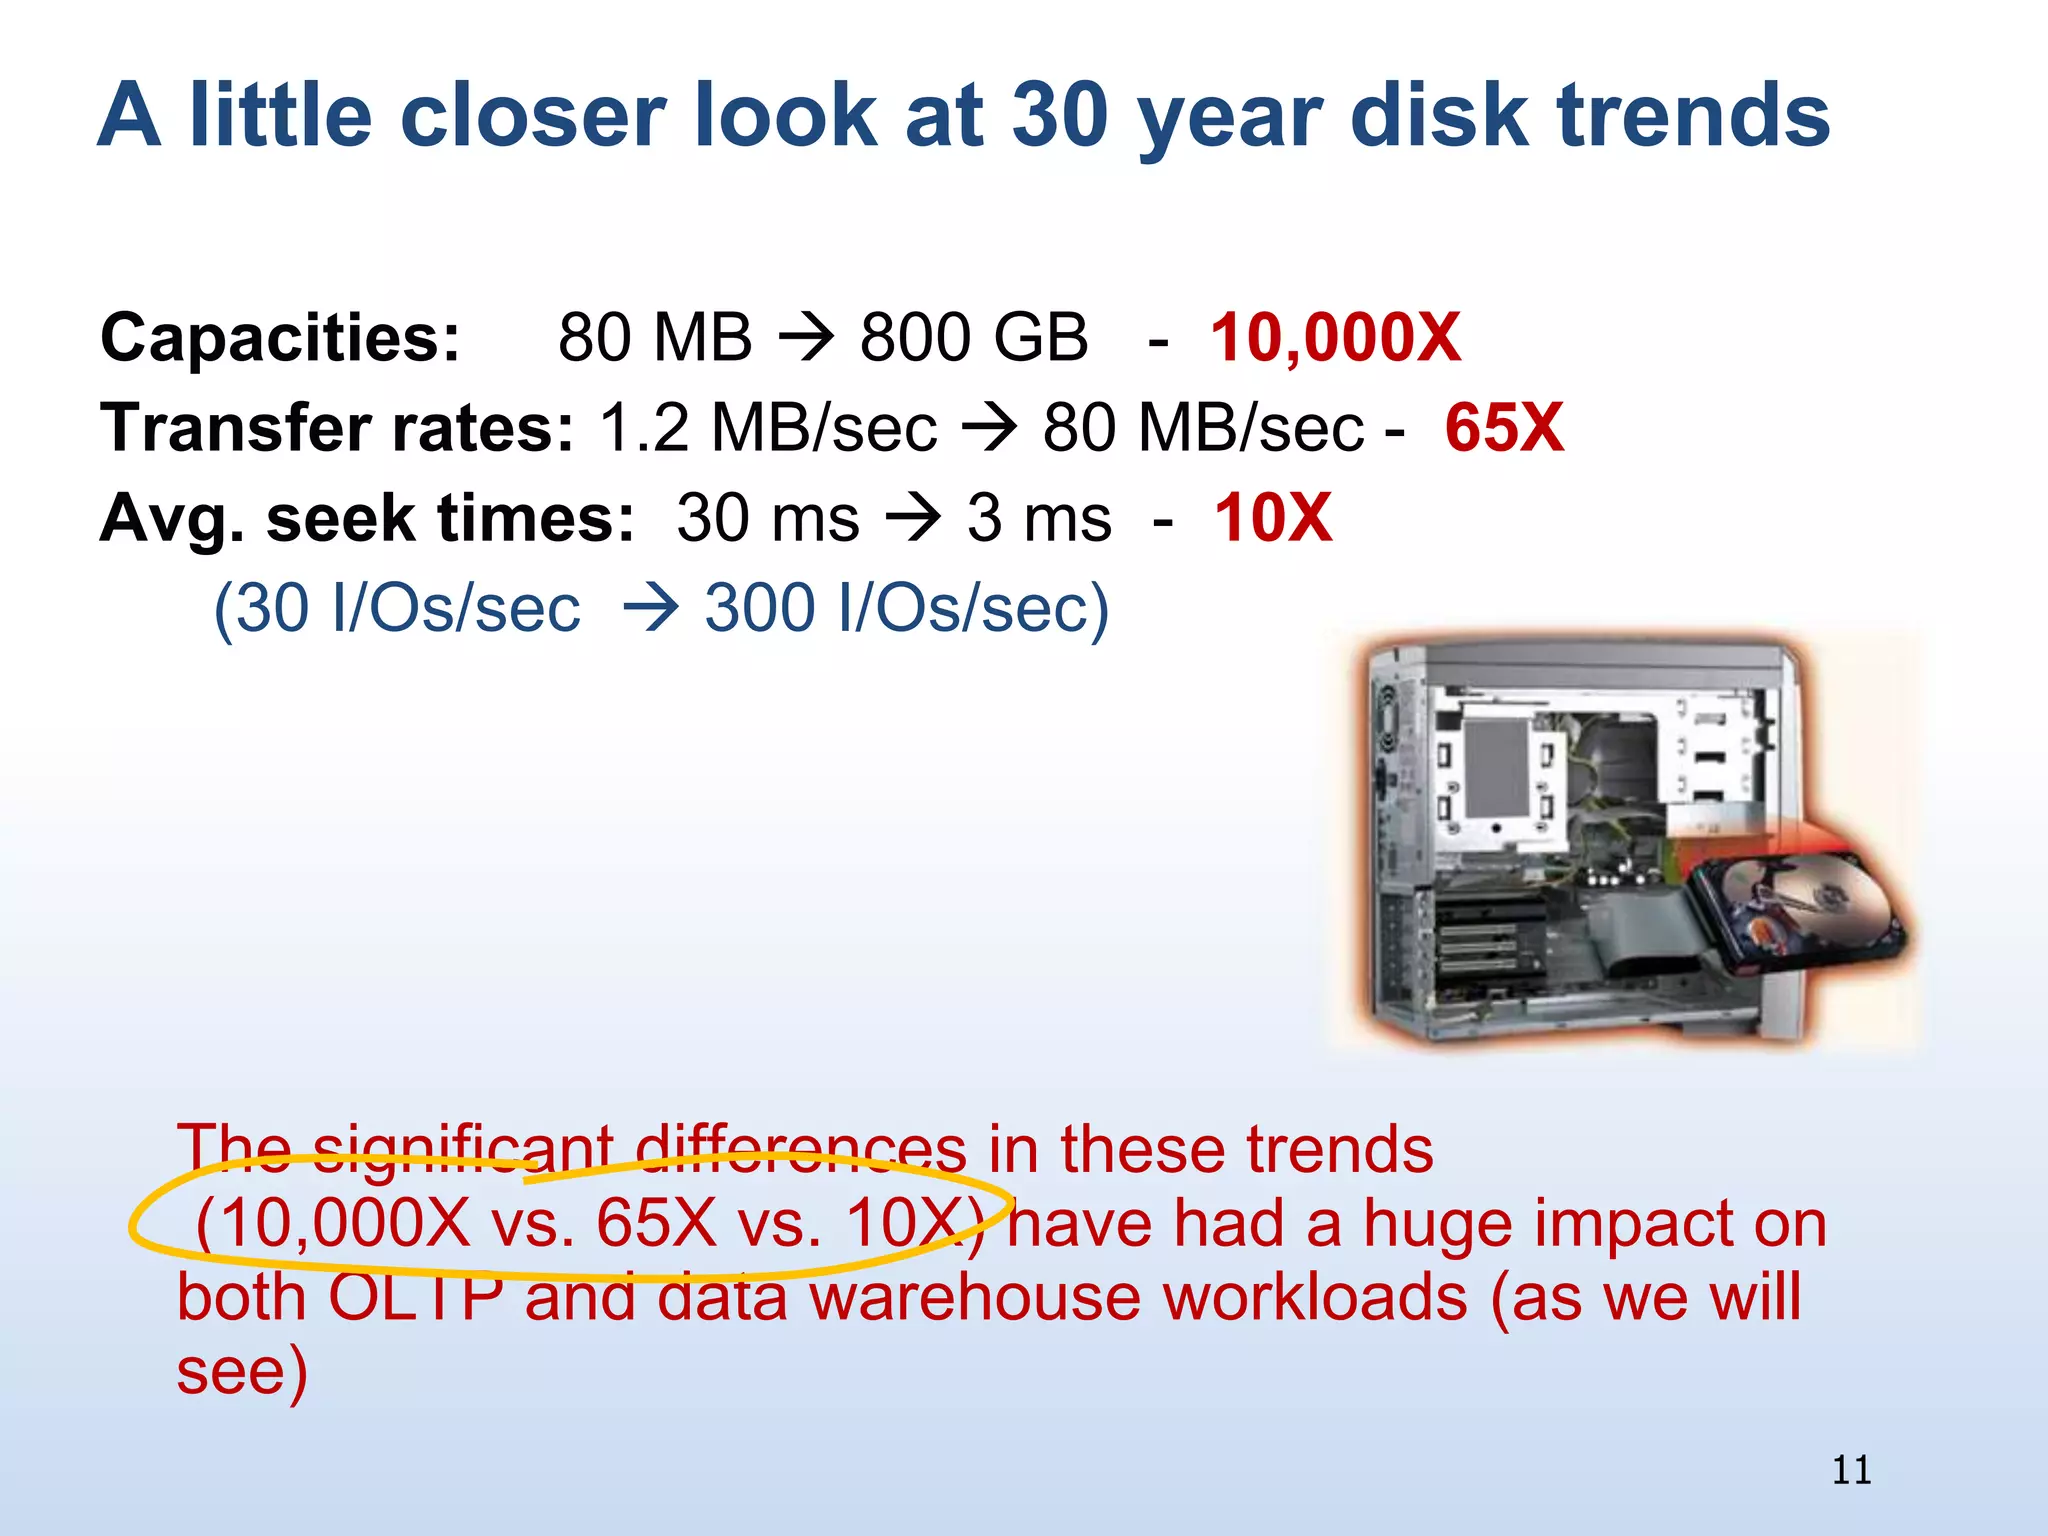
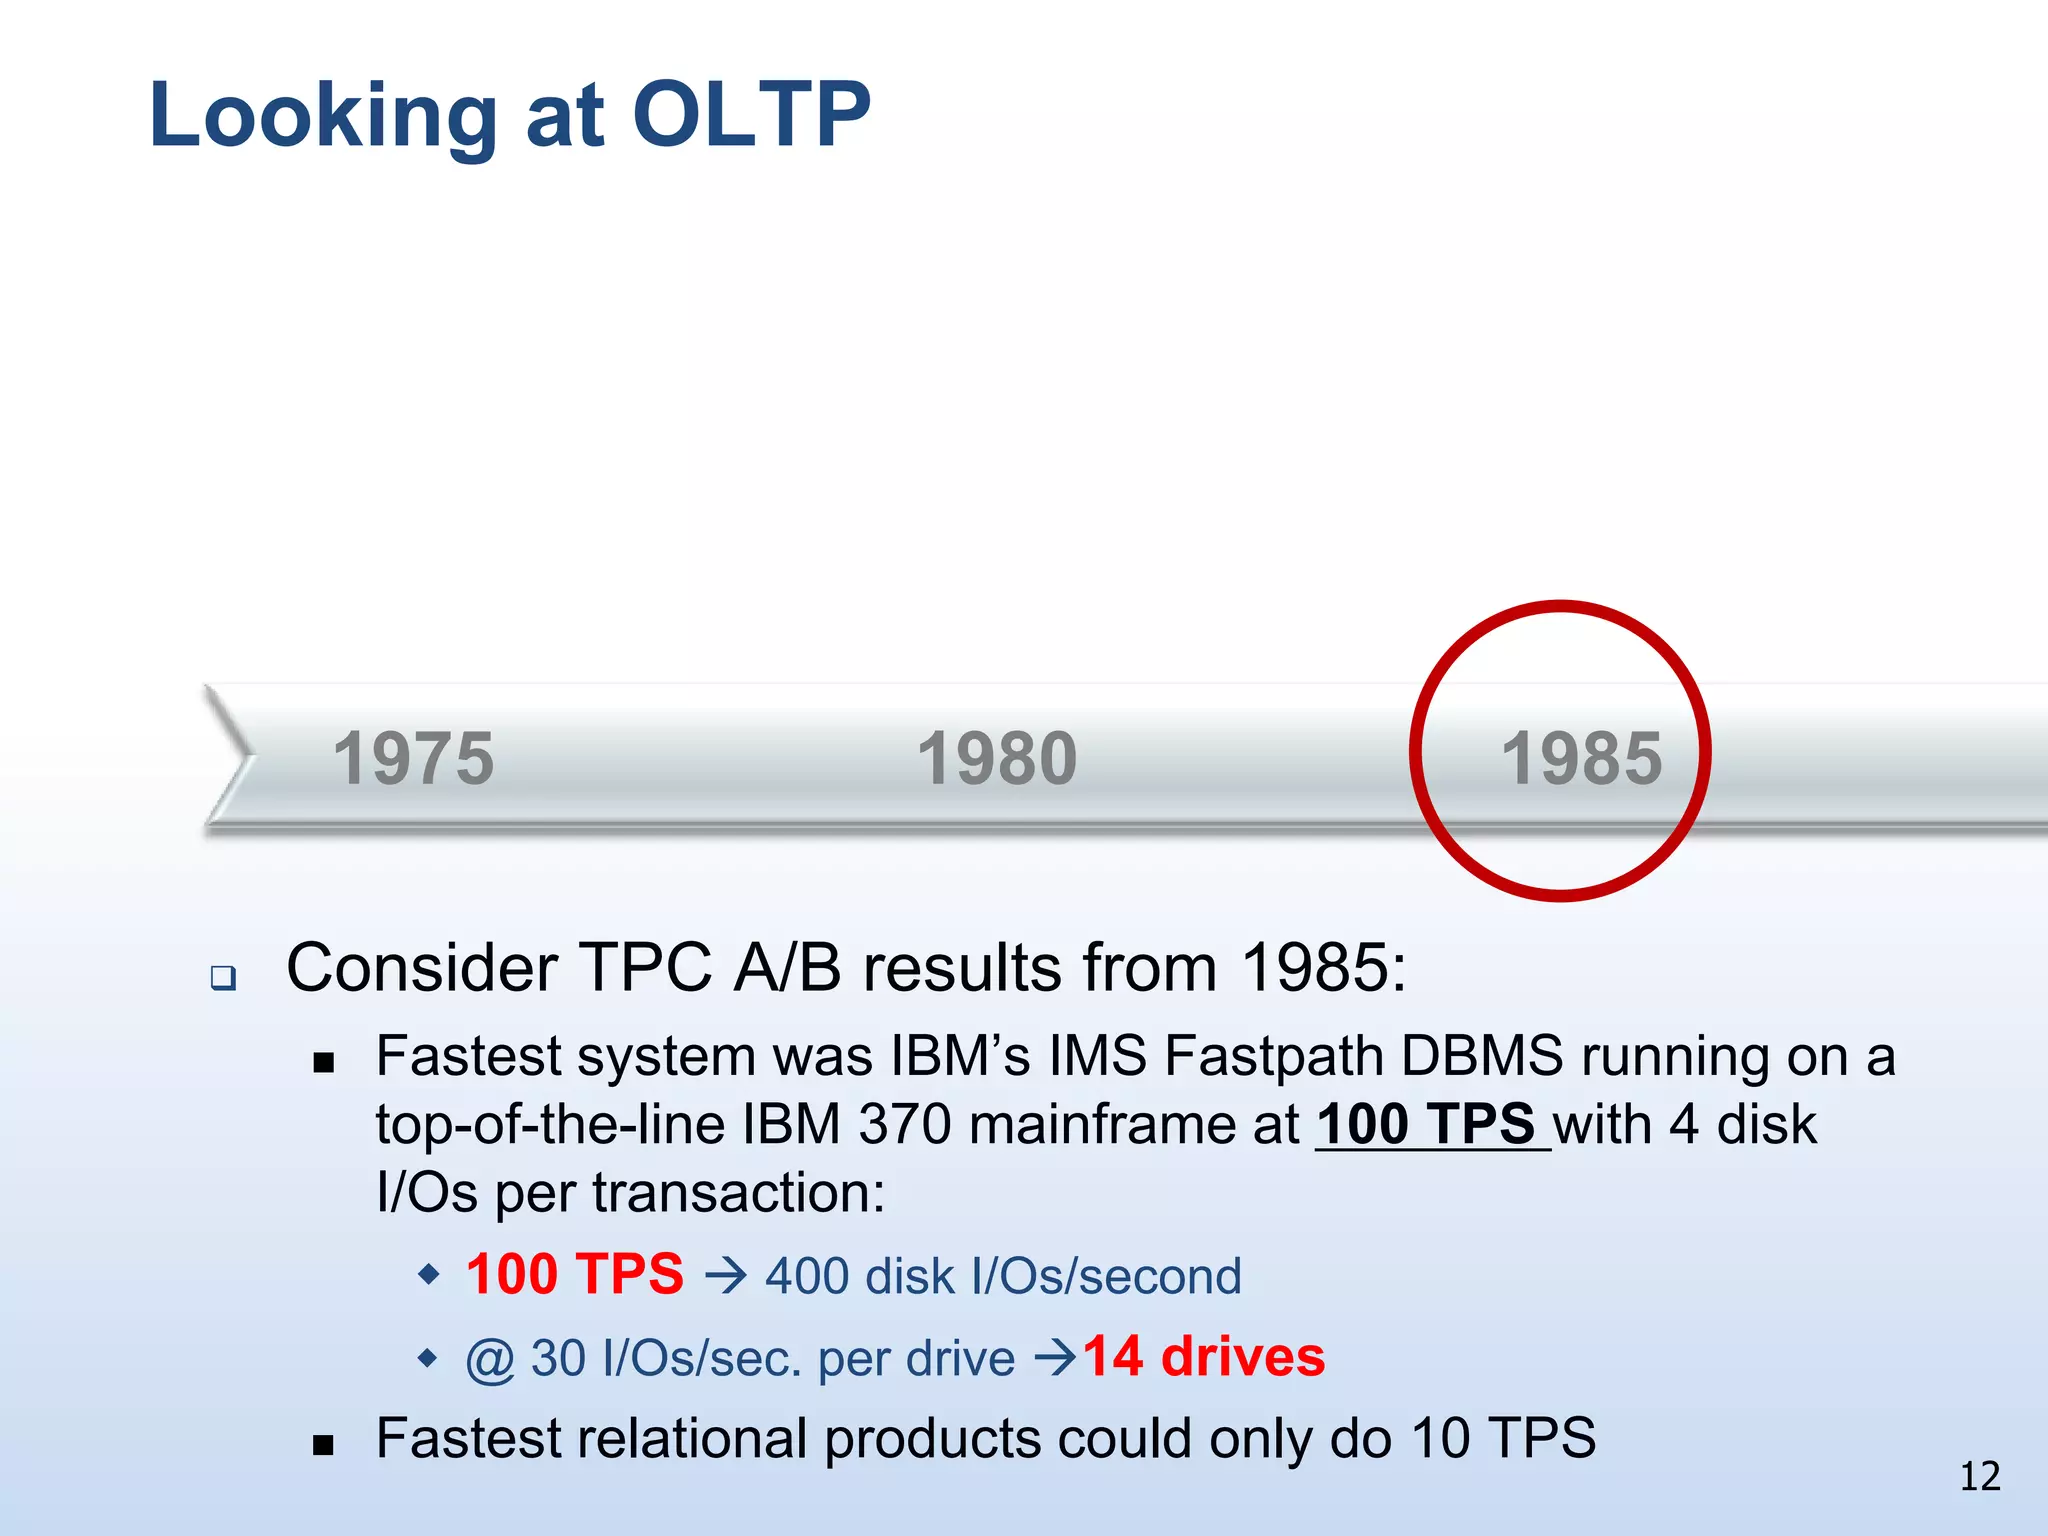
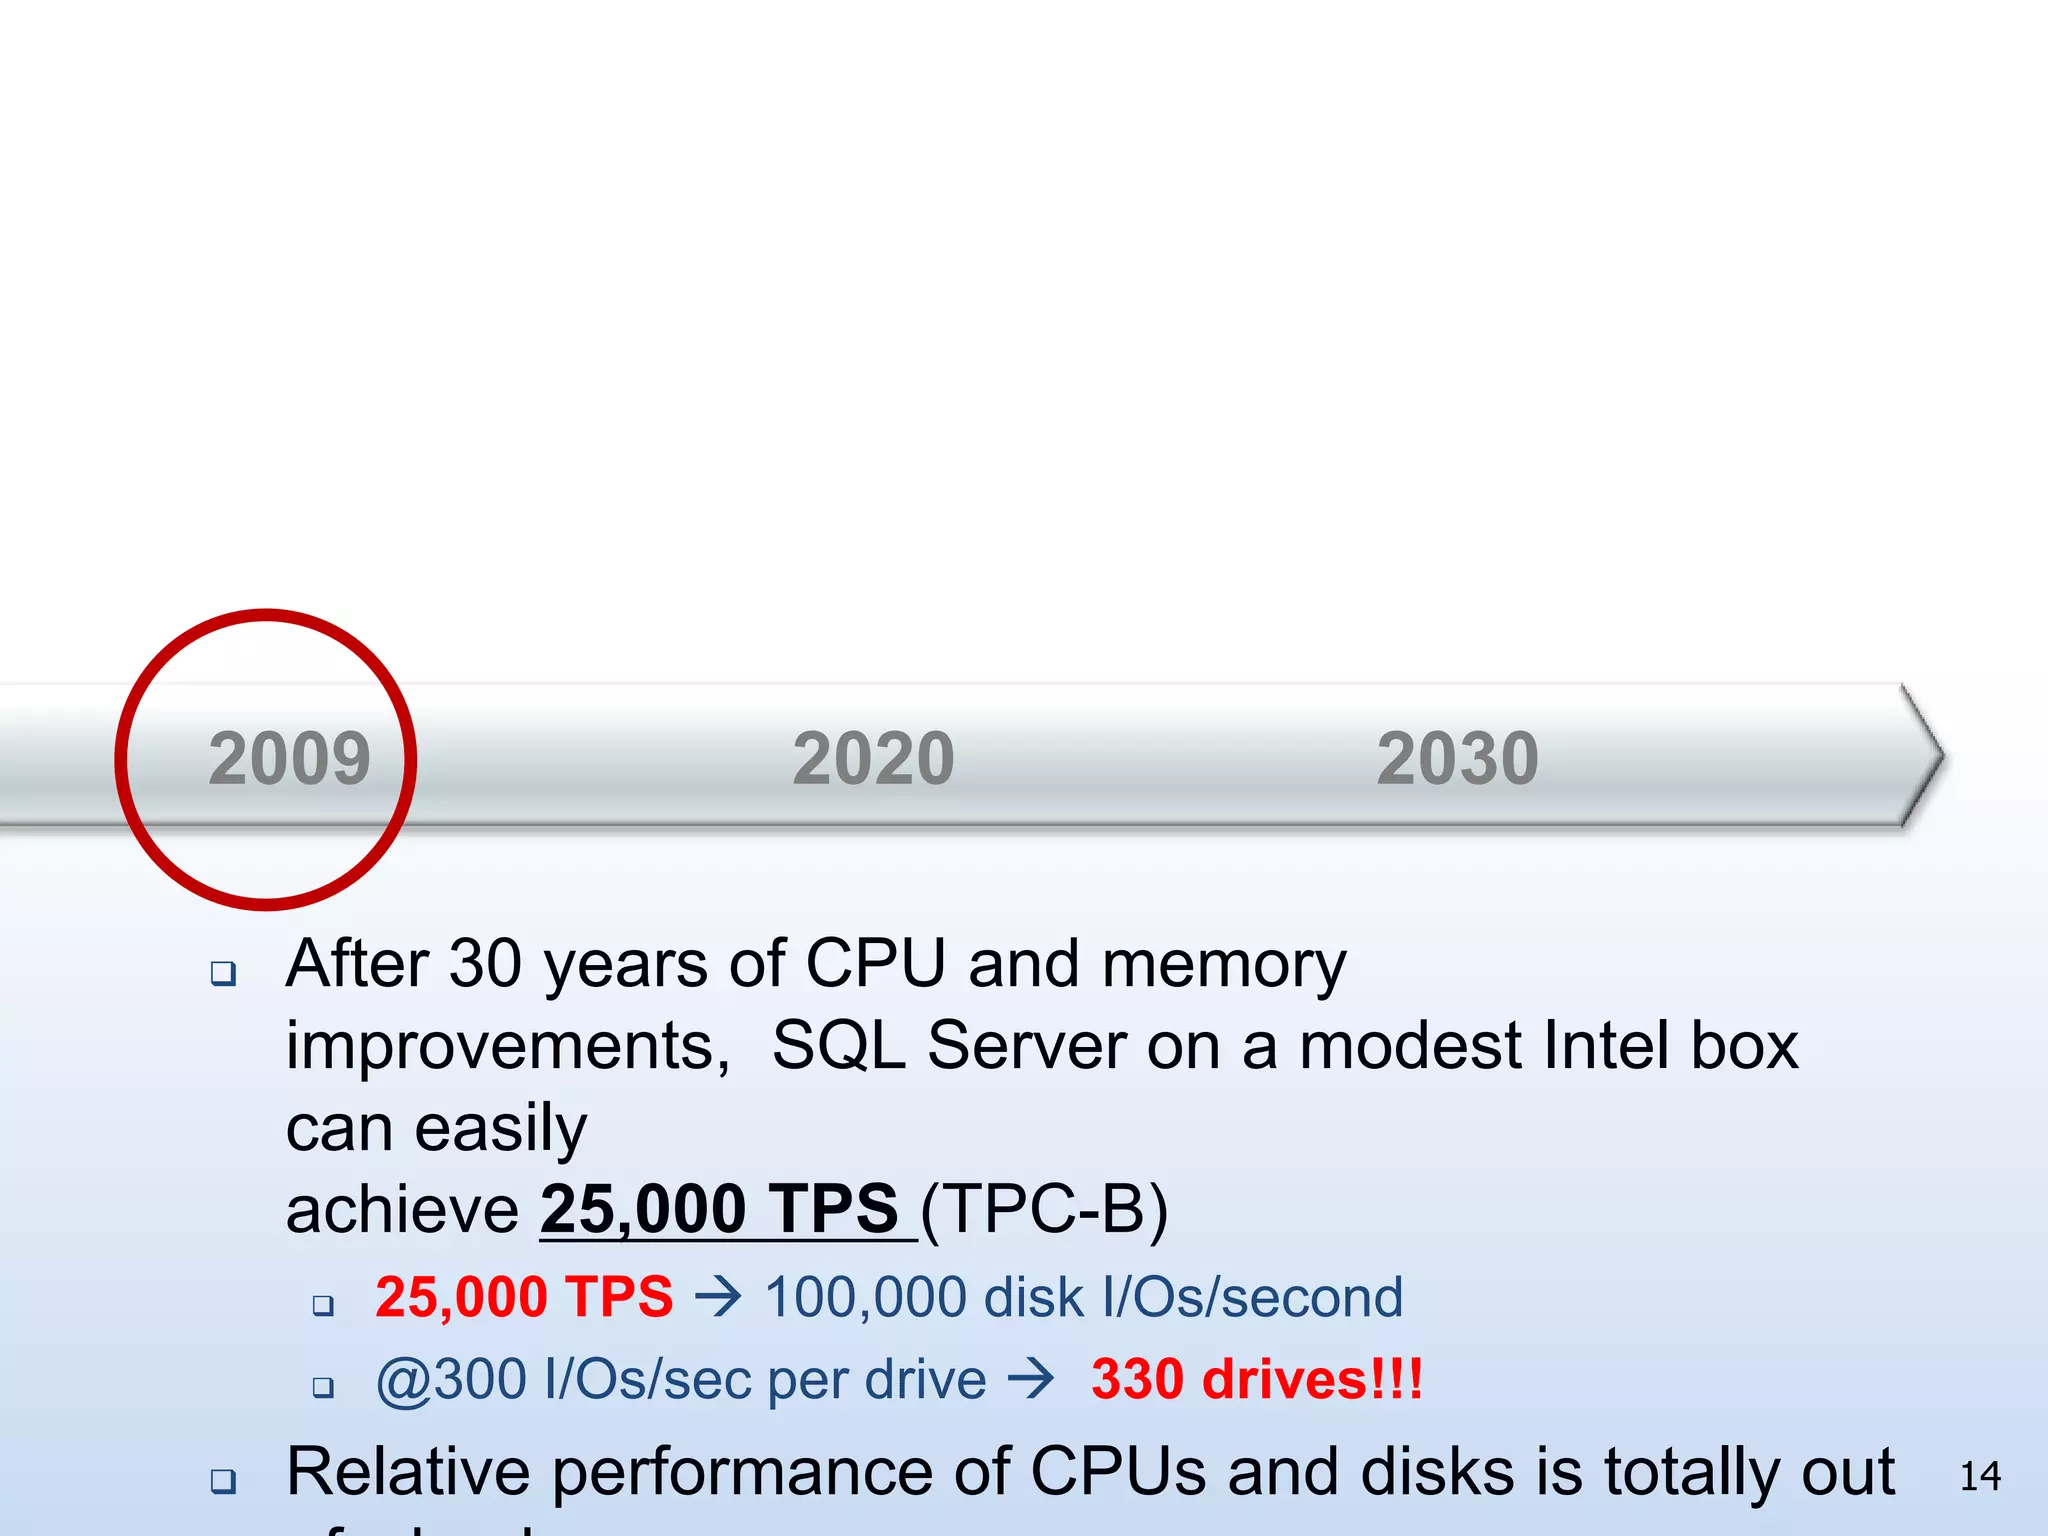
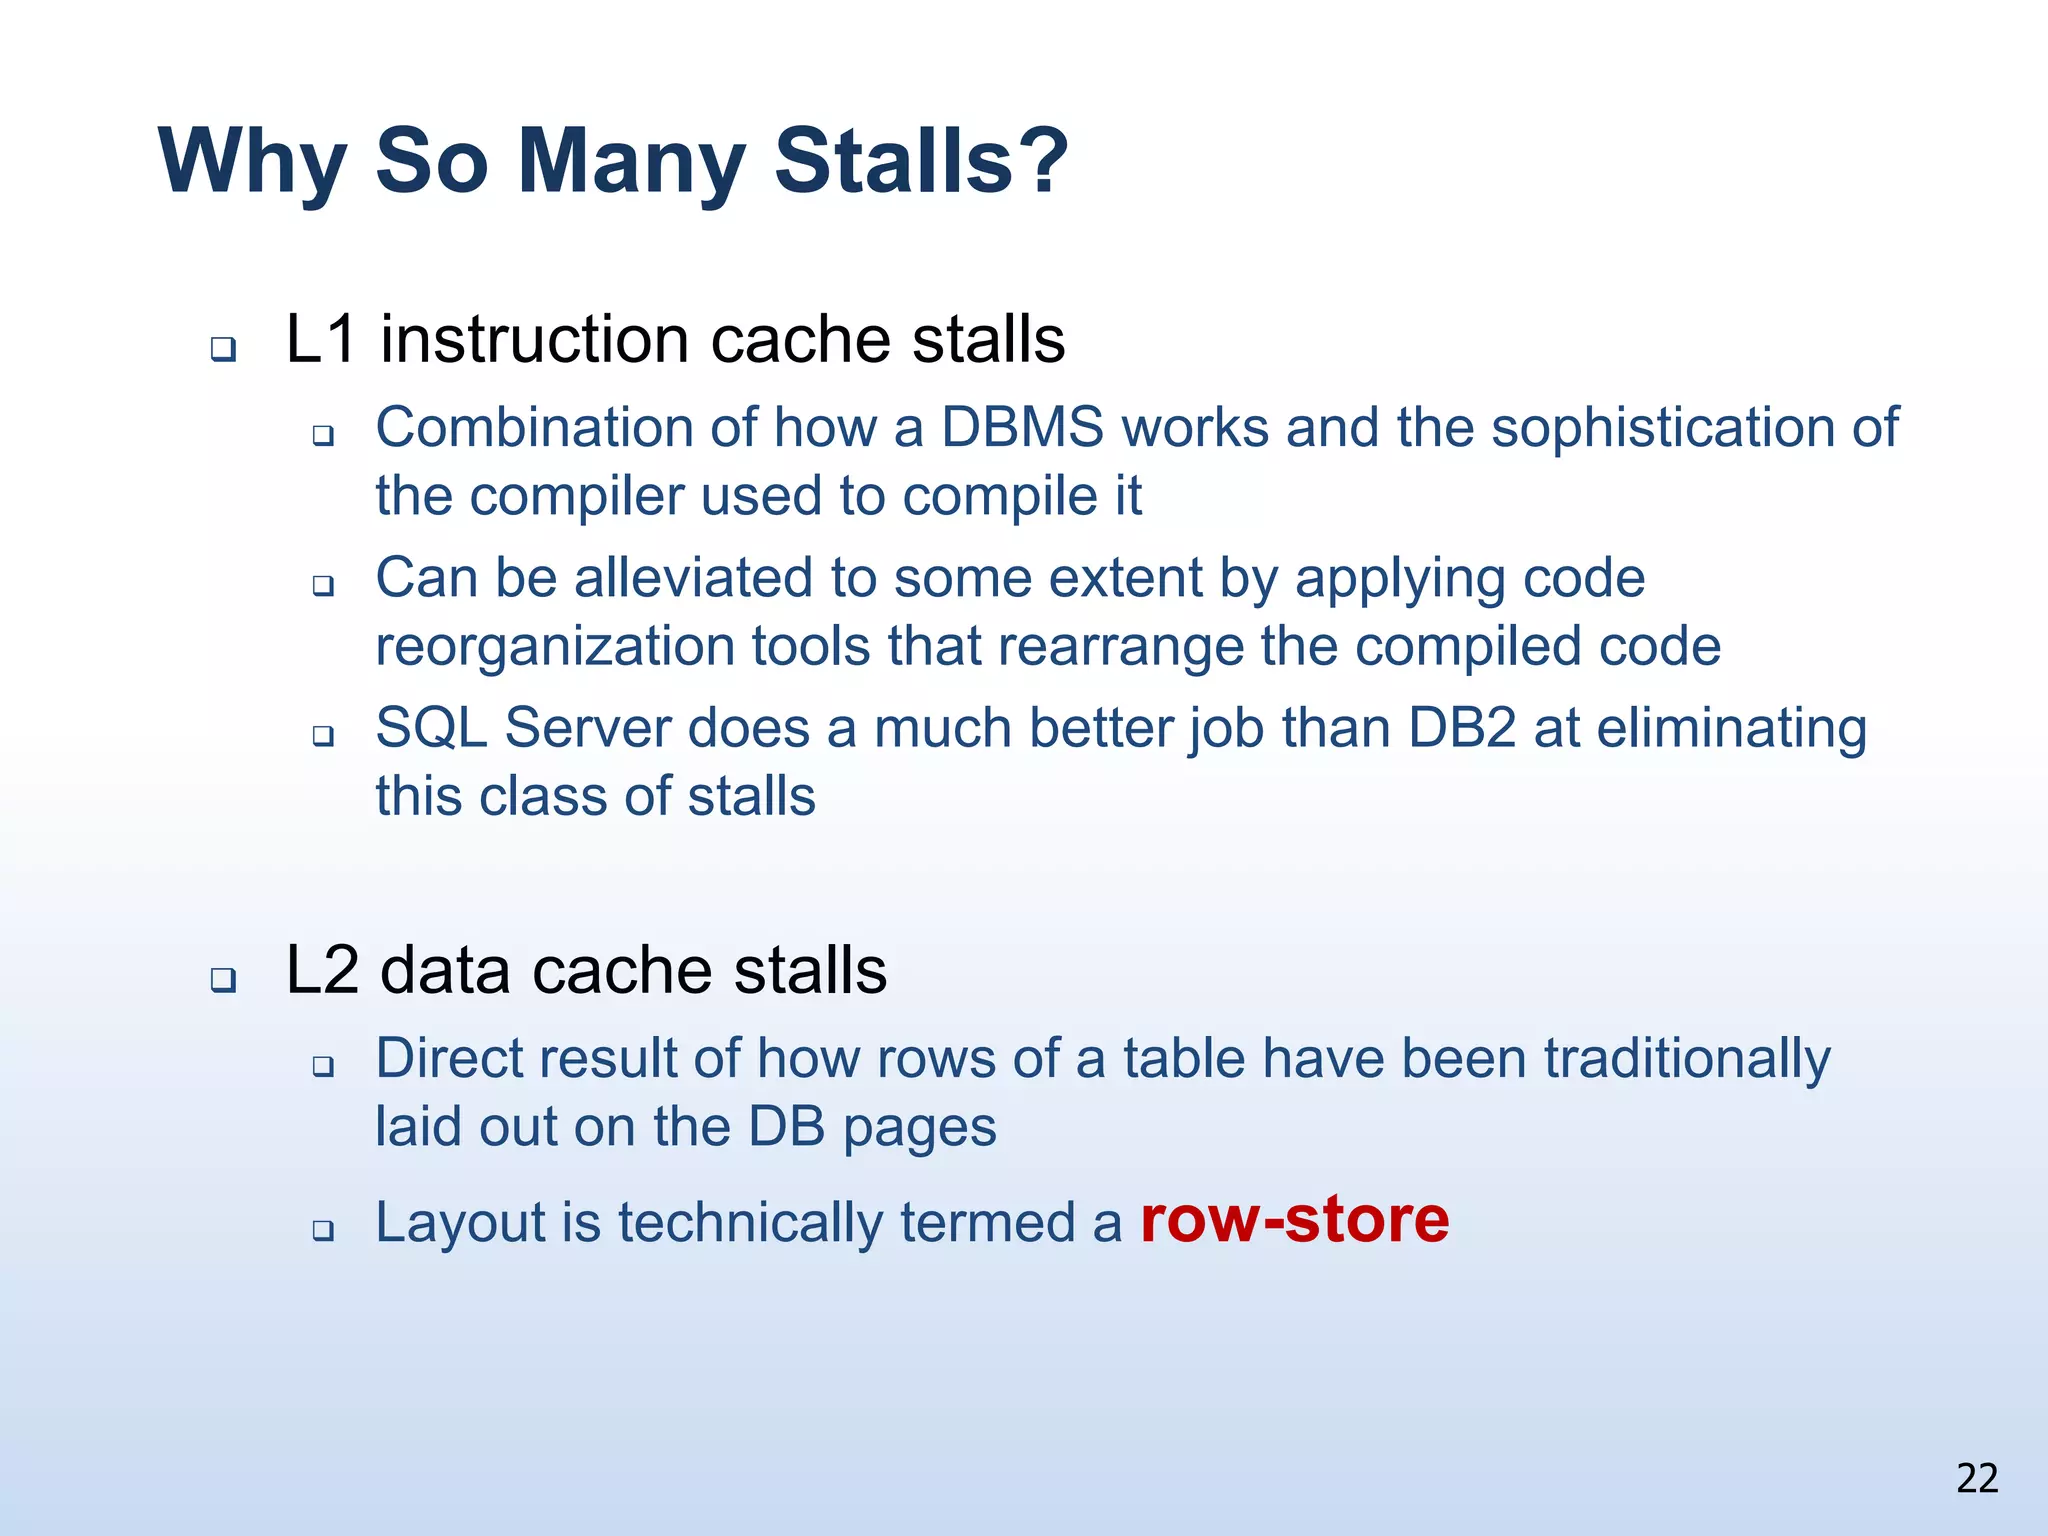
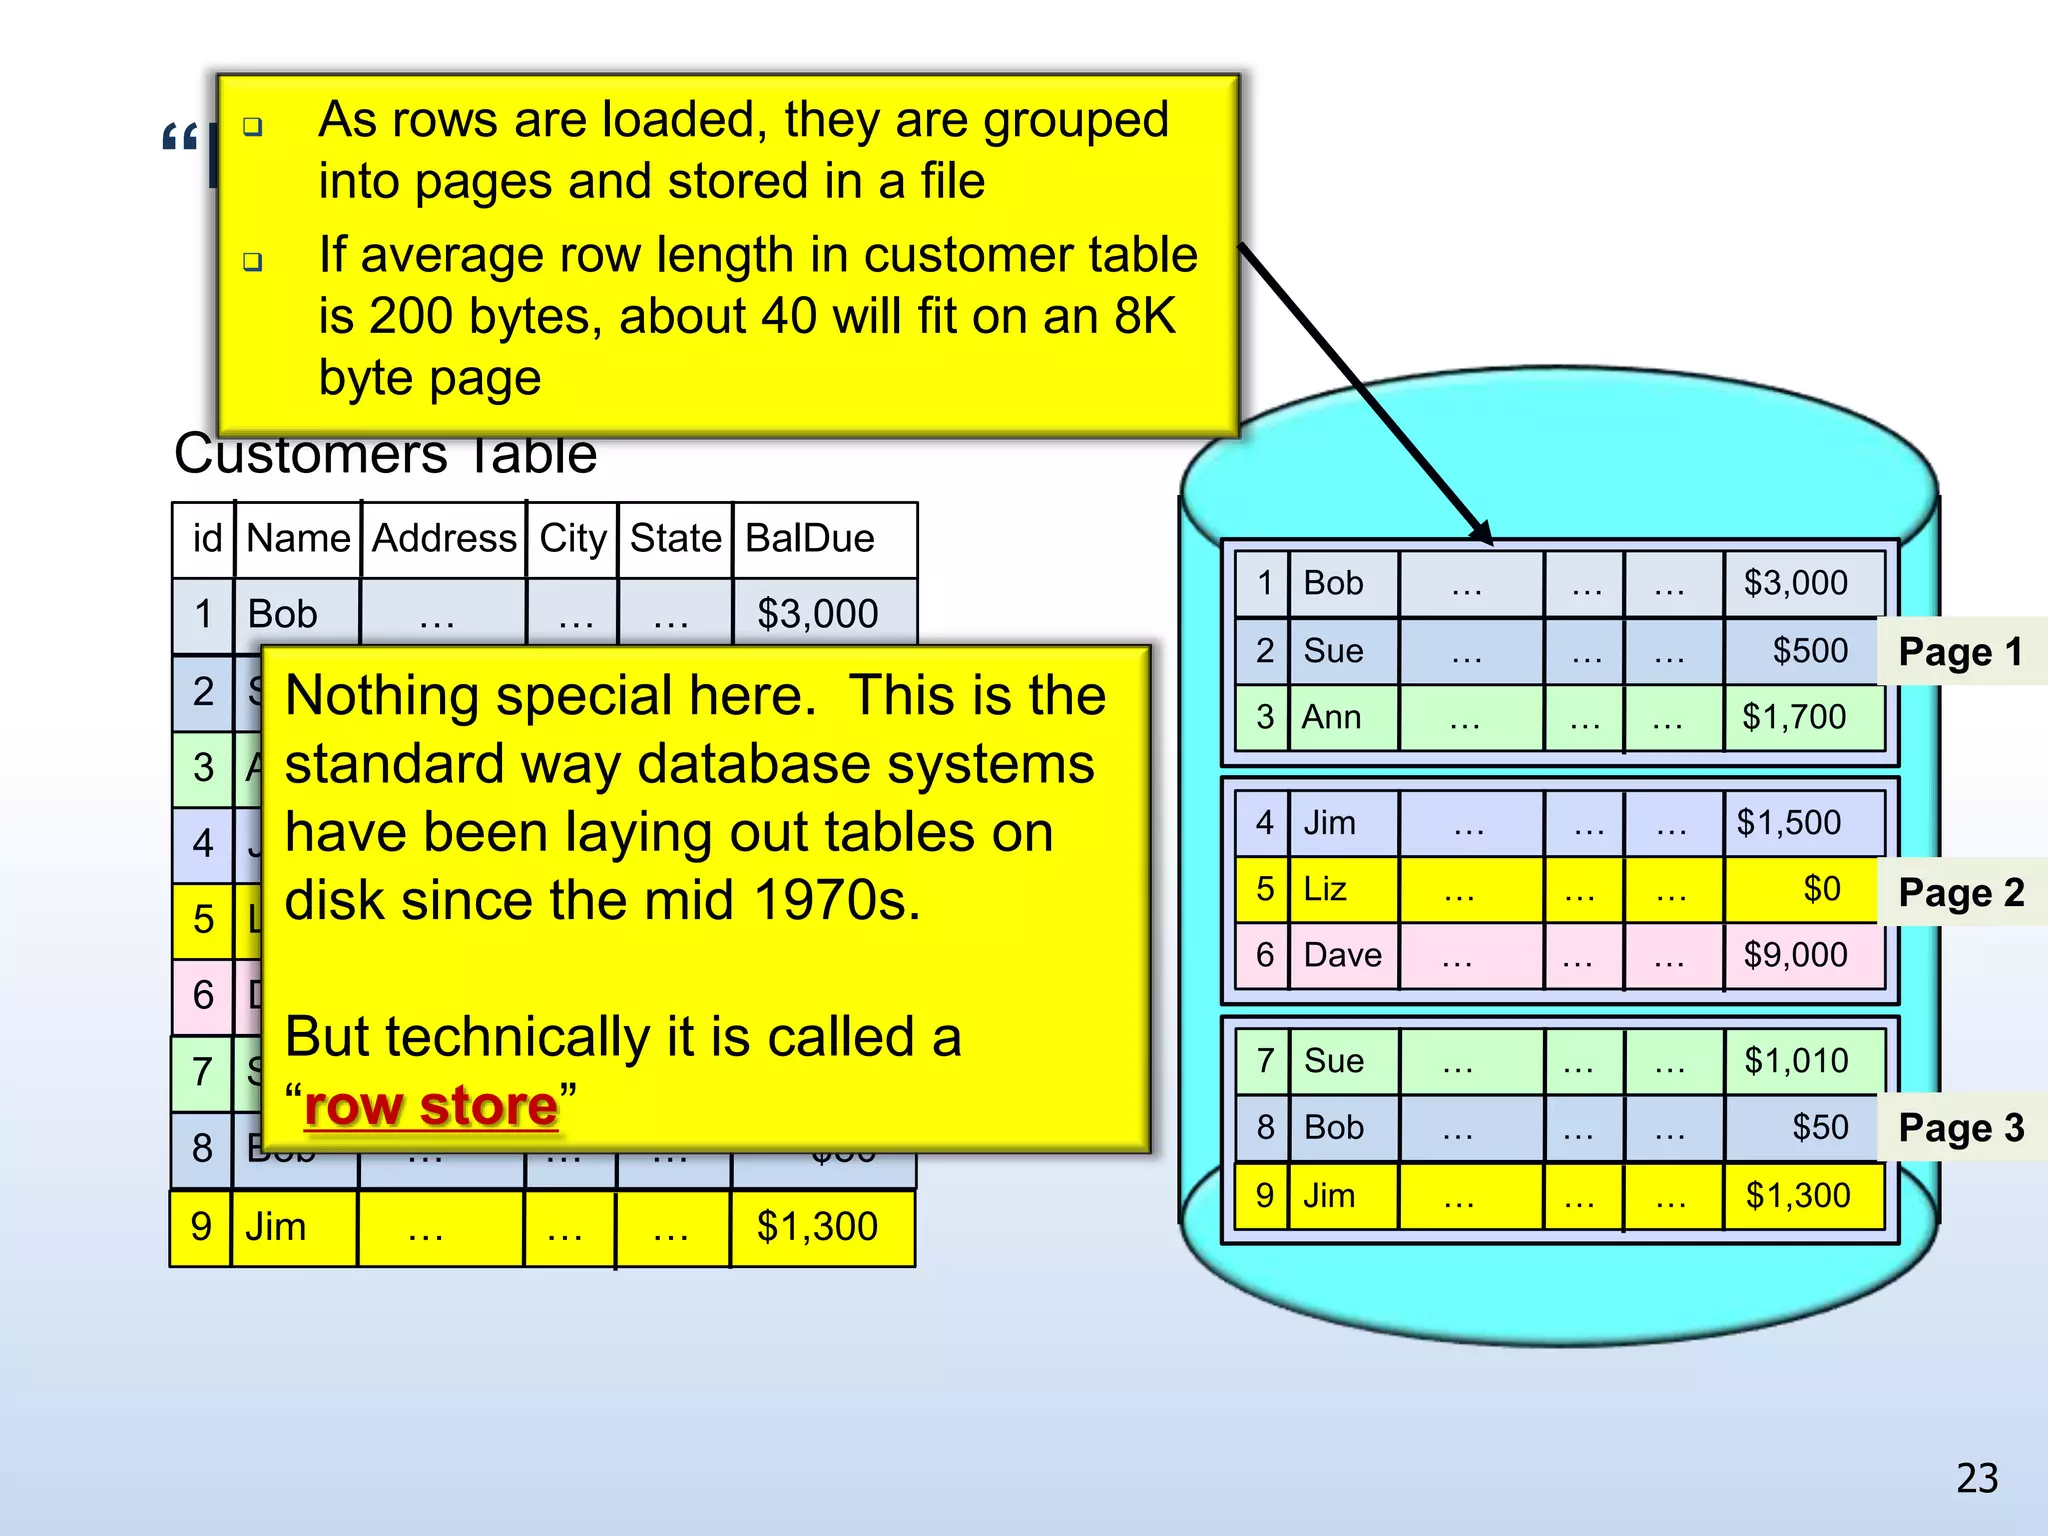
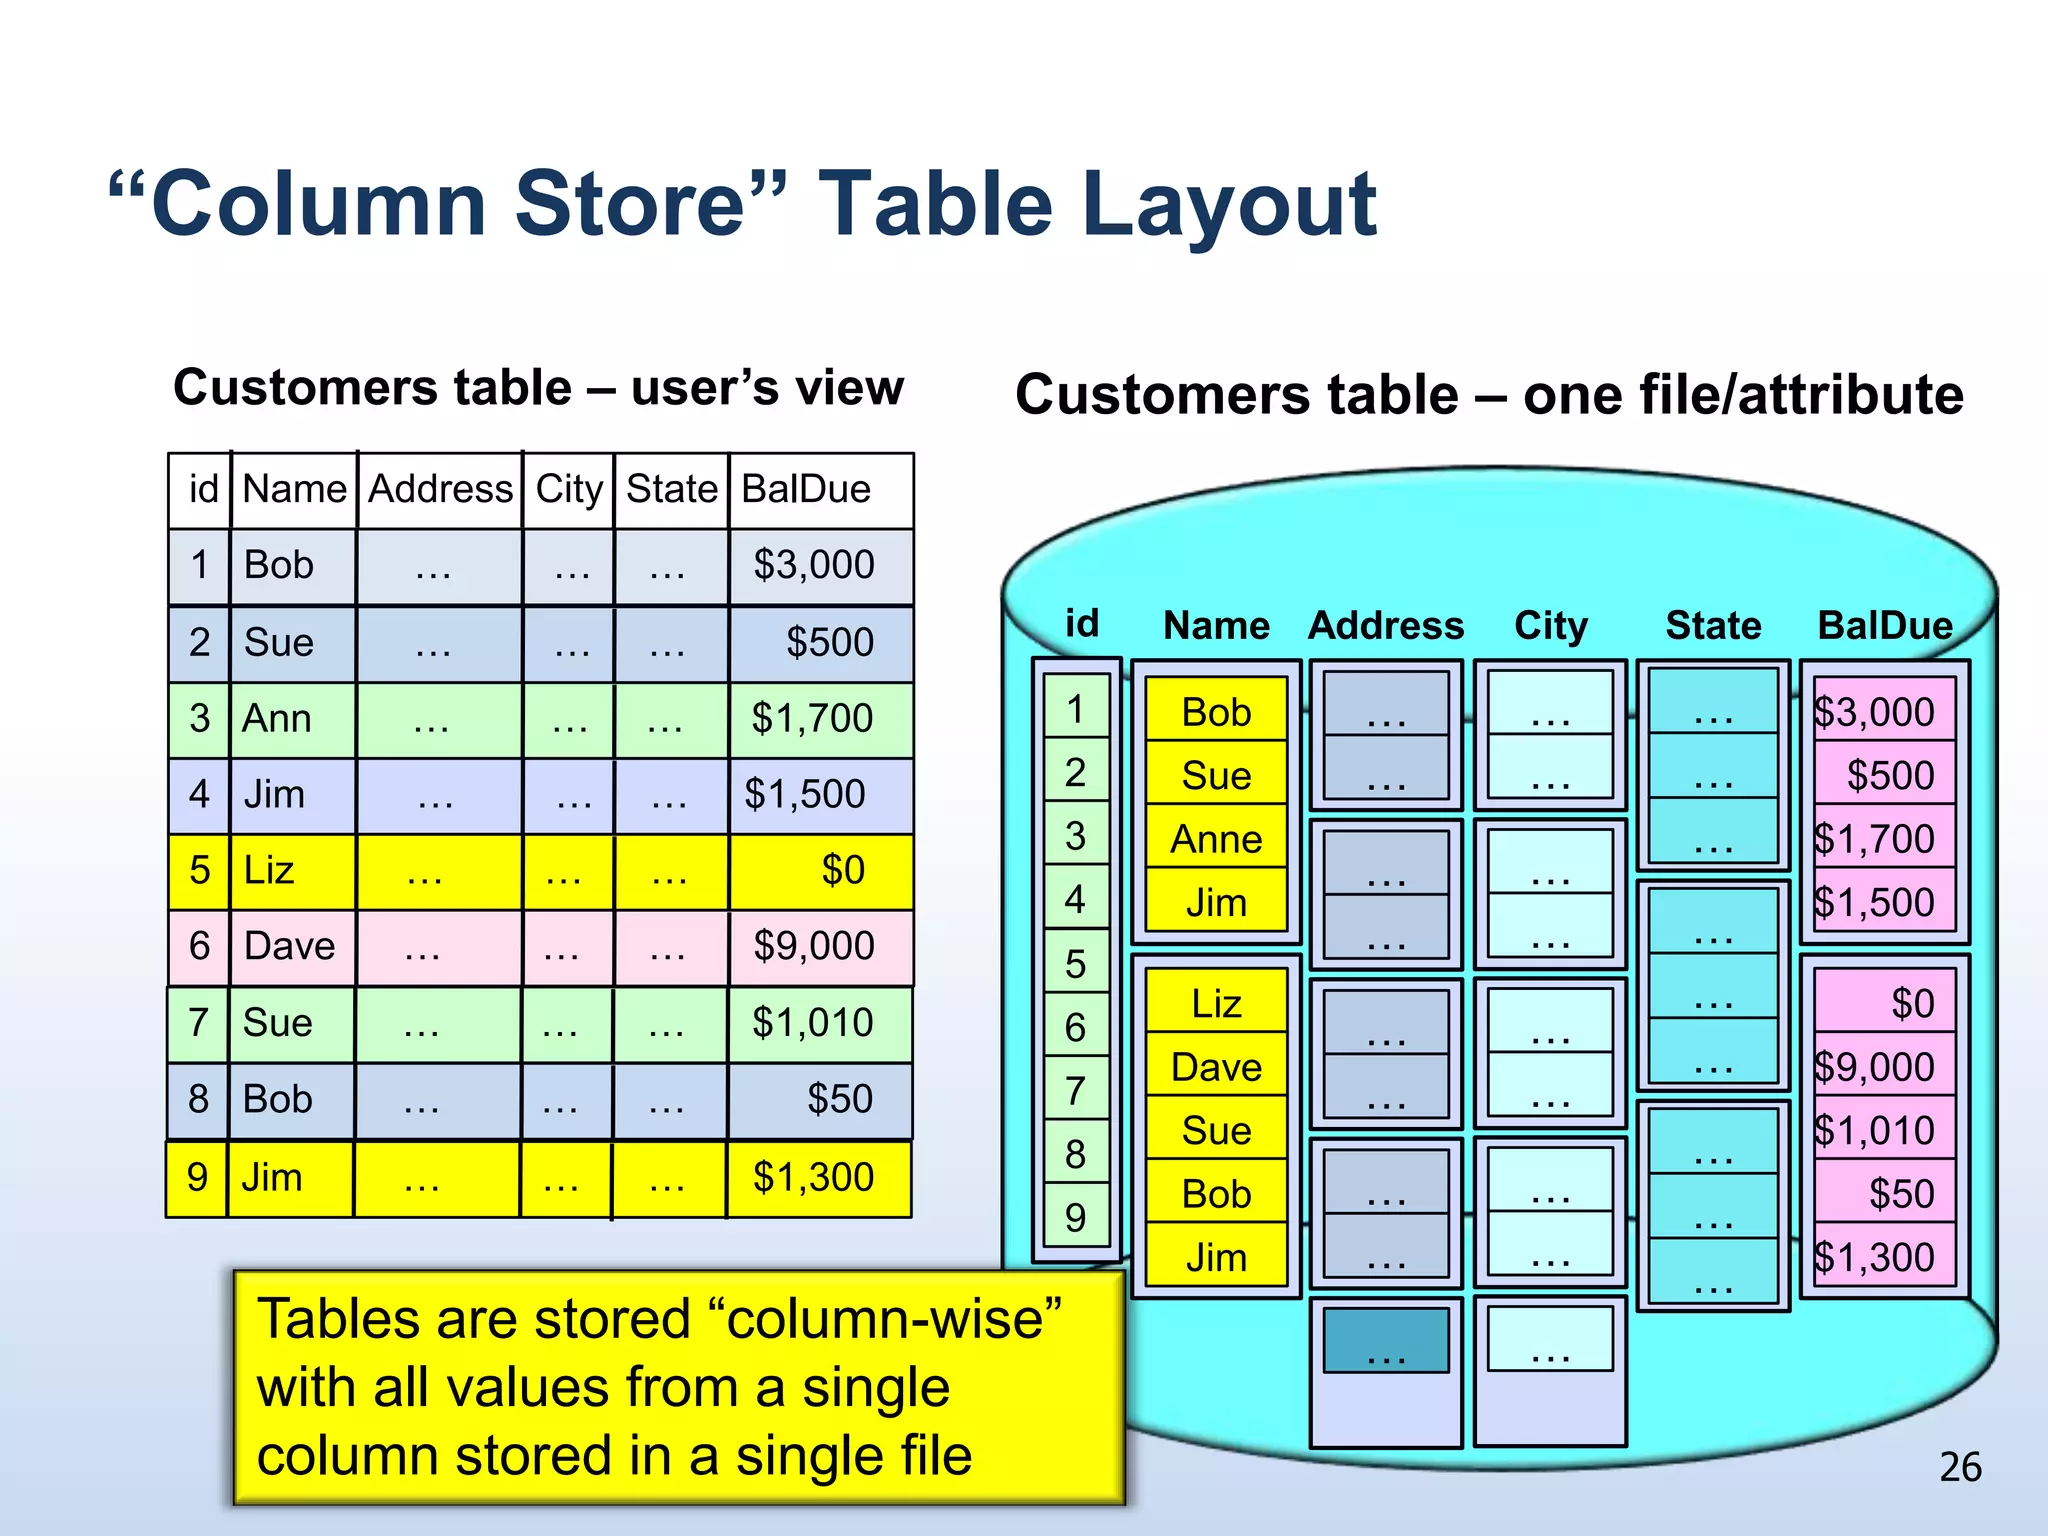
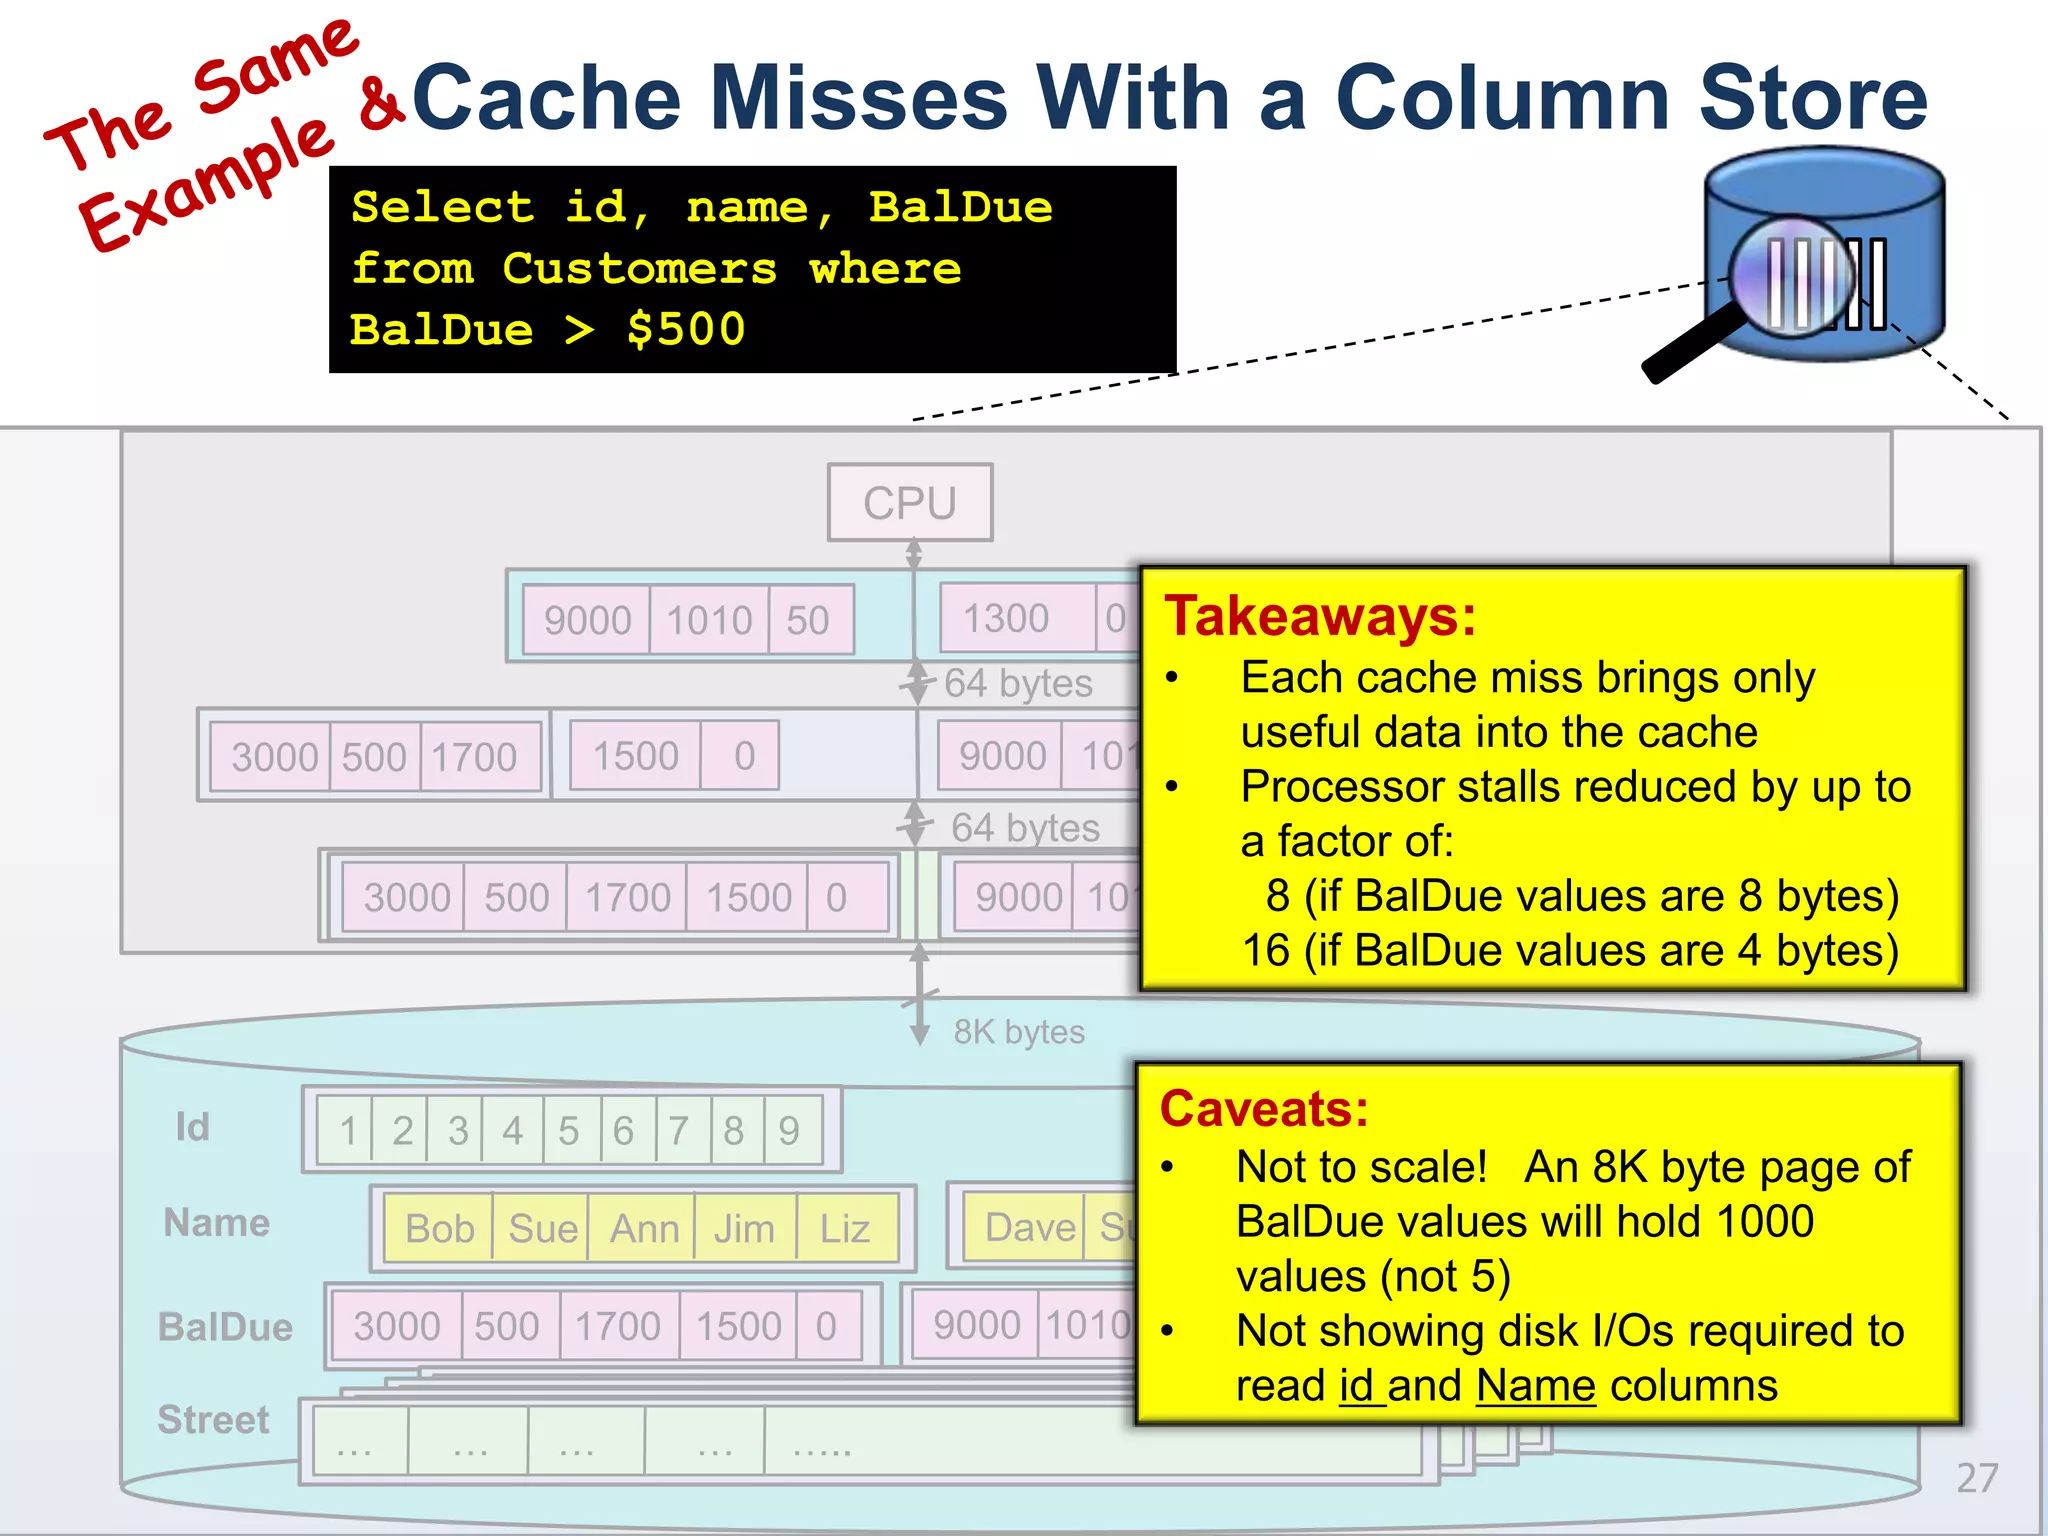
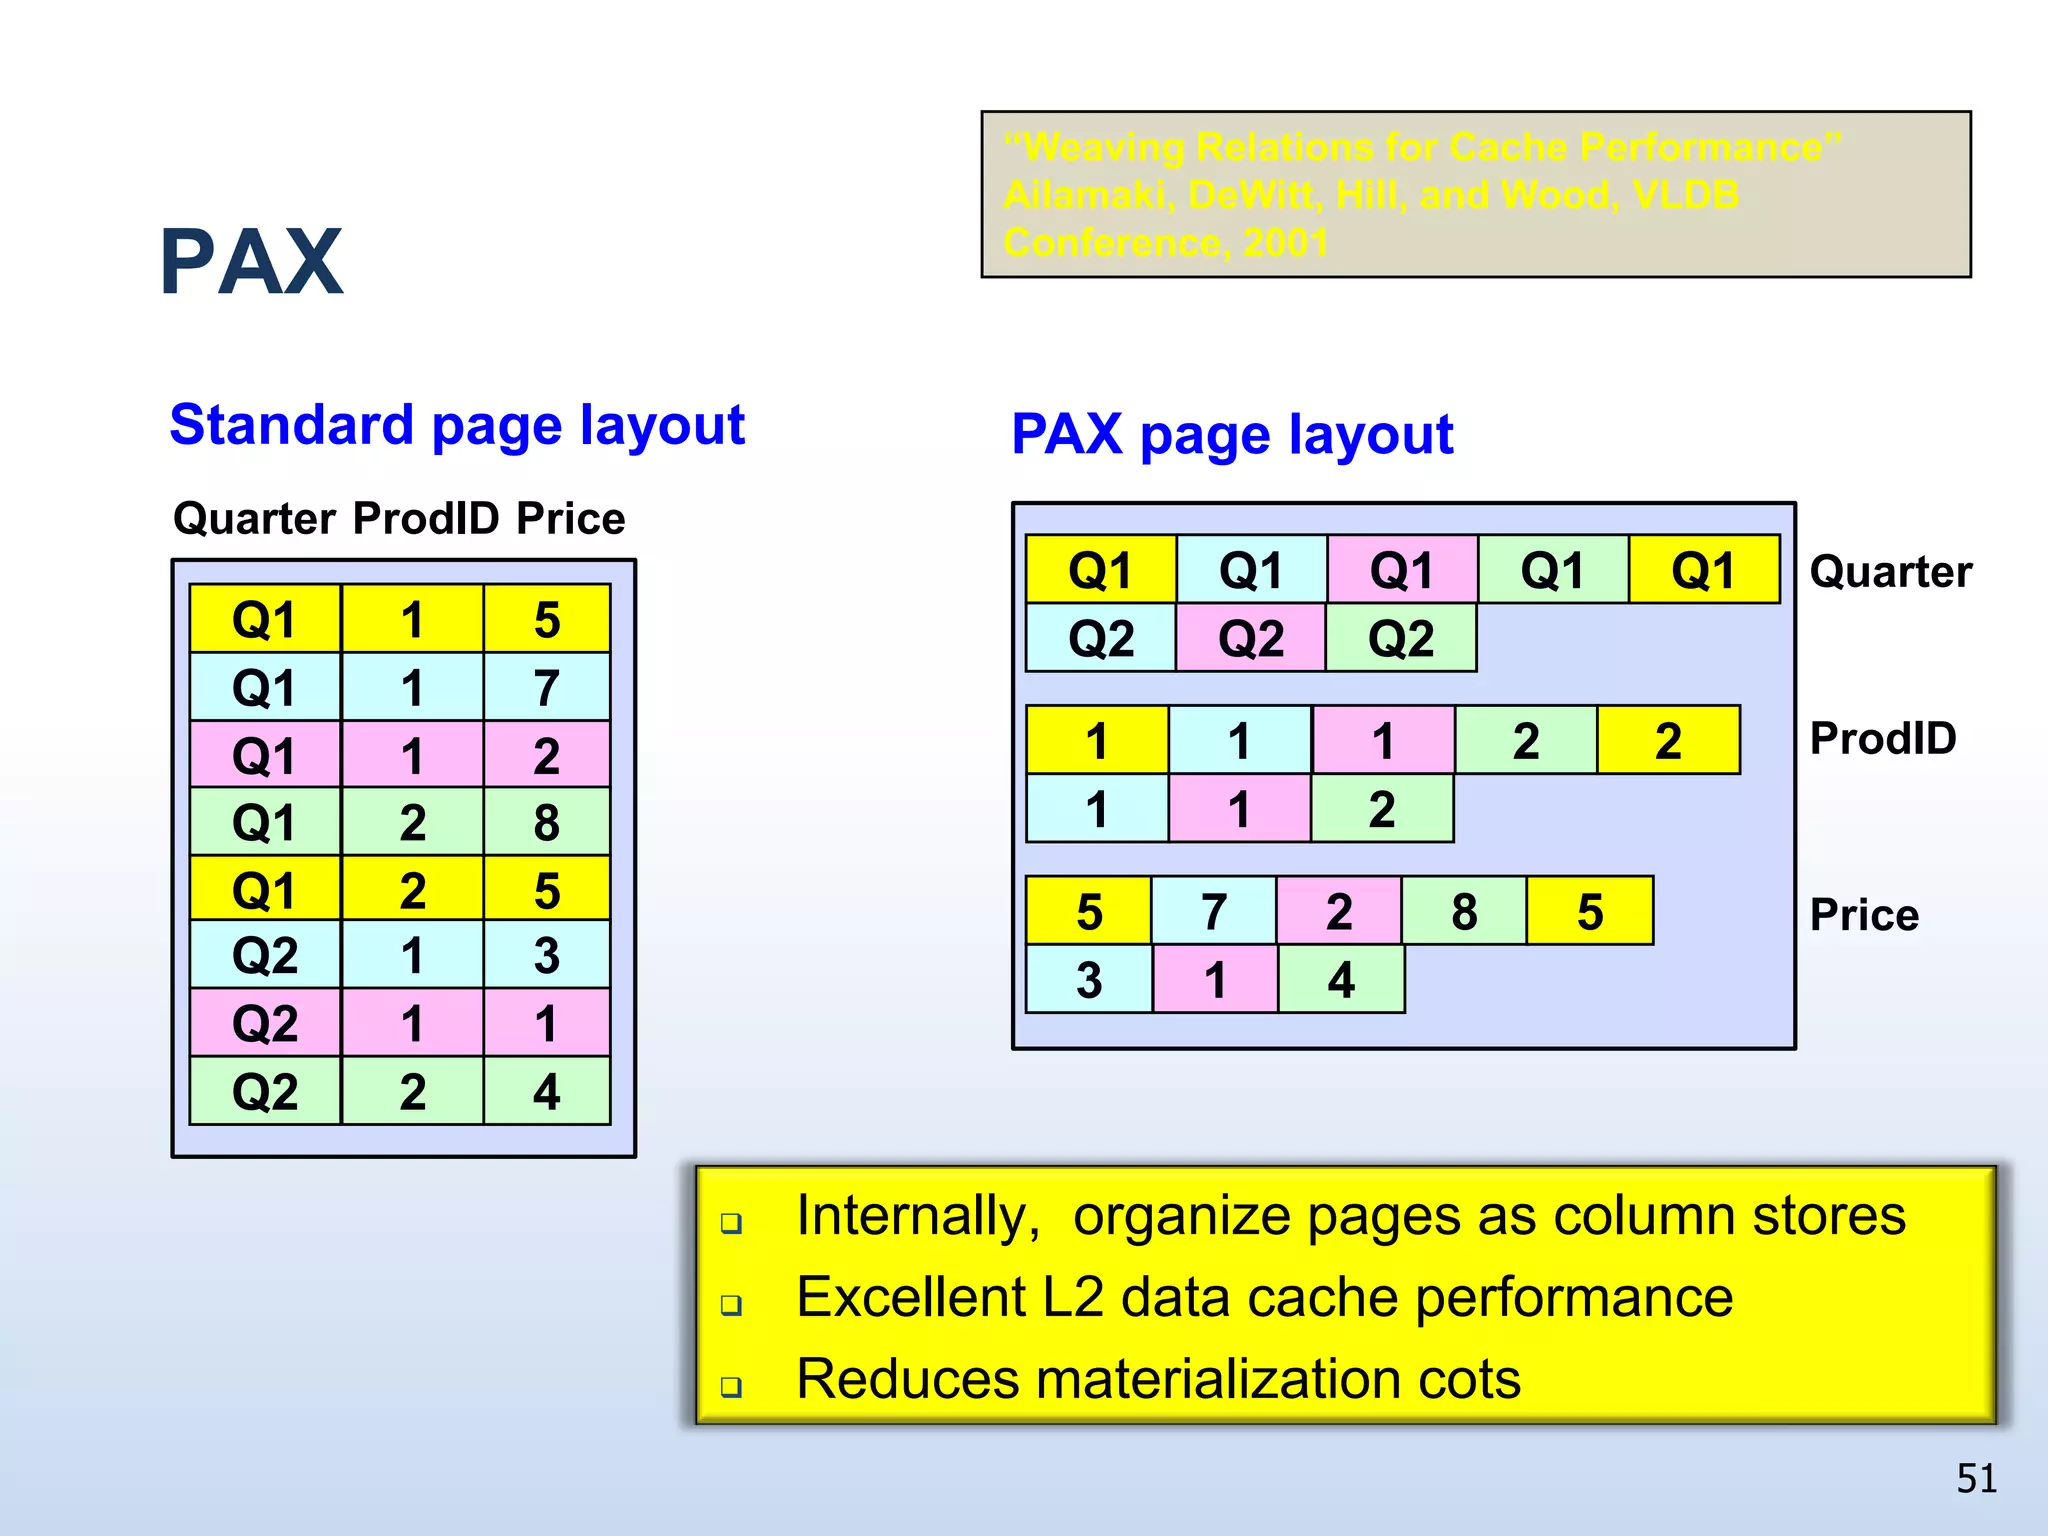
At the PASS Summit in Seattle, one of the outstanding keynote presentations was by Dr. Dave DeWitt, Microsoft Fellow, and leader of the Microsoft Jim Gray Systems Lab, in Madison, WI.
Dr. DeWitt is working on releases 1 and 2 of SQL Server Parallel Database Warehouse. In his keynote he reviewed the 30 year history of CPU, memory, and disk performance. Variations in performance gains across these subsystems, with disk performance lagging badly, have major impacts on database system performance.
Disk performance gains have been made in three areas, Capacity, Transfer Rate, and Average Seek Time. However, the gains over the last 30 years have not been uniform.
Capacity of high performance disk drives has increased by a factor of 10,000. Transfer rates have increased by a factor of 65. The average seek time has only increased by a factor of 10. Dr. DeWitt talked about the impact of these discrepancies on OLTP and Data Warehouse applications.
One of his conclusions is that some problems can be fixed through smarter software, but that “SSDs provide the only real help.”
The presentation from PiterPy Meetup #10 Hardcore about the data structures used in databases for storing and retrieving data.
Two approaches to data processing are considered: OLTP and OLAP.
SQL, NoSQL and New SQL databases are discussed.
The tradeoffs that the developers face when creating storage systems are shown.
Also the methods of data storage and interaction with the database provides CPython are considered.
The presentation and the list of references and books helps more easily navigate the data storage engines and understand which tool is better suited for a particular task.
Storeconfigs is not a popular feature among Puppet admins, because most don’t know how to use it or fear performance issues. Attend this talk to know how to enhance your Puppet deployments with easy cross-nodes interactions and collaborations, while conserving system efficiency.
Future of computing is boring (and that is exciting!) alekn
We see a trend where computing becomes a metered utility similar to how the electric grid evolved. Initially electricity was generated locally but economies of scale (and standardization) made it more efficient and economical to have utility companies managing the electric grid. Similar developments can be seen in computing where scientific grids paved the way for commercial cloud computing offerings. However, in our opinion, that evolution is far from finished and in this paper we bring forward the remaining challenges and propose a vision for the future of computing. In particular we focus on diverging trends in the costs of computing and developer time, which suggests that future computing architectures will need to optimize for developer time.
Keywords—cloud computing, future, economics, cost
The beautiful thing about software engineering is that it gives you the warm and fuzzy illusion of total understanding: I control this machine because I know how it operates. This is the result of layers upon layers of successful abstractions, which hide immense sophistication and complexity. As with any abstraction, though, these sometimes leak, and that's when a good grounding in what's under the hood pays off.
This first in what will hopefully be a series of talks covers the fundamentals of storage, providing an overview of the three storage tiers commonly found on modern platforms (hard drives, RAM and CPU cache). You'll come away knowing a little bit about a lot of different moving parts under the hood; after all, isn't understanding how the machine operates what this is all about?
-- A talk given at GeeCON Kraków 2016.
Speaker: Akira Kurogane, Senior Technical Services Engineer, MongoDB
Level: 300 (Advanced)
Track: Performance
One week your active dataset consumes 90% of available RAM. The next week it's 110%. Is that a 10% or 99% performance degradation? Let's discover what it looks like when different hardware capacity limitations are hit. For example, memory vs. disk bottlenecks, the rare CPU bottleneck and network bottlenecks, seeing what happens when you drop a crucial index during peak load, or what happens when you run multiple WiredTiger nodes on the same server without limiting their cache size.
What You Will Learn:
- Performance analysis
- Post-mortem log analysis
- Capacity planning
VLSI stands for Very Large Scale Integrated Circuits.
SSI – Small Scale Integration (50s and 60s)
1 – 10 transistors
Simple logic gates
MSI – Medium Scale Integration(70s)
10-100 transistors
logic functions, counters, etc
LSI – Large Scale Integration(80s)
100-10,000 transistors
First microprocessors on the chip
Angel Abundez of DesignMind explains how to build and automate data sets and data models in Excel using the Power BI toolset. You'll see how to pull data from a variety of on-premise and cloud data sources to familiarize yourself with the latest capabilities of Power Query and Power Pivot. Then you'll learn about the software required to automate your Power BI analysis whether you are trying to refresh your Excel workbooks on a file server, in SharePoint Online, or SharePoint. on-premise.
Microsoft SQL Server Analysis Services (SSAS) - A Practical Introduction Mark Ginnebaugh
Patrick Sheehan of Microsoft covers platform architecture, data warehousing methodology, and multi-dimensional cube development.
You will learn:
* How to develop and deploy data cubes using SQL Server Analysis Services (SSAS)
* Optimal data warehouse methodology for use with SSAS
* Tips/tricks for designing & building cubes over no warehouse/suboptimal source system (it happens)
* Cube processing types - How/why to use each
* Cube design practices + How to build and deploy cubes!
The presentation from PiterPy Meetup #10 Hardcore about the data structures used in databases for storing and retrieving data.
Two approaches to data processing are considered: OLTP and OLAP.
SQL, NoSQL and New SQL databases are discussed.
The tradeoffs that the developers face when creating storage systems are shown.
Also the methods of data storage and interaction with the database provides CPython are considered.
The presentation and the list of references and books helps more easily navigate the data storage engines and understand which tool is better suited for a particular task.
Storeconfigs is not a popular feature among Puppet admins, because most don’t know how to use it or fear performance issues. Attend this talk to know how to enhance your Puppet deployments with easy cross-nodes interactions and collaborations, while conserving system efficiency.
Future of computing is boring (and that is exciting!) alekn
We see a trend where computing becomes a metered utility similar to how the electric grid evolved. Initially electricity was generated locally but economies of scale (and standardization) made it more efficient and economical to have utility companies managing the electric grid. Similar developments can be seen in computing where scientific grids paved the way for commercial cloud computing offerings. However, in our opinion, that evolution is far from finished and in this paper we bring forward the remaining challenges and propose a vision for the future of computing. In particular we focus on diverging trends in the costs of computing and developer time, which suggests that future computing architectures will need to optimize for developer time.
Keywords—cloud computing, future, economics, cost
The beautiful thing about software engineering is that it gives you the warm and fuzzy illusion of total understanding: I control this machine because I know how it operates. This is the result of layers upon layers of successful abstractions, which hide immense sophistication and complexity. As with any abstraction, though, these sometimes leak, and that's when a good grounding in what's under the hood pays off.
This first in what will hopefully be a series of talks covers the fundamentals of storage, providing an overview of the three storage tiers commonly found on modern platforms (hard drives, RAM and CPU cache). You'll come away knowing a little bit about a lot of different moving parts under the hood; after all, isn't understanding how the machine operates what this is all about?
-- A talk given at GeeCON Kraków 2016.
Speaker: Akira Kurogane, Senior Technical Services Engineer, MongoDB
Level: 300 (Advanced)
Track: Performance
One week your active dataset consumes 90% of available RAM. The next week it's 110%. Is that a 10% or 99% performance degradation? Let's discover what it looks like when different hardware capacity limitations are hit. For example, memory vs. disk bottlenecks, the rare CPU bottleneck and network bottlenecks, seeing what happens when you drop a crucial index during peak load, or what happens when you run multiple WiredTiger nodes on the same server without limiting their cache size.
What You Will Learn:
- Performance analysis
- Post-mortem log analysis
- Capacity planning
VLSI stands for Very Large Scale Integrated Circuits.
SSI – Small Scale Integration (50s and 60s)
1 – 10 transistors
Simple logic gates
MSI – Medium Scale Integration(70s)
10-100 transistors
logic functions, counters, etc
LSI – Large Scale Integration(80s)
100-10,000 transistors
First microprocessors on the chip
Similar to PASS Summit 2009 Keynote Dave DeWitt (20)
Angel Abundez of DesignMind explains how to build and automate data sets and data models in Excel using the Power BI toolset. You'll see how to pull data from a variety of on-premise and cloud data sources to familiarize yourself with the latest capabilities of Power Query and Power Pivot. Then you'll learn about the software required to automate your Power BI analysis whether you are trying to refresh your Excel workbooks on a file server, in SharePoint Online, or SharePoint. on-premise.
Microsoft SQL Server Analysis Services (SSAS) - A Practical Introduction Mark Ginnebaugh
Patrick Sheehan of Microsoft covers platform architecture, data warehousing methodology, and multi-dimensional cube development.
You will learn:
* How to develop and deploy data cubes using SQL Server Analysis Services (SSAS)
* Optimal data warehouse methodology for use with SSAS
* Tips/tricks for designing & building cubes over no warehouse/suboptimal source system (it happens)
* Cube processing types - How/why to use each
* Cube design practices + How to build and deploy cubes!
Platfora - An Analytics Sandbox In A World Of Big DataMark Ginnebaugh
As Big Data becomes the norm in dealing with data volume, variety, and velocity, it becomes increasingly harder for the Data Analyst to understand and work with data sets. To overcome this we introduce Platfora, a Hadoop backed data analysis framework which nicely complements more traditional data warehousing and BI solutions. This presentation covers ingestion of new data and building of data sets and visualizations,in a system that requires no more work than interacting with a graphical interface. You'll see examples of peer-to-peer lending and how insights on loan applicants and their risk profiles can be quickly revealed with no ETL development or demanding data transformation.
Microsoft SQL Server Relational Databases and Primary KeysMark Ginnebaugh
SQL Server guru Ami Levin explains some of the fundamental design principles of relational databases: normalization rules, key selection, and the controversies associated with these issues from a practical perspective.
This presentation hits on the benefits and challenges of using different types of keys - natural, surrogates, artificial, and others.
Each key offers benefits from multiple aspects: data consistency, application development, maintenance, portability and performance.
Ami Levin is a Microsoft MVP and a consultant with SolidQ. Last fall he moved to California from Israel, where he led the Israeli SQL Server User Group.
DesignMind Microsoft Business Intelligence SQL ServerMark Ginnebaugh
DesignMind is a custom software firm in San Francisco specializing in SQL Server, SharePoint, .NET, and Microsoft Business Intelligence.
We're a Microsoft Certified Partner with expertise in Business Intelligence, Data Platform, Portals and Collaboration, and Custom Development. Our Business Intelligence team specializes in Enterprise Data Warehouse, Data Mart, Mobile Business Intelligence, and Self-Service BI.
San Francisco Bay Area SQL Server July 2013 meetingsMark Ginnebaugh
San Francisco Bay Area July 2013 Microsoft SQL Server and Business Intelligence meetings.
Learn more:
www.meetup.com/The-San-Francisco-SQL-Server-Meetup-Group
www.meetup.com/The-SiliconValley-SQL-Server-User-Group
www.meetup.com/San-Francisco-Bay-Area-Microsoft-BI-User-Group
Presenter: Ernest Hwang of Practice Fusion > This presentation shows how to simplify your database deployments, ensure that no database changes are overlooked, and implement unit tests using the suite of Red Gate developer tools.
You'll see how Practice Fusion streamlines database deployments in their Integration, Testing, Staging, and Production environments. This frees developers from the burden of maintaining deployment scripts, while reducing the number of overlooked breaking changes to zero.
The demo uses a Windows Azure box as the Jenkins (Continuous Integration) server and several SQL Azure databases (representing Integration and QA environments). The entire repository is hosted on GitHub (https://github.com/CF9/Databases.RGDemo), for anyone to download.
You'll learn how to:
* Add your database to source control in under five minutes
* Create a CI Job to validate your database “build”
* Deploy database changes to your environments with a mouse click
* Set up database unit testing using tSQLt
* Avoid problems when implementing Database CI in the “real-world”
Ernest Hwang is a Principal Software Engineer at Practice Fusion in San Francisco. He uses Red Gate SQL Source Control, SQL Compare, SQL Data Compare, and SQL Test to automate Practice Fusion's Continuous Integration efforts and instrument database deployments.
Presenter: Ofer Mendelevitch of Hortonworks > Learn the benefits of big data for data scientists, and how Hadoop and HDInsight fit into the modern data architecture and enable data-driven products.
You'll learn:
* What data science actually means
* The term "data products"
* The benefits of using big data for data scientists
* How Hadoop helps data scientists work with big data
* About HDInsight, the big data platform from Microsoft and Hortonworks
SQL Server implements three different physical operators to perform joins. In this presentation you'll see how each of these operators work plus its advantages and challenges.
You'll learn:
* The logic behind the optimizer's decisions
* Which operator to use for various joins using (semi) real life examples
* How to avoid common join-related pitfalls
Ami Levin is a Microsoft SQL Server MVP and a Mentor with SolidQ. For the past 14 years, he has been consulting, teaching, writing, and speaking about SQL Server worldwide.
Levin’s areas of expertise are data modeling, database design, T-SQL and performance tuning.
Before moving to California, he led the Israeli SQL Server user group (ISUG) and moderated the Hebrew MSDN SQL Server support forum. Ami is a regular speaker at Microsoft Tech-Ed Israel, Dev Academy, and other SQL Server conferences. He blogs at SQL Server Tuning Blog.
Microsoft PowerPivot & Power View in Excel 2013Mark Ginnebaugh
PowerPivot is an add-in for Excel that empowers business users to create their own tabular data models. Power View is also available in the Excel 2013 client. It was first released as a server-based report authoring tool with SQL Server 2012 and is available in SharePoint Server 2010 Enterprise.
You'll learn:
* How to work with the add-in in the Excel 2013 client
* How compelling interactive reports can be created quickly and easily
* The new PowerPivot features - including pie charts, maps, KPIs, hierarchies, drill down/drill up, and report styles
Peter Myers specializes in Microsoft Business Intelligence, and provides mentoring, technical training and course content authoring for SQL Server and Office. Peter has current SQL Server and MCT certifications, and has been a Microsoft MVP (Most Valued Professional) since 2007.
Microsoft Data Warehouse Business Intelligence Lifecycle - The Kimball ApproachMark Ginnebaugh
Data Warehouse - Business Intelligence Lifecycle Overview by Warren Thronthwaite
This slide deck describes the Kimball approach from the best-selling Data Warehouse Toolkit, 2nd Edition. It was presented to the Bay Area Microsoft Business Intelligence User Group in October 2012.
Starting with business requirements and project definition, the lifecycle branches out into three tracks: Technical, Data and Applications. You will learn:
* The major steps in the Lifecycle and what needs to happen in each one.
* Why business requirements are so important and how they influence all major decisions across the entire DW/BI system.
* Key tools for prioritizing business requirements and creating an enterprise information framework.
* How to break up a DW/BI system into doable increments that add real business value and can be completed in a reasonable time frame.
Fusion-io Memory Flash for Microsoft SQL Server 2012Mark Ginnebaugh
You've heard about Solid State Drives (SSDs), and might be using them now. To get dramatically improved IO performance, you need Flash Memory – storage that can be connected to your server’s Bus, and really maximize IO.
Fusion-io is an industry leader in this area, and Sumeet Bansal explains how to best employ this powerful technology. You'll learn:
* The many ways Flash can help your SQL Server performance, while at the same time lowering costs
* How you can use Flash optimally for your SQL Server deployment
* Easy, low risk ways to introduce ioMemory into SQL Server environments to instantly realize significant benefits.
* How to implement ioMemory optimally for the most pervasive configurations of SQL Server
Author: William Brown, Microsoft BI Specialist > This slide presentation covers Microsoft Data Mining functionality from the developer to the end user. In the past, data mining belonged to the deep technical specialist, but the current Microsoft stack allows anyone to create very powerful data mining models. Data mining allows users to find insights that are difficult or impossible to discover with traditional analysis.
You'll learn
* How to get started with Data mining
* The various data mining models and where they can be applied
* How to create models and surface the data to users
* How to use the new Excel Data mining add-in
This presentation lists upcoming events and summer 2012 virtual chapter meetings of the Professional Association for SQL Server. You will find meetings about data warehousing, Big Data, Master Data, Powershell, and virtualization.
Learn more about PASS at www.sqlpass.org
Business Intelligence Dashboard Design Best PracticesMark Ginnebaugh
Microsoft BI expert Dan Bulos spoke on Dashboard Design Best Practices to the Bay Area Microsoft Business Intelligence User Group.
This presentation shows techniques for displaying data in a dashboard for maximum impact. Dan also discusses various tools available in the Microsoft BI stack – Reporting Services, Excel, PerformancePoint and the new entry, Power View.
Take a look at Mobile BI on iPad, Windows Phone, SQL Server Reporting Services, and SharePoint with emphasis on data visualization best practices. Angel Abundez explains how design approaches change when launching mission-critical dashboards and reports on smaller screen sizes using touch-screen technology.
Presenter Angel Abundez is a Business Intelligence consultant with DesignMind in San Francisco. He focuses on Business Intelligence, Visualization, and improving business processes using Microsoft SQL Server, SharePoint, and ASP.NET. He also works with the new visualizations coming out with PowerPivot, Power View, and SharePoint. Angel is Co-Lead of the Bay Area Business Intelligence User Group and is an active speaker in the SQL Server community.
SQL Server 2012 is the most crucial release of SQL Server to-date. In this slideshow, you'll see how SQL Server 2012 supports mission critical applications 24x7 and gives significant insight into business operations. Presented by Subhash Jawahrani of Microsoft to the Silicon Valley SQL Server User Group in March 2012.
You'll learn about:
* Mission Critical Apps
* New Business Intelligence features
* Improving business agility with Cloud computing
Microsoft SQL Server 2012 Master Data ServicesMark Ginnebaugh
Author: Mark Gschwind, DesignMind
San Francisco, California
Master Data Services had a major upgrade in the SQL Server 2012 release. BI Consultant Mark Gschwind takes you through the new Excel interface, the new Silverlight look and feel, and integration improvements.
Knowing how to use this tool can be a valuable addition to your repertoire as a BI professional, allowing you to address data quality and other challenges.
Mark will show how to create a model, add columns and rows, manage security, and create hierarchies. He demos the new Excel interface and discuss how to allow you to manage master data yourself. He'll touch on how to integrate with a DW, migrating from Dev to Production.
You'll learn:
* How to let users manage dimensions and hierarchies for your DW
* How to create workflows to improve data quality in your DW
* Tips from real-life implementations to help you achieve a successful implementation
Mark Gschwind, Partner at DesignMind, is an expert on data warehousing, OLAP, and ERP migration. He has authored three enterprise data warehouses and over 80 OLAP cubes for 46 clients in a wide range of industries. Mark has certifications in SQL Server and Oracle Essbase.
This slideshow is for IT professionals, data analysts, managers, and anyone looking to drive more productivity from Excel. You will learn how you can effectively leverage the add-ins with your own data and analysis requirements.
One of the pillars of the SQL Server 2008 R2 release is Managed Self-Service BI.
Peter Myers of SolidQ will introduce:
* SQL Server PowerPivot for Excel
* SQL Server PowerPivot for SharePoint
The SQL Server PowerPivot for Excel add-in is a key offering in this pillar, and delivers an entirely new analytic experience to Excel 2010. This add-in allows analysts to load and prepare large volumes of data from various sources to create a multidimensional model. The model can be enriched with sophisticated calculations. Then the model can then be used as the source for PivotTable and PivotChart reports.
With the SQL Server PowerPivot for SharePoint add-in, the Excel workbooks that host the PowerPivot model can be cataloged in SharePoint and exposed as a data source for other Excel and Reporting Services reports. These SharePoint hosted models can then be managed by IT with scheduled data refreshes from the originating data stores.
State of ICS and IoT Cyber Threat Landscape Report 2024 previewPrayukth K V
The IoT and OT threat landscape report has been prepared by the Threat Research Team at Sectrio using data from Sectrio, cyber threat intelligence farming facilities spread across over 85 cities around the world. In addition, Sectrio also runs AI-based advanced threat and payload engagement facilities that serve as sinks to attract and engage sophisticated threat actors, and newer malware including new variants and latent threats that are at an earlier stage of development.
The latest edition of the OT/ICS and IoT security Threat Landscape Report 2024 also covers:
State of global ICS asset and network exposure
Sectoral targets and attacks as well as the cost of ransom
Global APT activity, AI usage, actor and tactic profiles, and implications
Rise in volumes of AI-powered cyberattacks
Major cyber events in 2024
Malware and malicious payload trends
Cyberattack types and targets
Vulnerability exploit attempts on CVEs
Attacks on counties – USA
Expansion of bot farms – how, where, and why
In-depth analysis of the cyber threat landscape across North America, South America, Europe, APAC, and the Middle East
Why are attacks on smart factories rising?
Cyber risk predictions
Axis of attacks – Europe
Systemic attacks in the Middle East
Download the full report from here:
https://sectrio.com/resources/ot-threat-landscape-reports/sectrio-releases-ot-ics-and-iot-security-threat-landscape-report-2024/
LF Energy Webinar: Electrical Grid Modelling and Simulation Through PowSyBl -...DanBrown980551
Do you want to learn how to model and simulate an electrical network from scratch in under an hour?
Then welcome to this PowSyBl workshop, hosted by Rte, the French Transmission System Operator (TSO)!
During the webinar, you will discover the PowSyBl ecosystem as well as handle and study an electrical network through an interactive Python notebook.
PowSyBl is an open source project hosted by LF Energy, which offers a comprehensive set of features for electrical grid modelling and simulation. Among other advanced features, PowSyBl provides:
- A fully editable and extendable library for grid component modelling;
- Visualization tools to display your network;
- Grid simulation tools, such as power flows, security analyses (with or without remedial actions) and sensitivity analyses;
The framework is mostly written in Java, with a Python binding so that Python developers can access PowSyBl functionalities as well.
What you will learn during the webinar:
- For beginners: discover PowSyBl's functionalities through a quick general presentation and the notebook, without needing any expert coding skills;
- For advanced developers: master the skills to efficiently apply PowSyBl functionalities to your real-world scenarios.
DevOps and Testing slides at DASA ConnectKari Kakkonen
My and Rik Marselis slides at 30.5.2024 DASA Connect conference. We discuss about what is testing, then what is agile testing and finally what is Testing in DevOps. Finally we had lovely workshop with the participants trying to find out different ways to think about quality and testing in different parts of the DevOps infinity loop.
UiPath Test Automation using UiPath Test Suite series, part 4DianaGray10
Welcome to UiPath Test Automation using UiPath Test Suite series part 4. In this session, we will cover Test Manager overview along with SAP heatmap.
The UiPath Test Manager overview with SAP heatmap webinar offers a concise yet comprehensive exploration of the role of a Test Manager within SAP environments, coupled with the utilization of heatmaps for effective testing strategies.
Participants will gain insights into the responsibilities, challenges, and best practices associated with test management in SAP projects. Additionally, the webinar delves into the significance of heatmaps as a visual aid for identifying testing priorities, areas of risk, and resource allocation within SAP landscapes. Through this session, attendees can expect to enhance their understanding of test management principles while learning practical approaches to optimize testing processes in SAP environments using heatmap visualization techniques
What will you get from this session?
1. Insights into SAP testing best practices
2. Heatmap utilization for testing
3. Optimization of testing processes
4. Demo
Topics covered:
Execution from the test manager
Orchestrator execution result
Defect reporting
SAP heatmap example with demo
Speaker:
Deepak Rai, Automation Practice Lead, Boundaryless Group and UiPath MVP
Why You Should Replace Windows 11 with Nitrux Linux 3.5.0 for enhanced perfor...SOFTTECHHUB
The choice of an operating system plays a pivotal role in shaping our computing experience. For decades, Microsoft's Windows has dominated the market, offering a familiar and widely adopted platform for personal and professional use. However, as technological advancements continue to push the boundaries of innovation, alternative operating systems have emerged, challenging the status quo and offering users a fresh perspective on computing.
One such alternative that has garnered significant attention and acclaim is Nitrux Linux 3.5.0, a sleek, powerful, and user-friendly Linux distribution that promises to redefine the way we interact with our devices. With its focus on performance, security, and customization, Nitrux Linux presents a compelling case for those seeking to break free from the constraints of proprietary software and embrace the freedom and flexibility of open-source computing.
Alt. GDG Cloud Southlake #33: Boule & Rebala: Effective AppSec in SDLC using ...James Anderson
Effective Application Security in Software Delivery lifecycle using Deployment Firewall and DBOM
The modern software delivery process (or the CI/CD process) includes many tools, distributed teams, open-source code, and cloud platforms. Constant focus on speed to release software to market, along with the traditional slow and manual security checks has caused gaps in continuous security as an important piece in the software supply chain. Today organizations feel more susceptible to external and internal cyber threats due to the vast attack surface in their applications supply chain and the lack of end-to-end governance and risk management.
The software team must secure its software delivery process to avoid vulnerability and security breaches. This needs to be achieved with existing tool chains and without extensive rework of the delivery processes. This talk will present strategies and techniques for providing visibility into the true risk of the existing vulnerabilities, preventing the introduction of security issues in the software, resolving vulnerabilities in production environments quickly, and capturing the deployment bill of materials (DBOM).
Speakers:
Bob Boule
Robert Boule is a technology enthusiast with PASSION for technology and making things work along with a knack for helping others understand how things work. He comes with around 20 years of solution engineering experience in application security, software continuous delivery, and SaaS platforms. He is known for his dynamic presentations in CI/CD and application security integrated in software delivery lifecycle.
Gopinath Rebala
Gopinath Rebala is the CTO of OpsMx, where he has overall responsibility for the machine learning and data processing architectures for Secure Software Delivery. Gopi also has a strong connection with our customers, leading design and architecture for strategic implementations. Gopi is a frequent speaker and well-known leader in continuous delivery and integrating security into software delivery.
Essentials of Automations: The Art of Triggers and Actions in FMESafe Software
In this second installment of our Essentials of Automations webinar series, we’ll explore the landscape of triggers and actions, guiding you through the nuances of authoring and adapting workspaces for seamless automations. Gain an understanding of the full spectrum of triggers and actions available in FME, empowering you to enhance your workspaces for efficient automation.
We’ll kick things off by showcasing the most commonly used event-based triggers, introducing you to various automation workflows like manual triggers, schedules, directory watchers, and more. Plus, see how these elements play out in real scenarios.
Whether you’re tweaking your current setup or building from the ground up, this session will arm you with the tools and insights needed to transform your FME usage into a powerhouse of productivity. Join us to discover effective strategies that simplify complex processes, enhancing your productivity and transforming your data management practices with FME. Let’s turn complexity into clarity and make your workspaces work wonders!
Elevating Tactical DDD Patterns Through Object CalisthenicsDorra BARTAGUIZ
After immersing yourself in the blue book and its red counterpart, attending DDD-focused conferences, and applying tactical patterns, you're left with a crucial question: How do I ensure my design is effective? Tactical patterns within Domain-Driven Design (DDD) serve as guiding principles for creating clear and manageable domain models. However, achieving success with these patterns requires additional guidance. Interestingly, we've observed that a set of constraints initially designed for training purposes remarkably aligns with effective pattern implementation, offering a more ‘mechanical’ approach. Let's explore together how Object Calisthenics can elevate the design of your tactical DDD patterns, offering concrete help for those venturing into DDD for the first time!
zkStudyClub - Reef: Fast Succinct Non-Interactive Zero-Knowledge Regex ProofsAlex Pruden
This paper presents Reef, a system for generating publicly verifiable succinct non-interactive zero-knowledge proofs that a committed document matches or does not match a regular expression. We describe applications such as proving the strength of passwords, the provenance of email despite redactions, the validity of oblivious DNS queries, and the existence of mutations in DNA. Reef supports the Perl Compatible Regular Expression syntax, including wildcards, alternation, ranges, capture groups, Kleene star, negations, and lookarounds. Reef introduces a new type of automata, Skipping Alternating Finite Automata (SAFA), that skips irrelevant parts of a document when producing proofs without undermining soundness, and instantiates SAFA with a lookup argument. Our experimental evaluation confirms that Reef can generate proofs for documents with 32M characters; the proofs are small and cheap to verify (under a second).
Paper: https://eprint.iacr.org/2023/1886
Encryption in Microsoft 365 - ExpertsLive Netherlands 2024Albert Hoitingh
In this session I delve into the encryption technology used in Microsoft 365 and Microsoft Purview. Including the concepts of Customer Key and Double Key Encryption.
PHP Frameworks: I want to break free (IPC Berlin 2024)Ralf Eggert
In this presentation, we examine the challenges and limitations of relying too heavily on PHP frameworks in web development. We discuss the history of PHP and its frameworks to understand how this dependence has evolved. The focus will be on providing concrete tips and strategies to reduce reliance on these frameworks, based on real-world examples and practical considerations. The goal is to equip developers with the skills and knowledge to create more flexible and future-proof web applications. We'll explore the importance of maintaining autonomy in a rapidly changing tech landscape and how to make informed decisions in PHP development.
This talk is aimed at encouraging a more independent approach to using PHP frameworks, moving towards a more flexible and future-proof approach to PHP development.
Generative AI Deep Dive: Advancing from Proof of Concept to ProductionAggregage
Join Maher Hanafi, VP of Engineering at Betterworks, in this new session where he'll share a practical framework to transform Gen AI prototypes into impactful products! He'll delve into the complexities of data collection and management, model selection and optimization, and ensuring security, scalability, and responsible use.
2. Wow. They invited me back. Thanks!! I guess some people did not fall asleep last year Still no new product announcements to make Still no motorcycle to ride across the stage No192-core servers to demo But I did bring blue books for the quiz 2
3. Who is this guy again? M Spent 32 years as a computer science professor at the University of Wisconsin Joined Microsoft in March 2008 Run the Jim Gray Systems Lab in Madison, WI Lab is closely affiliated with the DB group at University of Wisconsin 3 faculty and 8 graduate students working on projects Working on releases 1 and 2 of SQL Server Parallel Database Warehouse Tweet if you think SQL* would be a better name! 3
4. If you skipped last year’s lecture … 4 Node K Node 2 Node 1 MEM MEM MEM CPU CPU CPU Interconnection Network Talked about parallel database technology and why products like SQL Server Parallel Data Warehouse employ a shared-nothing architectures to achieve scalability to 100s of nodes and petabytes of data …
5.
6. Specialized database products for transaction processing, data warehousing, main memory resident database, databases in the middle-tier, …
7.
8. … to keep my boss happy: For the remainder of this talk I am switching to my “other” title: 7 David J. DeWittEmeritus ProfessorComputer Sciences DepartmentUniversity of Wisconsin
9. Talk Outline Look at 30 years of technology trends in CPUs, memories, and disks Explain how these trends have impacted database system performance for OLTP and decision support workloads Why these trends are forcing DBMS to evolve Some technical solutions Summary and conclusions 8
10. 9 Query engine Buffer pool Time travel back to 1980 Dominate hardware platform was the Digital VAX 11/780 1 MIPS CPU w. 1KB of cache memory 8 MB memory (maximum) 80 MB disk drives w. 1 MB/second transfer rate $250K purchase price! INGRES & Oracle were the dominant vendors Same basic DBMS architecture as is in use today
11. Since 1980 Today Basic RDMS design is essentially unchanged Except for scale-out using parallelism But the hardware landscape has changed dramatically: 10 Today 1980 Design Circa 1980 RDBMS 10,000X 2,000X Disks Disks CPU CPU 1,000X 1,000X 80 MB 800 GB 2 GIPS 1 MIPS CPU Caches Memory Memory CPU Caches 1 MB 2 MB/CPU 1 KB 2 GB/CPU
12. A little closer look at 30 year disk trends Capacities: 80 MB 800 GB - 10,000X Transfer rates: 1.2 MB/sec 80 MB/sec - 65X Avg. seek times: 30 ms 3 ms - 10X (30 I/Os/sec 300 I/Os/sec) The significant differences in these trends (10,000X vs. 65X vs. 10X) have had a huge impact on both OLTP and data warehouse workloads (as we will see) 11
13.
14. Fastest system was IBM’s IMS Fastpath DBMS running on a top-of-the-line IBM 370 mainframe at 100 TPS with 4 disk I/Os per transaction:
23. OLTP Takeaway The benefits from a 1,000x improvement in CPU performance and memory sizes are almost negated bythe 10X in disk accesses/second Forcing us to run our OLTP systems with 1000s of mostly empty disk drives No easy software fix, unfortunately SSDs provide the only real hope 15
24. Turning to Data Warehousing Two key hardware trends have had a huge impact on the performance of single box relational DB systems: The imbalance between disk capacities and transfer rates The ever increasing gap between CPU performance and main memory bandwidth 16
25. Looking at Disk Improvements Incredibly inexpensive drives (& processors) have made it possible to collect, store, and analyze huge quantities of data 17 Over the last 30 years Capacity: 80MB 800GB 10,000x Transfer Rates: 1.2MB/sec 80MB/sec 65x But, consider the metric transfer bandwidth/byte 1980: 1.2 MB/sec / 80 MB = 0.015 2009: 80 MB/sec / 800,000 MB =.0001 When relative capacities are factored in, drives are 150X slower today!!!
26. Another Viewpoint 1980 30 random I/Os/sec @ 8KB pages 240KB/sec Sequential transfers ran at 1.2 MB/sec Sequential/Random 5:1 2009 300 random I/Os/sec @ 8KB pages 2.4 MB/sec Sequential transfers run at 80 MB/sec Sequential/Random 33:1 Takeaway: DBMS must avoid doing random disk I/Os whenever possible 18
39. Why So Many Stalls? L1 instruction cache stalls Combination of how a DBMS works and the sophistication of the compiler used to compile it Can be alleviated to some extent by applying code reorganization tools that rearrange the compiled code SQL Server does a much better job than DB2 at eliminating this class of stalls L2 data cache stalls Direct result of how rows of a table have been traditionally laid out on the DB pages Layout is technically termed a row-store 22
40. 23 “Row-store” Layout As rows are loaded, they are grouped into pages and stored in a file If average row length in customer table is 200 bytes, about 40 will fit on an 8K byte page Customers Table 6 Dave … … … $9,000 6 Dave … … … $9,000 2 Sue … … … $500 3 Ann … … … $1,700 4 Jim … … … $1,500 5 Liz … … … $0 7 Sue … … … $1,010 8 Bob … … … $50 9 Jim … … … $1,300 2 Sue … … … $500 3 Ann … … … $1,700 4 Jim … … … $1,500 5 Liz … … … $0 7 Sue … … … $1,010 8 Bob … … … $50 9 Jim … … … $1,300 id Name Address City State BalDue 1 Bob … … … $3,000 1 Bob … … … $3,000 Page 1 Nothing special here. This is the standard way database systems have been laying out tables on disk since the mid 1970s. But technically it is called a “row store” Page 2 Page 3
41.
42.
43. Row Store Design Summary 25 Can incur up to one L2 data cache miss per row processed if row size is greater than the size of the cache line DBMS transfers the entire row from disk to memory even though the query required just 3 attributes Design wastes precious disk bandwidth for read intensive workloads Don’t forget 10,000X vs. 65X Is there an alternative physical organization? Yes, something called a column store
44. “Column Store” Table Layout id BalDue State City Address Name $3,000 Bob Customers table – user’s view Customers table – one file/attribute $500 Sue $1,700 Anne $1,500 Jim 6 Dave … … … $9,000 2 Sue … … … $500 3 Ann … … … $1,700 4 Jim … … … $1,500 5 Liz … … … $0 7 Sue … … … $1,010 8 Bob … … … $50 9 Jim … … … $1,300 id Name Address City State BalDue 1 Bob … … … $3,000 1 2 … … … … … … … … 3 … … … … … … … … 4 5 $0 Liz 6 $9,000 Dave 7 $1,010 Sue 8 $50 … … … Bob … … … … … … 9 $1,300 Jim … … Tables are stored “column-wise” with all values from a single column stored in a single file 26
45.
46.
47. Not showing disk I/Os required to read id and Name columns Id 1500 0 1500 0 Bob Sue Ann Jim Liz Name Dave Sue Bob Jim BalDue 1 2 3 4 5 6 7 8 9 Street
48. A Concrete Example Assume: Customer table has 10M rows, 200 bytes/row (2GB total size) Id and BalDue values are each 4 bytes long, Name is 20 bytes Query: Select id, Name, BalDue from Customer where BalDue > $1000 Row store execution Scan 10M rows (2GB) @ 80MB/sec = 25 sec. Column store execution Scan 3 columns, each with 10M entries 280MB@80MB/sec = 3.5 sec. (id 40MB, Name 200MB, BalDue 40MB) About a 7X performance improvement for this query!! But we can do even better using compression 28
49. Summarizing: Storing tables as a set of columns: Significantly reduces the amount of disk I/O required to execute a query “Select * from Customer where …” will neverbe faster Improves CPU performance by reducing memory stalls caused by L2 data cache misses Facilitates the application of VERY aggressive compression techniques, reducing disk I/Os and L2 cache misses even further 29
56. Alternative B-Tree representations 33 Dense B-tree on RowID – one entry for each value in column Quarter RowID Q1 1 … … Q1 2 Q1 3 Q1 4 Q1 5 301 Q2 302 Q2 302 Q2 302 Q2 1 Q1 2 Q1 3 Q1 4 Q1 … … 1 Q1 301 Q2 956 Q3 1501 Q4 … … Q1 6 Sparse B-tree on RowID – one entry for each group of identical column values Q1 7 … … Q2 301 300 … … Q2 302 1500 Q2 303 Q2 304 … …
57. Positional Representation Each column stored as a separate file with values stored one after another No typical “slotted page” indirection or record headers Store only column values, no RowIDs Associated RowIDs computed during query processing Aggressively compress 34 ProdID Quarter Price 1 Q1 5 1 Q1 5 ProdID Quarter Price 1 Q1 7 1 Q1 7 1 Q1 2 1 Q1 2 1 Q1 9 1 Q1 9 1 Q1 6 1 Q1 6 2 Q1 8 2 Q1 8 2 Q1 5 2 Q1 5 … … … … … … 1 Q2 3 1 Q2 3 1 Q2 8 1 Q2 8 1 Q2 1 1 Q2 1 2 Q2 4 2 Q2 4 … … … … … …
58. 35 Compression in Column Stores Trades I/O cycles for CPU cycles Remember CPUs have gotten 1000X faster while disks have gotten only 65X faster Increased opportunities compared to row stores: Higher data value locality Techniques such as run length encoding far more useful Typical rule of thumb is that compression will obtain: a 10X reduction in table size with a column store a 3X reduction with a row store Can use extra space to store multiple copies of same data in different sort orders. Remember disks have gotten 10,000X bigger.
60. Bit-Vector Encoding ProdID ID: 1 … ID: 3 ID: 2 1 1 0 0 0 For each unique value, v, in column c, create bit-vector b: b[i] = 1 if c[i] = v 1 1 0 0 0 1 1 0 0 0 1 1 0 0 0 1 1 0 0 0 2 0 0 0 1 2 0 0 0 1 Effective only for columns with a few unique values If sparse, each bit vector can be compressed further using RLE … … … … … 1 1 0 0 0 1 1 0 0 0 2 0 0 0 1 3 0 0 1 0 … … … … … 37
61. Dictionary Encoding Quarter Since only 4 possible values can actually be encoded, need only 2 bits per value 0 1 3 Quarter 0 Then, use dictionary to encode column Q1 2 Q2 0 Q4 0 Q1 0 Q3 1 Q1 3 2 Q1 2 Q1 Dictionary Q2 0: Q1 Q4 1: Q2 Q3 2: Q3 Q3 For each unique value in the column create a dictionary entry … 3: Q4 38
62.
63. Cannot use RLE on either Quarter or ProdID columns
64. In general, column stores compress 3X to 10X better than row stores except when using exotic but very expensive techniques5 Q1 2 5 1 2 5 … … … … … … 3 Q2 1 3 2 1 3 8 Q2 1 8 2 1 8 1 Q2 1 1 2 1 1 4 Q2 2 4 2 2 4 … … … … … … 39
65. Column Store Implementation Issues Column-store scanners vs. row-store scanners Materialization strategies Turning sets of columns back into rows Operating directly on compressed data Updating compressed tables 40
66. Column-Scanner Implementation SELECT name, age FROM CustomersWHERE age > 40 Column Store Scanner Row Store Scanner Joe 45 … … Joe 45 Filter names by position … … Scan Apply predicate Age > 45 POS 1 45 Joe Sue … Scan … Direct I/O Apply predicate Age > 45 Scan Read 8K page of data 1 Joe 45 2 Sue 37 45 37 … … … … Column reads done in 1+MB chunks 41 41
67. Materialization Strategies In “row stores” the projection operator is used to remove “unneeded” columns from a table Generally done as early as possible in the query plan Columns stores have the opposite problem – when to “glue” “needed” columns together to form rows This process is called “materialization” Early materialization:combine columns at beginning of query plan Straightforward since there is a one-to-one mapping across columns Late materialization: wait as long as possible before combining columns More complicated since selection and join operators on one column obfuscates mapping to other columns from same table 42
68. Early Materialization 3 93 Project on (custID, Price) Select SUM 2 7 2 4 3 13 1 4 3 13 1 4 3 13 SELECT custID, SUM(price) FROM Sales WHERE (prodID = 4) AND (storeID = 1) GROUP BY custID 3 42 3 4 3 80 3 80 1 4 3 80 1 4 Construct Strategy: Reconstruct rows before any processing takes place Performance limited by: Cost to reconstruct ALL rows Need to decompress data Poor memory bandwidth utilization (4,1,4) 2 2 7 1 3 13 prodID 3 3 42 1 3 80 storeID custID price 43
69. SELECT custID, SUM(price) FROM Sales WHERE (prodID = 4) AND (storeID = 1) GROUP BY custID Late Materialization 3 13 3 80 3 93 SUM Select prodId = 4 Select storeID = 1 AND Construct 13 3 80 3 Scan and filter by position Scan and filter by position (4,1,4) 2 2 7 1 0 0 1 3 13 1 1 1 prodID 3 3 42 1 0 0 1 3 80 1 1 1 storeID custID price 44
73. For queries w/ joins, rows should be materialized before the join is performedThere are some special exceptions to this for joins between fact and dimension tables In a parallel DBMS, joins requiring redistribution of rows between nodes must be materialized before being shuffled 46
74. Operating Directly on Compressed Data Compression can reduce the size of a column by factors of 3X to 100X – reducing I/O times Execution options Decompress column immediately after it is read from disk Operate directly on the compressed data Benefits of operating directly on compressed data: Avoid wasting CPU and memory cycles decompressing Use L2 and L1 data caches much more effectively Reductions of 100X factors over a row store Opens up the possibility of operating on multiple records at a time. 47
77. Typical solution isUse delta “tables” to hold inserted and deleted tuples Treat updates as a delete followed by an inserts Queries run against base columns plus +Inserted and –Deleted values 49 ProdID Quarter Price 5 (Q1, 1, 300) 7 (1, 1, 5) (Q2, 301, 350) 2 … (2, 6, 2) 9 (Q3, 651, 500) 6 (Q4, 1151, 600) 8 (1, 301, 3) 5 … … (2, 304, 1) 3 8 1 4 …
78. Hybrid Storage Models 50 Storage models that combine row and column stores are starting to appear in the marketplace Motivation: groups of columns that are frequently accessed together get stored together to avoid materialization costs during query processing Example: EMP (name, age, salary, dept, email) Assume most queries access either (name, age, salary) (name, dept, email) Rather than store the table as five separate files (one per column), store the table as only two files. Two basic strategies Use standard “row-store” page layout for both group of columns Use novel page layout such as PAX
80. Key Points to Remember for the Quiz At first glance the hardware folks would appear to be our friends 1,000X faster processors 1,000X bigger memories 10,000X bigger disks Huge, inexpensive disks have enabled us to cost-effectively store vast quantities of data On the other hand ONLY a 10X improvement in random disk accesses 65X improvement in disk transfer rates DBMS performance on a modern CPU is very sensitive to memory stalls caused by L2 data cache misses This has made querying all that data with reasonable response times really, really hard 52
81. Key Points (2) Two pronged solution for “read” intensive data warehousing workloads Parallel database technology to achieve scale out Column stores as a “new” storage and processing paradigm Column stores: Minimize the transfer of unnecessary data from disk Facilitate the application of aggressive compression techniques In effect, trading CPU cycles for I/O cycles Minimize memory stalls by reducing L1 and L2 data cache stalls 53
82. Key Points (3) But, column stores are: Not at all suitable for OLTP applications or for applications with significant update activity Actually slower than row stores for queries that access more than about 50% of the columns of a table which is why storage layouts like PAX are starting to gain traction Hardware trends and application demands are forcing DB systems to evolve through specialization 54
83. What are Microsoft’s Column Store Plans? What I can tell you is that we will be shipping VertiPaq, an in-memory column store as part of SQL Server 10.5 What I can’t tell you is what we might be doing for SQL Server 11 But, did you pay attention for the last hour or were you updating your Facebook page? 55
84. Many thanks to: IL-Sung Lee (Microsoft), Rimma Nehme (Microsoft), Sam Madden (MIT), Daniel Abadi (Yale), NatassaAilamaki (EPFL - Switzerland) for their many useful suggestions and their help in debugging these slides Daniel and Natassa for letting me “borrow” a few slides from some of their talks Daniel Abadi writes a great db technology blog. Bing him!!! 56