1. Introduction
When designing an instrument, the first thing to consider is the science goal. For example,
a possible goal might be to catalog the spectral types of various stars. To that end, one can
perform spectroscopy over the visible wavelengths. A low-resolution spectrograph can
accomplish this task. The resources necessary to build a spectrograph, however, are often
exorbitant. Custom lenses can cost upwards of twenty thousand dollars and can take months to
design and build. High quality CCD cameras can cost fifty thousand dollars. The expensive
CCDs do offer superior quantum efficiency, and the custom lenses would provide extensive
wavelength coverage. The coverage is wasted, however, outside of the visible range and that
level of quantum efficiency simply is not necessary to accomplish all science goals.
Commercial camera lenses and lower-quality CCDs can provide enough throughput over a
large enough spectral range to perform the spectroscopy at a fraction of the cost, both in money
and time.
Acquisition and Guide Camera (AGC)
The Acquisition and Guide Camera (AGC) provides the user the ability to manually track a target star. It
is housed inside of an aluminum case and is attached to the telescope’s interface plate. Light enters the
aperture in the attachment plate and strikes the dichroic. The dichroic reflects visible light while allowing
infrared light to be transmitted to the guidance CCD. The infrared light and the camera operation
software, CCDOps, create an image of the field of view that allows the user to guide and track. The
reflected visible light is directed into a fiber optic bundle attached to pAggieSpec. The dark material on
the inside of the case serves to lessen reflected and scattered light inside the apparatus.
Figure 3. The Acquisition and Guide Camera
Spectrograph Testing
We used Python scripts to run tests to investigate various aspects of the spectrograph such
as optimal focal lengths of the lenses, estimations of the throughput at different wavelengths,
and optimal distances between components.
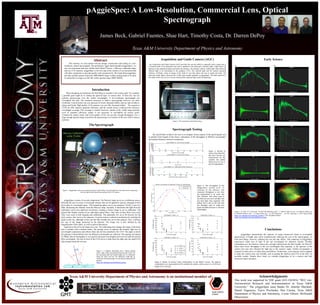
Early Science
A.) B.)
C.) D.)
E.) F.)
G.) H.)
I.) J.)
Figure 7. A.) FK5 777 (A2Ia Star) B.) BS7106 (B8II-IIIep Star) C.) BS6779 (B9.5V Star) D.) BS8232 (G0Ib star)
E.) BS8308 (K2Ib-II star) F.) Vega (A0Va star) G.) M57 Spectrum H.) M27 Spectrum I.) M57 Ring Nebula
(https://en.wikipedia.org/wiki/Ring_Nebula) J.) M27 Dumbbell Nebula
(https://en.wikipedia.org/wiki/Dumbbell_Nebula)
Conclusions
pAggieSpec demonstrates the capacity of using commercial lenses to accomplish
spectroscopy of bright stars while simultaneously reducing the cost of the spectrograph. As
with most things, however, reducing the cost has side effects. This rendering of pAggieSpec
experiences major loss of light in the red wavelengths for unknown reasons. Possible
explanations are: the dichroic reduces the red light reflected into the fiber bundle, the Nikon™
lenses have lower throughput in the red wavelengths than expected, or the aperture of the
camera lens may have blocked the light due to the camera’s angle. Further investigation is
required to either prove or refute these possibilities. Furthermore, some features can be updated
to make the system more user friendly, such as putting the dichroic and CCD in the AGC on
movable mounts. Despite these issues we consider pAggieSpec to be a success and look
forward to future iterations.
Acknowledgments
This work was supported by NSF grant AST-1263034, “REU site:
Astronomical Research and Instrumentation at Texas A&M
University.” The pAggieSpec team thanks Dr. Jennifer Marshall,
Daniel Nagasawa, Travis Prochaska, Don Carona, Texas A&M
Department of Physics and Astronomy, Coyne Gibson, McDonald
Observatory.
Texas A&M University Department of Physics and Astronomy is an institutional member of:
pAggieSpec: A Low-Resolution, Commercial Lens, Optical
Spectrograph
James Beck, Gabriel Fuentes, Shae Hart, Timothy Costa, Dr. Darren DePoy
Texas A&M University Department of Physics and Astronomy
Abstract
This summer, we were tasked with the design, construction and testing of a low-
resolution, optical spectrograph. The preliminary Aggie Spectrograph (pAggieSpec), is a
low-cost instrument that uses off-the-shelf Nikon™ lenses, a Mercury calibration lamp,
and two CCD cameras. pAggieSpec is the first step in the creation of an instrument that
will allow institutions to provide quality tools inexpensively. We found that pAggieSpec
provides reliable spectra within the 4000-6000Å range. Further testing needs to be done
to extend the coverage over the full visible spectral range (4000-7000Å).
The Spectrograph
Figure
1
. pAggieSpec with each component marked. Light follows the path marked by the white arrows originating
from the optical fiber bundle and ending at the CCD camera.
Figure
2.
A
diagram
illustra2ng
how
a
blazed
gra2ng
works.
Light
strikes
the
gra2ng
along
the
path
of
the
red
line
associated
with
the
incident
angle
(α).
It
is
diffracted
along
the
other
red
line,
the
diffrac2on
angle
(β).
θB
represents
the
blazed
angle.
d
is
the
distance
between
the
grooves.
hHps://en.wikipedia.org/wiki/Blazed_gra2ng
Figure
5.
The
throughput
of
the
pAggieSpec
system
prior
to
inclusion
of
the
dichroic.
The
measured
throughput
is
less
than
the
hypothe2cal
in
all
cases.
We
find,
however,
that
when
used
in
the
field
we
lost
more
red
light
and
less
blue
light
than
expected.
We
believe
this
is
due
to
the
fact
that
the
flashlight
used
to
make
this
graph
had
liHle
emission
in
the
blue
wavelengths.
Figure
4.
Results
of
various
focusing
tests.
The
best
focuses
are
represented
by
the
smallest
line
widths
which
occur
at
2.0,
0,
and
42
respec2vely.
Figure
6.
Results
of
various
f-‐stop
combina2ons
on
the
Nikon™
lenses.
The
op2mal
combina2ons
are
represented
by
the
smallest
slit
widths,
which
occurs
at
a
CCD
focal
length
of
2
in
all
cases.
pAggieSpec consists of several components. The Mercury lamp serves as a calibration source,
allowing the user to create a wavelength solution that can be applied to spectra, changing it from
pixel space to wavelength space.. The integrating sphere serves two purposes. Firstly, it acts as a
filter, decreasing the intensity from the Mercury lamp. Secondly, it transforms the light from the
calibration source into spherical wavefronts, creating a cleaner image to use in calibration. The
optical fiber bundle consists of ten individual optical fibers. Only nine of these fibers were used.
They were used in both imaging and calibration. The adjustable slit, set at 40 microns for the
early science, also serves a few purposes. It can be used as a selection mechanism by isolating the
target on the sky, although in this case the fiber bundle also serves this purpose. Also, it defines
the size of the image projected on the detector. The image size is also defined by the
magnification of the optics, as well as optical aberrations.
Light leaves the slit in the shape of a cone. The collimating lens changes the shape of the beam
into a cylinder with a defined radius. The grating serves to separate the incident light into its
wavelength components and reflects them into the lens attached to the CCD. The angle at which
the grating is blazed defines how the different wavelengths are reflected. This grating was blazed
at 500nm, thus its throughput is very good in the green wavelengths and worse at both the red and
blue wavelengths. The lens in front of the CCD serves to help focus the light onto the small CCD
chip located inside the red case.