Download as PPS, PPTX


![Price experience learning curve d [µm] = 400 300 200 100 50 cell [%] = 10 15 18 20 22% (25%) [€/W p ] 100 10 1 1980 1990 2000 2004 Installed Peak Power (comulated) [GWp] 10 -1 10 Graph: G. Willeke, ISE (30%) 2020 2010 1 10 -2 10 -3 10 -4 10 2 10 3](https://image.slidesharecdn.com/p3witterb819/85/P3_Witter_b-6-320.jpg)
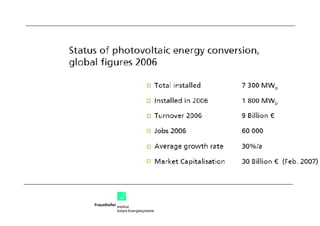
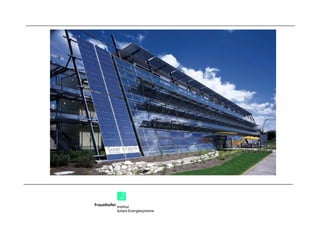

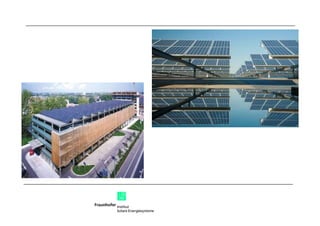
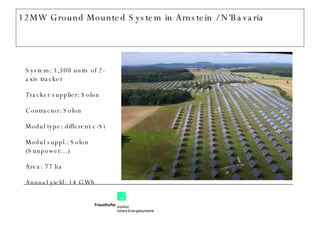

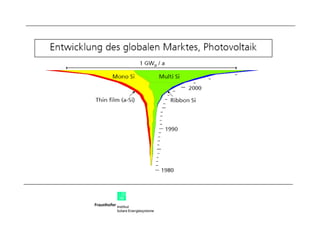
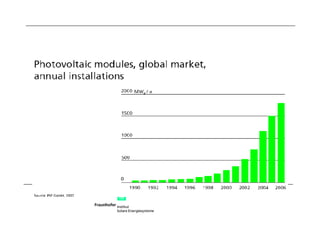
Photovoltaics have become a versatile and attractive technology for generating electricity from sunlight. The cost of photovoltaic systems has decreased dramatically from over $100 per watt in 1980 to just $1 per watt in 2004 due to increases in production volumes and improvements in manufacturing processes. As a result, the cumulative installed global peak power capacity of photovoltaics grew from 10 megawatts in 1990 to over 10 gigawatts in 2010. A 12 megawatt ground-mounted solar photovoltaic system in Germany uses over 1,500 solar panels on two-axis trackers to generate about 14 gigawatt-hours of electricity annually across 77 hectares of land.


![Getting Started with Apache Spark: Big Data Made Simple [Free Meetup]](https://cdn.slidesharecdn.com/ss_thumbnails/apachesparkgettingstarted-260203175547-8361bcc3-thumbnail.jpg?width=640&height=640&fit=bounds)


