Overview of Performance Based Design and AIT Experience
The document outlines the Asian Institute of Technology's (AIT) strong focus on structural engineering, emphasizing advancements in technology and research for resilient structures. It highlights key challenges and methodologies for tall buildings, including performance-based design approaches in response to increasing urbanization and natural hazards. Overall, the document advocates for innovative structural solutions to meet safety and performance standards in building design.
2
• Located 42km from central Bangkok
• 330 acre (130 Ha) green campus
• Adjacent to Thammasat University &
Thailand Science Park, Thailand’s
National Science and Technology
Development Agency (NSTDA)
• Home to 2500+ faculty, staff, students
from 50+ countries
AIT Campus
2
5
Pls replace thetext in the circle with our
mission (next slide)
“Building upon
AIT schools, labs, research
centers, and alumni resources
to advance technological
development of the region”
10
100
200
300
metres
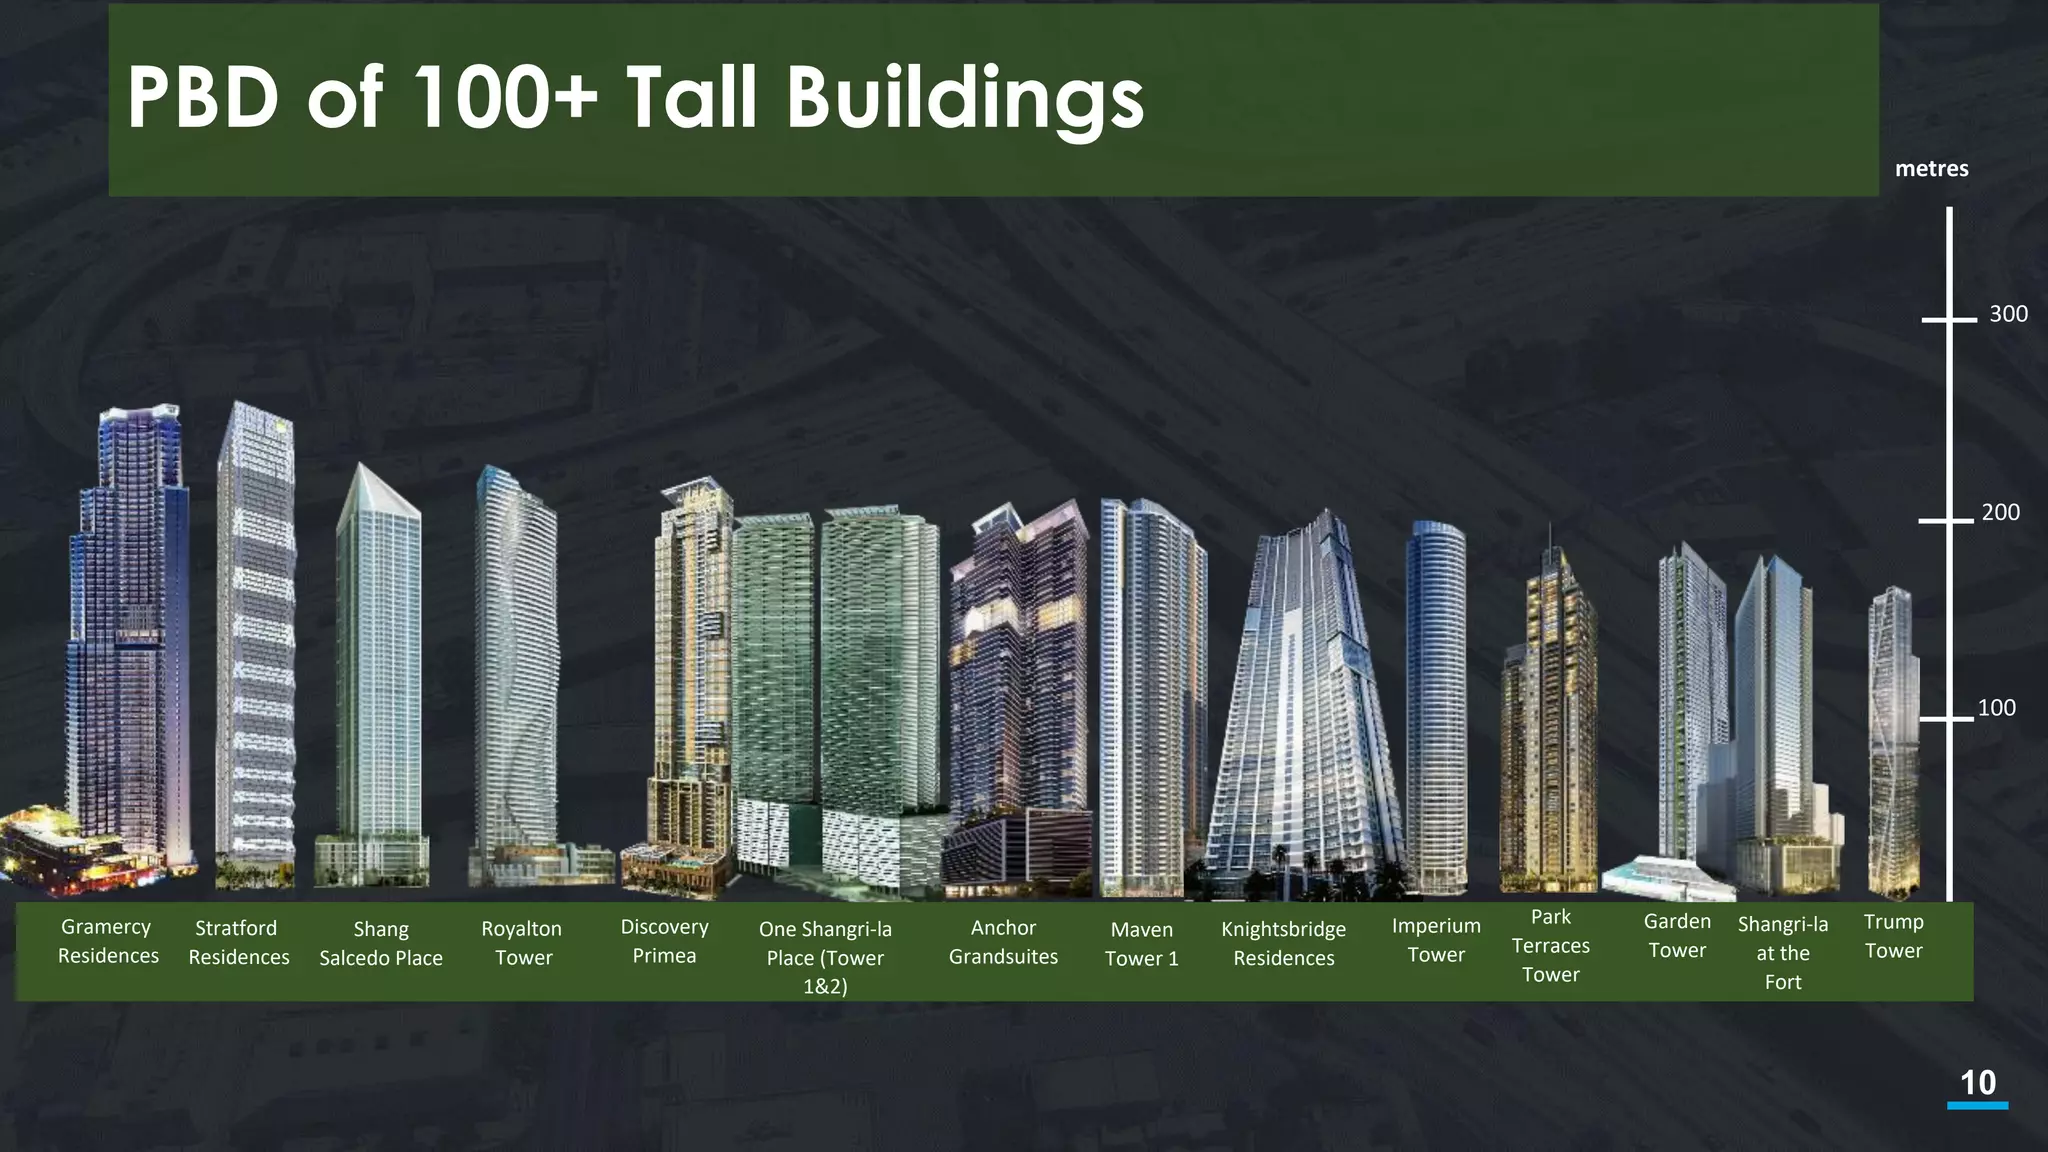
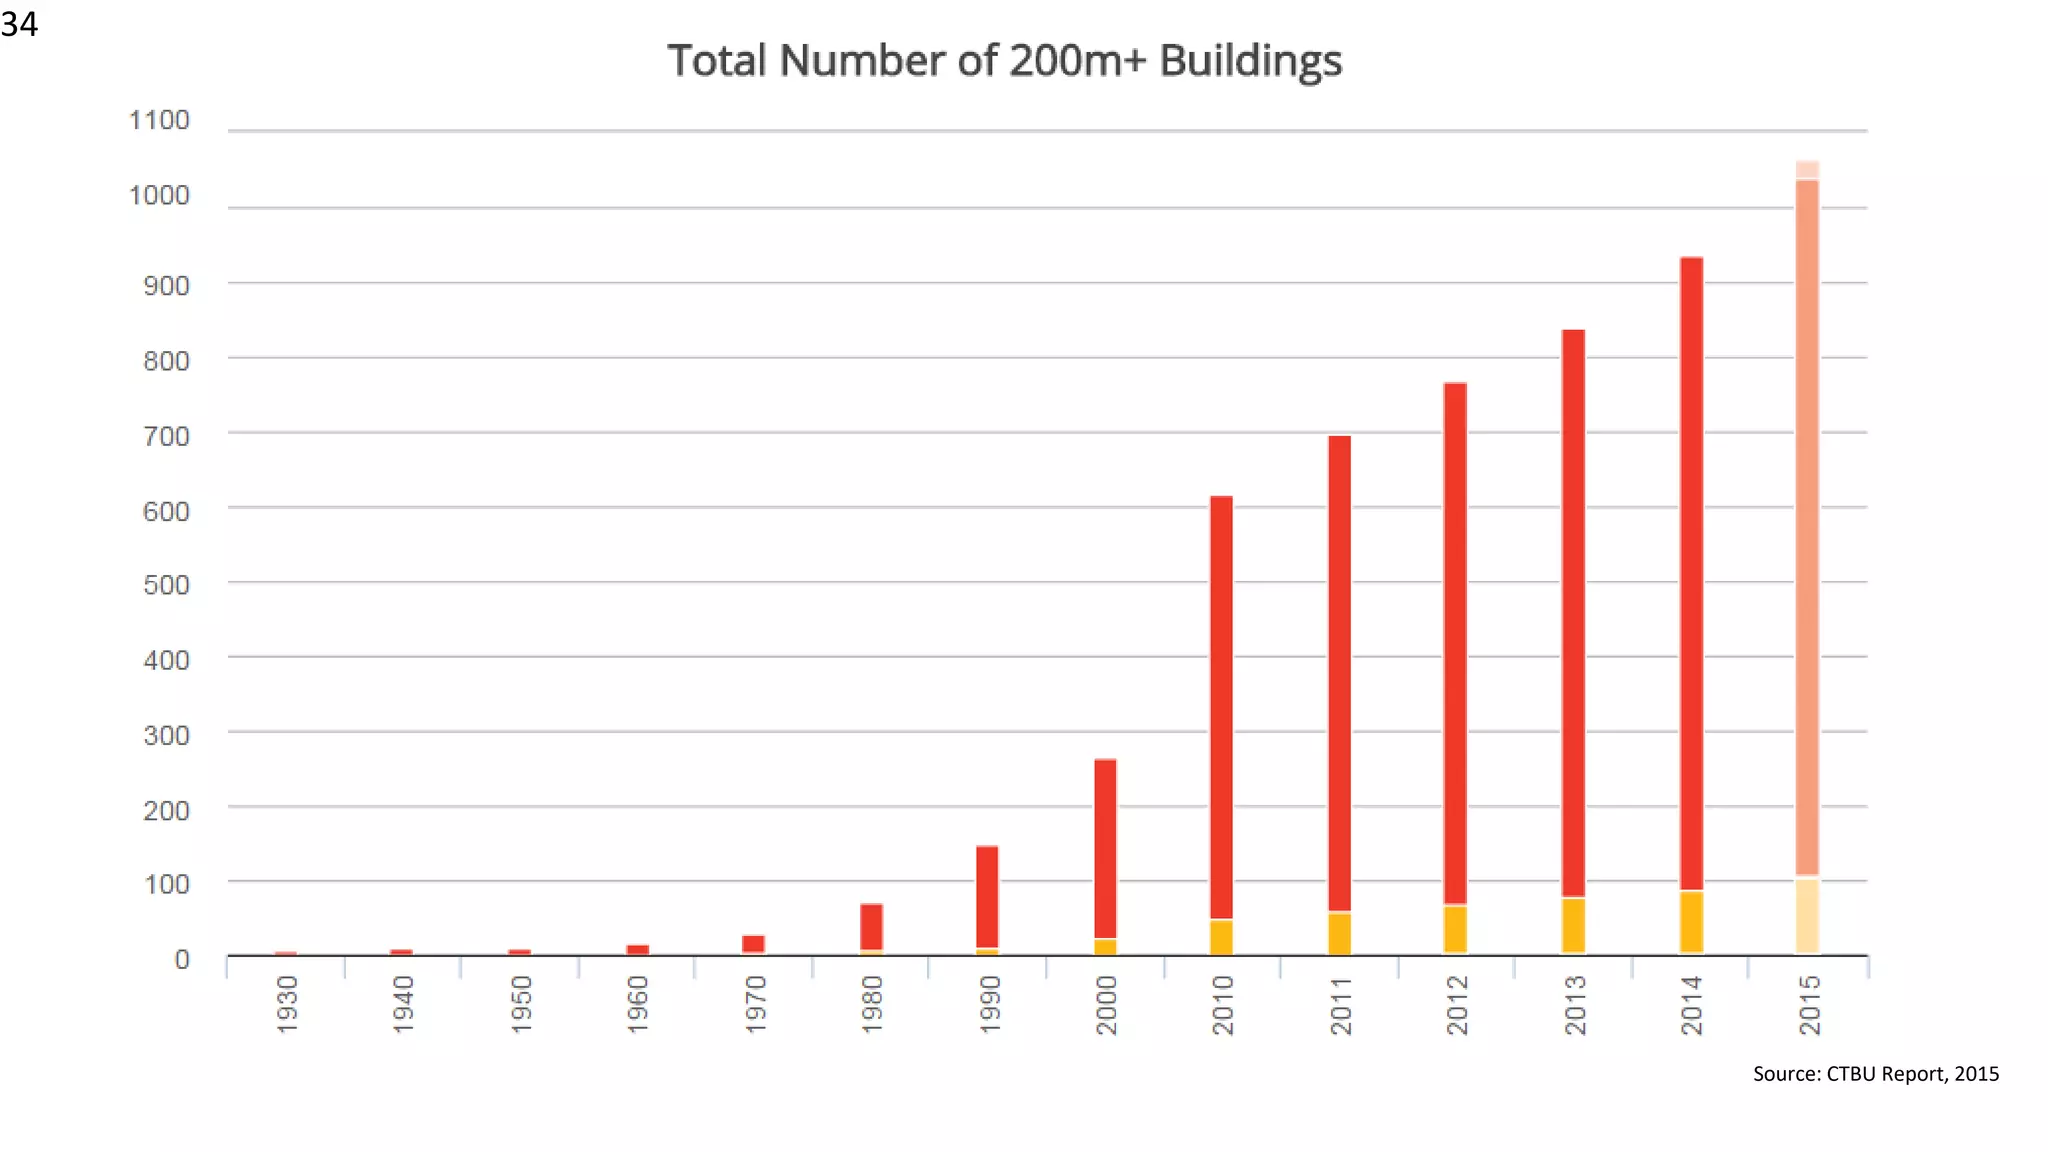
PBD of 100+Tall Buildings
Gramercy
Residences
Stratford
Residences
Shang
Salcedo Place
Royalton
Tower
Discovery
Primea
One Shangri-la
Place (Tower
1&2)
Anchor
Grandsuites
Maven
Tower 1
Knightsbridge
Residences
Imperium
Tower
Park
Terraces
Tower
Garden
Tower
Shangri-la
at the
Fort
Trump
Tower
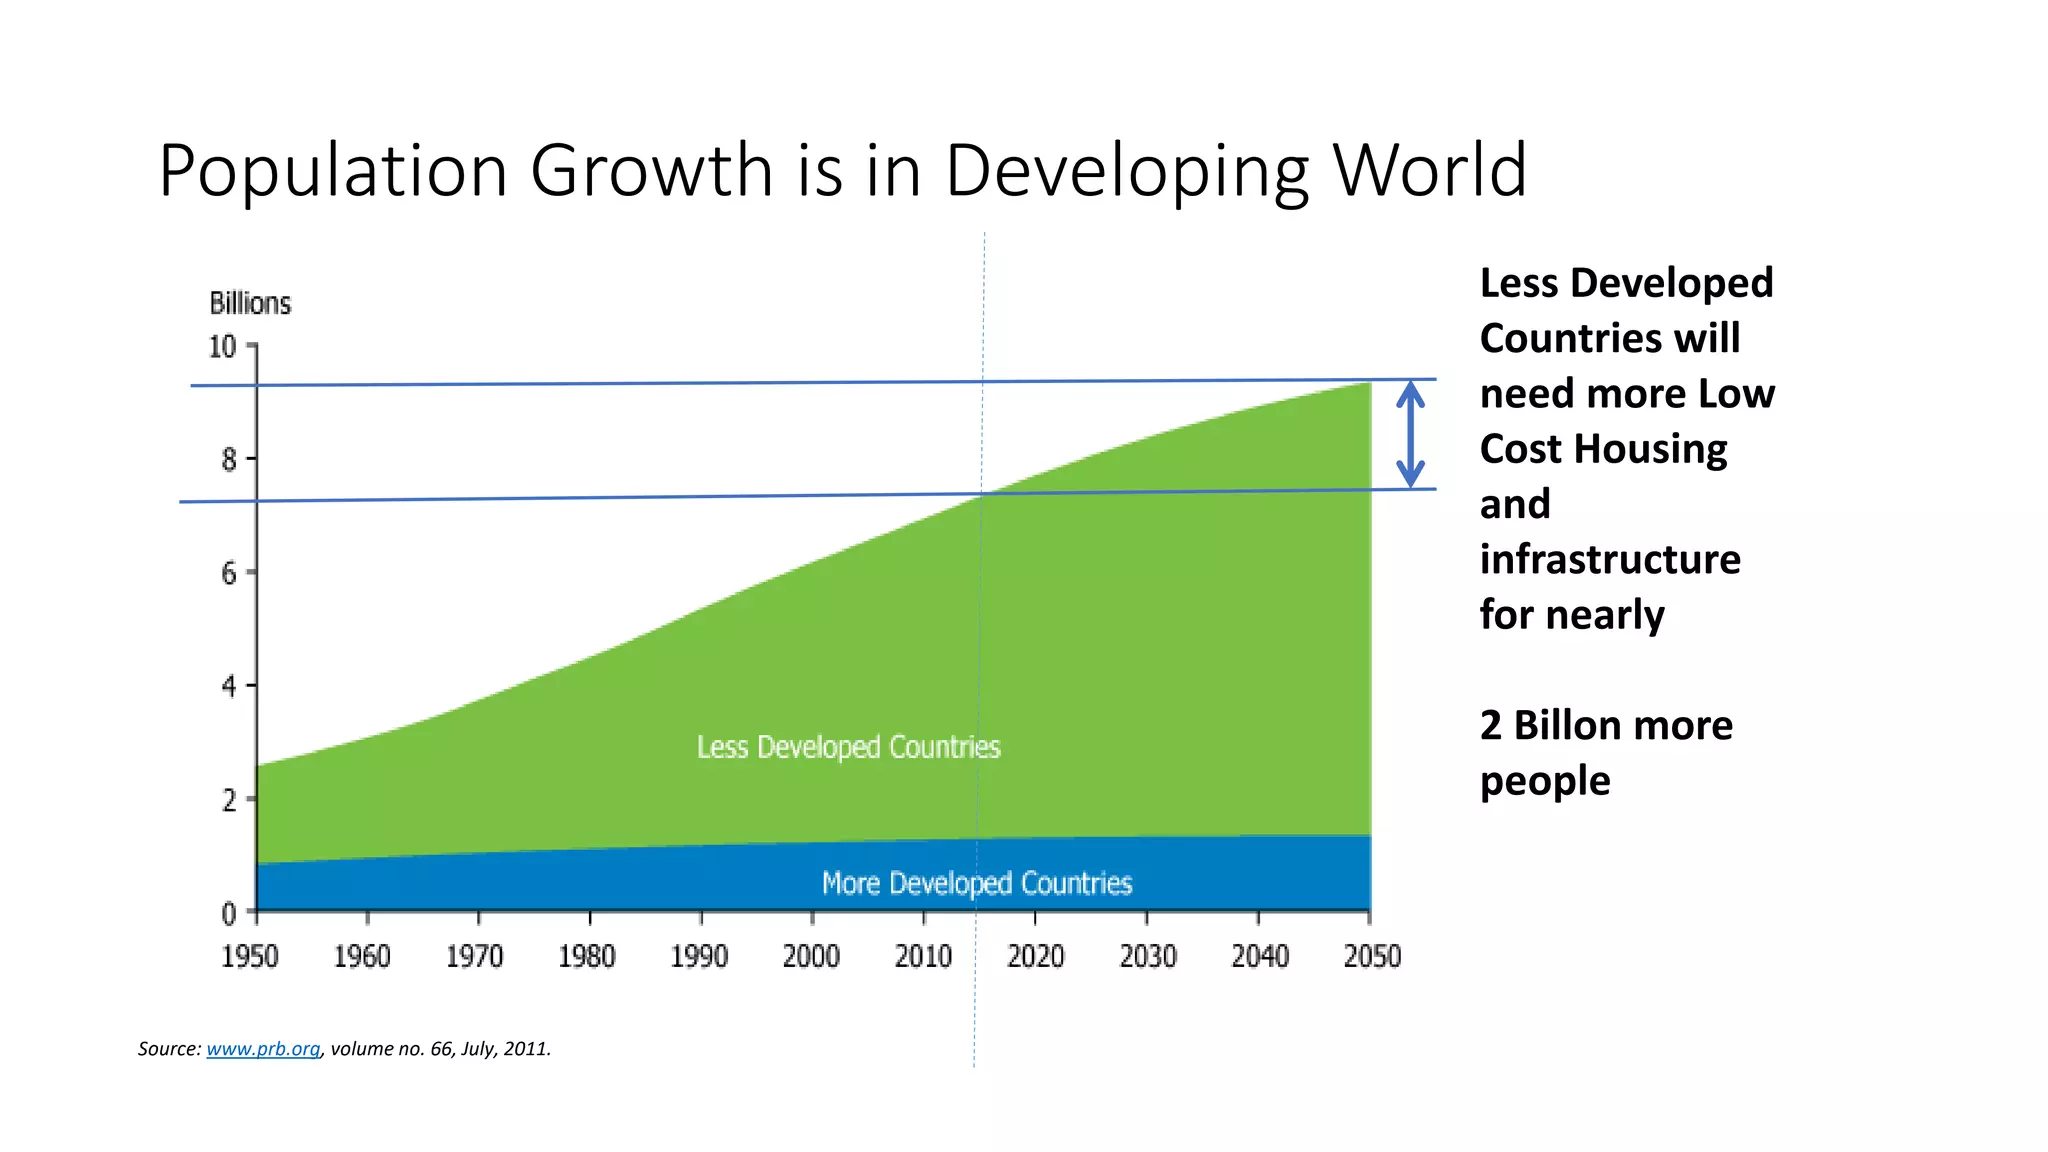
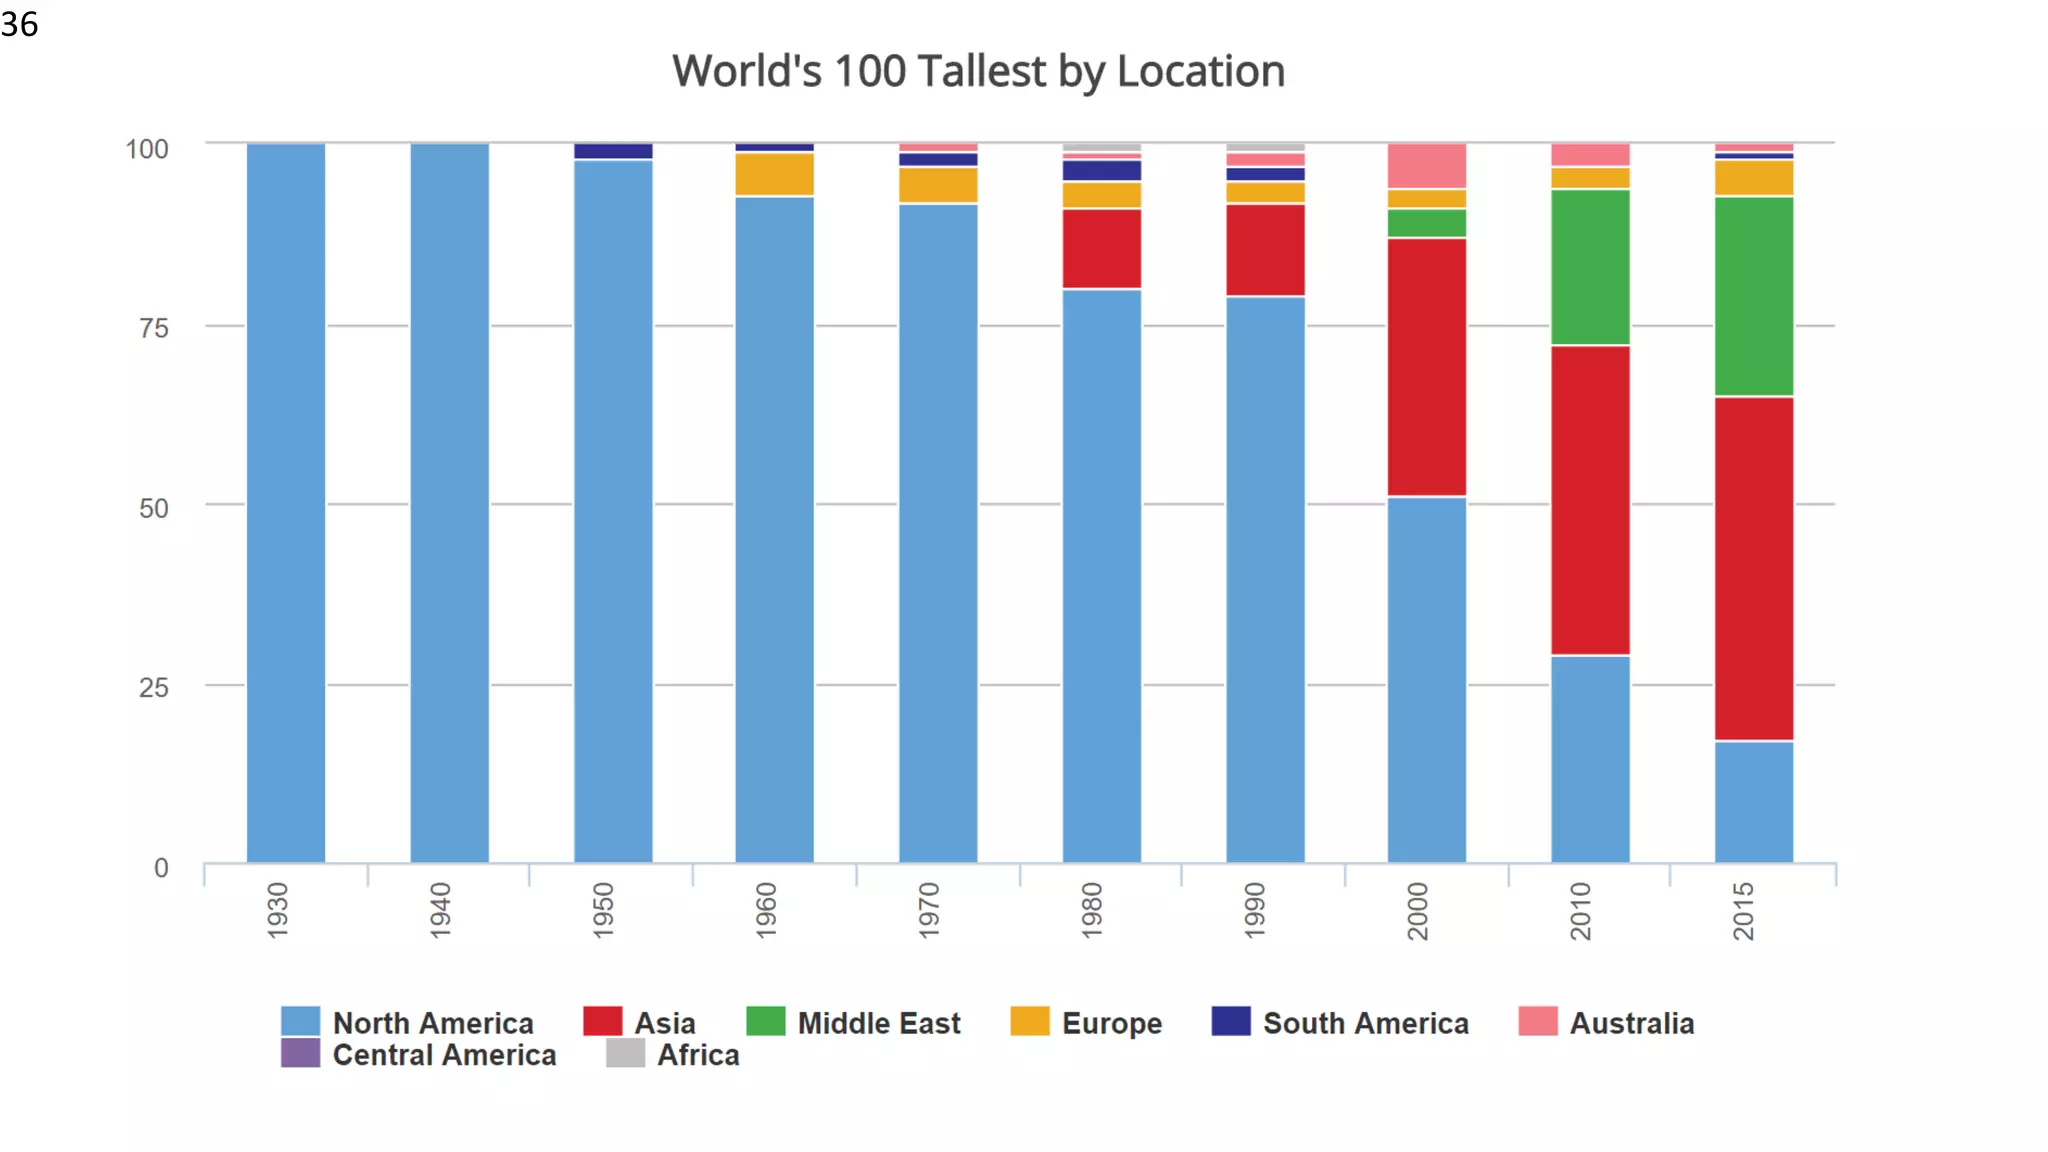
Population Growth isin Developing World
31
Source: www.prb.org, volume no. 66, July, 2011.
Less Developed
Countries will
need more Low
Cost Housing
and
infrastructure
for nearly
2 Billon more
people
32.
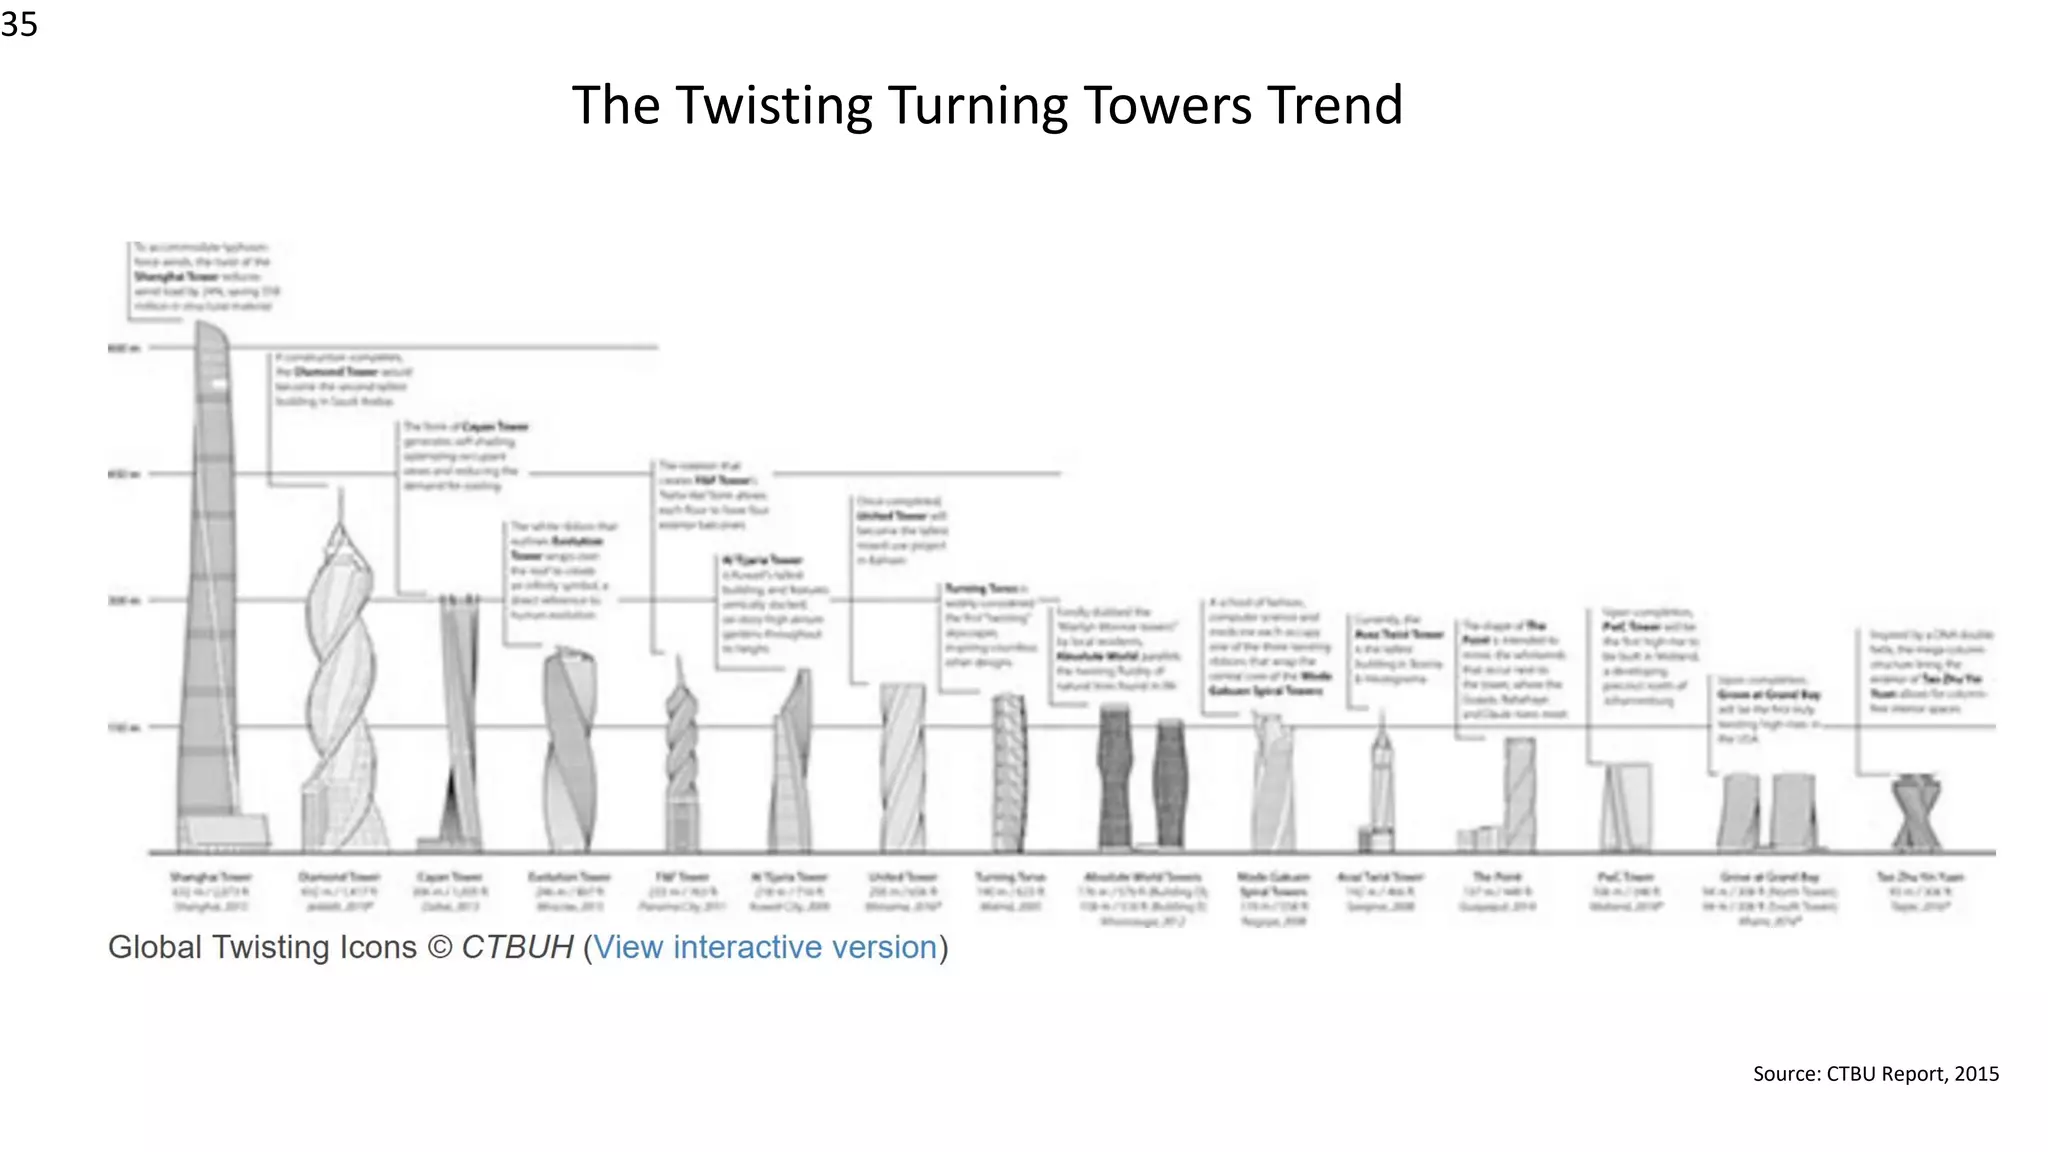
Visions for theFuture are for “Vertical Cities”
32
Japan, 4000m Sky Mile Tower, 1700 m JapanDubai City Tower, 2400 m One Dubai Tower,
1008 m
37
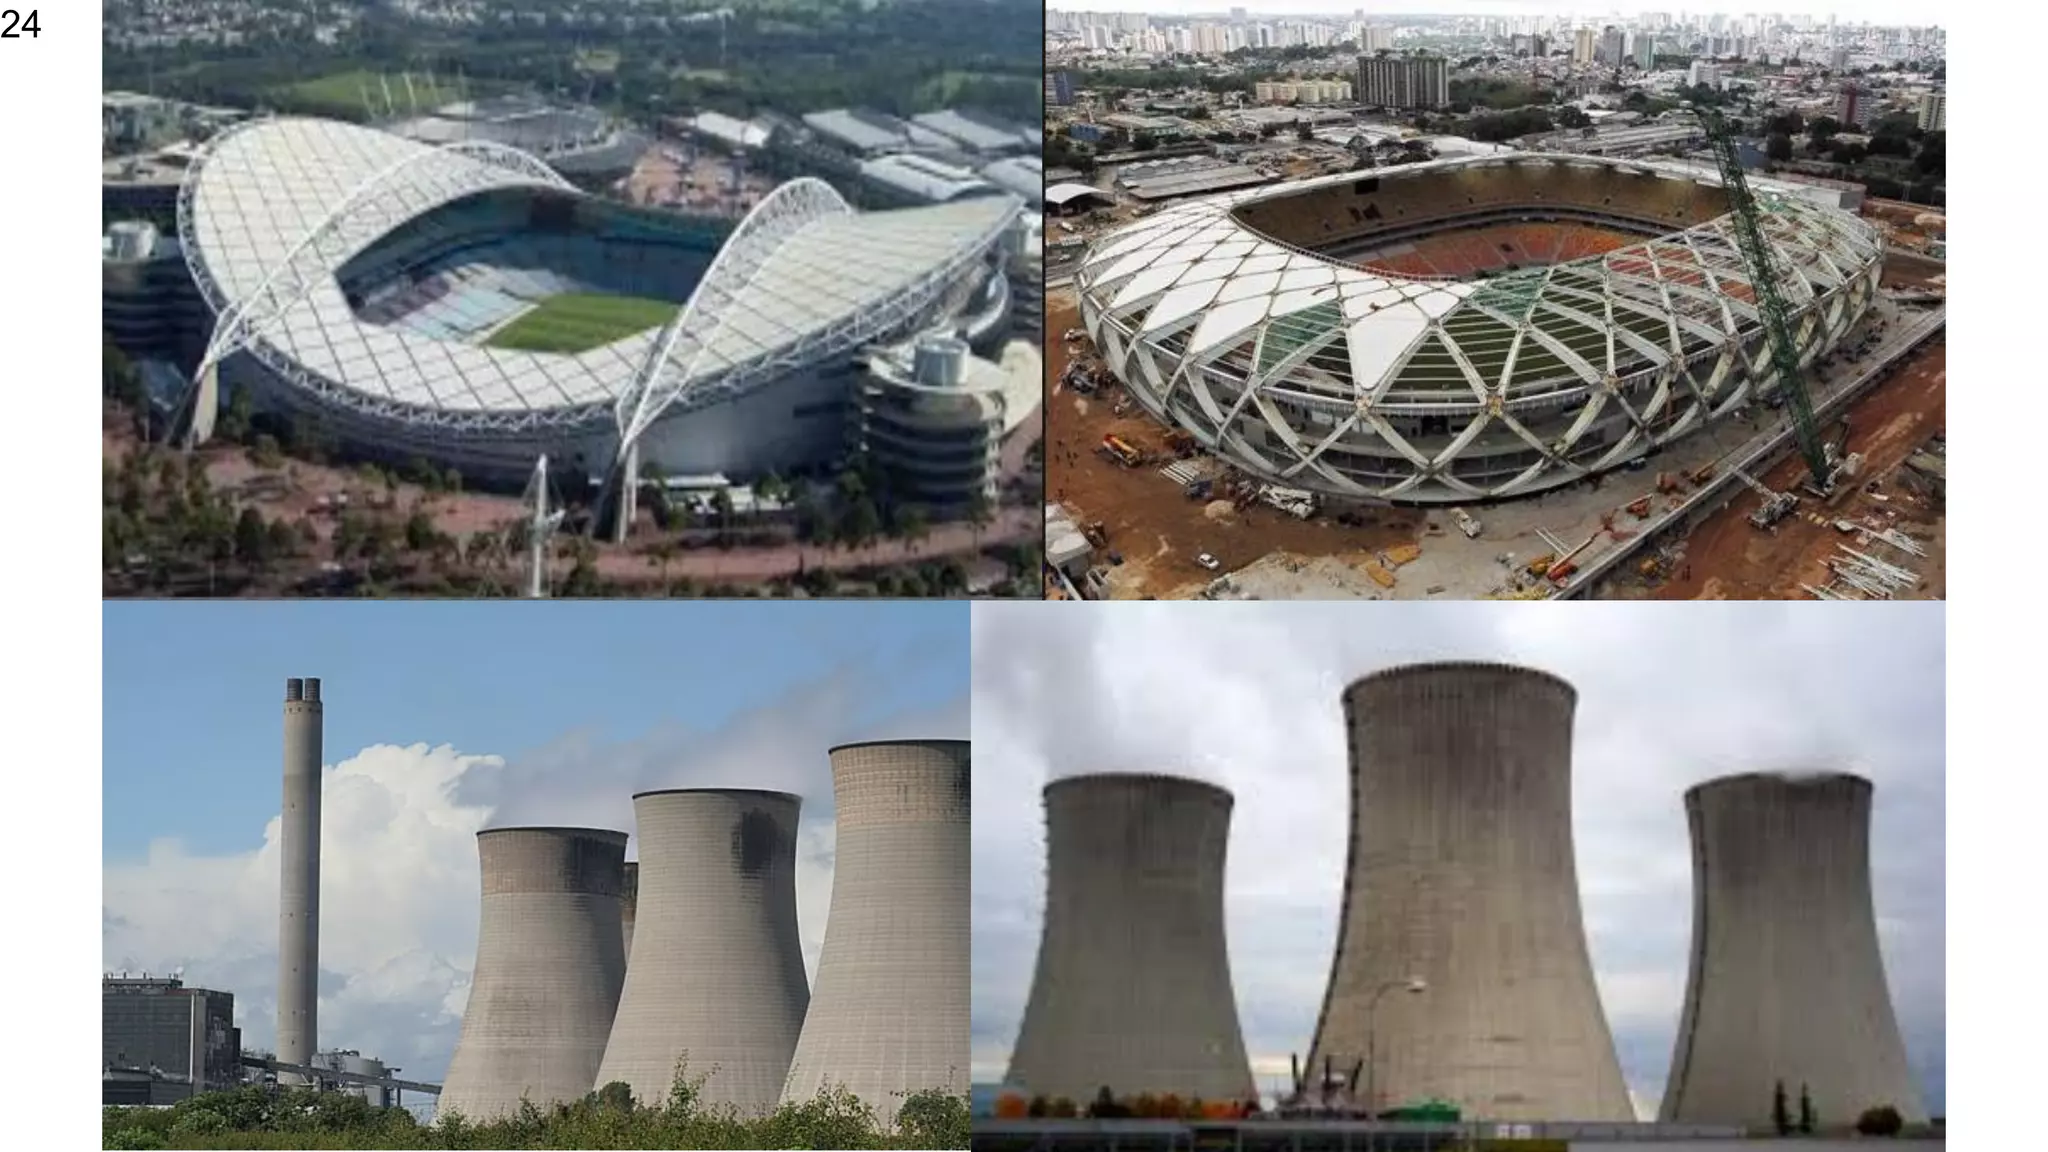
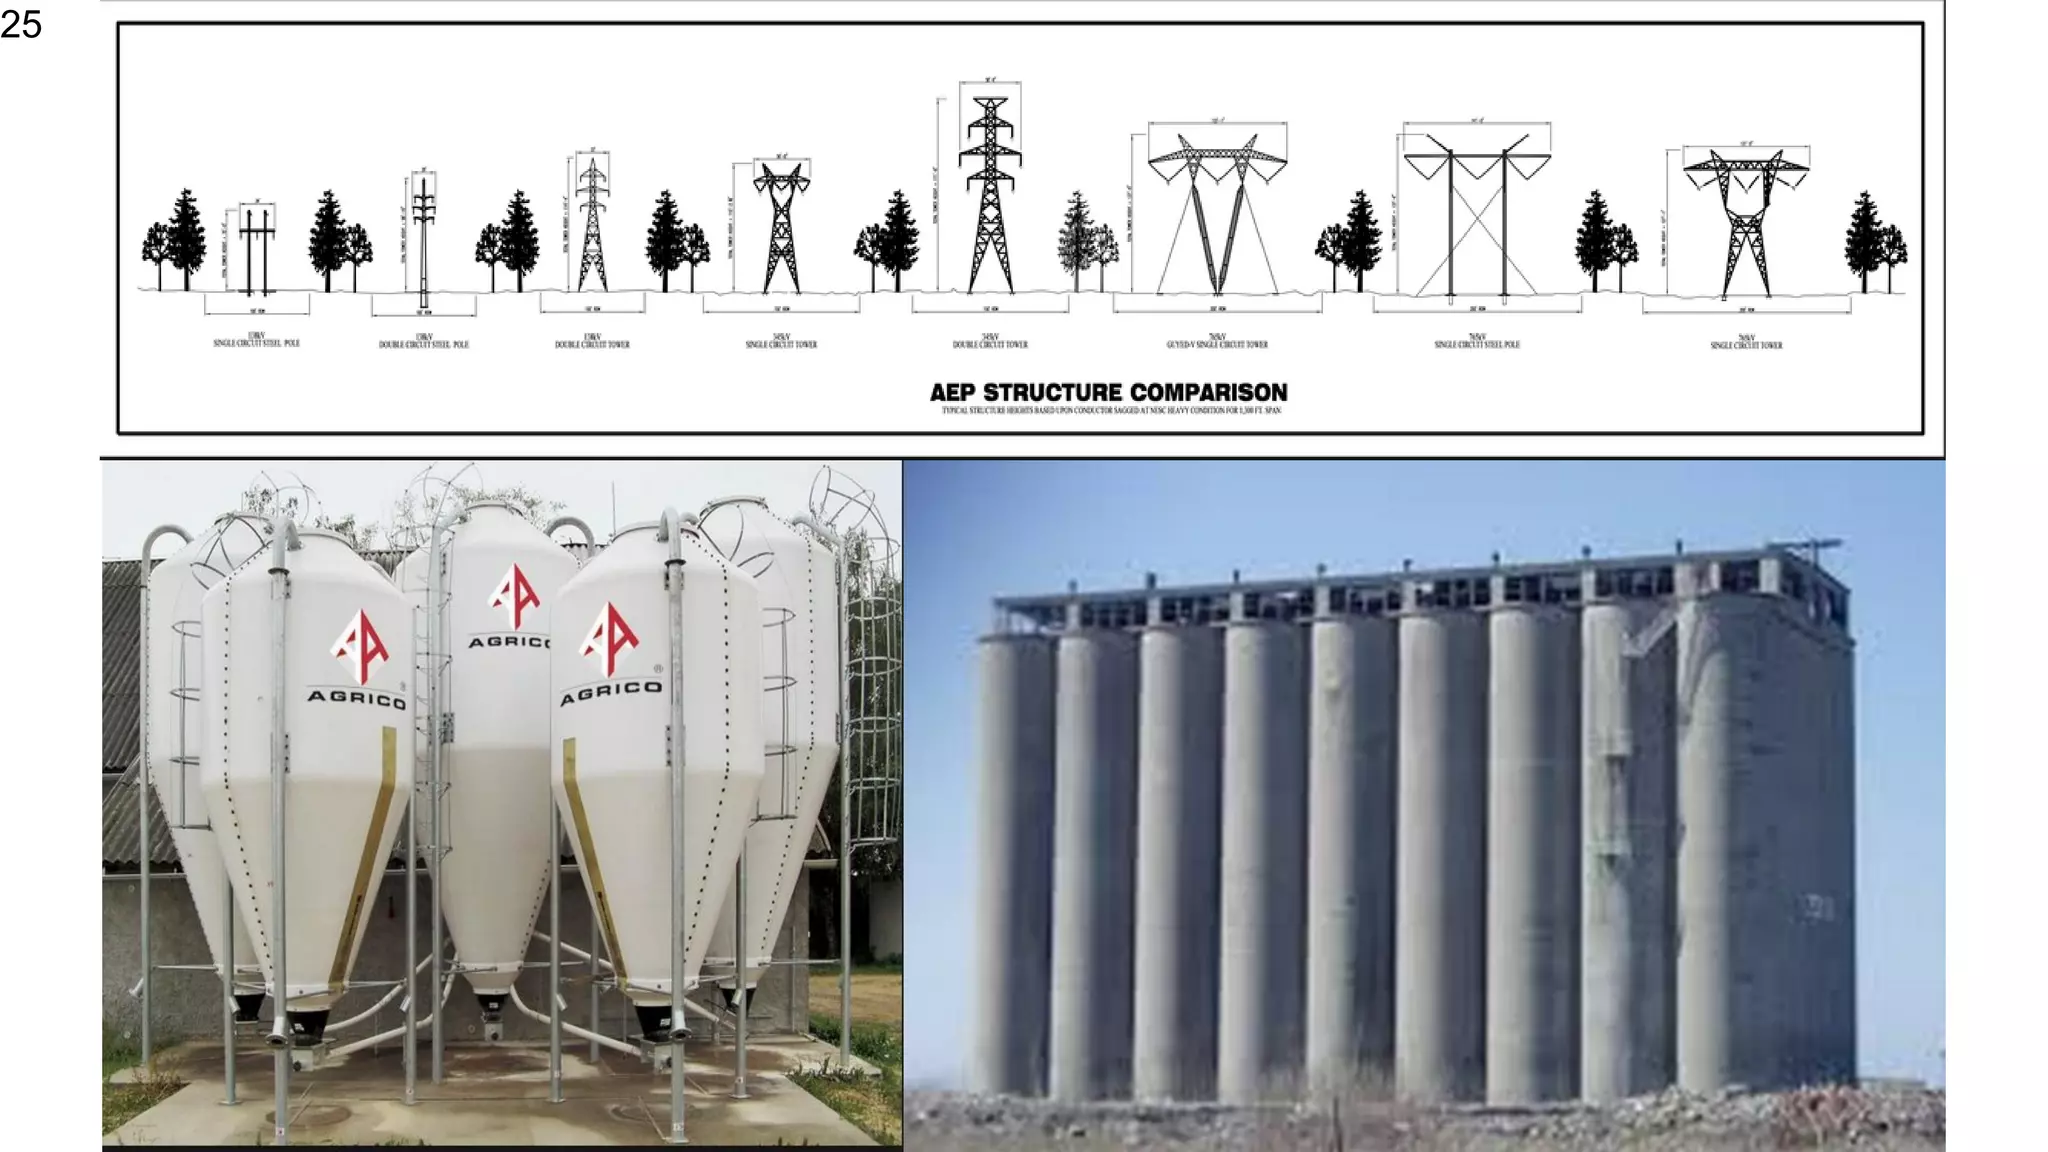
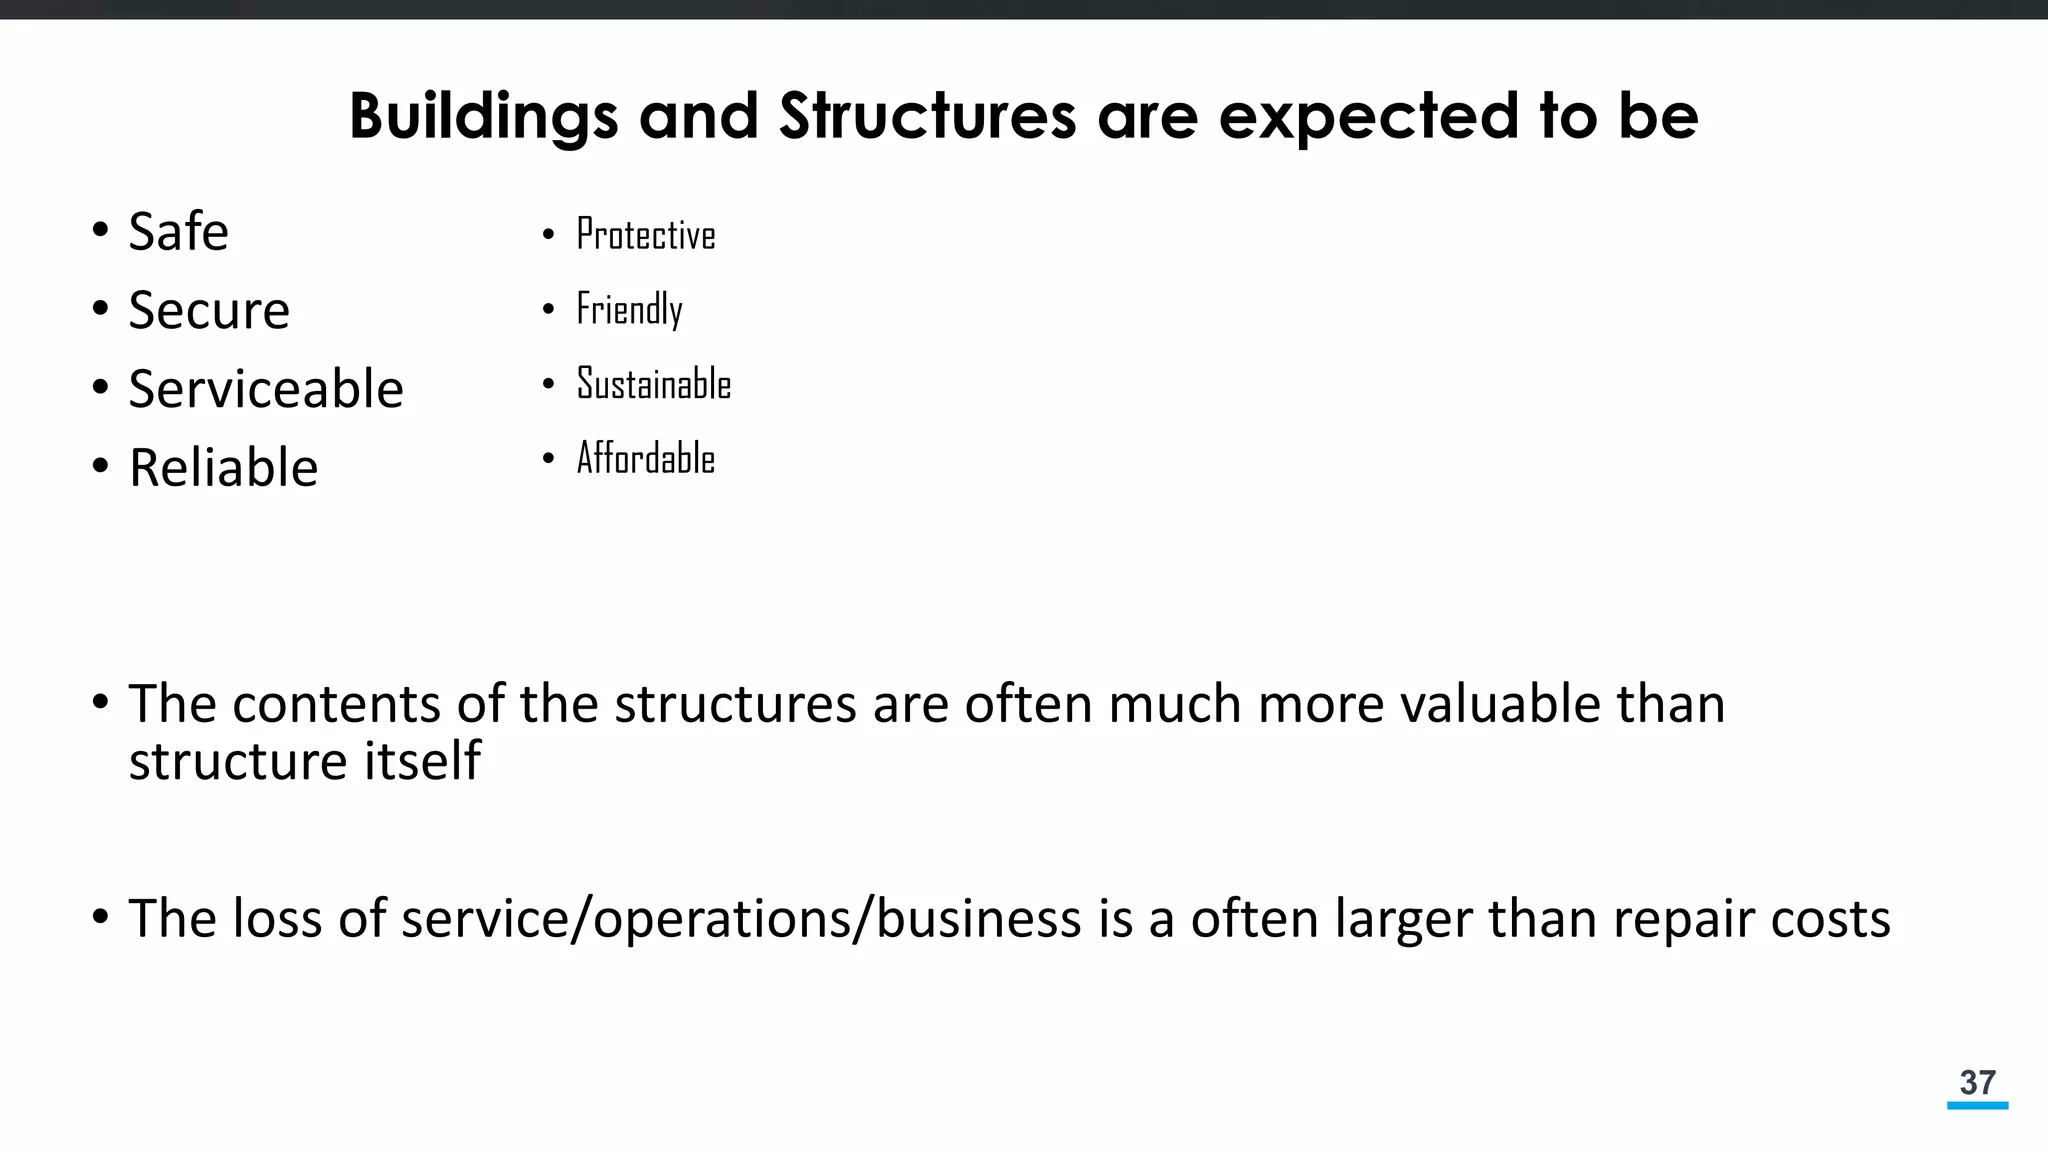
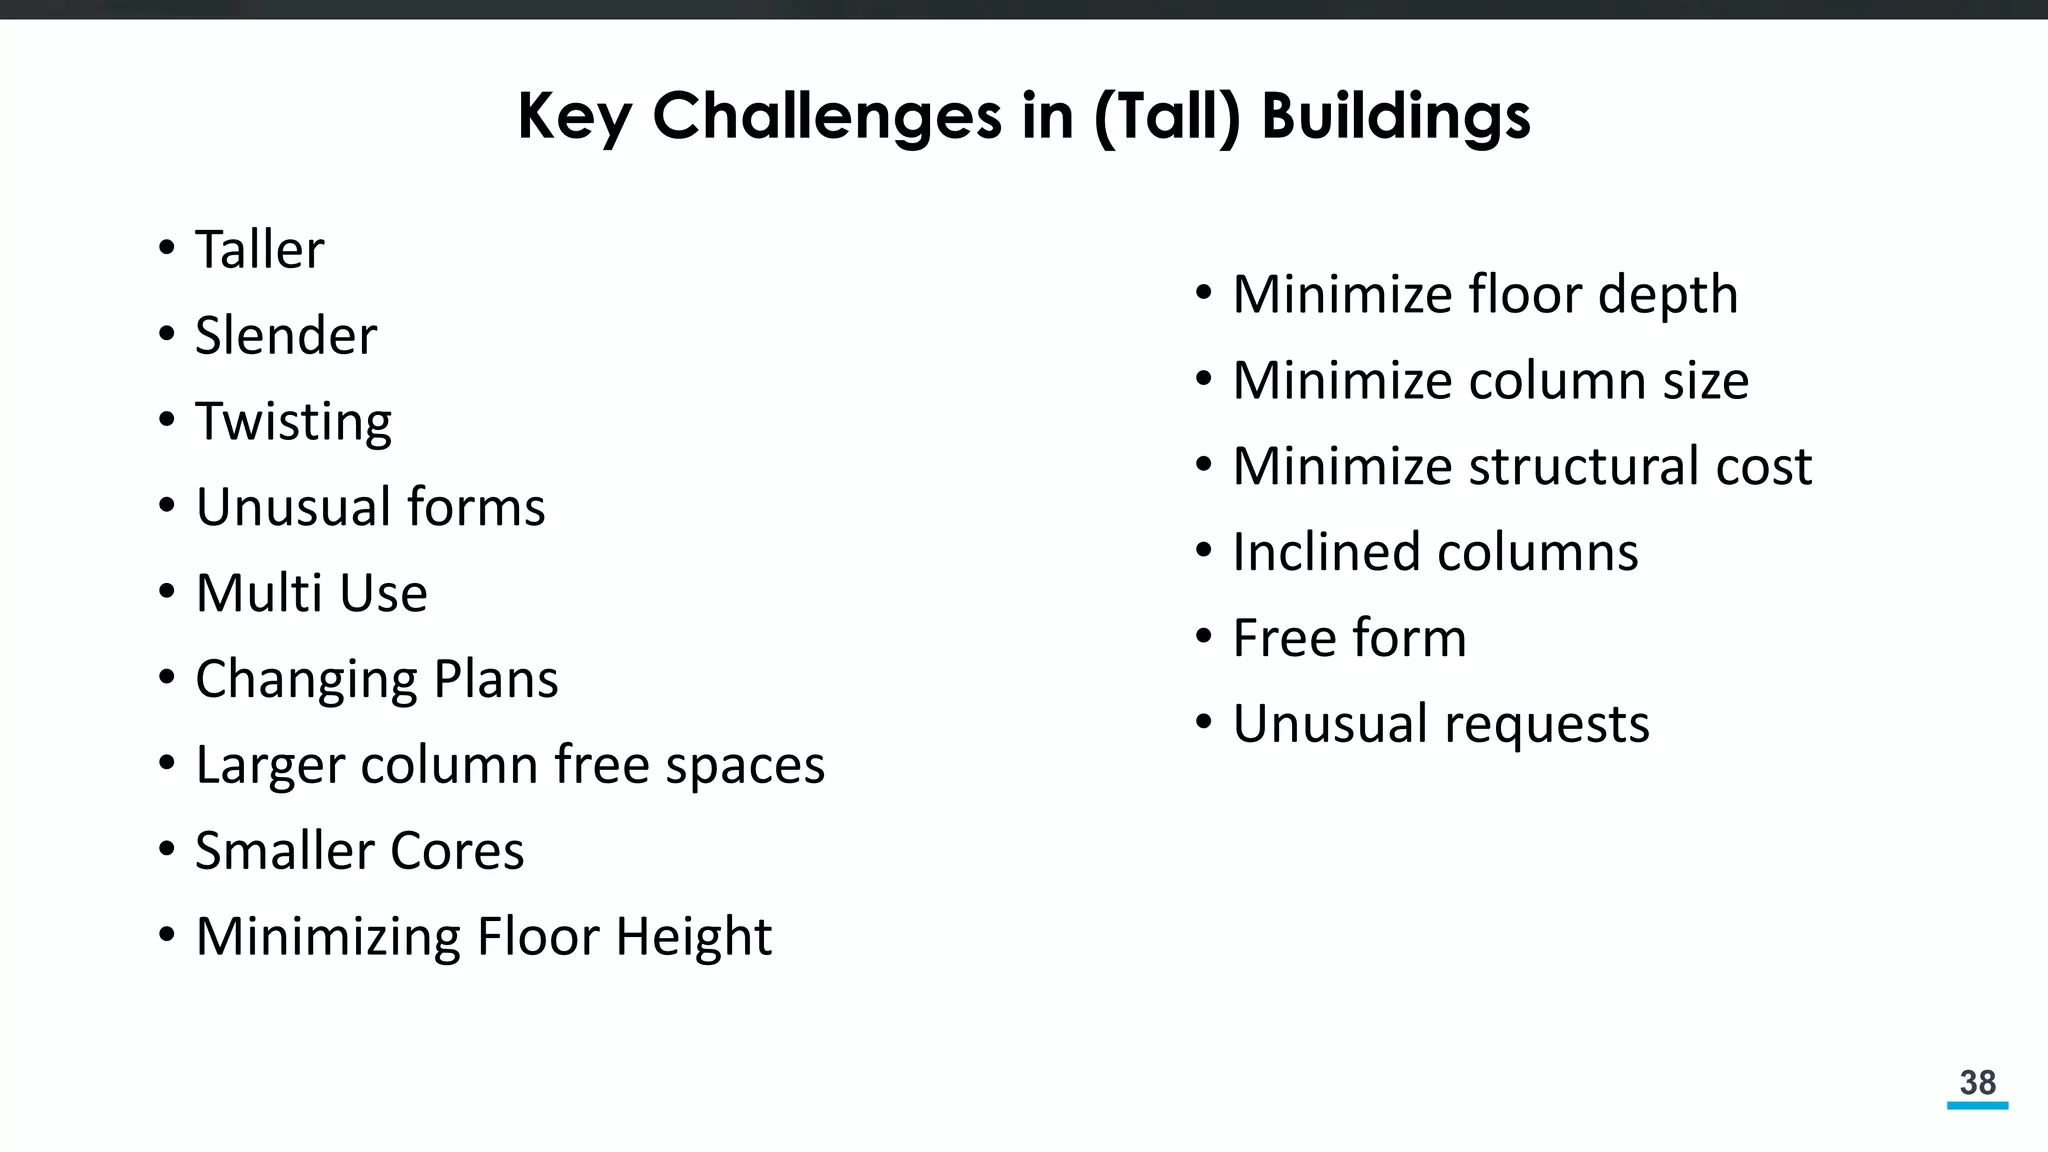
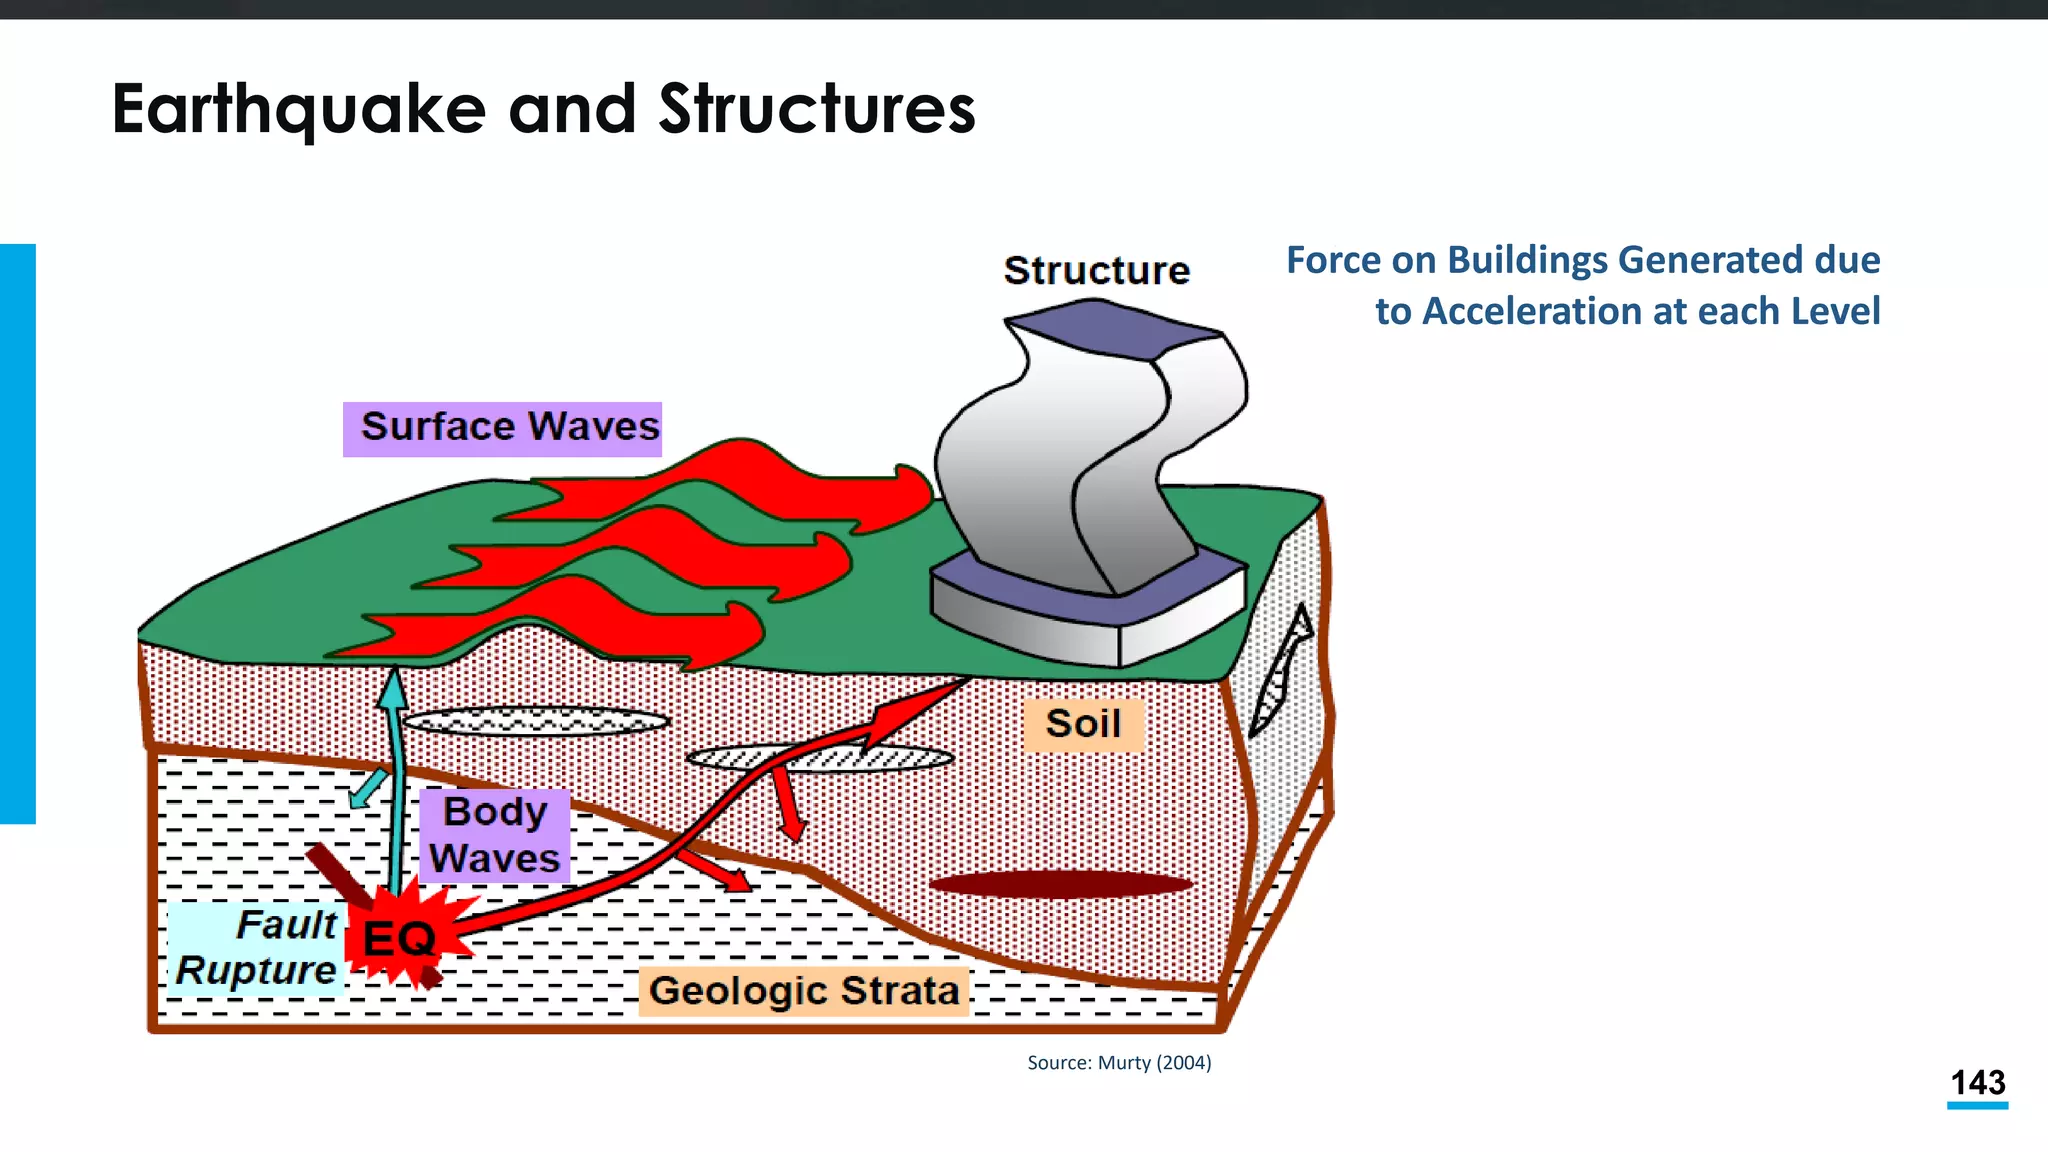
Buildings and Structuresare expected to be
• Safe
• Secure
• Serviceable
• Reliable
• The contents of the structures are often much more valuable than
structure itself
• The loss of service/operations/business is a often larger than repair costs
• Protective
• Friendly
• Sustainable
• Affordable
39
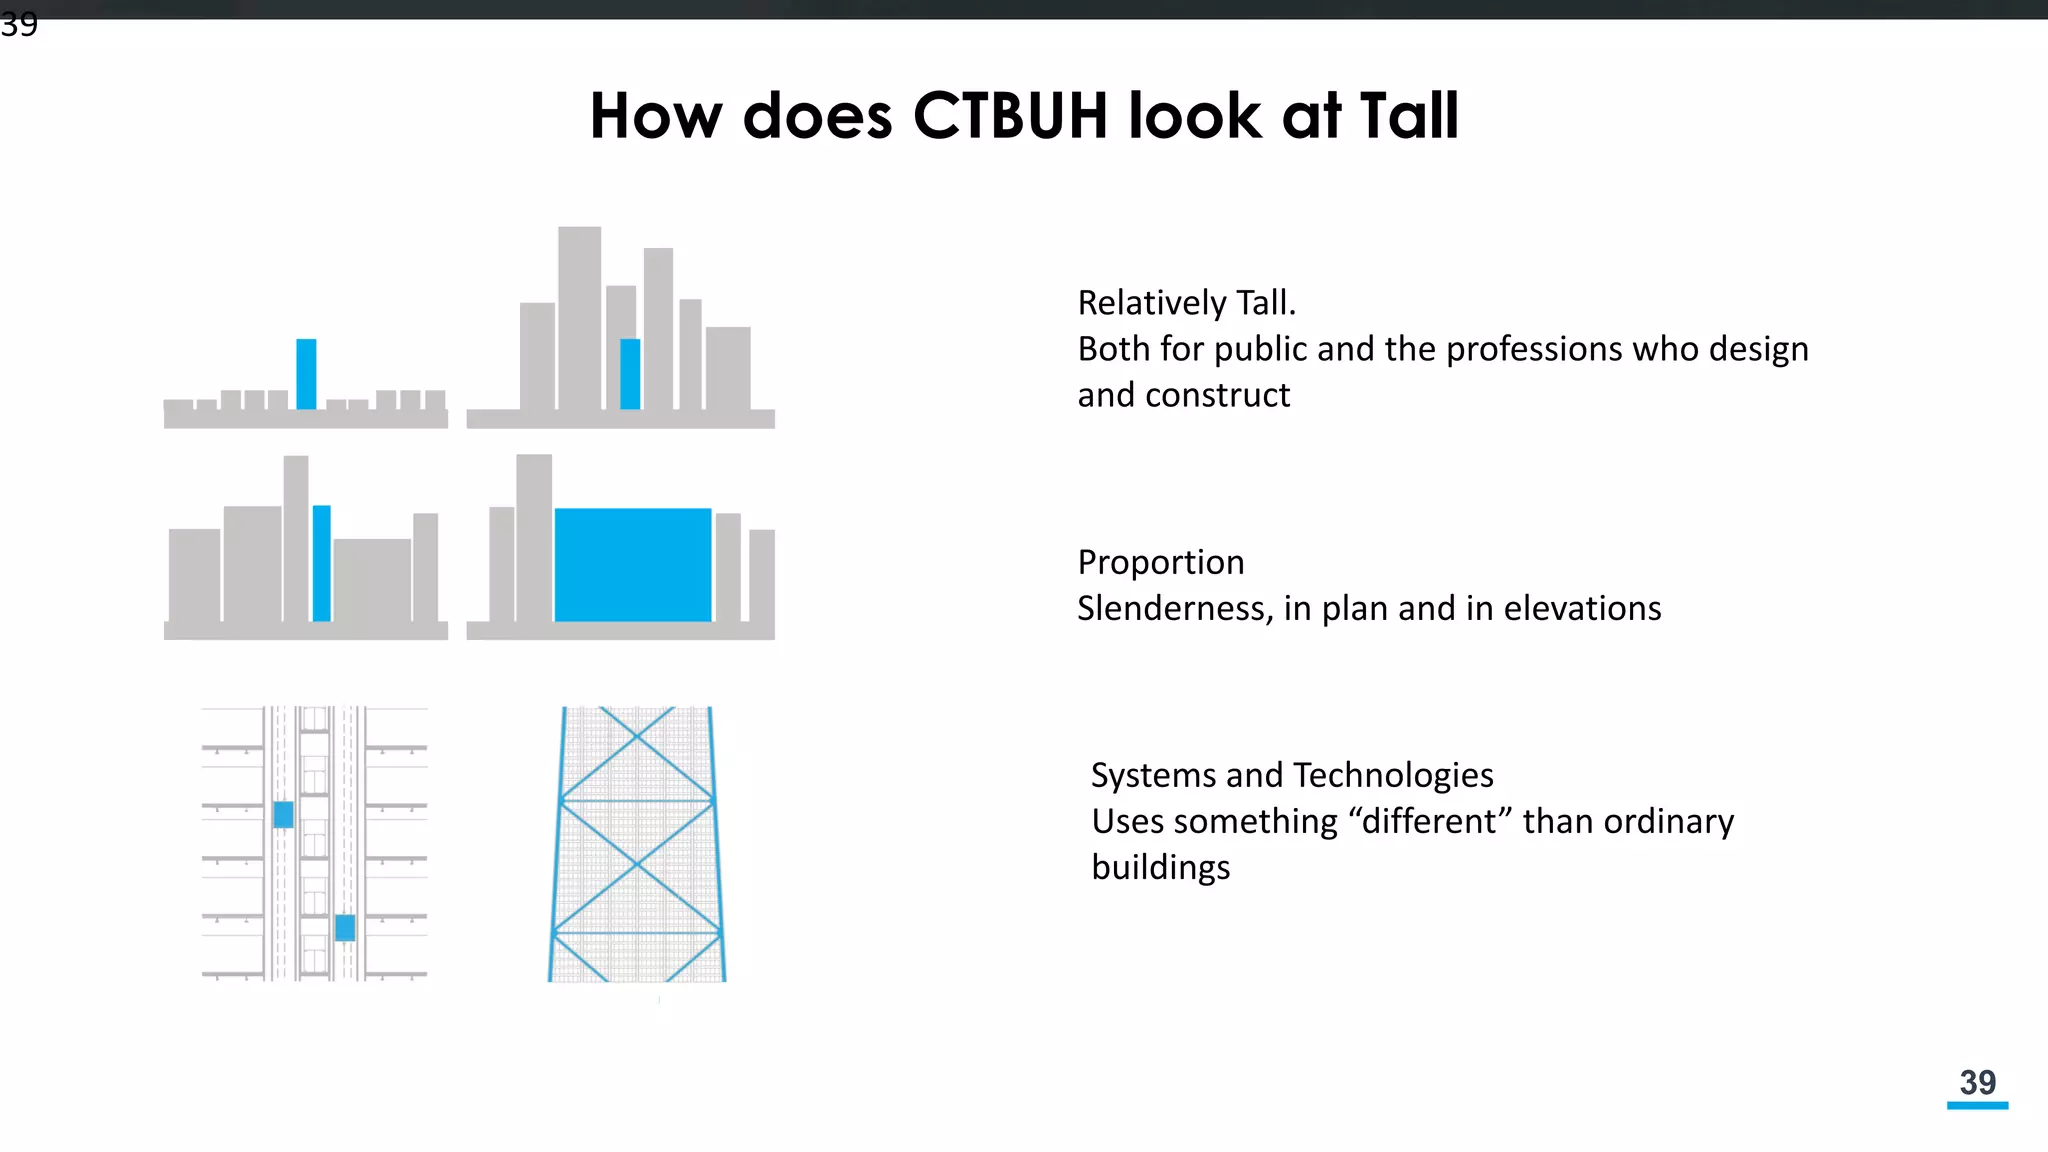
How does CTBUHlook at Tall
39
Relatively Tall.
Both for public and the professions who design
and construct
Proportion
Slenderness, in plan and in elevations
Systems and Technologies
Uses something “different” than ordinary
buildings
41
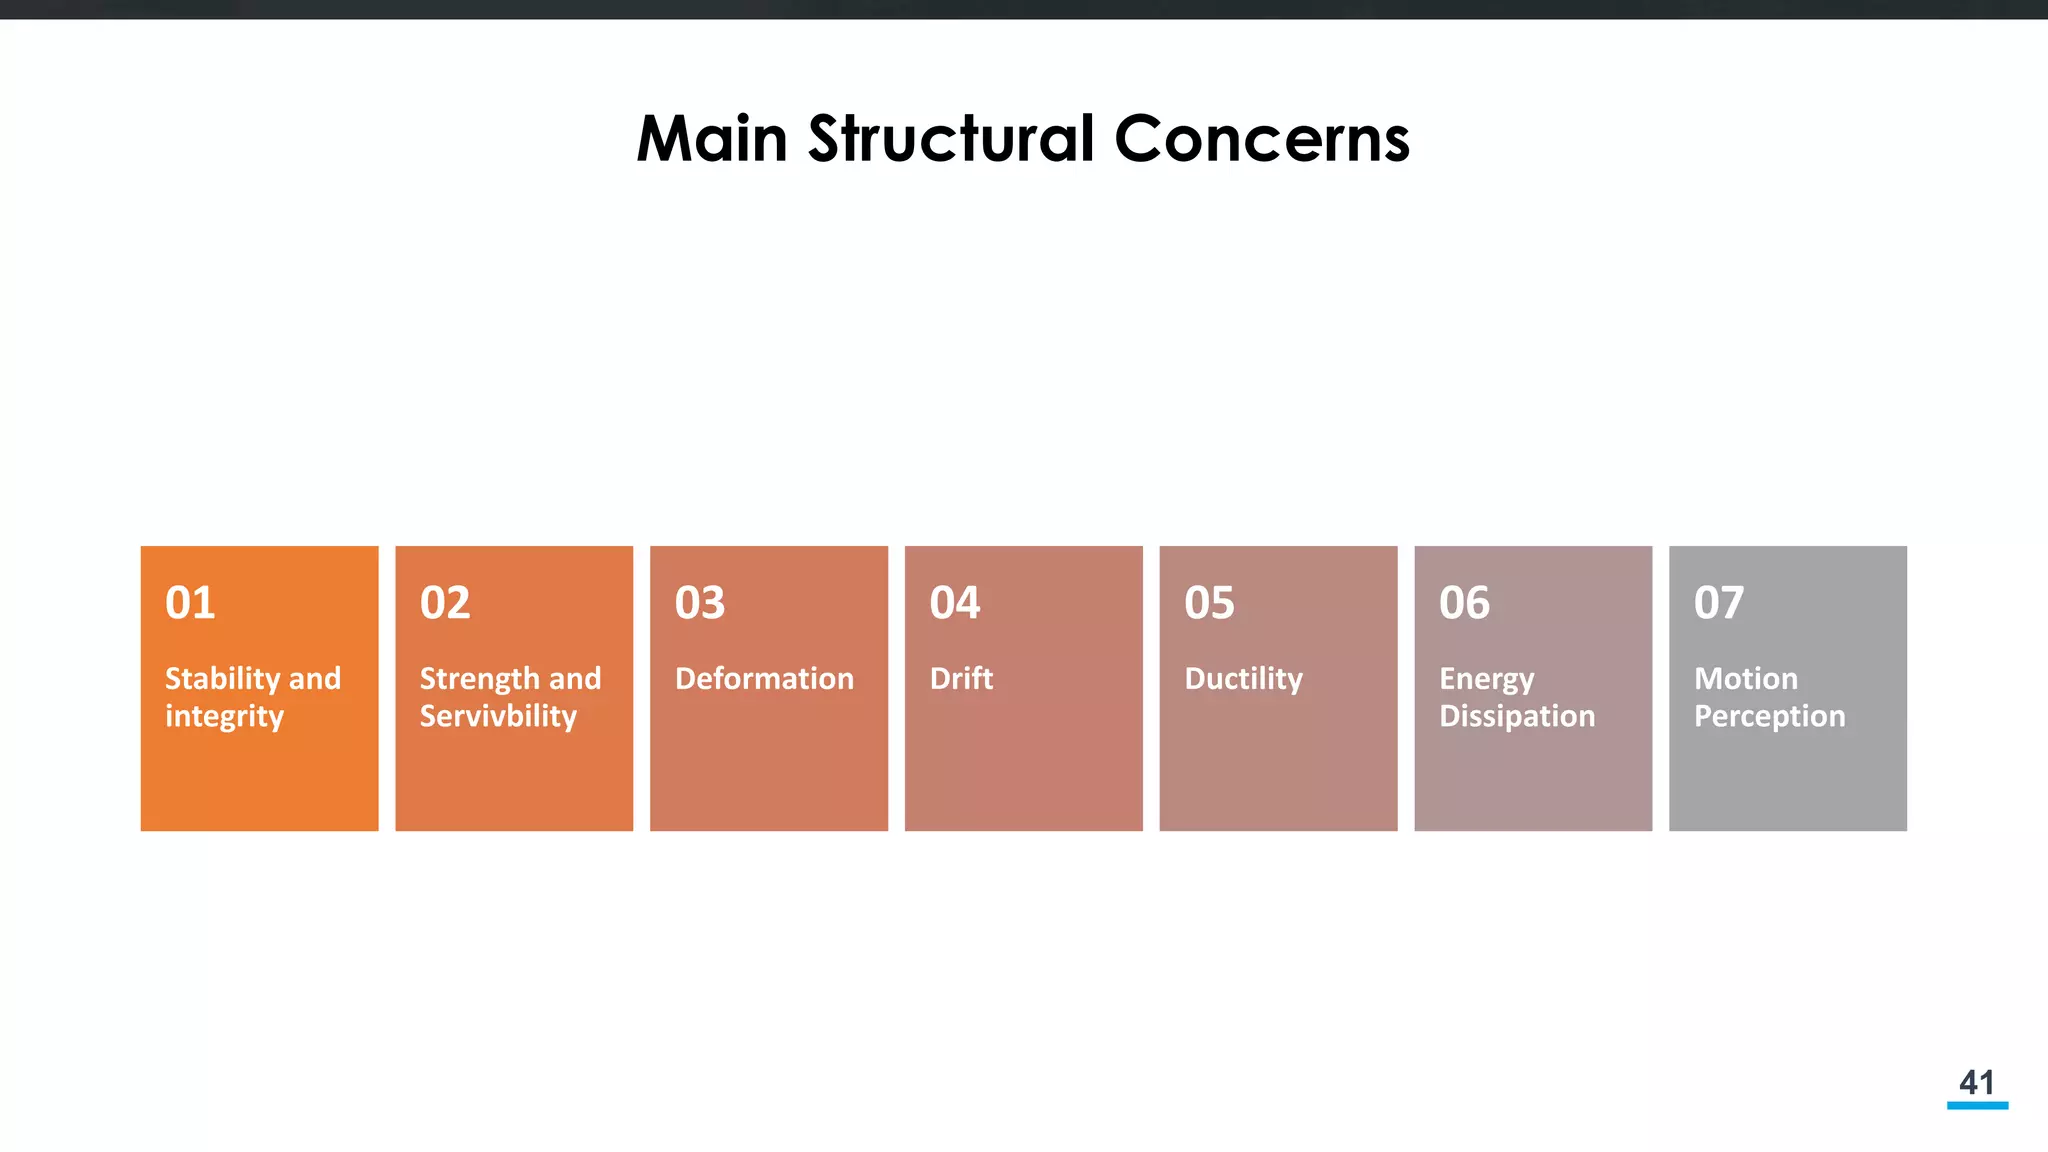
Main Structural Concerns
Stabilityand
integrity
01
Strength and
Servivbility
02
Deformation
03
Drift
04
Ductility
05
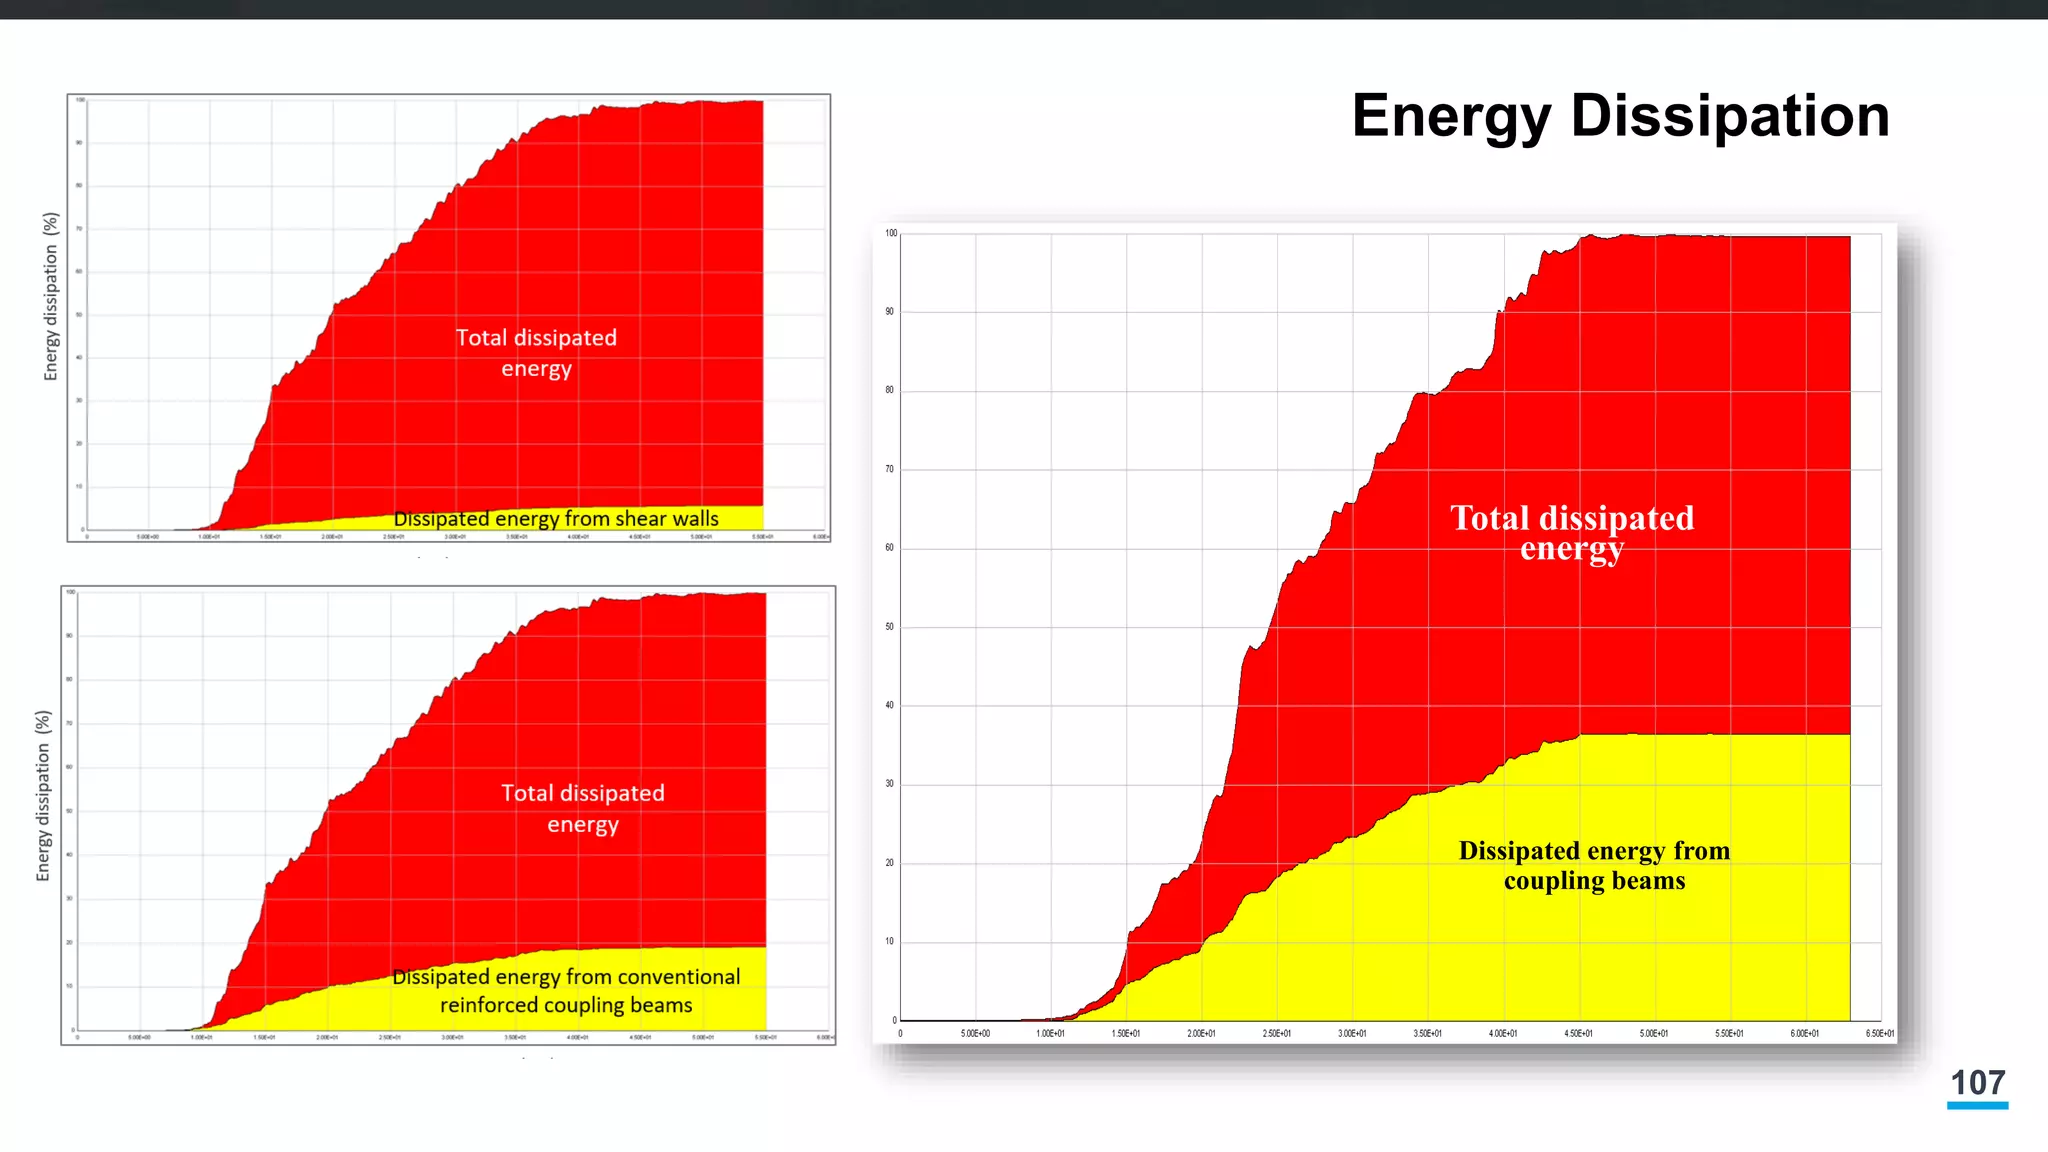
Energy
Dissipation
06
Motion
Perception
07
42.
42
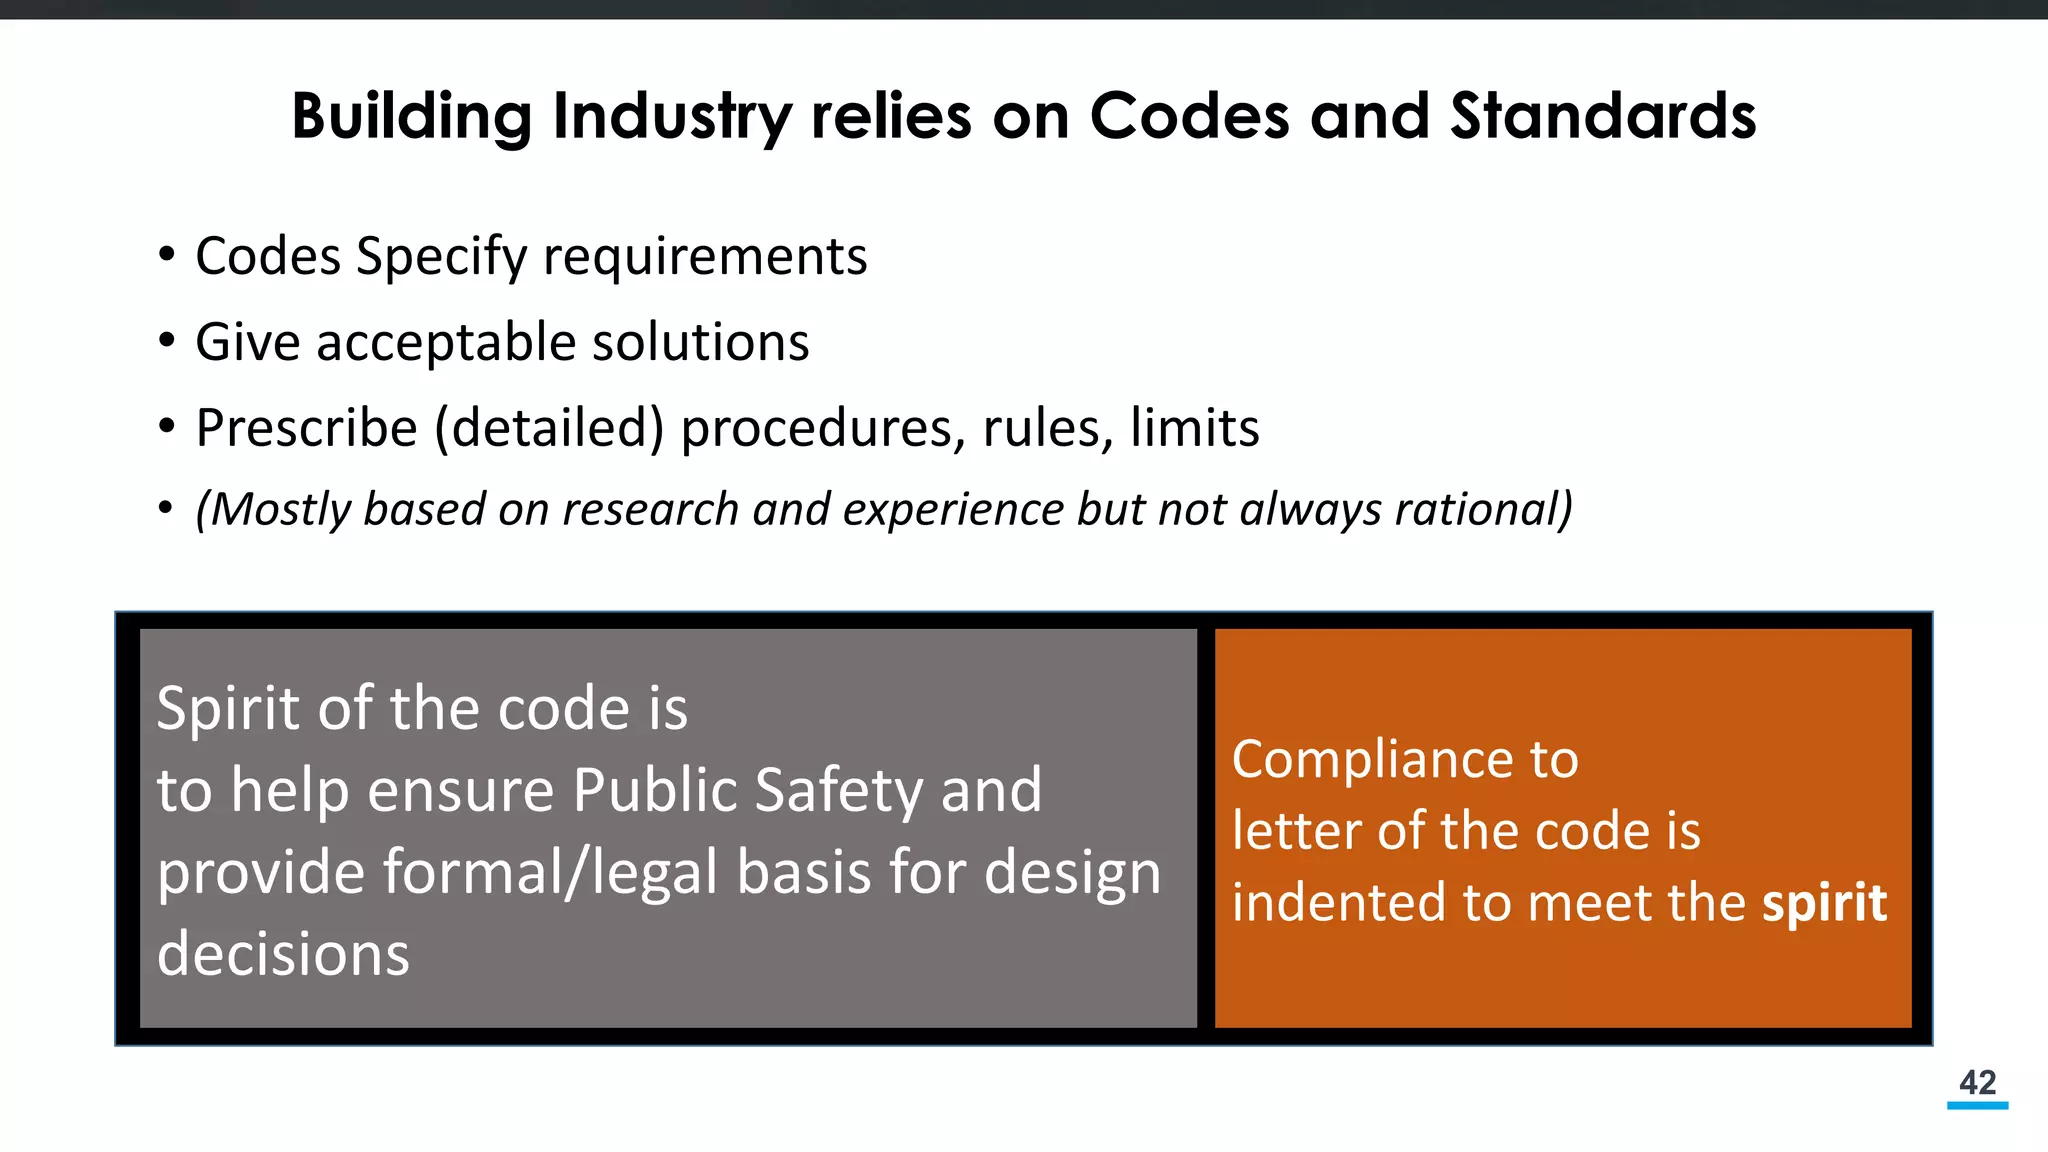
Building Industry relieson Codes and Standards
• Codes Specify requirements
• Give acceptable solutions
• Prescribe (detailed) procedures, rules, limits
• (Mostly based on research and experience but not always rational)
Spirit of the code is
to help ensure Public Safety and
provide formal/legal basis for design
decisions
Compliance to
letter of the code is
indented to meet the spirit
44
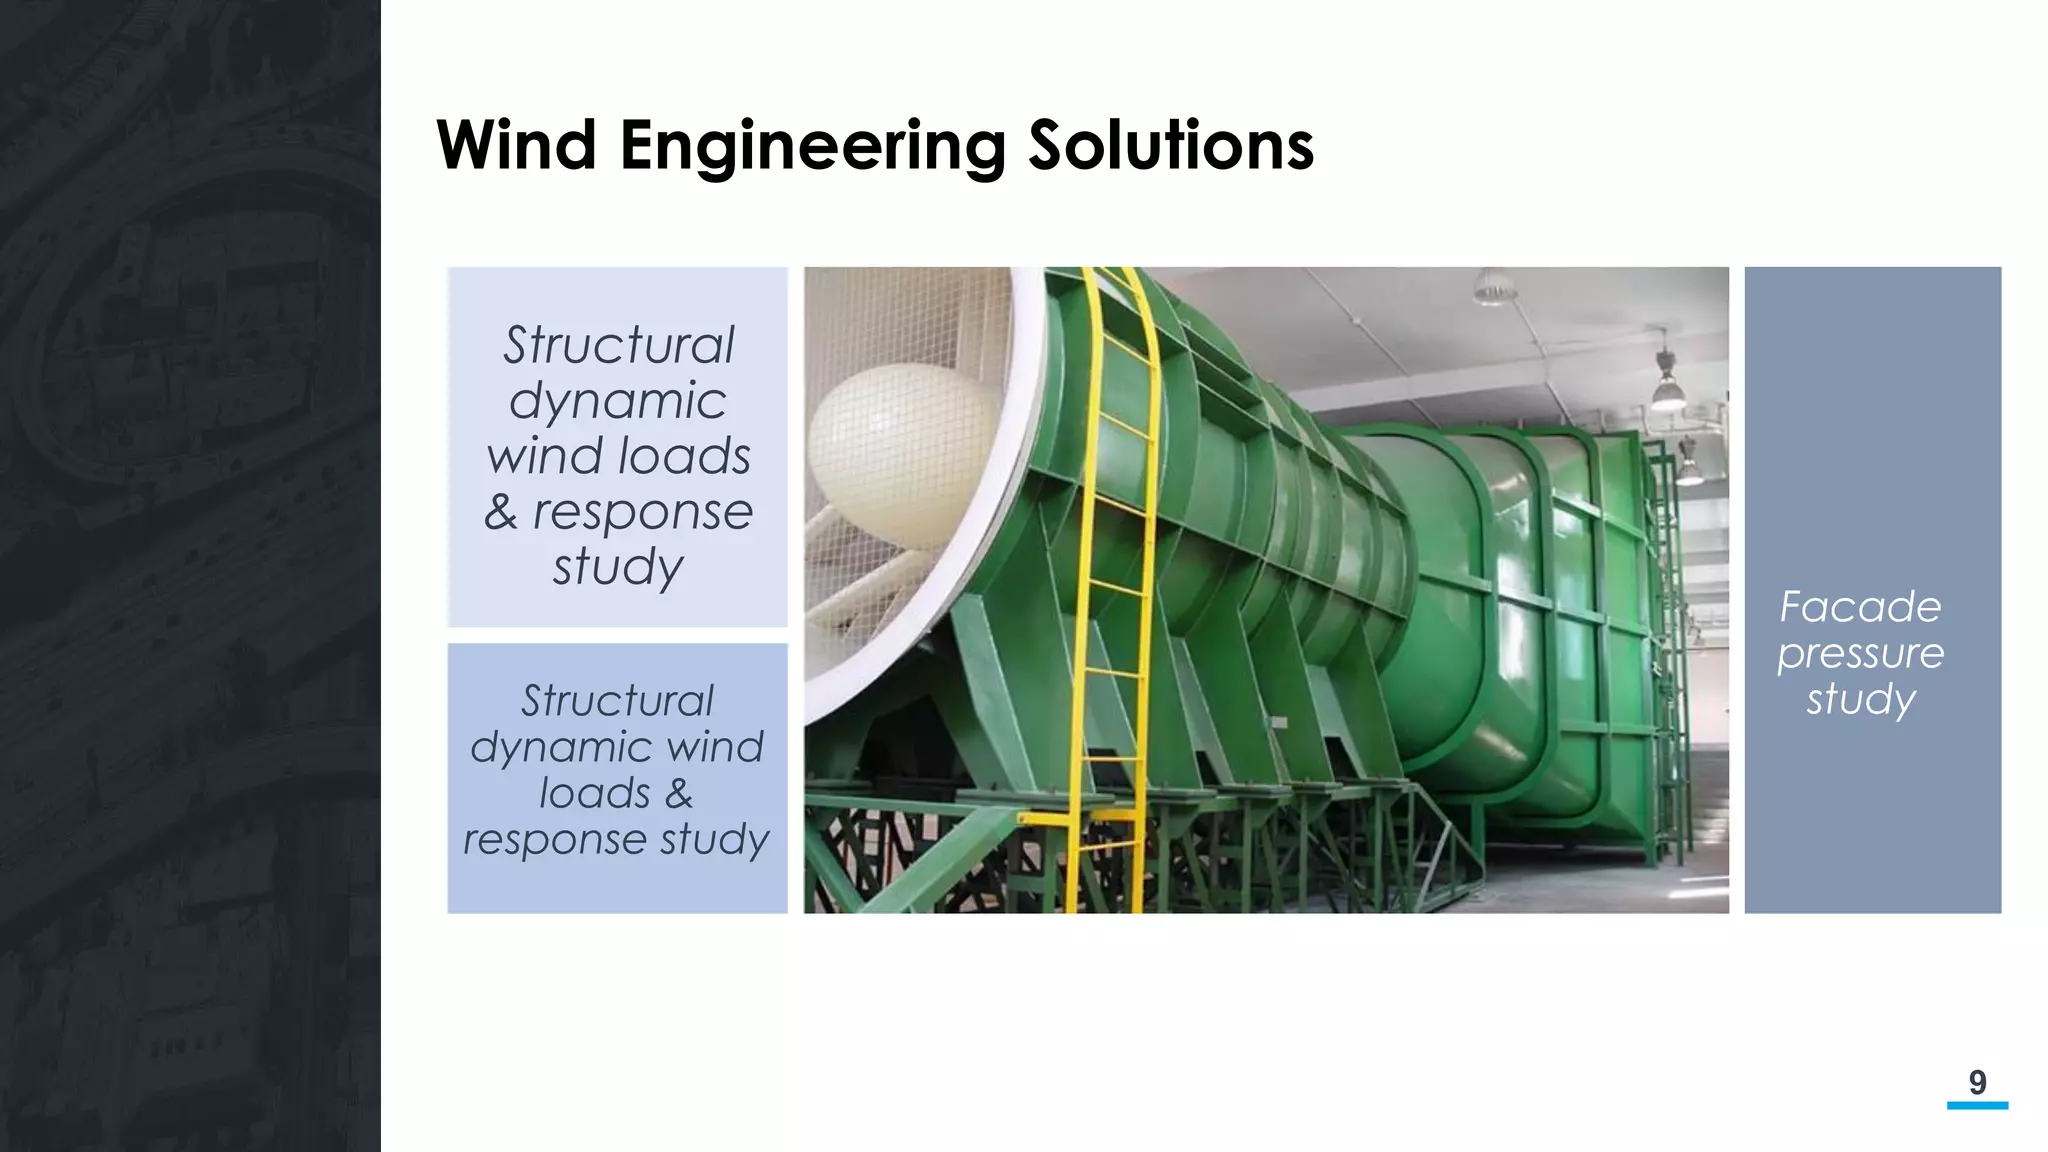
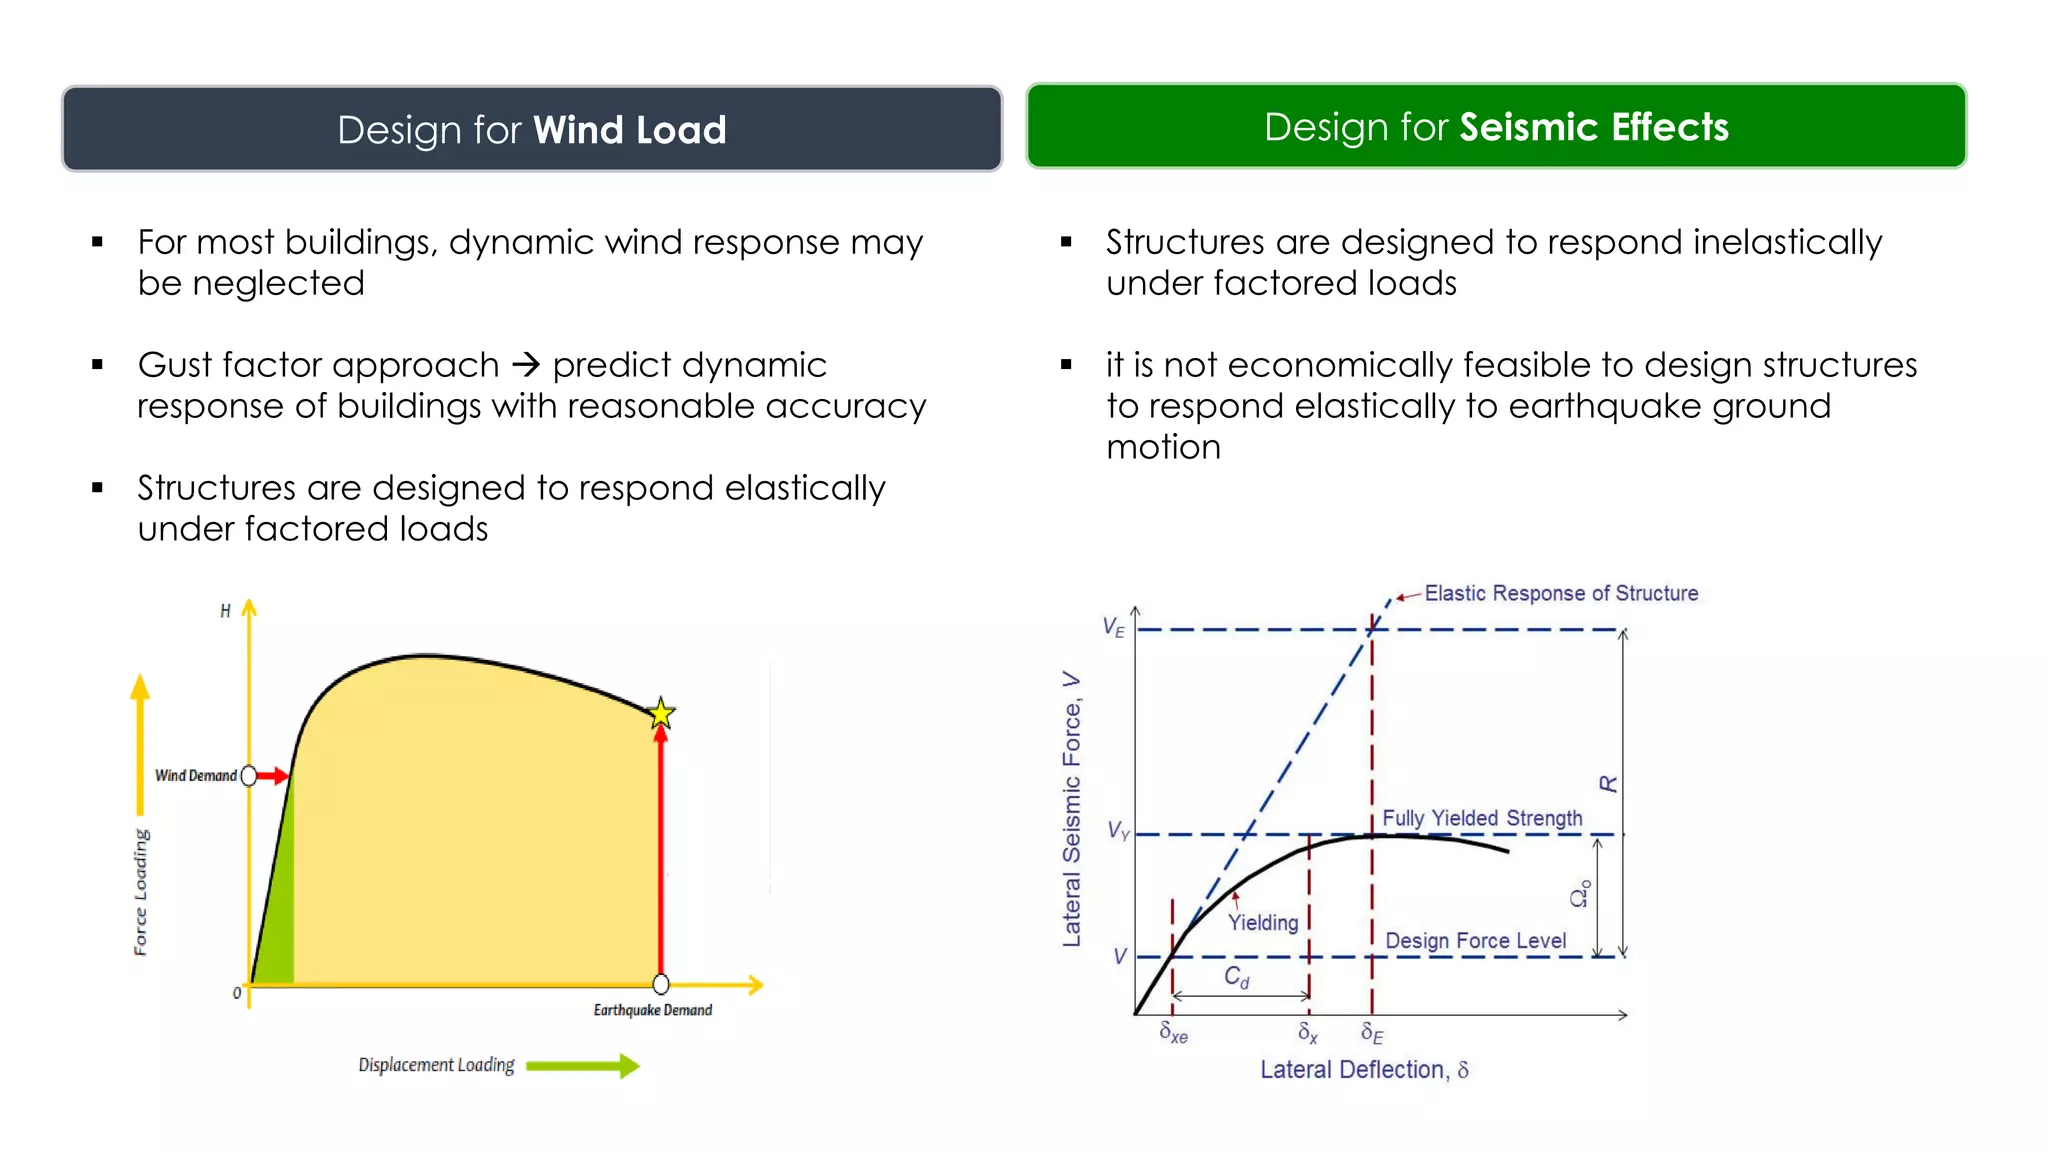
For mostbuildings, dynamic wind response may
be neglected
Gust factor approach predict dynamic
response of buildings with reasonable accuracy
Structures are designed to respond elastically
under factored loads
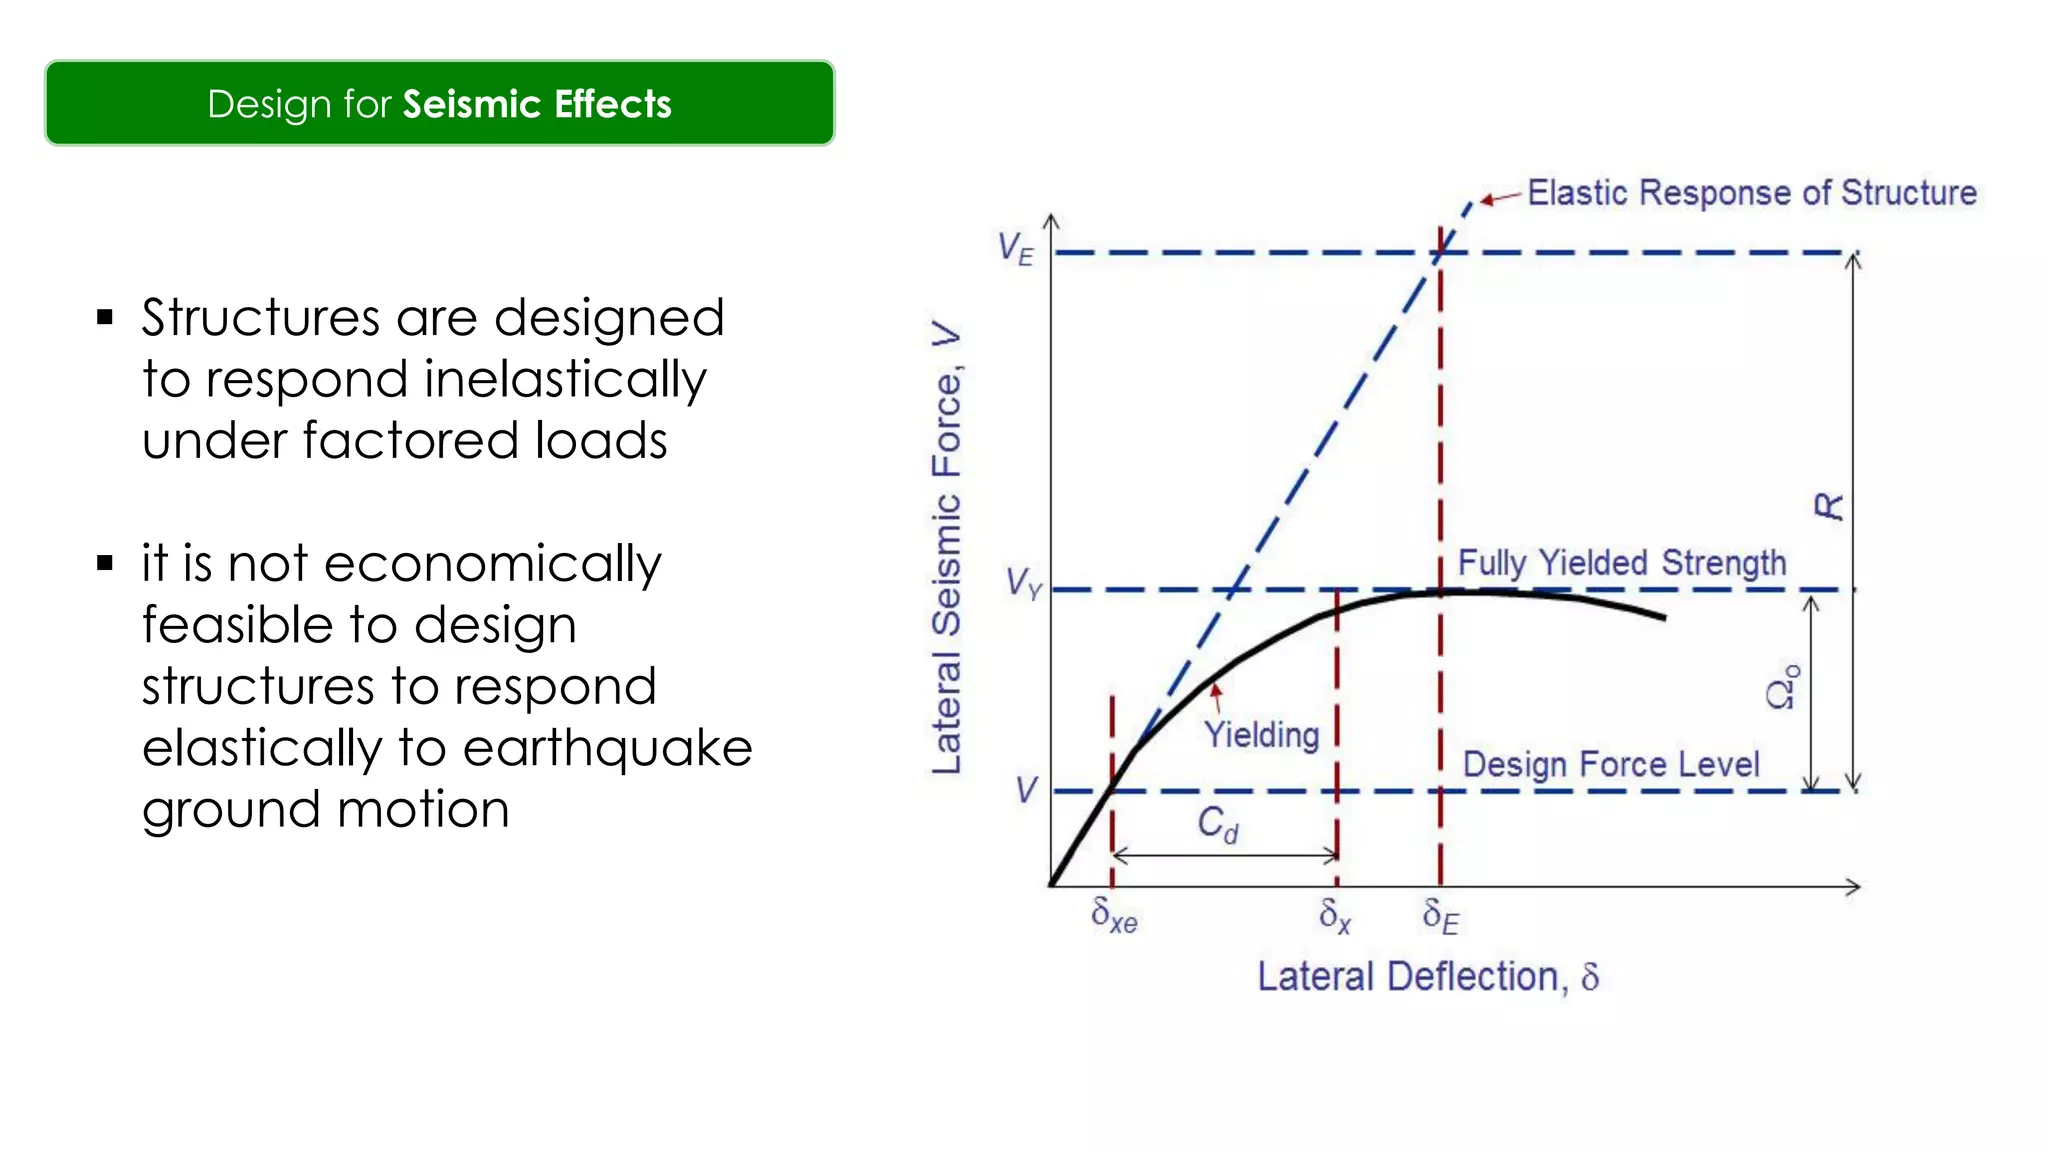
Structures are designed to respond inelastically
under factored loads
it is not economically feasible to design structures
to respond elastically to earthquake ground
motion
Design for Seismic EffectsDesign for Wind Load
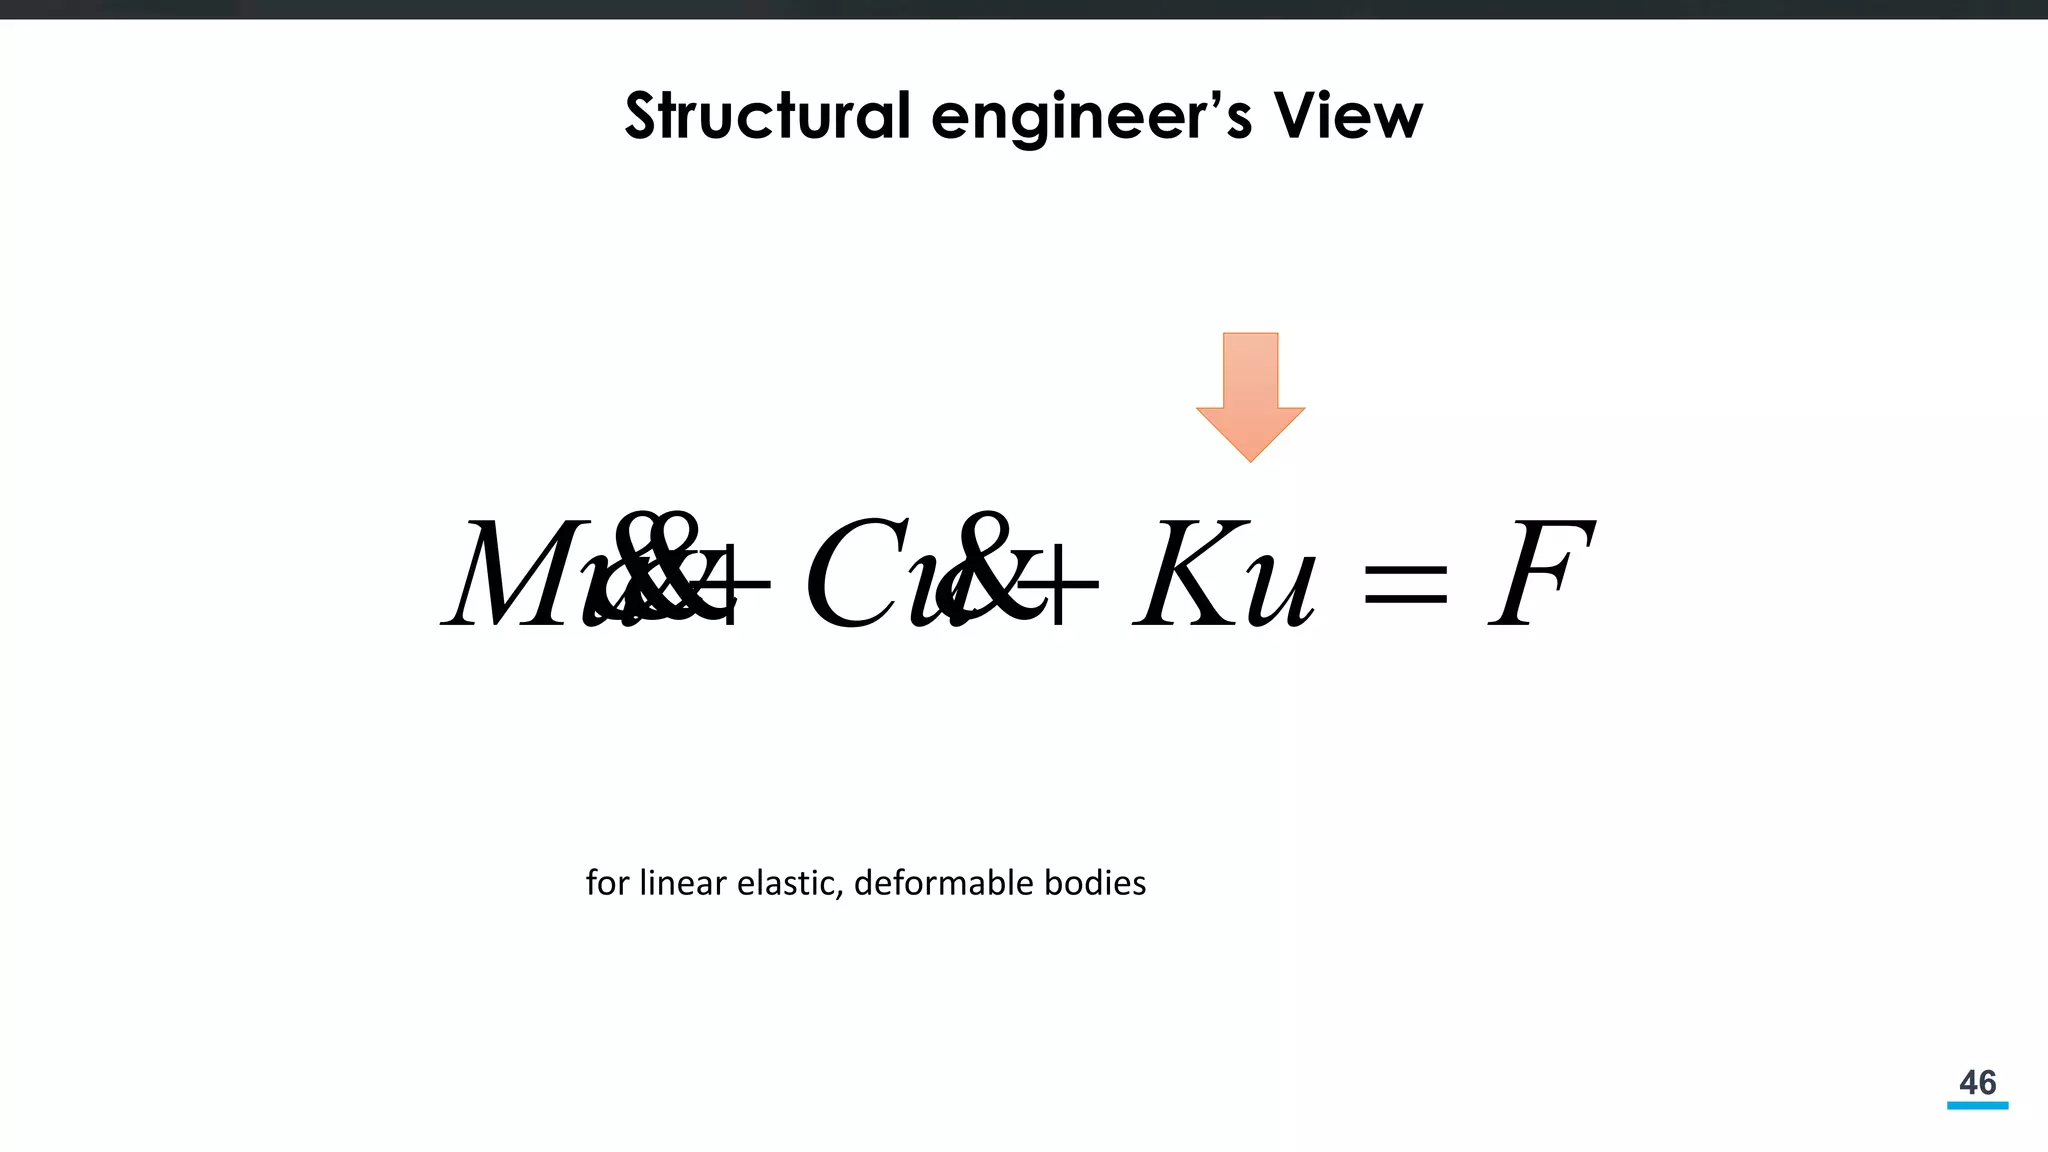
47
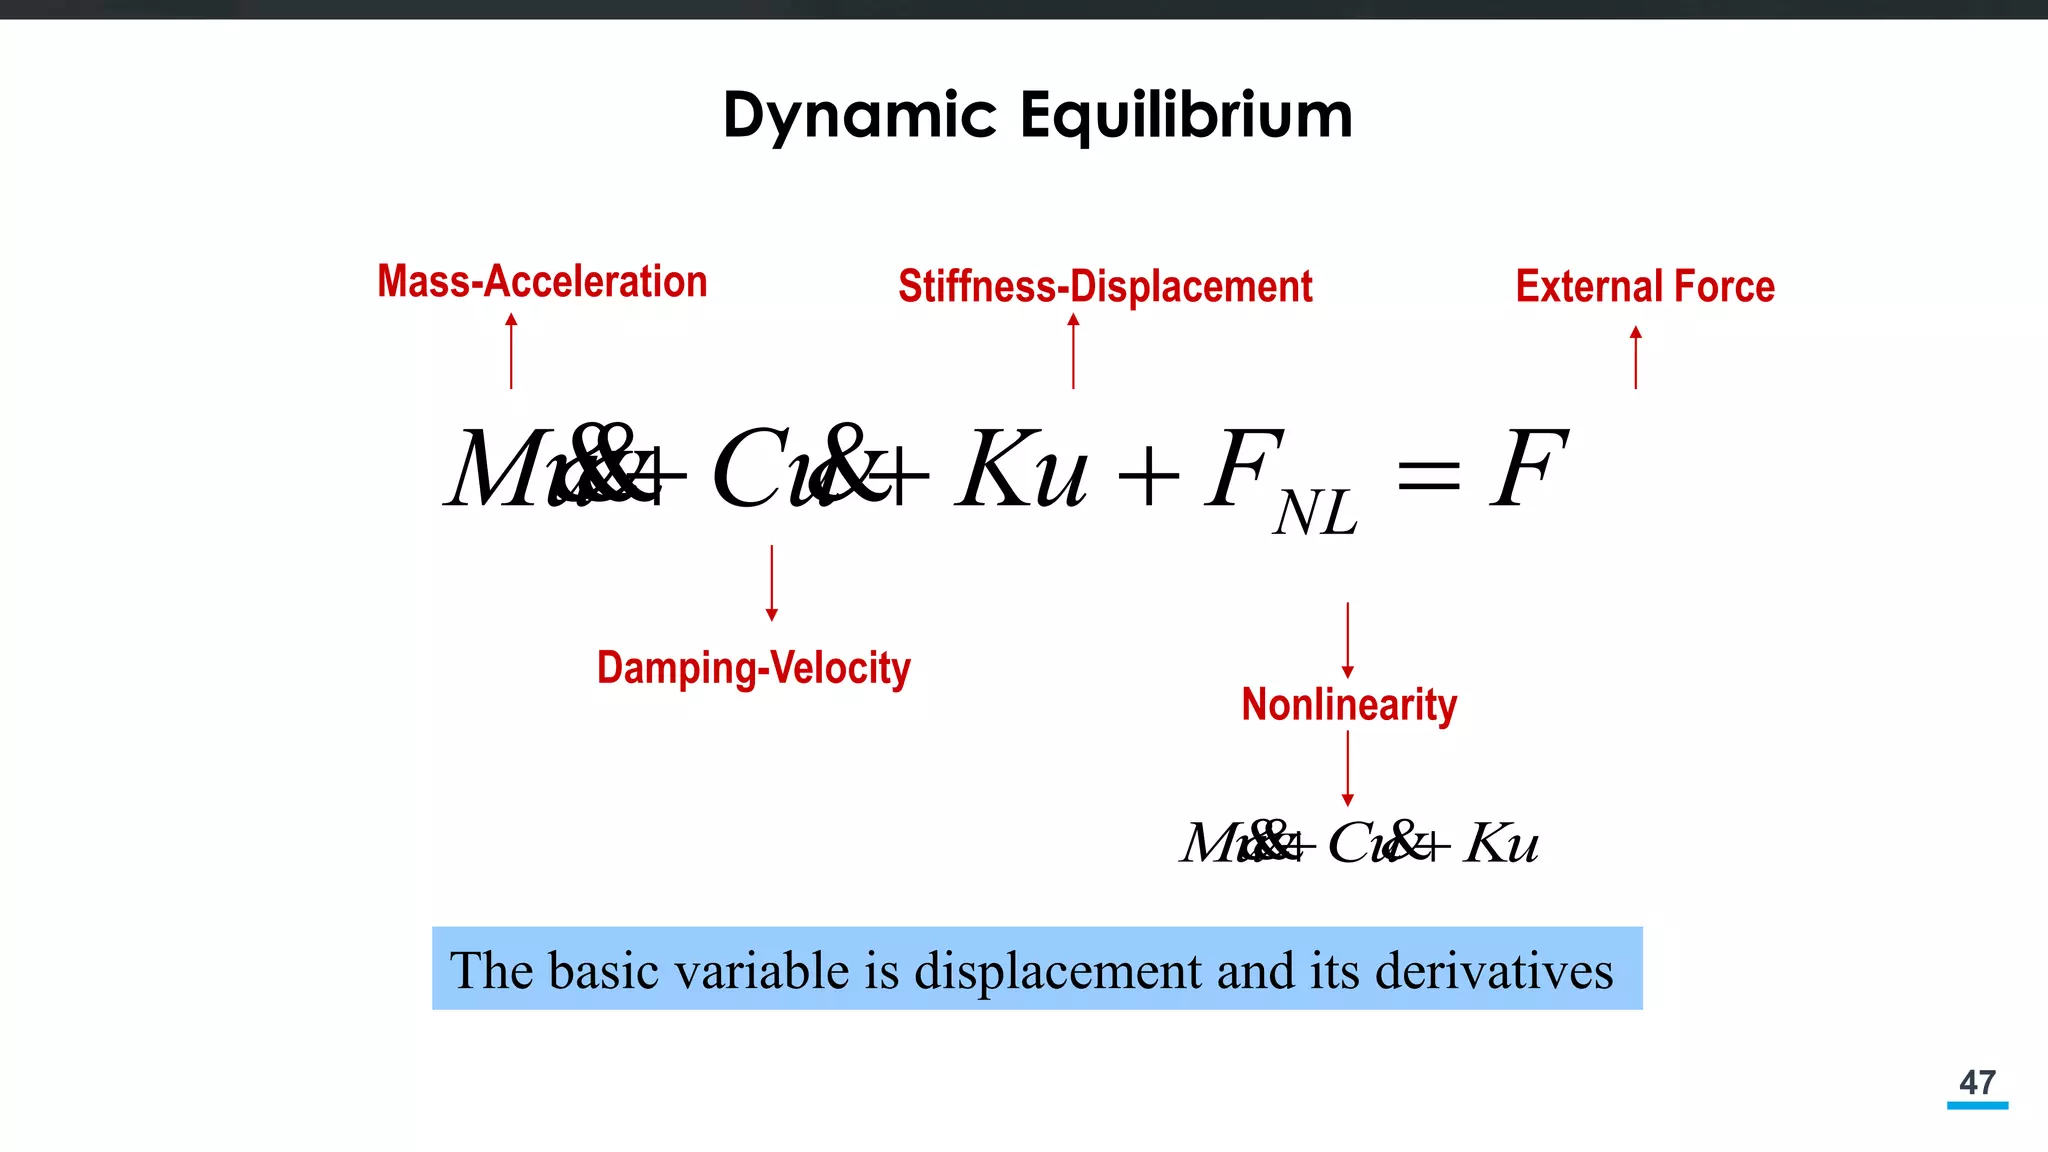
Dynamic Equilibrium
FFKuuCuM NL
Damping-Velocity
Mass-Acceleration Stiffness-Displacement
Nonlinearity
External Force
KuuCuM
The basic variable is displacement and its derivatives
48.
48
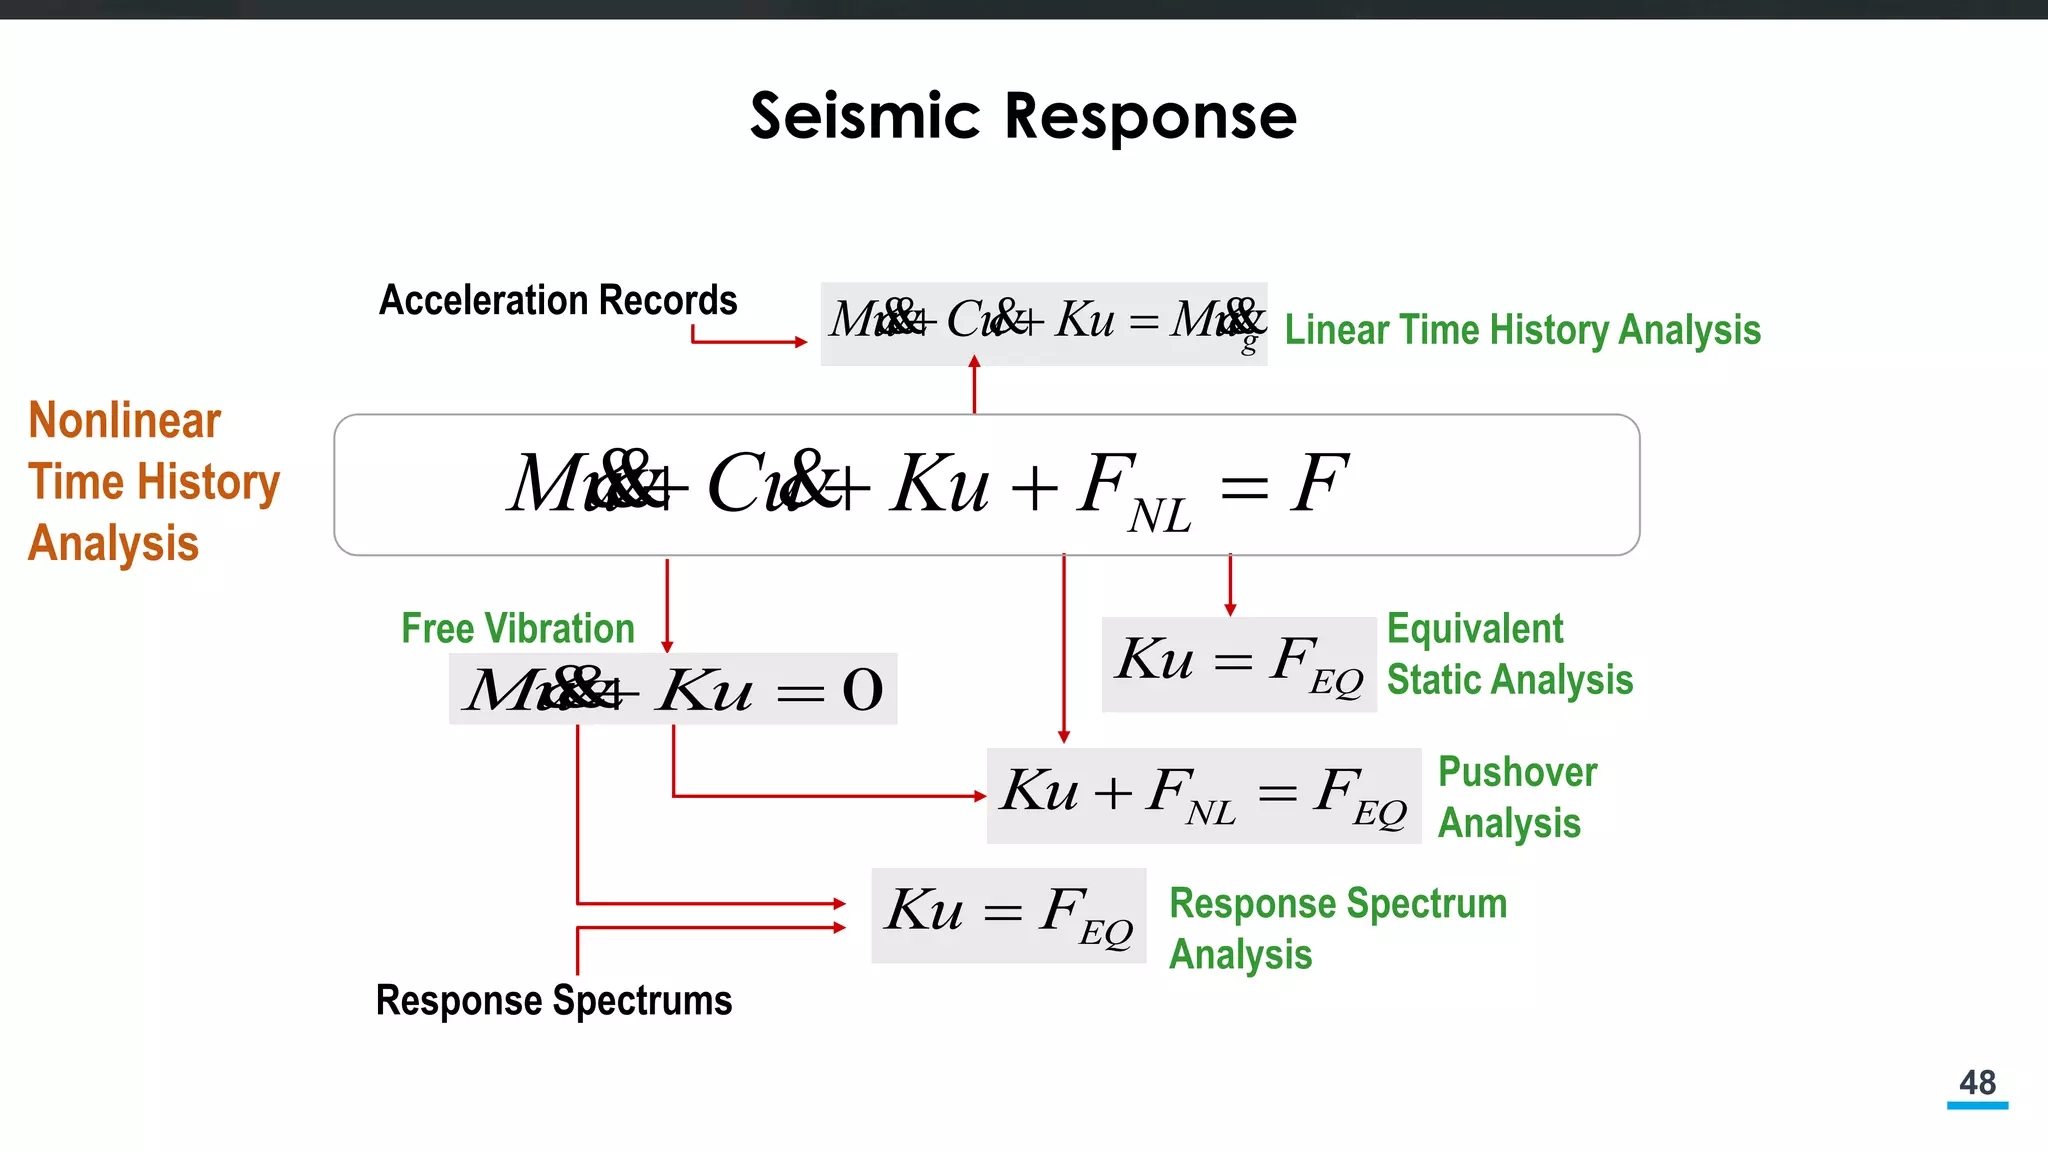
Seismic Response
FFKuuCuM NL
Linear Time History Analysis
0 KuuM
EQNL FFKu
Free Vibration
Pushover
Analysis
EQFKu
Equivalent
Static Analysis
EQFKu
Response Spectrums
Response Spectrum
Analysis
Acceleration Records
guMKuuCuM
Nonlinear
Time History
Analysis
50
Structures aredesigned
to respond inelastically
under factored loads
it is not economically
feasible to design
structures to respond
elastically to earthquake
ground motion
Design for Seismic Effects
51.
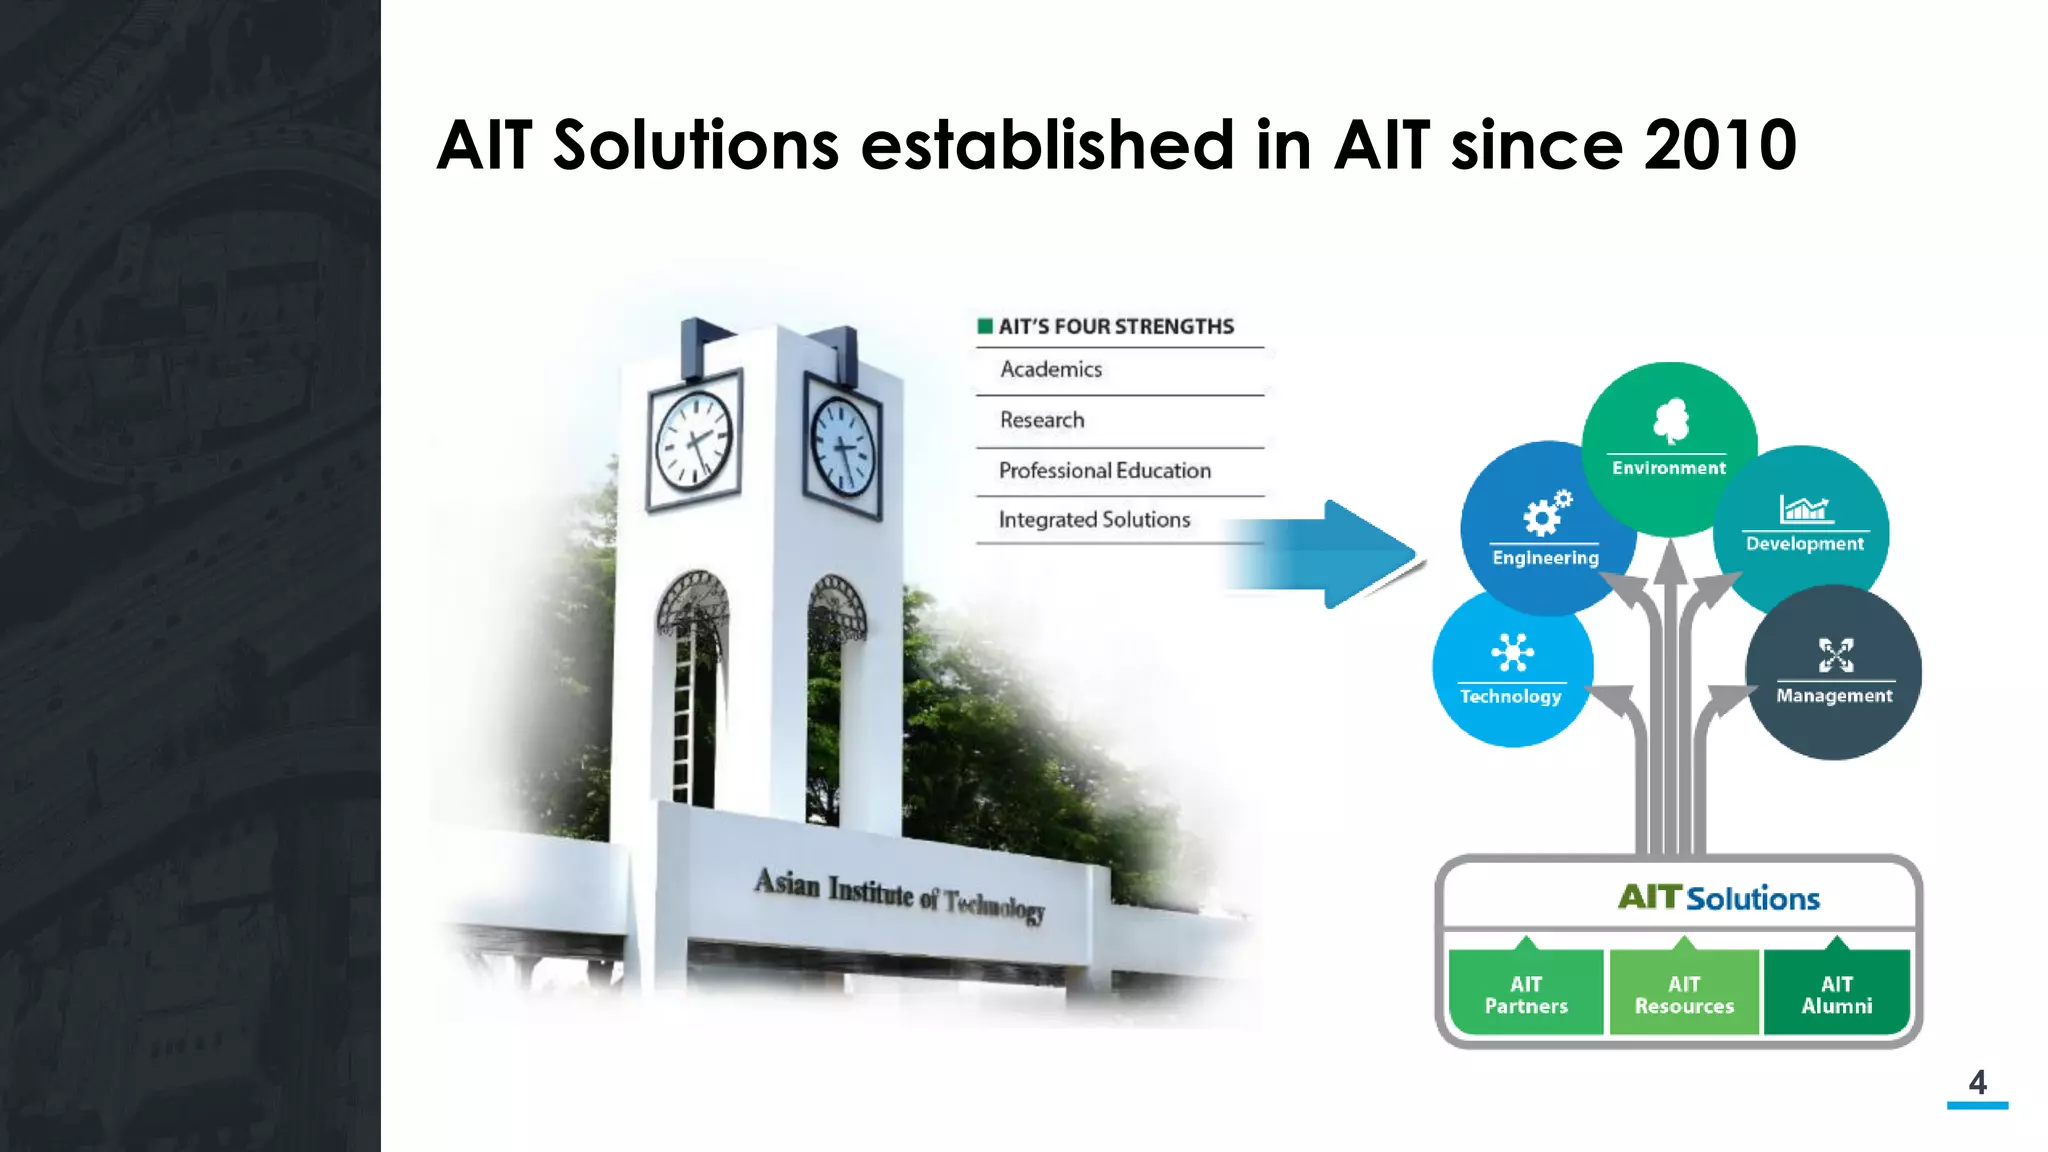
Introducing AIT Solutions
51
0
5
10
15
20
25
30
35
40
45
010 20 30 40 50 60
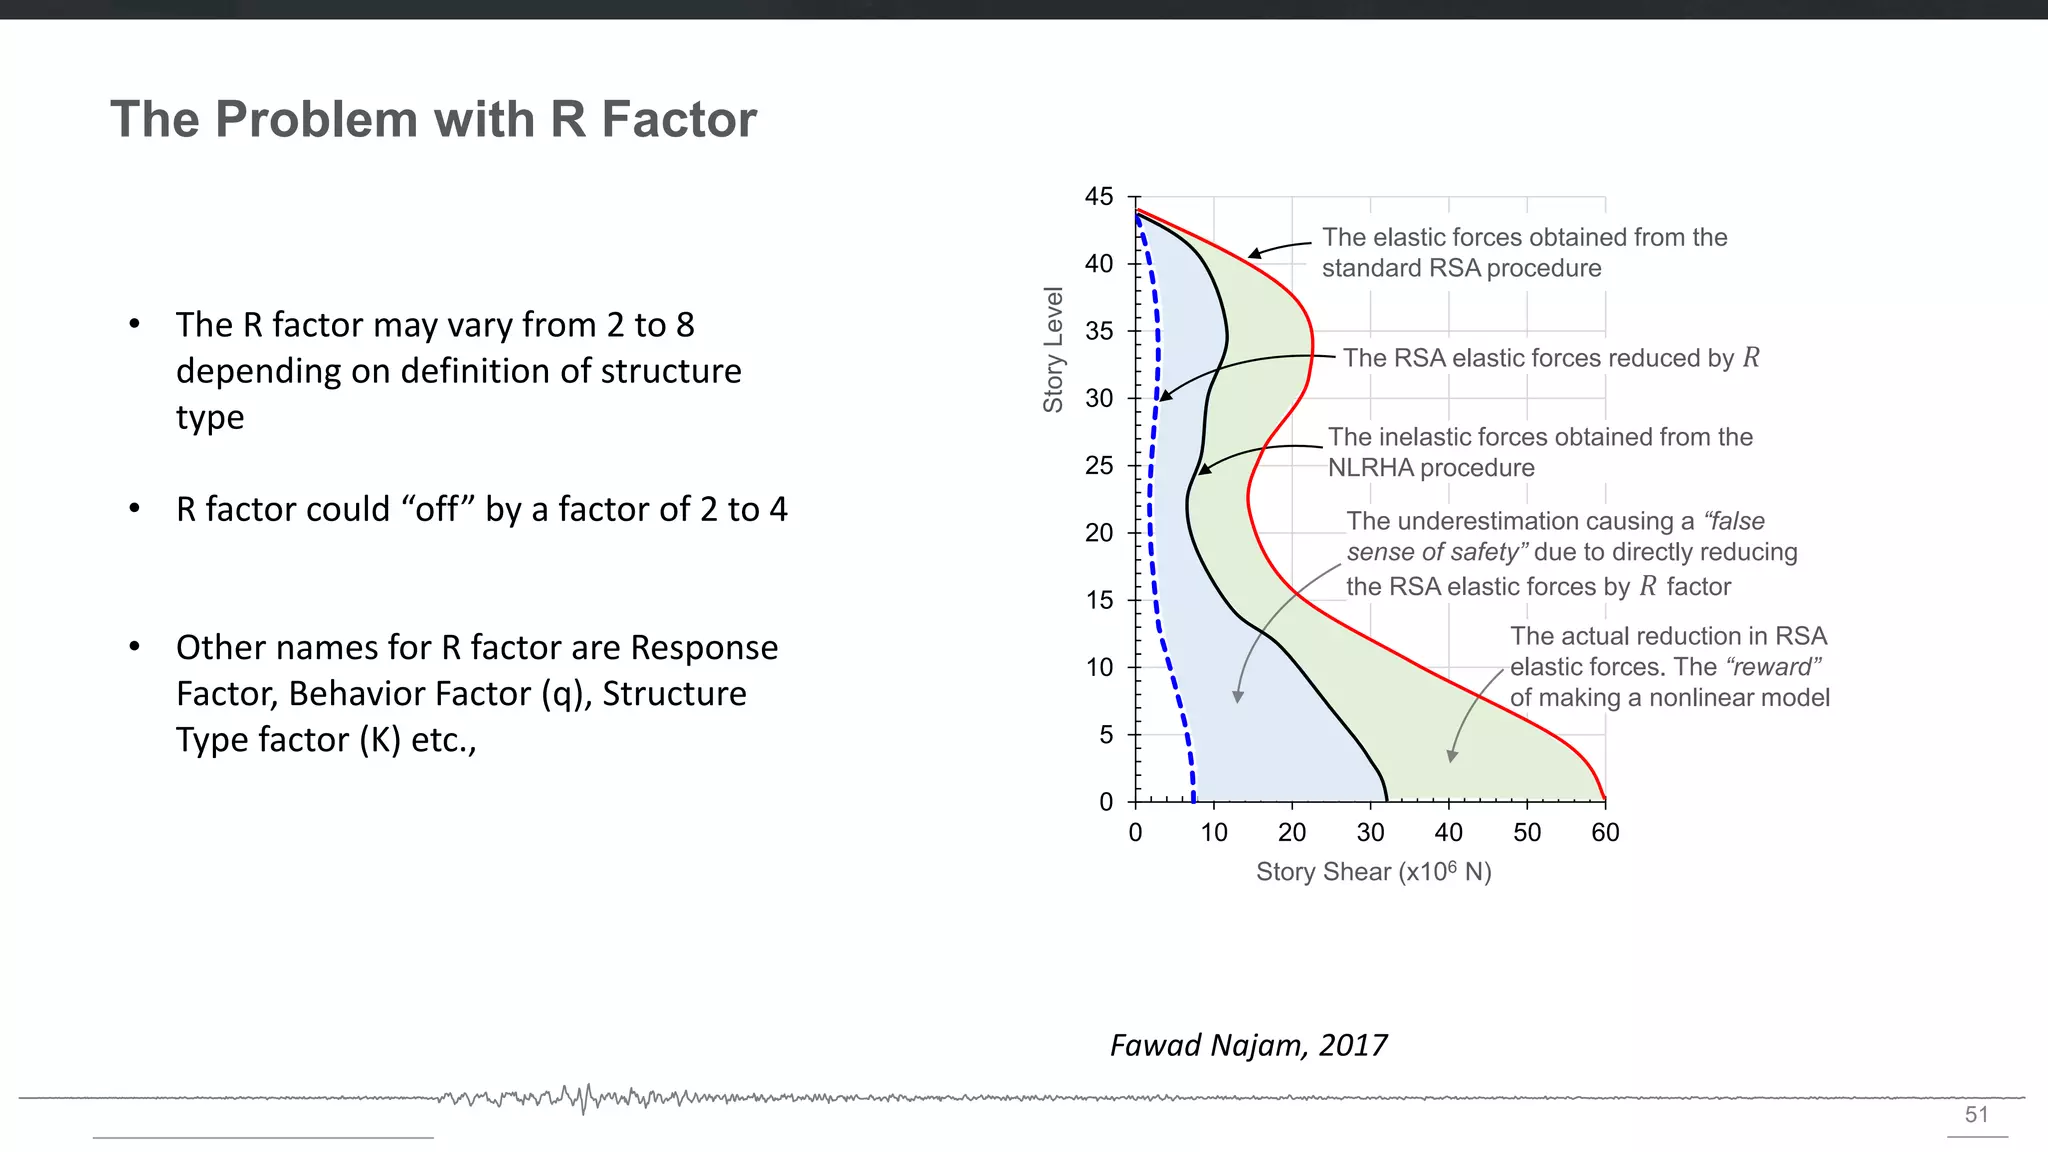
The Problem with R Factor
The elastic forces obtained from the
standard RSA procedure
The RSA elastic forces reduced by 𝑅
The inelastic forces obtained from the
NLRHA procedure
The actual reduction in RSA
elastic forces. The “reward”
of making a nonlinear model
The underestimation causing a “false
sense of safety” due to directly reducing
the RSA elastic forces by 𝑅 factor
Story Shear (x106 N)
StoryLevel
• The R factor may vary from 2 to 8
depending on definition of structure
type
• R factor could “off” by a factor of 2 to 4
• Other names for R factor are Response
Factor, Behavior Factor (q), Structure
Type factor (K) etc.,
Fawad Najam, 2017
54
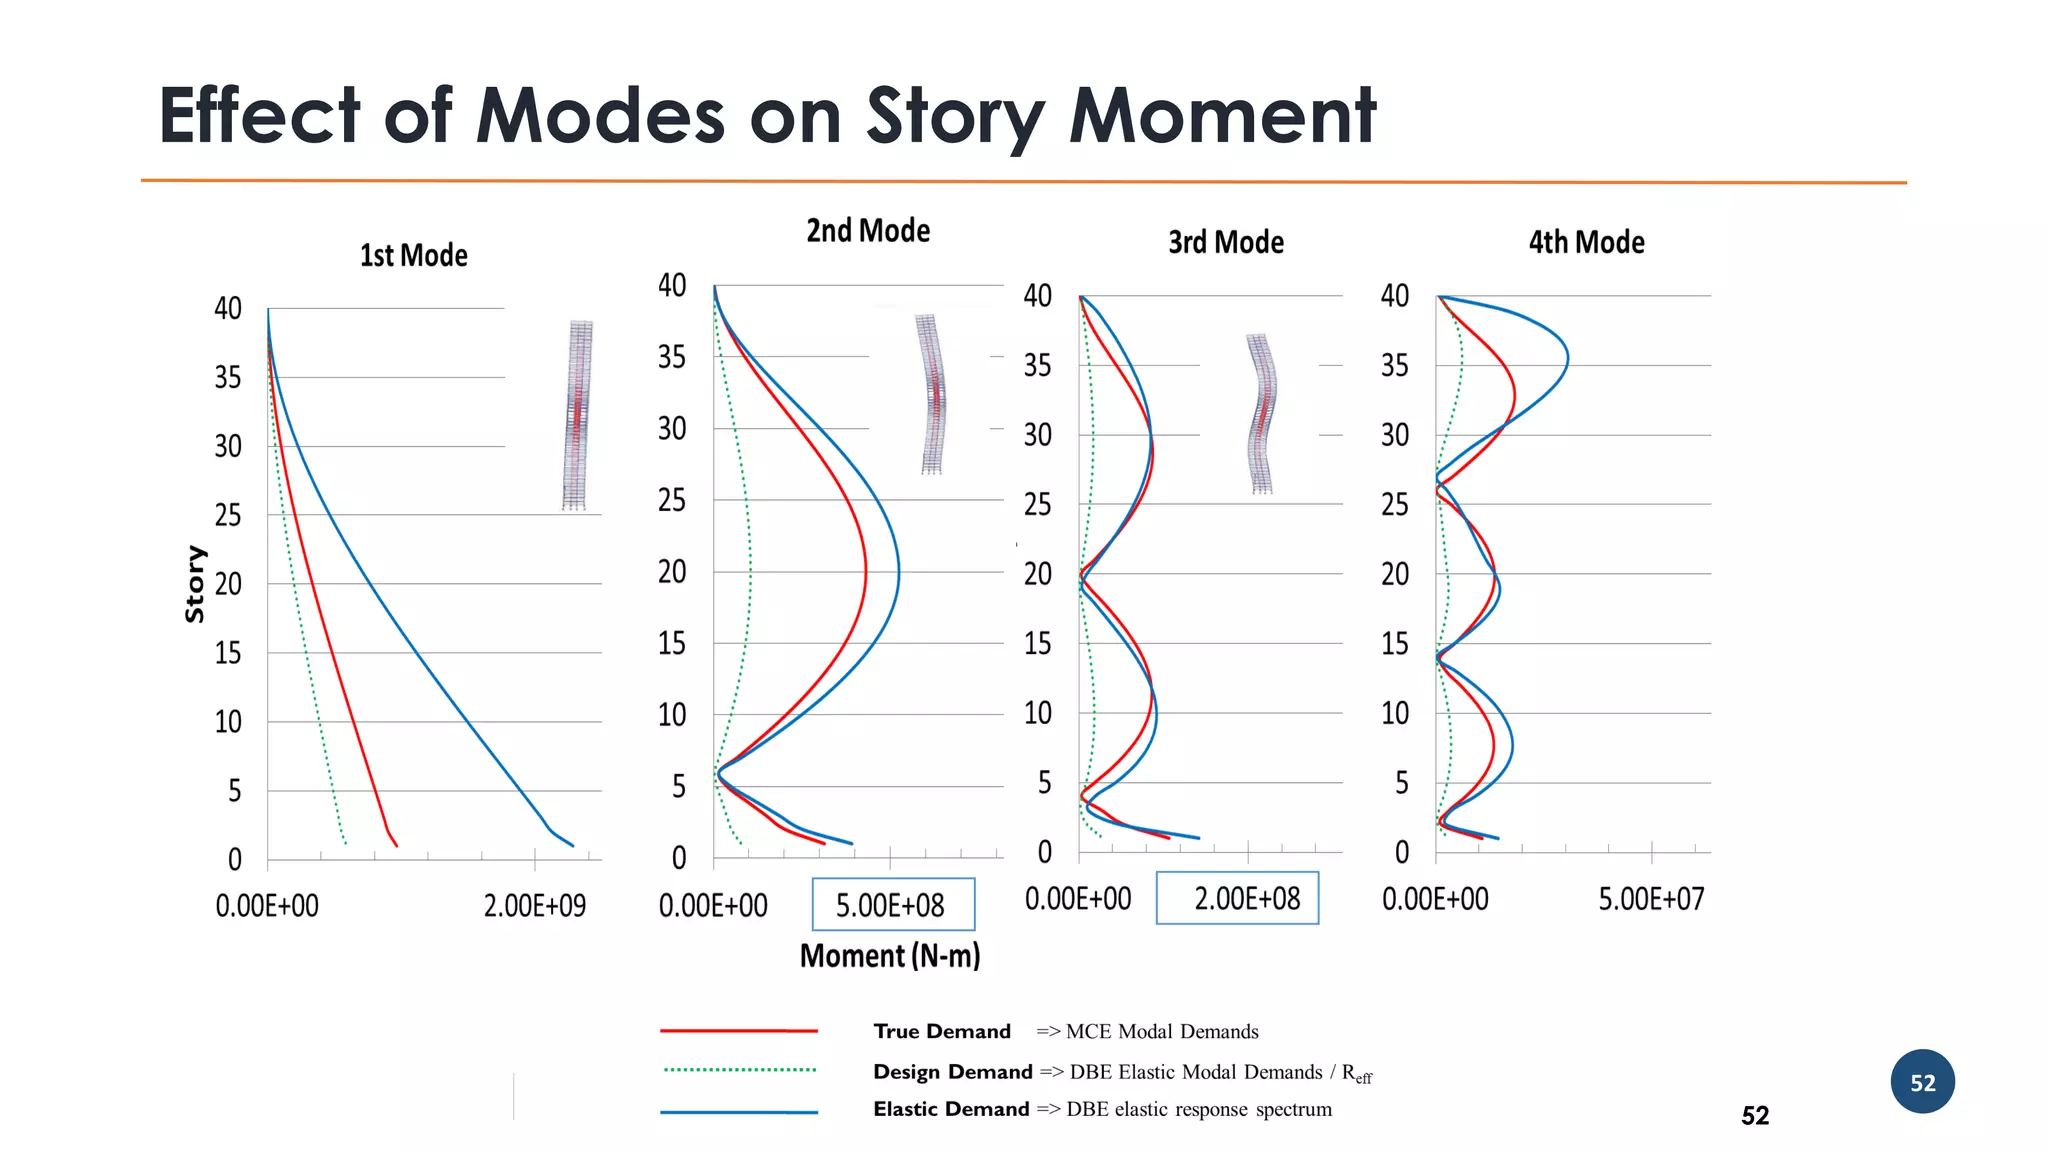
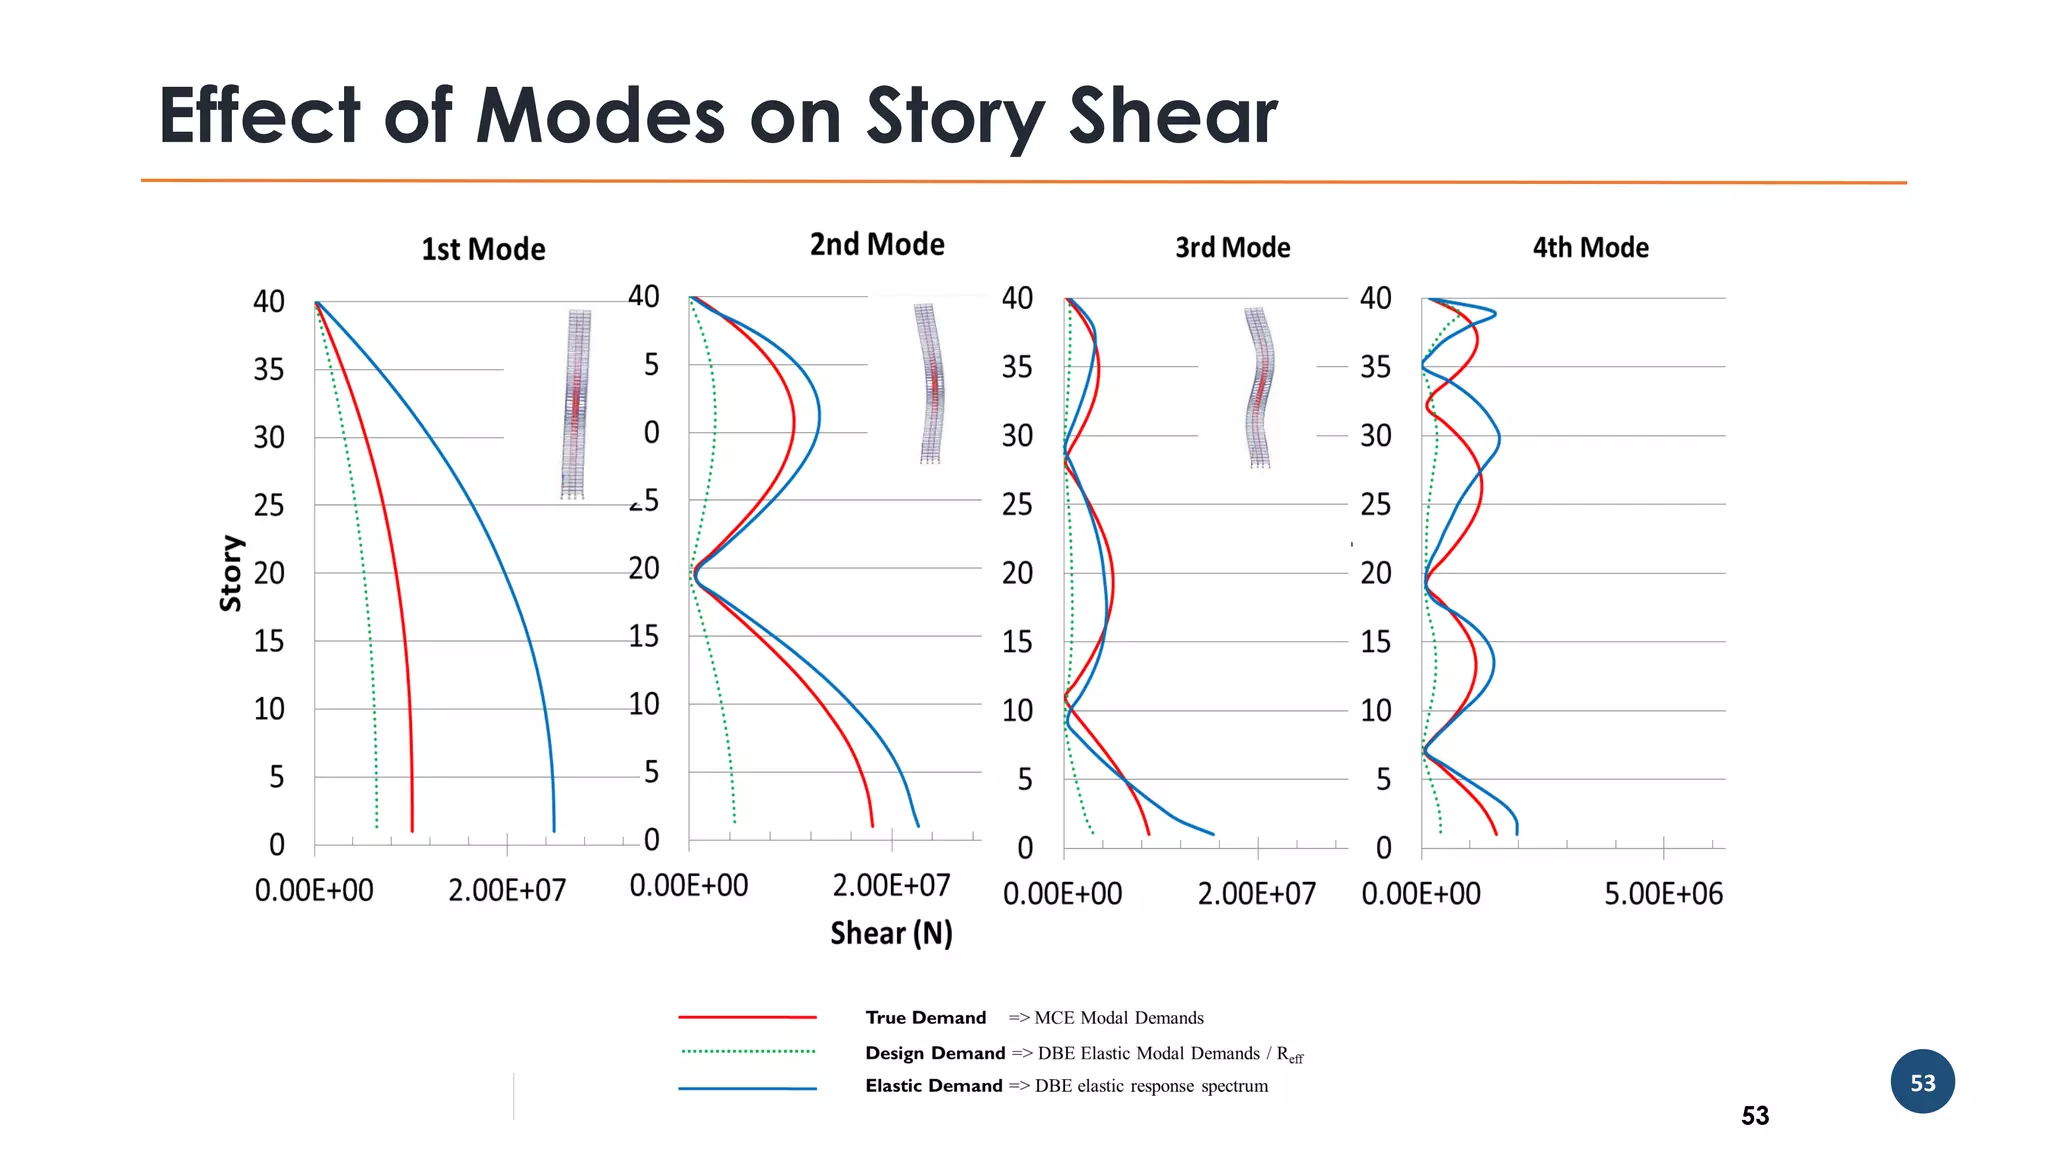
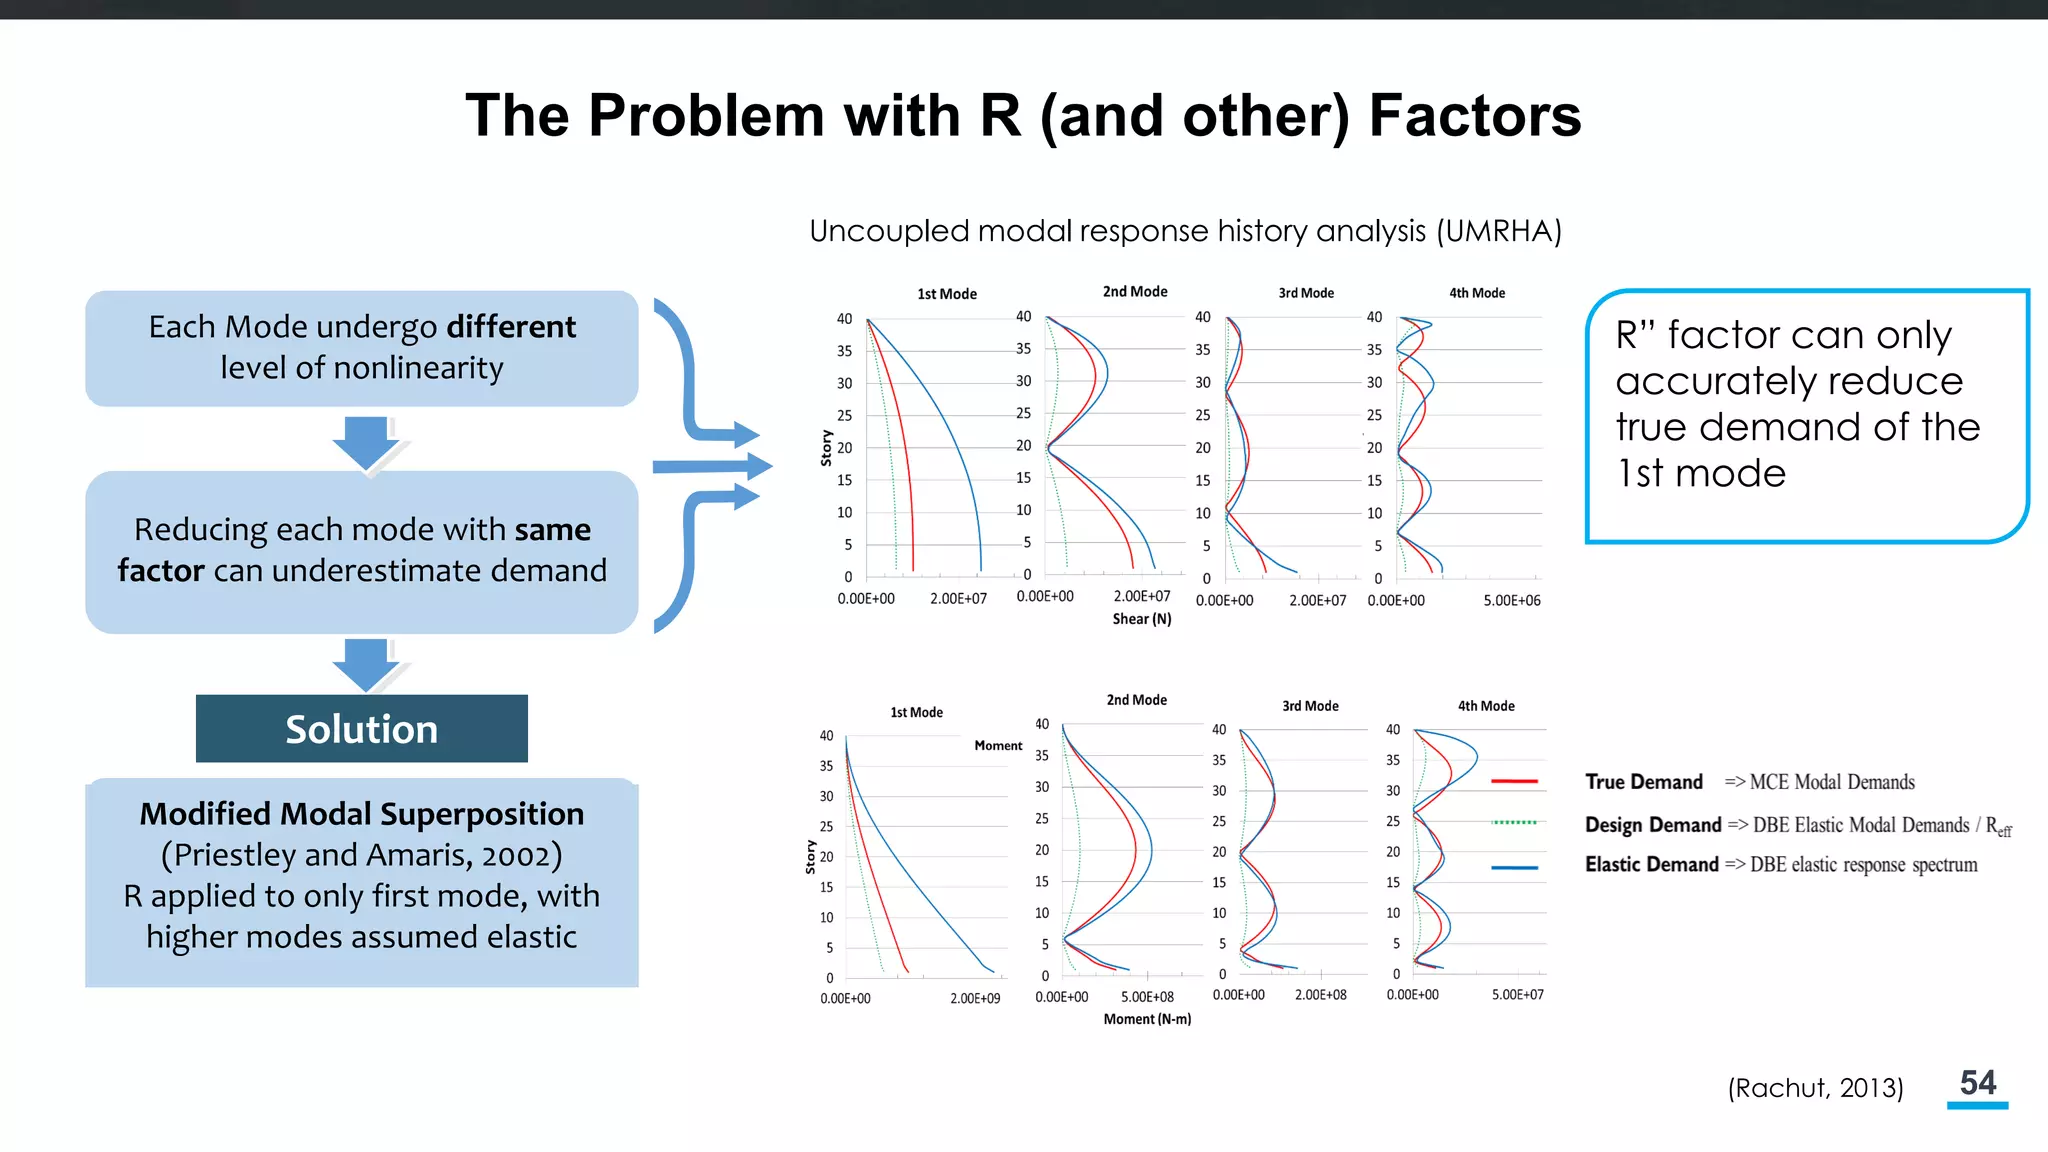
The Problem withR (and other) Factors
Reducing each mode with same
factor can underestimate demand
Each Mode undergo different
level of nonlinearity
Modified Modal Superposition
(Priestley and Amaris, 2002)
R applied to only first mode, with
higher modes assumed elastic
Solution
(Rachut, 2013)
Uncoupled modal response history analysis (UMRHA)
R” factor can only
accurately reduce
true demand of the
1st mode
55.
55
Are All
Buildings
Codes
Correct ?
•All codes have different values of R and other factors
• If they differ, can all of them be correct ?
• Did we inform the structures to follow which code when
earthquake or hurricane strikes ?
• Codes change every 3 or years, should we upgrade our
structures every 3 or 5 years to conform ?
56.
56
Code
Comparison for
Seismic
Performance
• ComparePerformance of buildings designed to
different codes
• ACI 318-14 + ASCE 7-10
• BS 8110-1997 + EURO-8
• EURO-2-2004 + EURO-8
• For low-seismic and high seismic zone
• Manila > Very High
• Bangkok > Low to medium
• All produce different level or performance in different
components !!
Two MS Thesis, 2016 at AIT
58
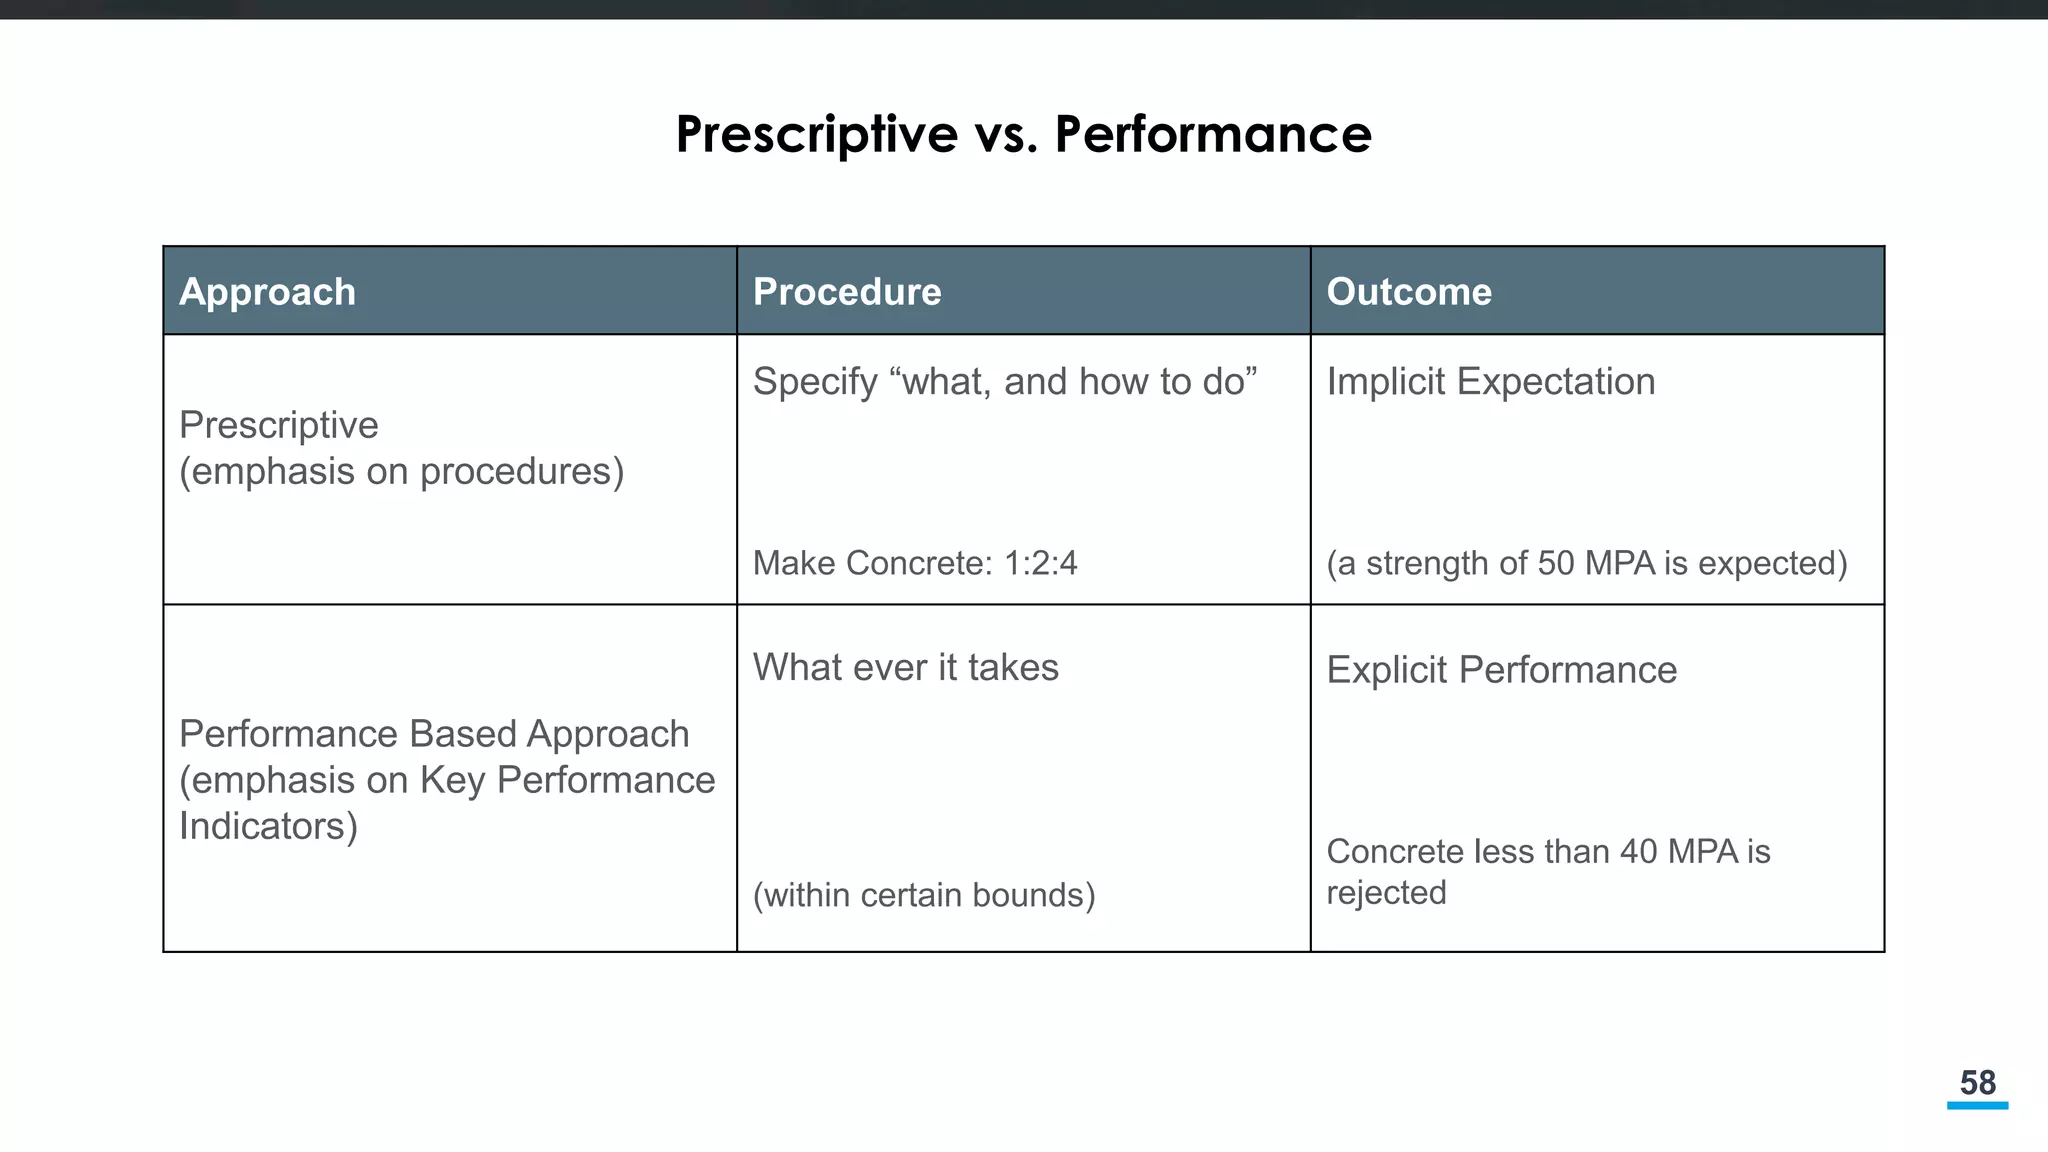
Prescriptive vs. Performance
ApproachProcedure Outcome
Prescriptive
(emphasis on procedures)
Specify “what, and how to do”
Make Concrete: 1:2:4
Implicit Expectation
(a strength of 50 MPA is expected)
Performance Based Approach
(emphasis on Key Performance
Indicators)
What ever it takes
(within certain bounds)
Explicit Performance
Concrete less than 40 MPA is
rejected
59.
59
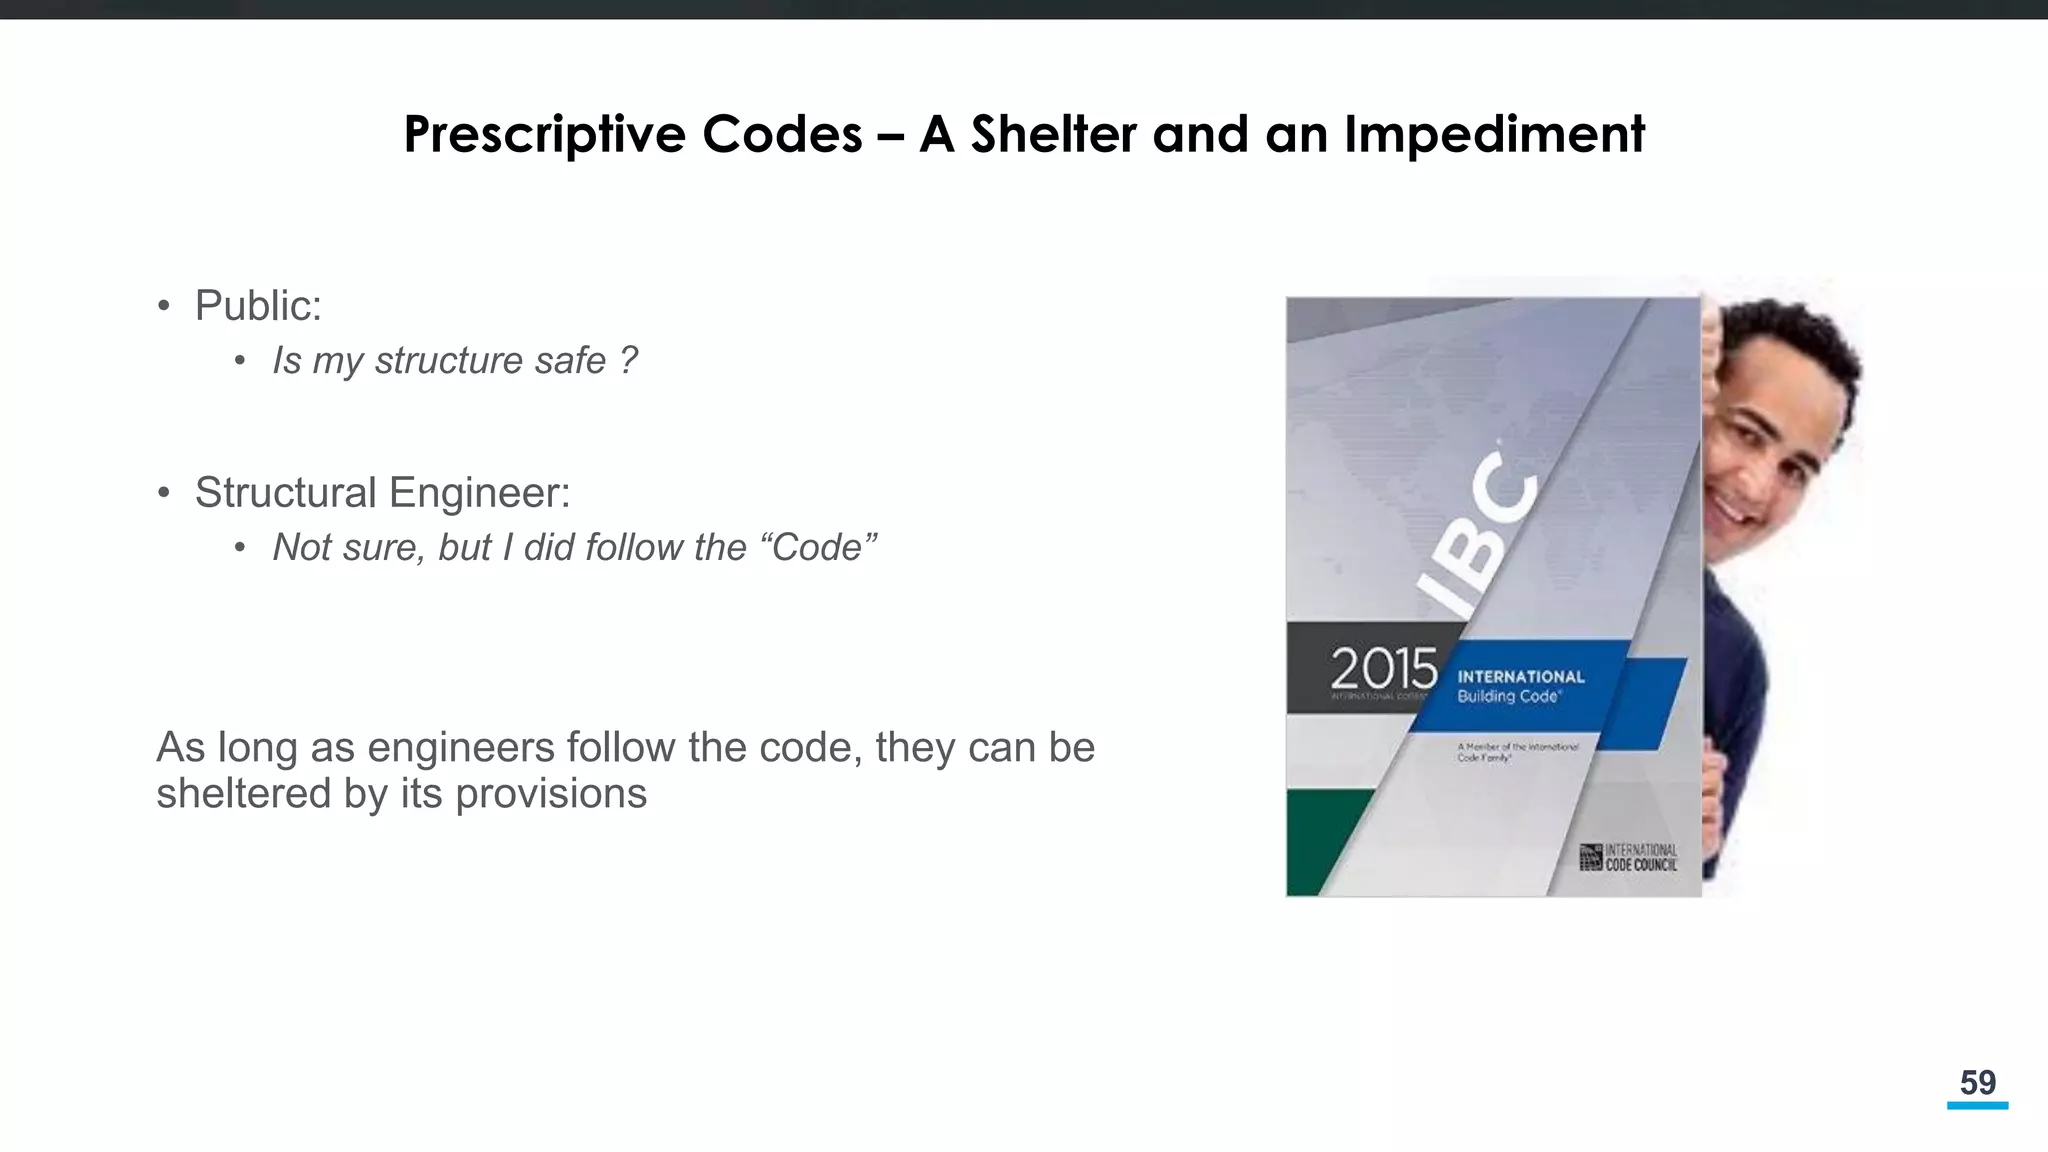
Prescriptive Codes –A Shelter and an Impediment
• Public:
• Is my structure safe ?
• Structural Engineer:
• Not sure, but I did follow the “Code”
As long as engineers follow the code, they can be
sheltered by its provisions
63
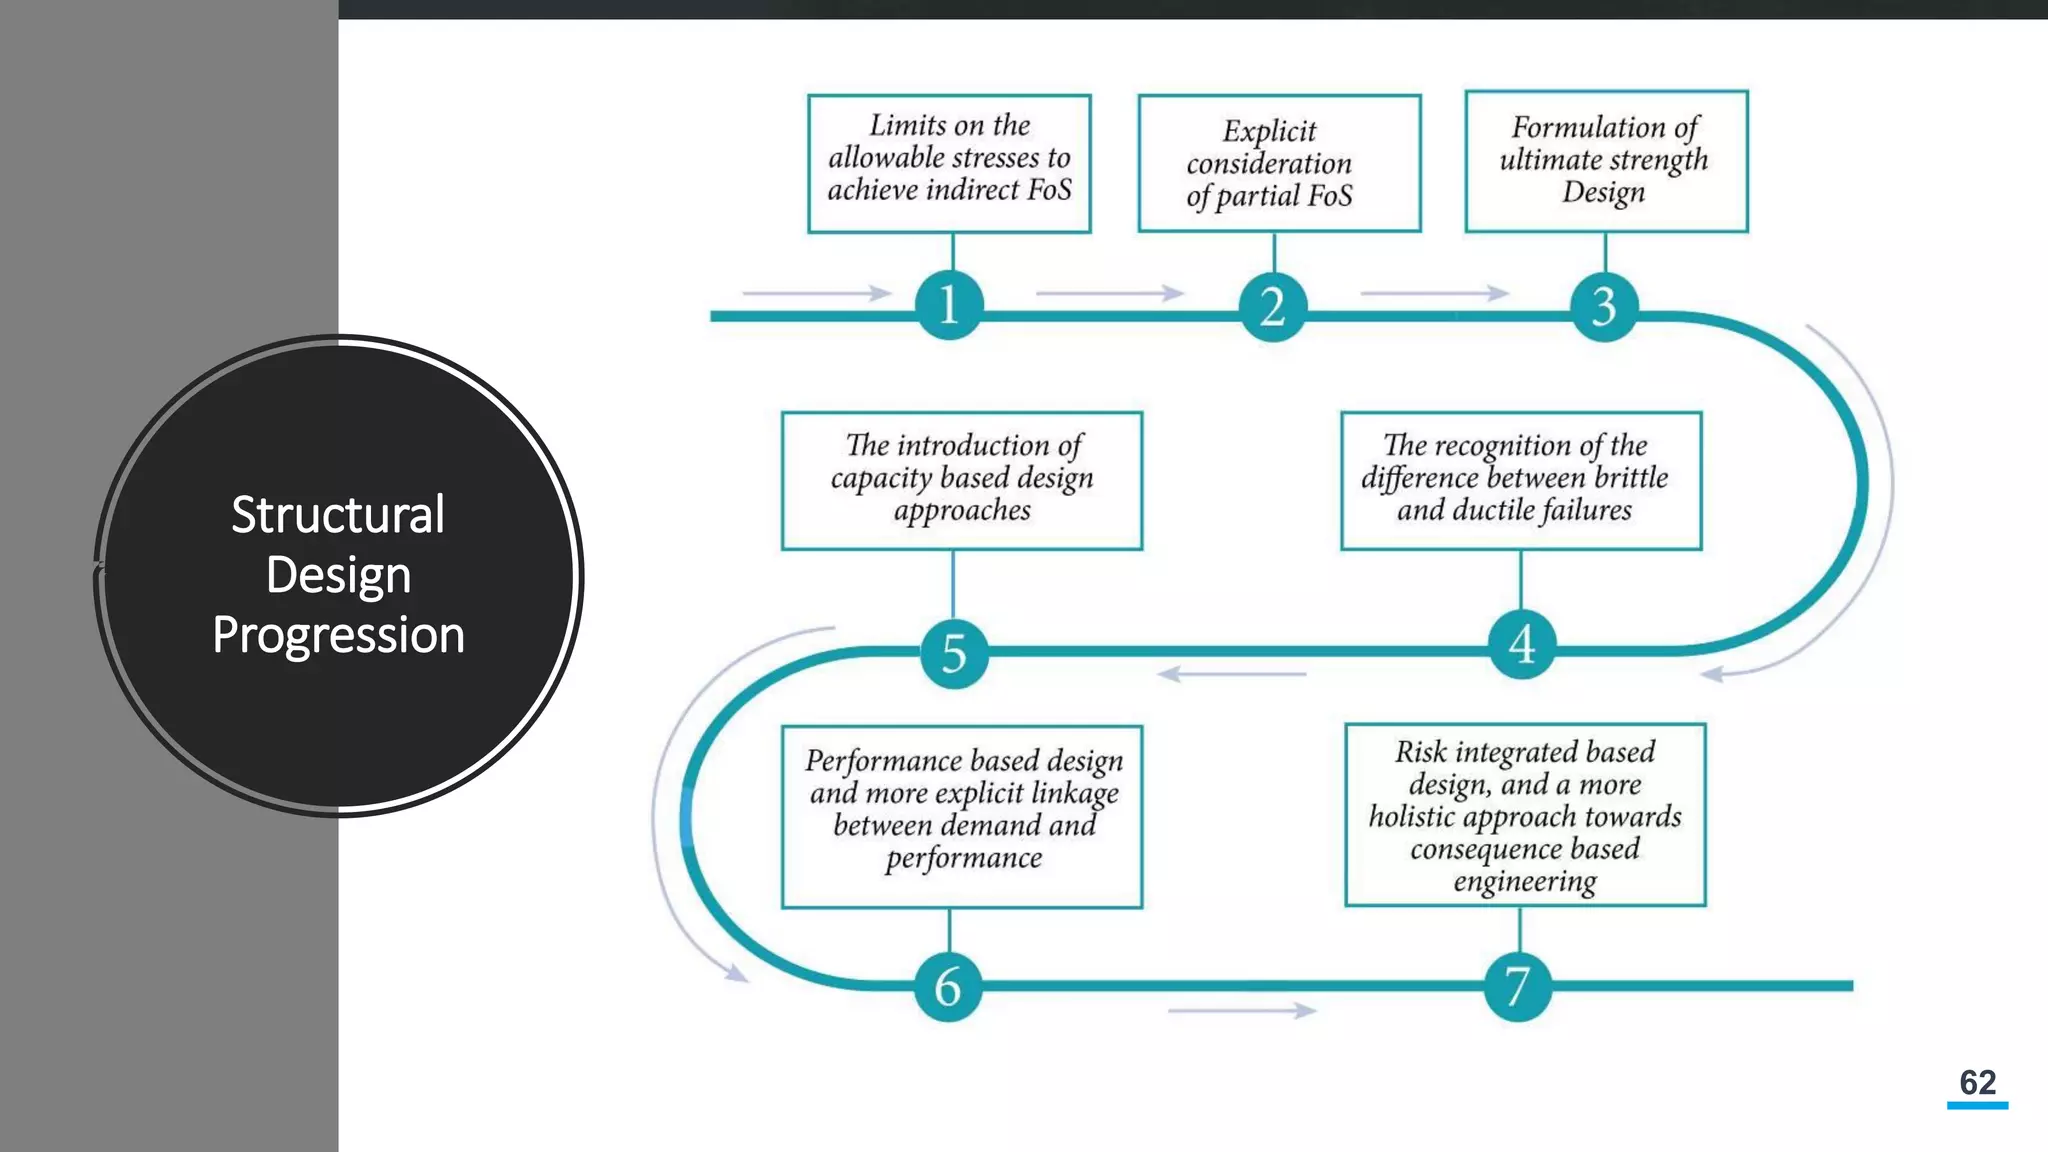
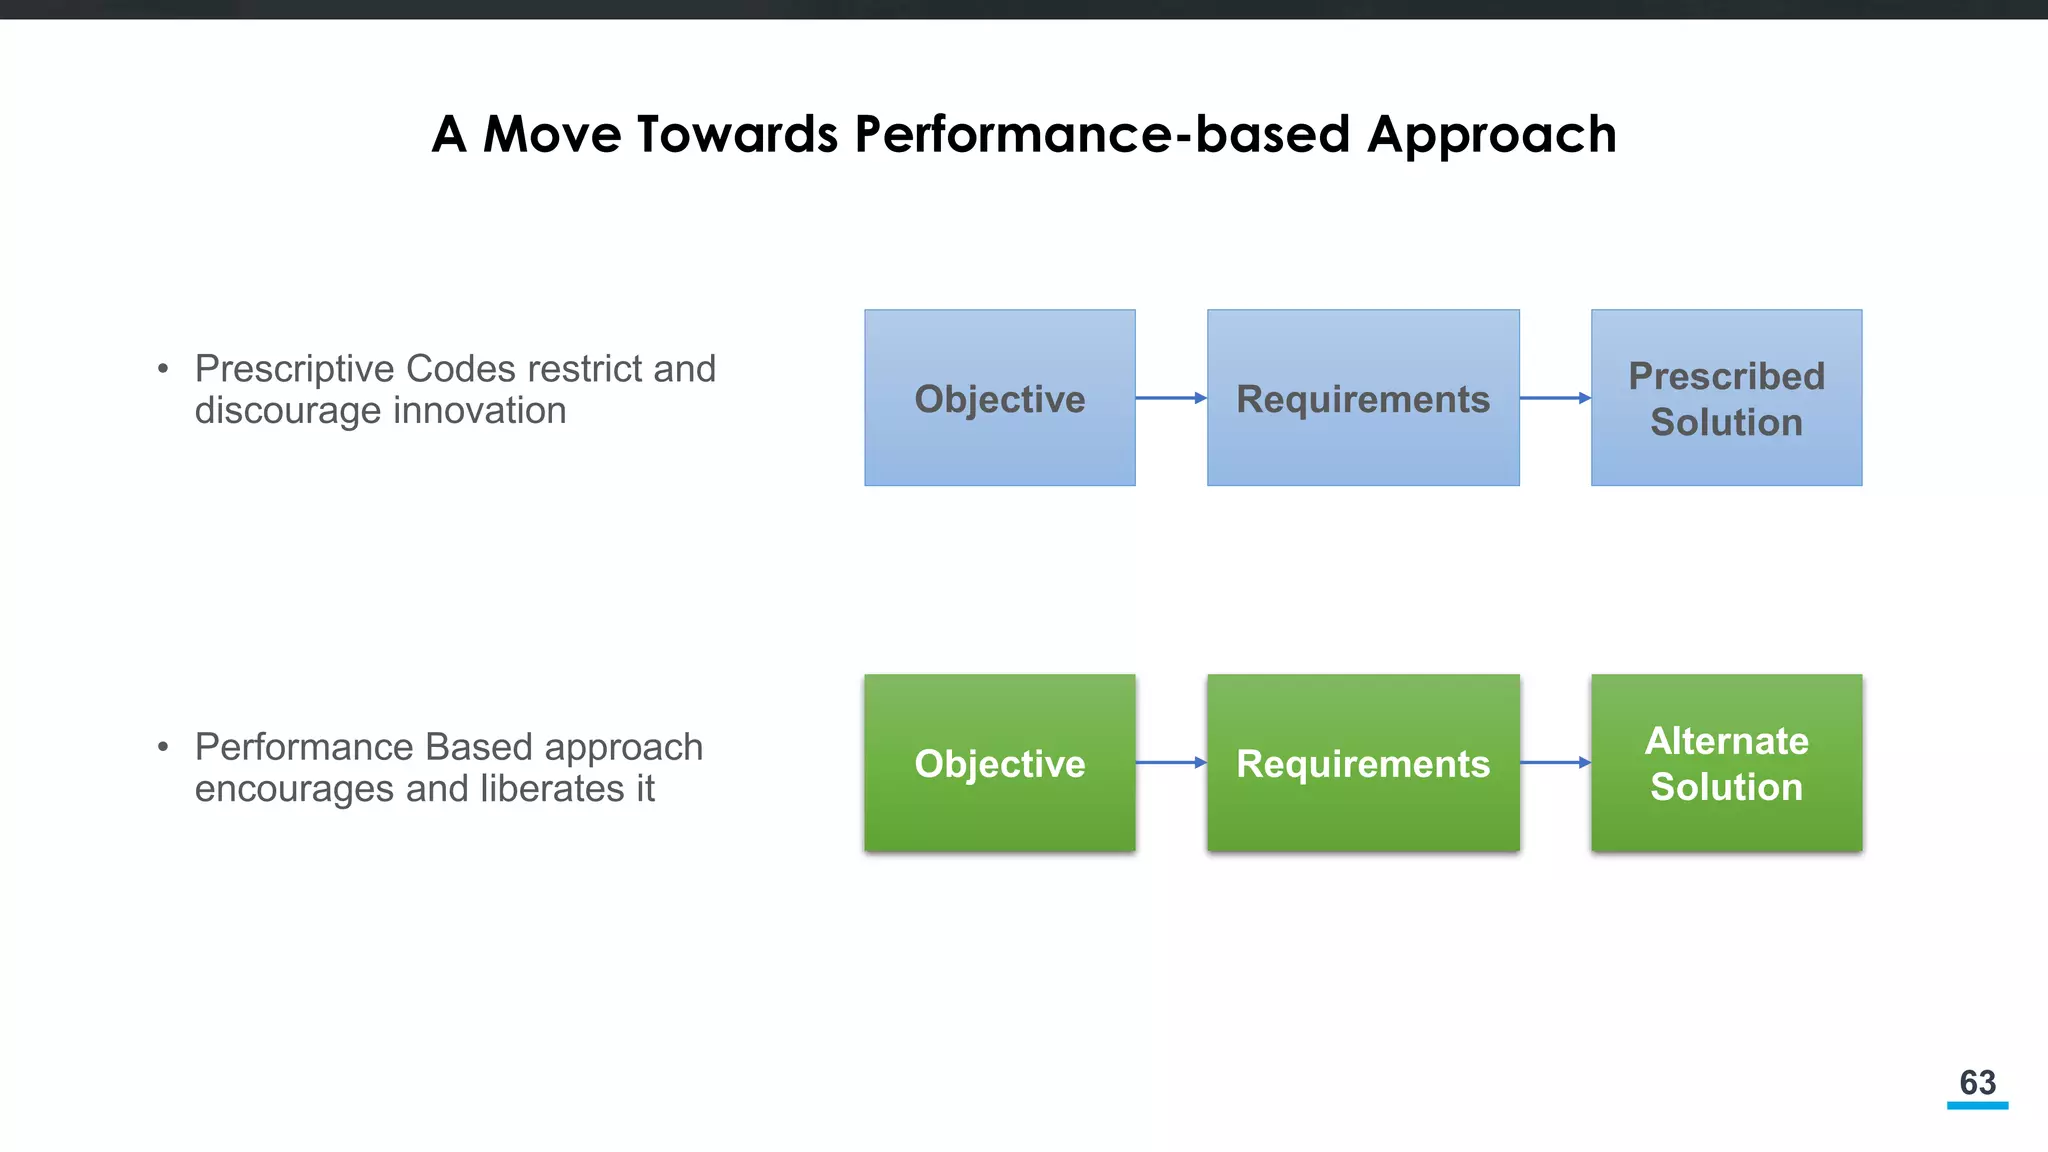
A Move TowardsPerformance-based Approach
• Prescriptive Codes restrict and
discourage innovation Objective Requirements
Prescribed
Solution
Objective Requirements
Alternate
Solution
• Performance Based approach
encourages and liberates it
64.
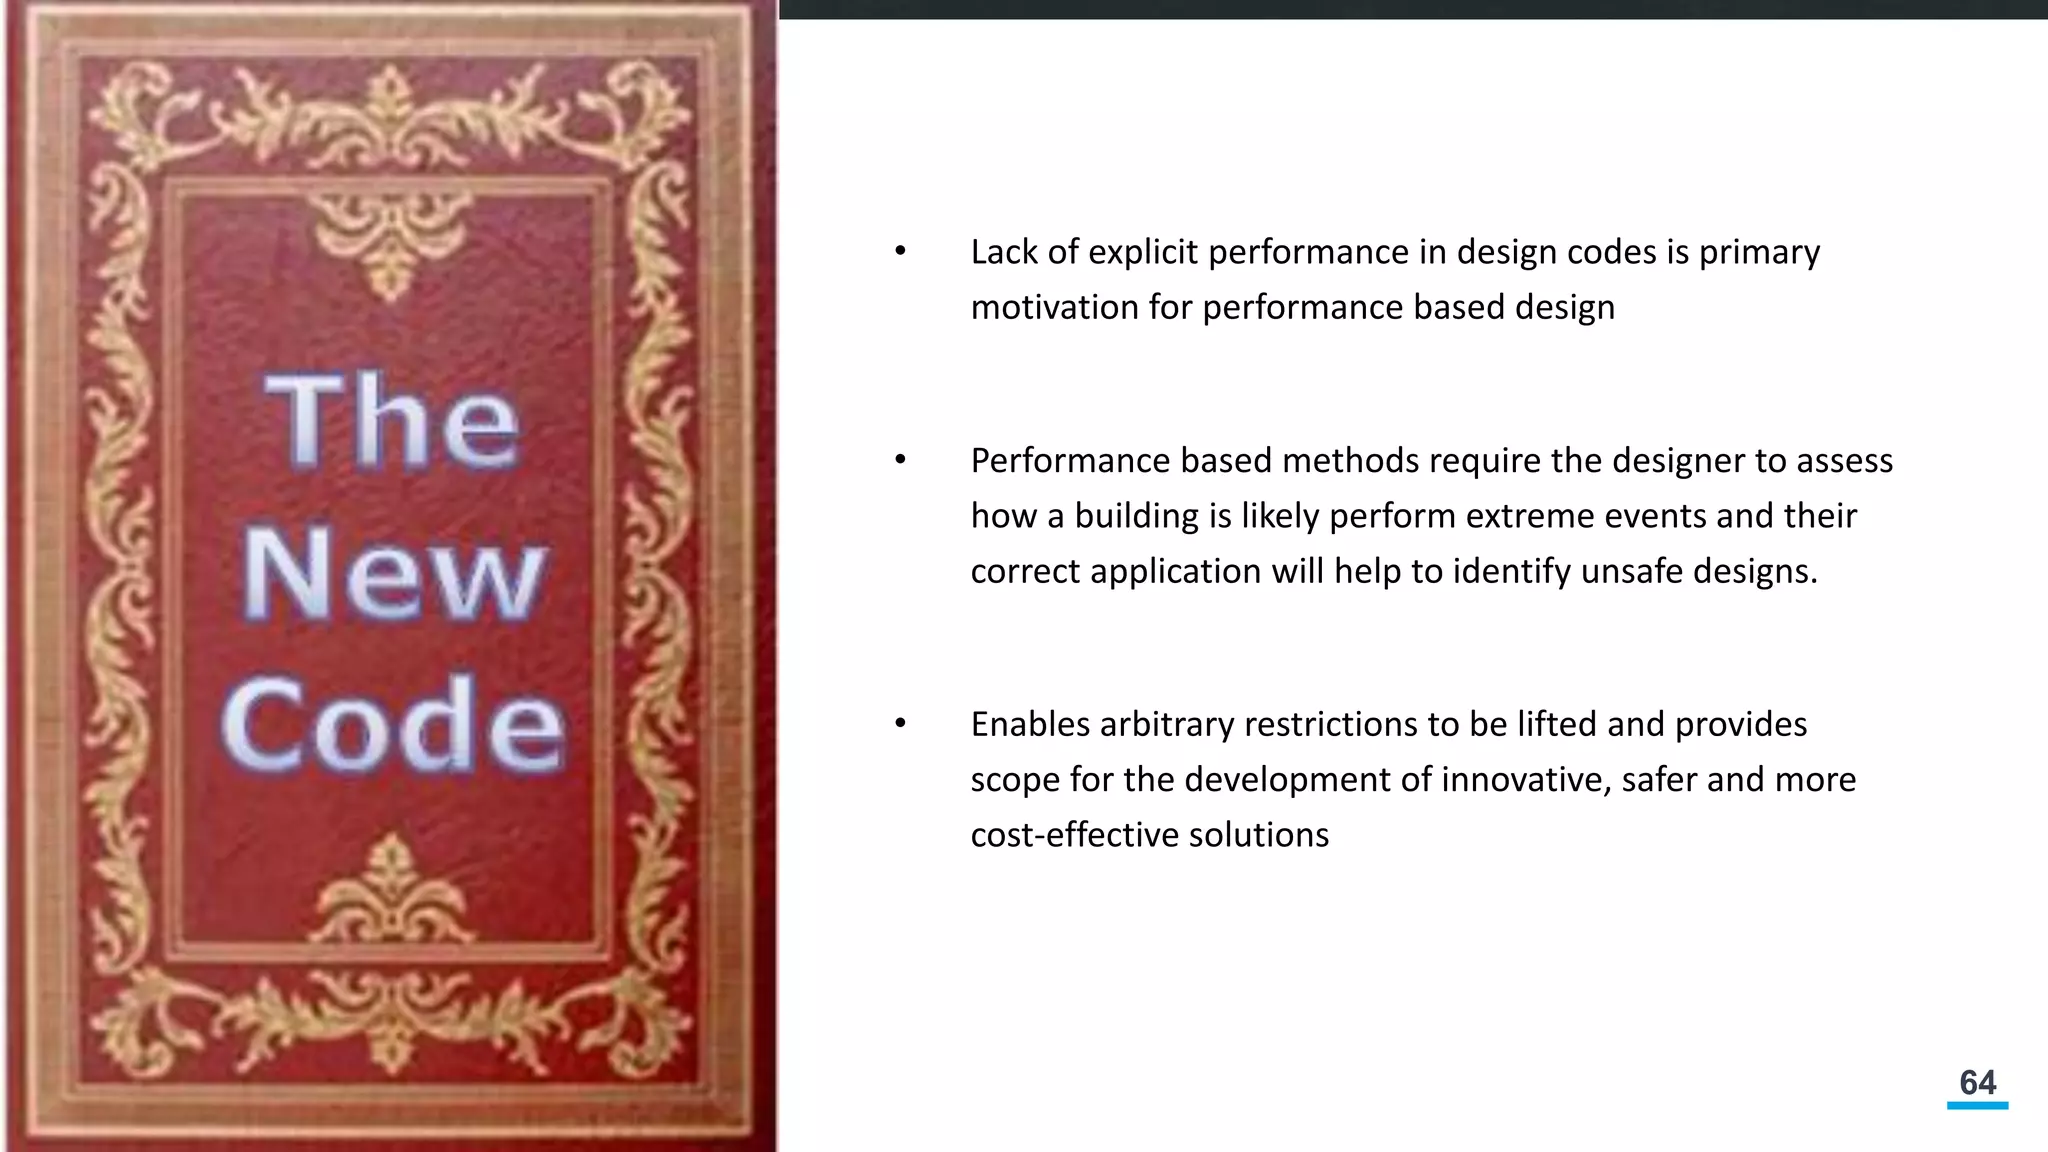
64
• Lack ofexplicit performance in design codes is primary
motivation for performance based design
• Performance based methods require the designer to assess
how a building is likely perform extreme events and their
correct application will help to identify unsafe designs.
• Enables arbitrary restrictions to be lifted and provides
scope for the development of innovative, safer and more
cost-effective solutions
68
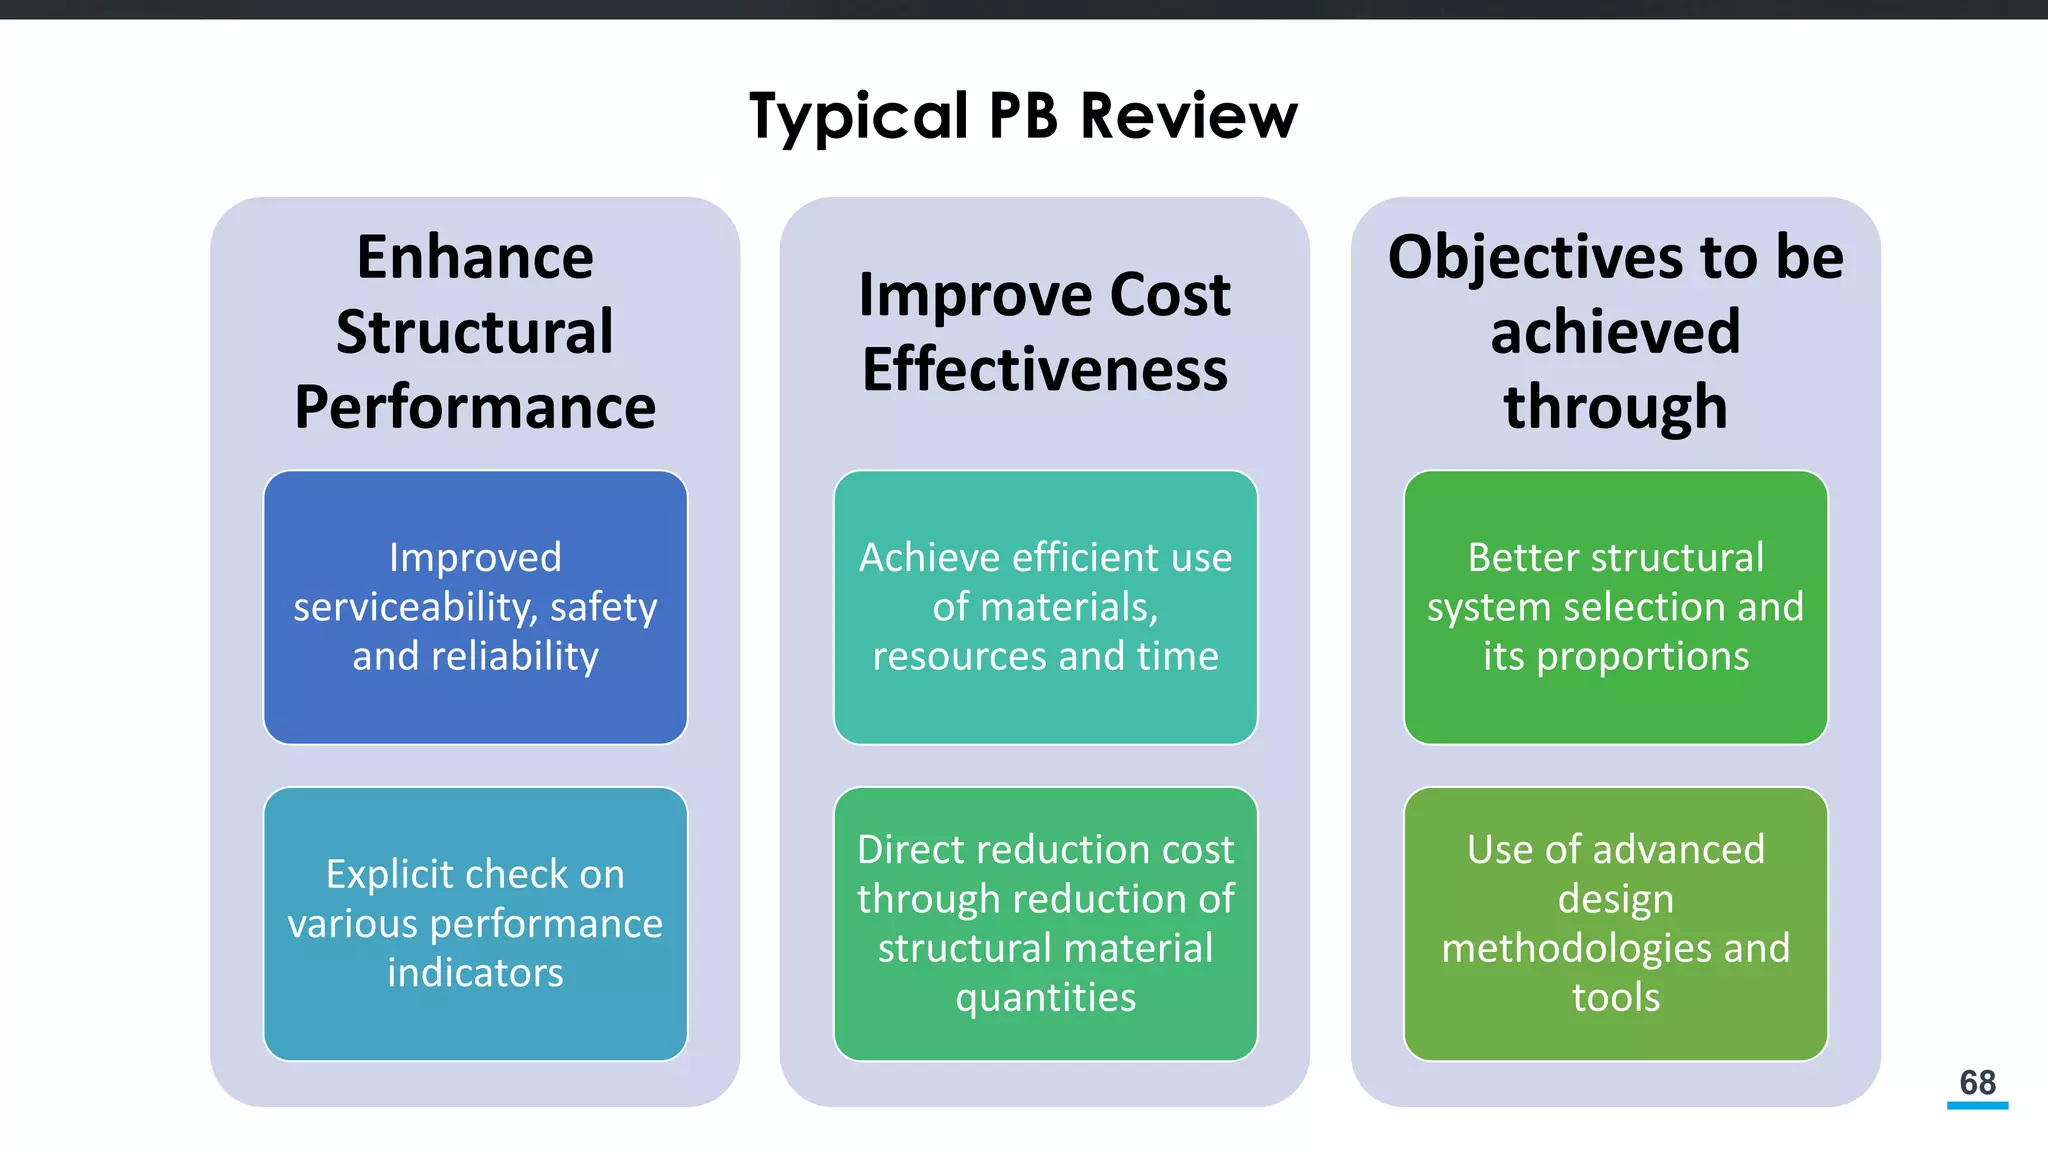
Typical PB Review
Enhance
Structural
Performance
Improved
serviceability,safety
and reliability
Explicit check on
various performance
indicators
Improve Cost
Effectiveness
Achieve efficient use
of materials,
resources and time
Direct reduction cost
through reduction of
structural material
quantities
Objectives to be
achieved
through
Better structural
system selection and
its proportions
Use of advanced
design
methodologies and
tools
69.
69
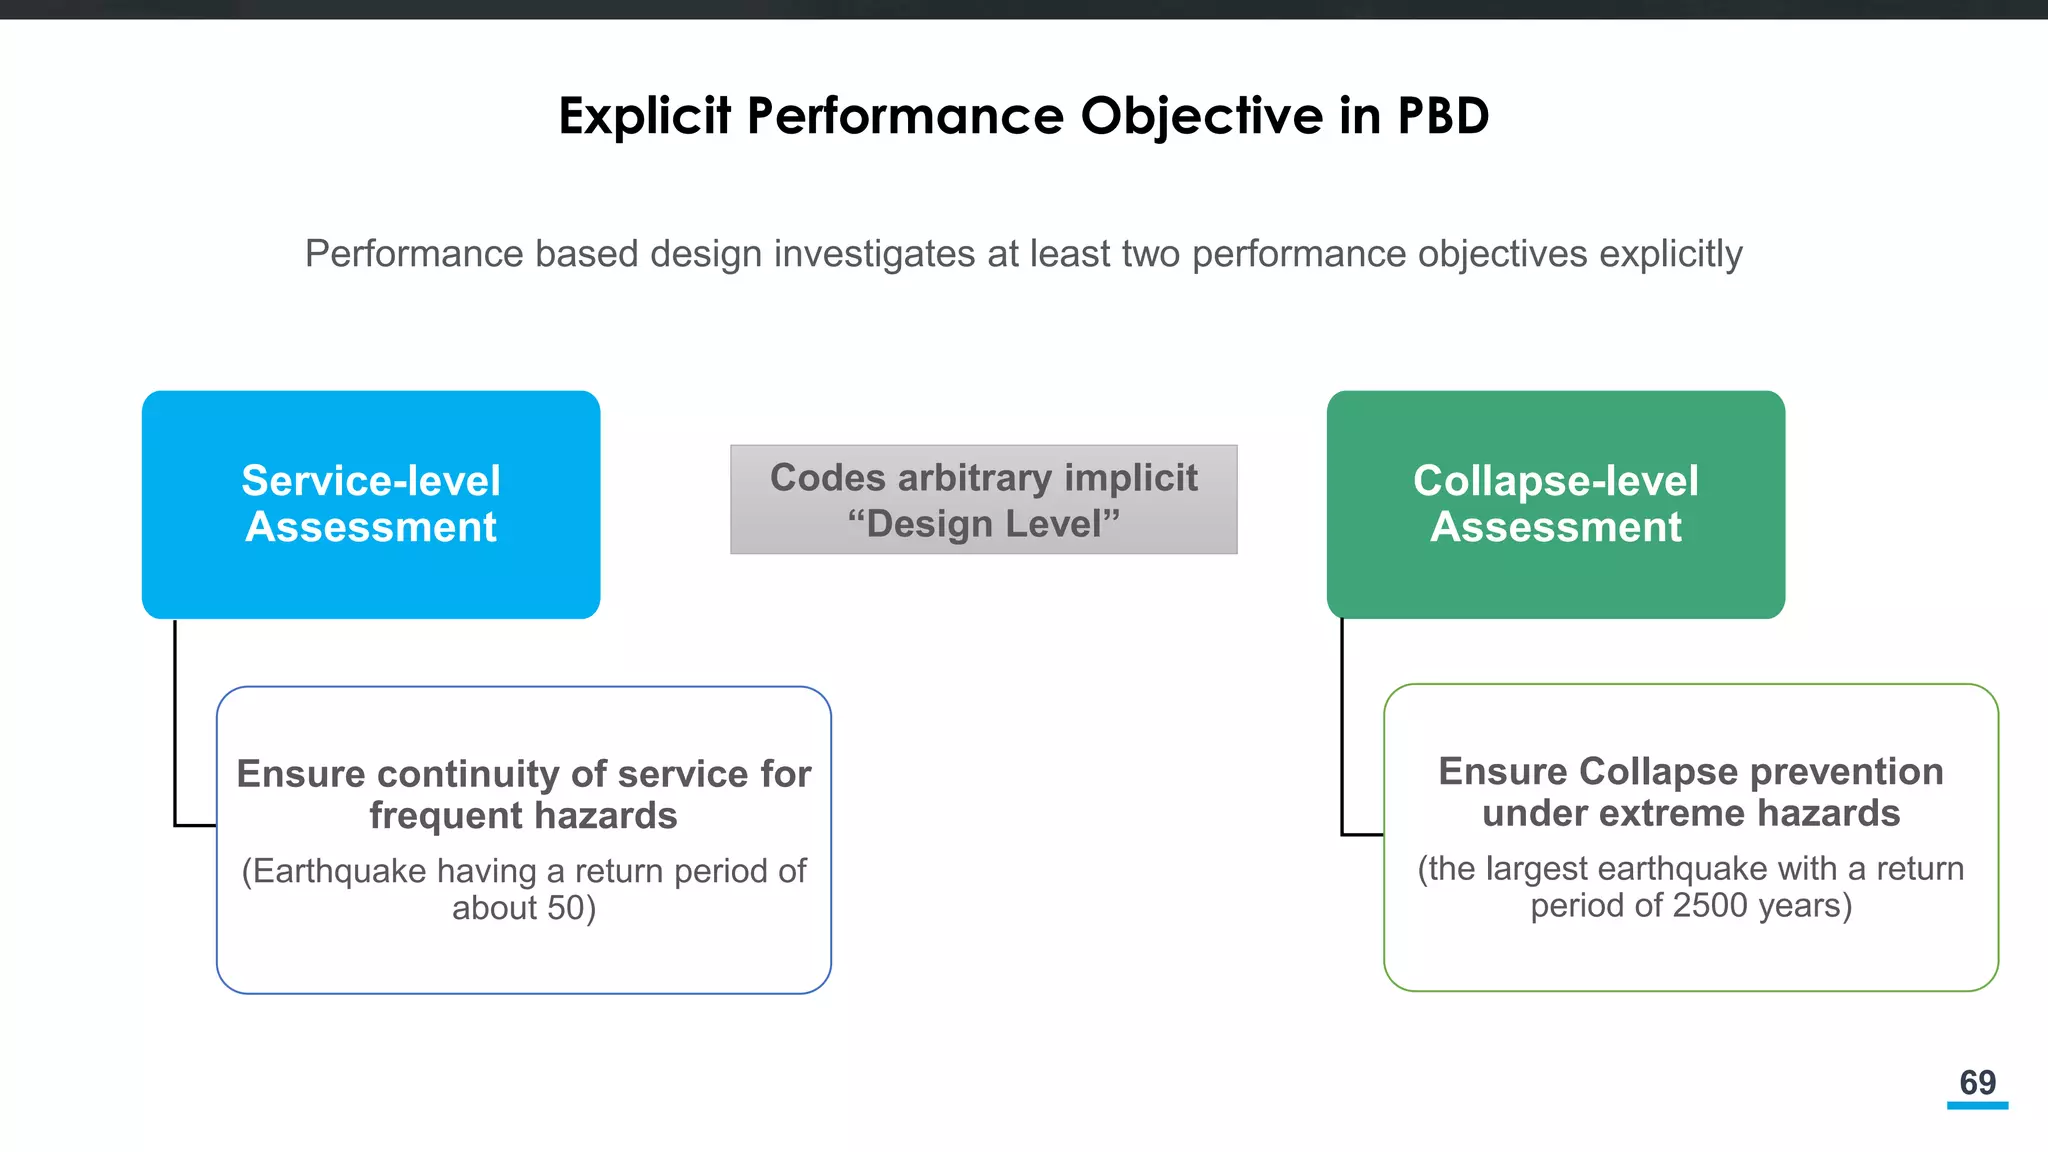
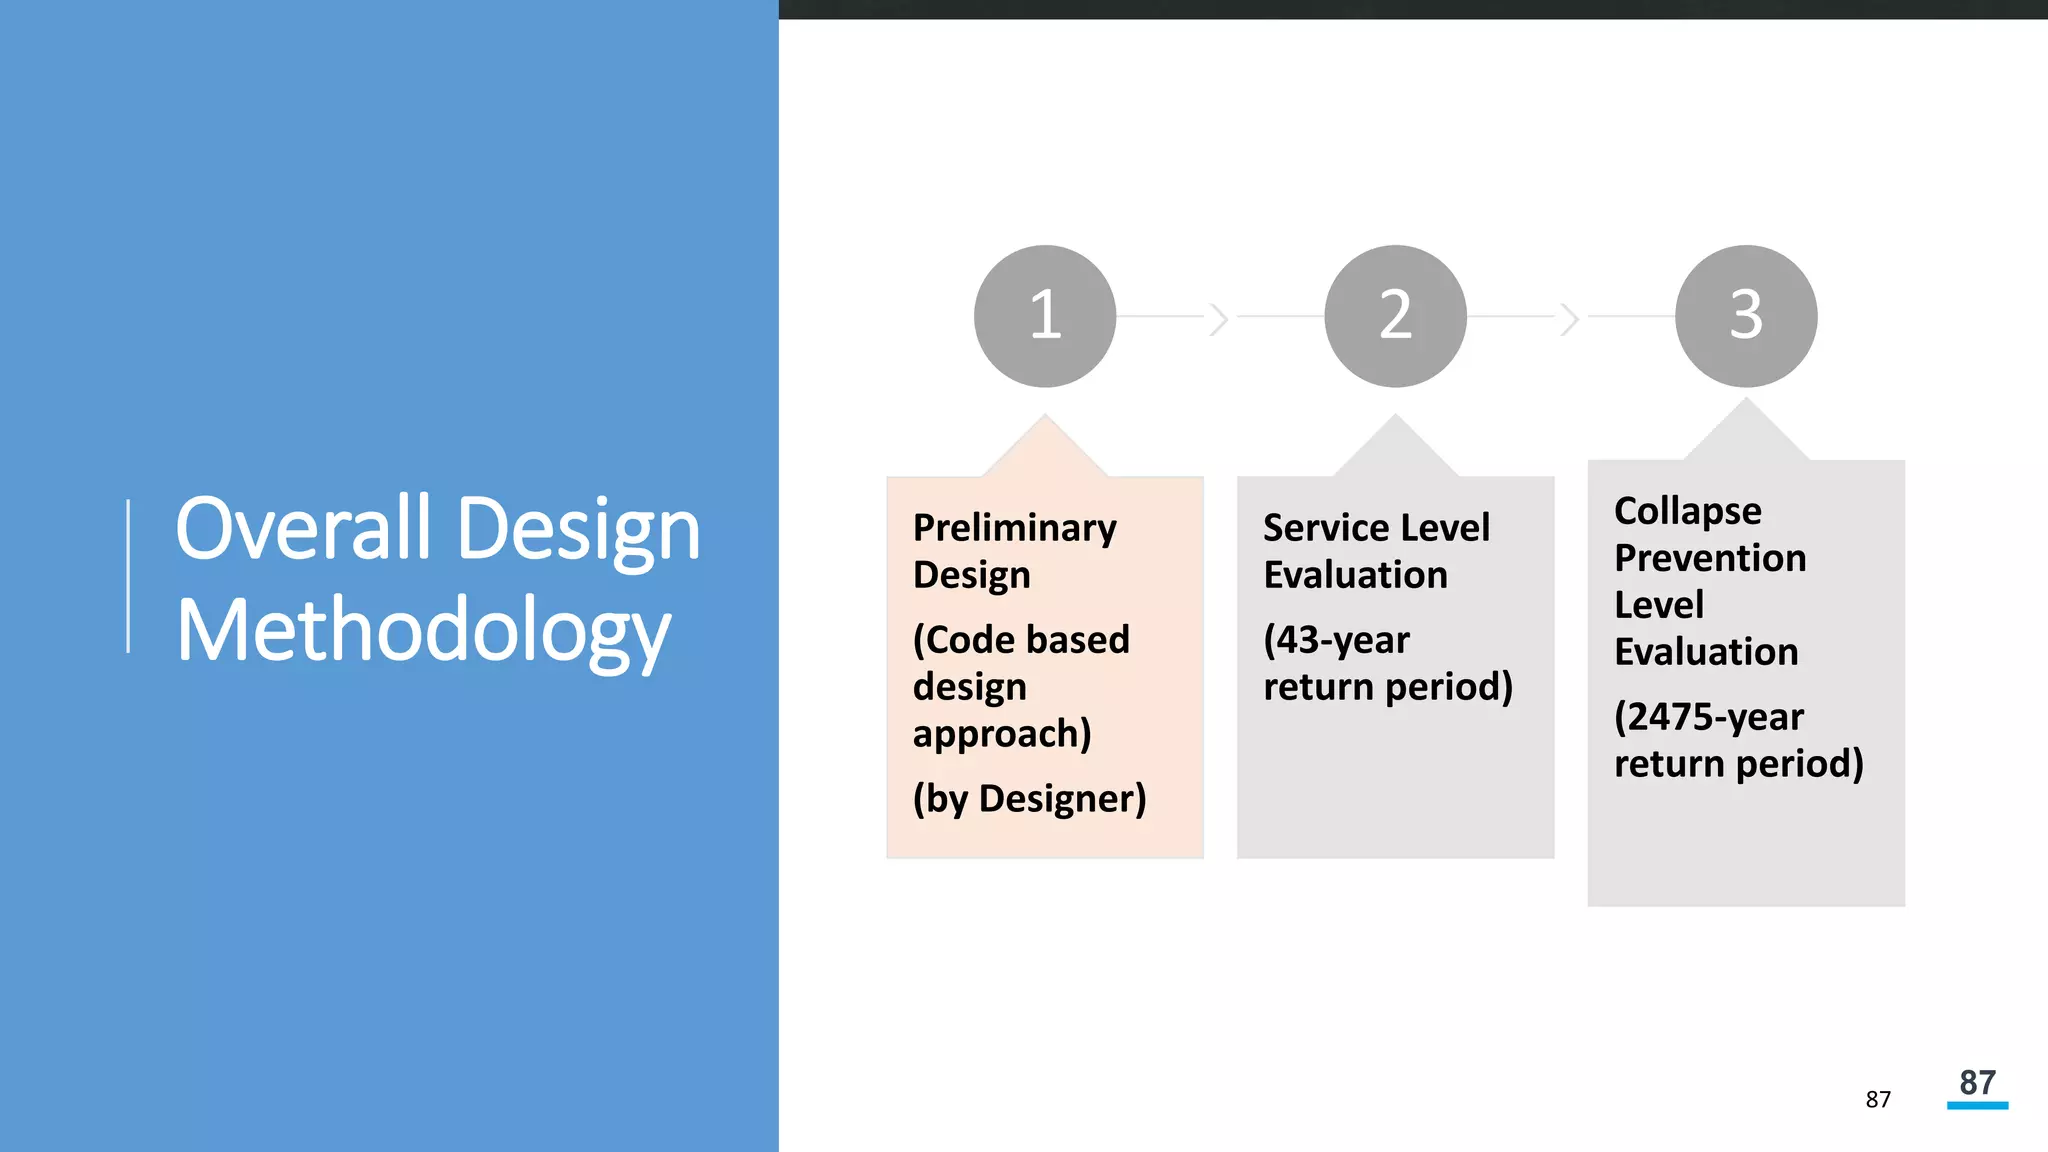
Explicit Performance Objectivein PBD
Performance based design investigates at least two performance objectives explicitly
Service-level
Assessment
Ensure continuity of service for
frequent hazards
(Earthquake having a return period of
about 50)
Collapse-level
Assessment
Ensure Collapse prevention
under extreme hazards
(the largest earthquake with a return
period of 2500 years)
Codes arbitrary implicit
“Design Level”
70.
70
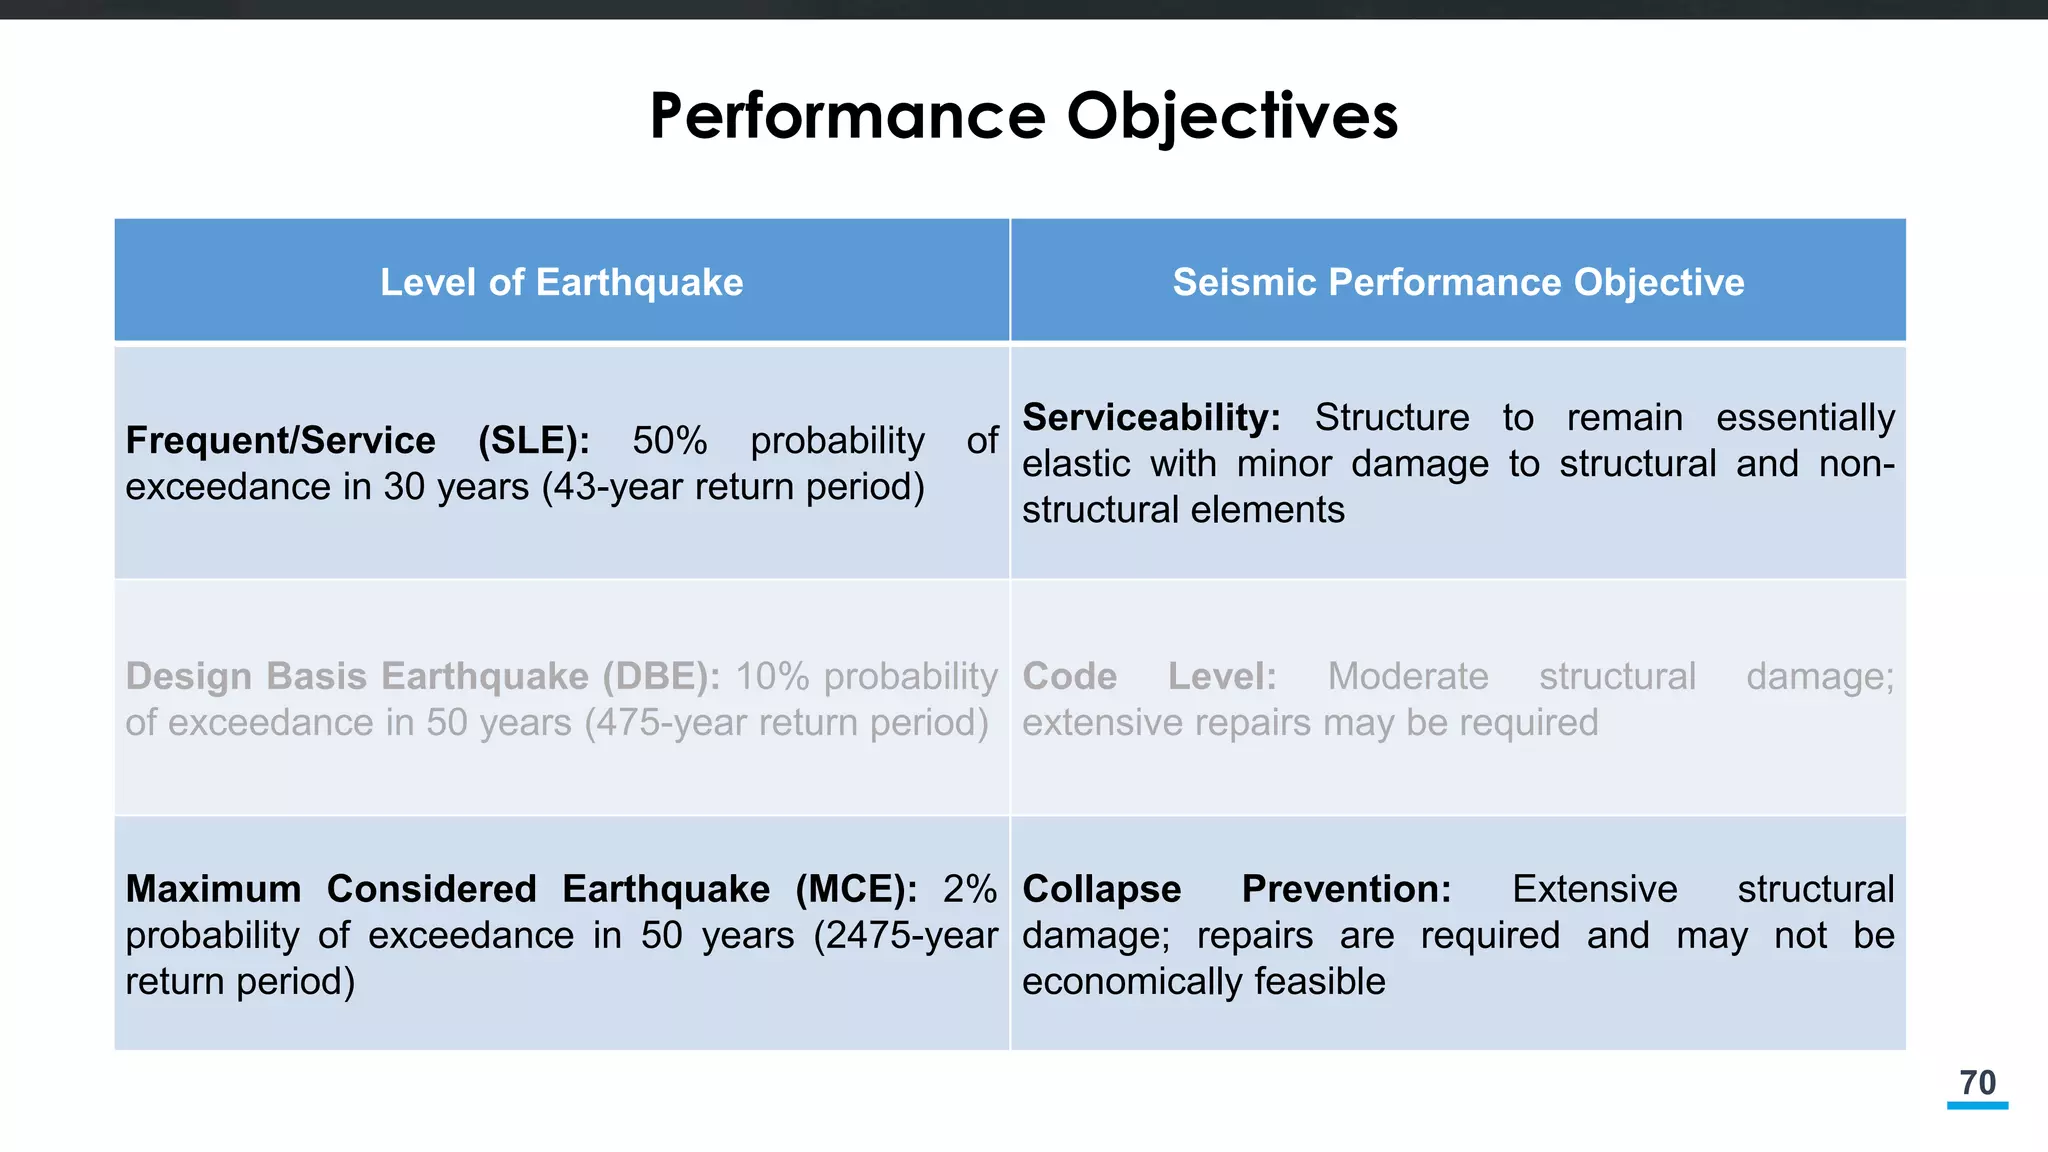
Performance Objectives
Level ofEarthquake Seismic Performance Objective
Frequent/Service (SLE): 50% probability of
exceedance in 30 years (43-year return period)
Serviceability: Structure to remain essentially
elastic with minor damage to structural and non-
structural elements
Design Basis Earthquake (DBE): 10% probability
of exceedance in 50 years (475-year return period)
Code Level: Moderate structural damage;
extensive repairs may be required
Maximum Considered Earthquake (MCE): 2%
probability of exceedance in 50 years (2475-year
return period)
Collapse Prevention: Extensive structural
damage; repairs are required and may not be
economically feasible
72
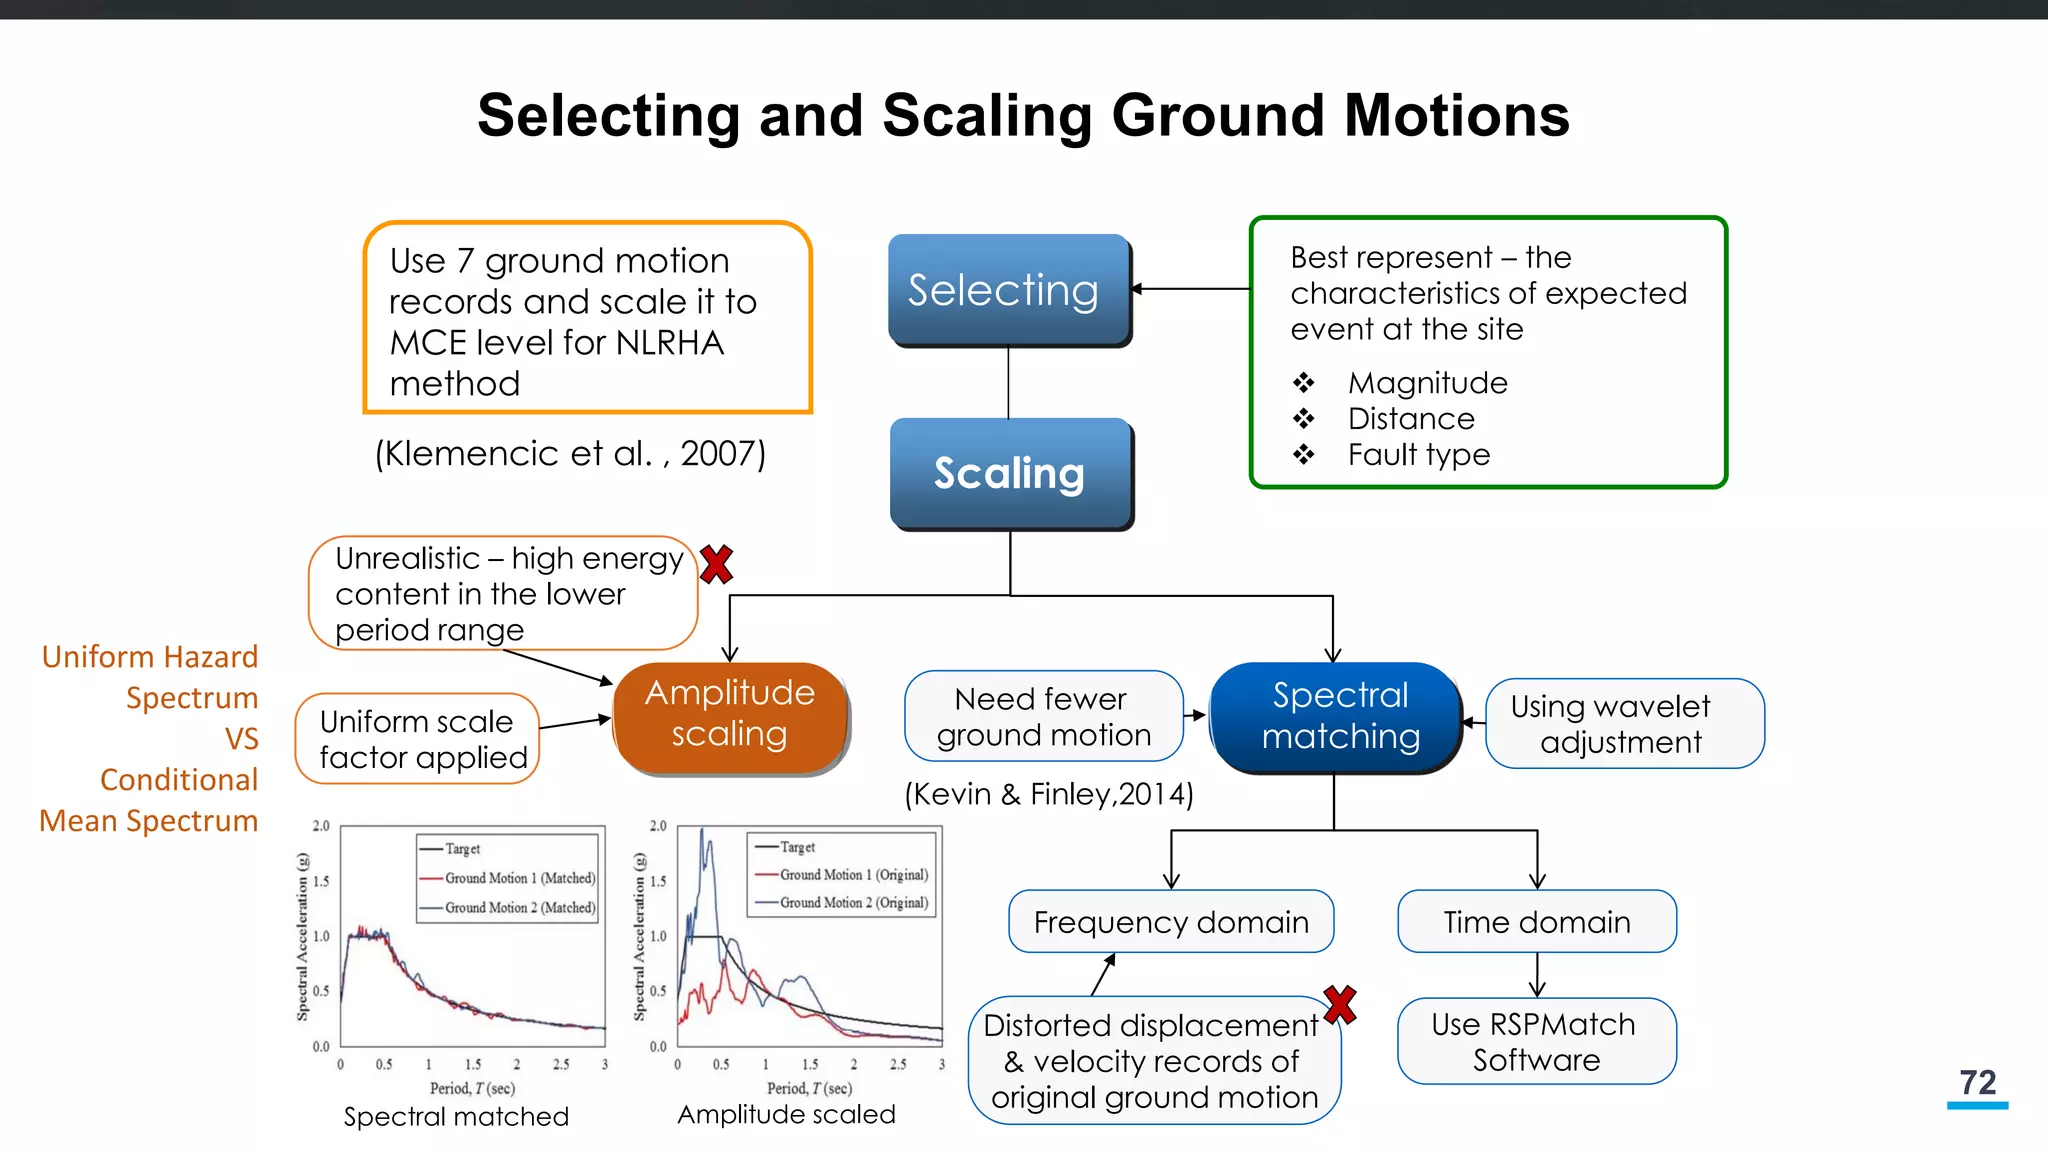
Selecting and ScalingGround Motions
Best represent – the
characteristics of expected
event at the site
Magnitude
Distance
Fault type
Scaling
Spectral
matchingUniform scale
factor applied
Using wavelet
adjustment
Amplitude
scaling
Need fewer
ground motion
Frequency domain Time domain
Use RSPMatch
Software
Unrealistic – high energy
content in the lower
period range
Distorted displacement
& velocity records of
original ground motion
Selecting
(Kevin & Finley,2014)
Spectral matched Amplitude scaled
Use 7 ground motion
records and scale it to
MCE level for NLRHA
method
(Klemencic et al. , 2007)
Uniform Hazard
Spectrum
VS
Conditional
Mean Spectrum
73.
73
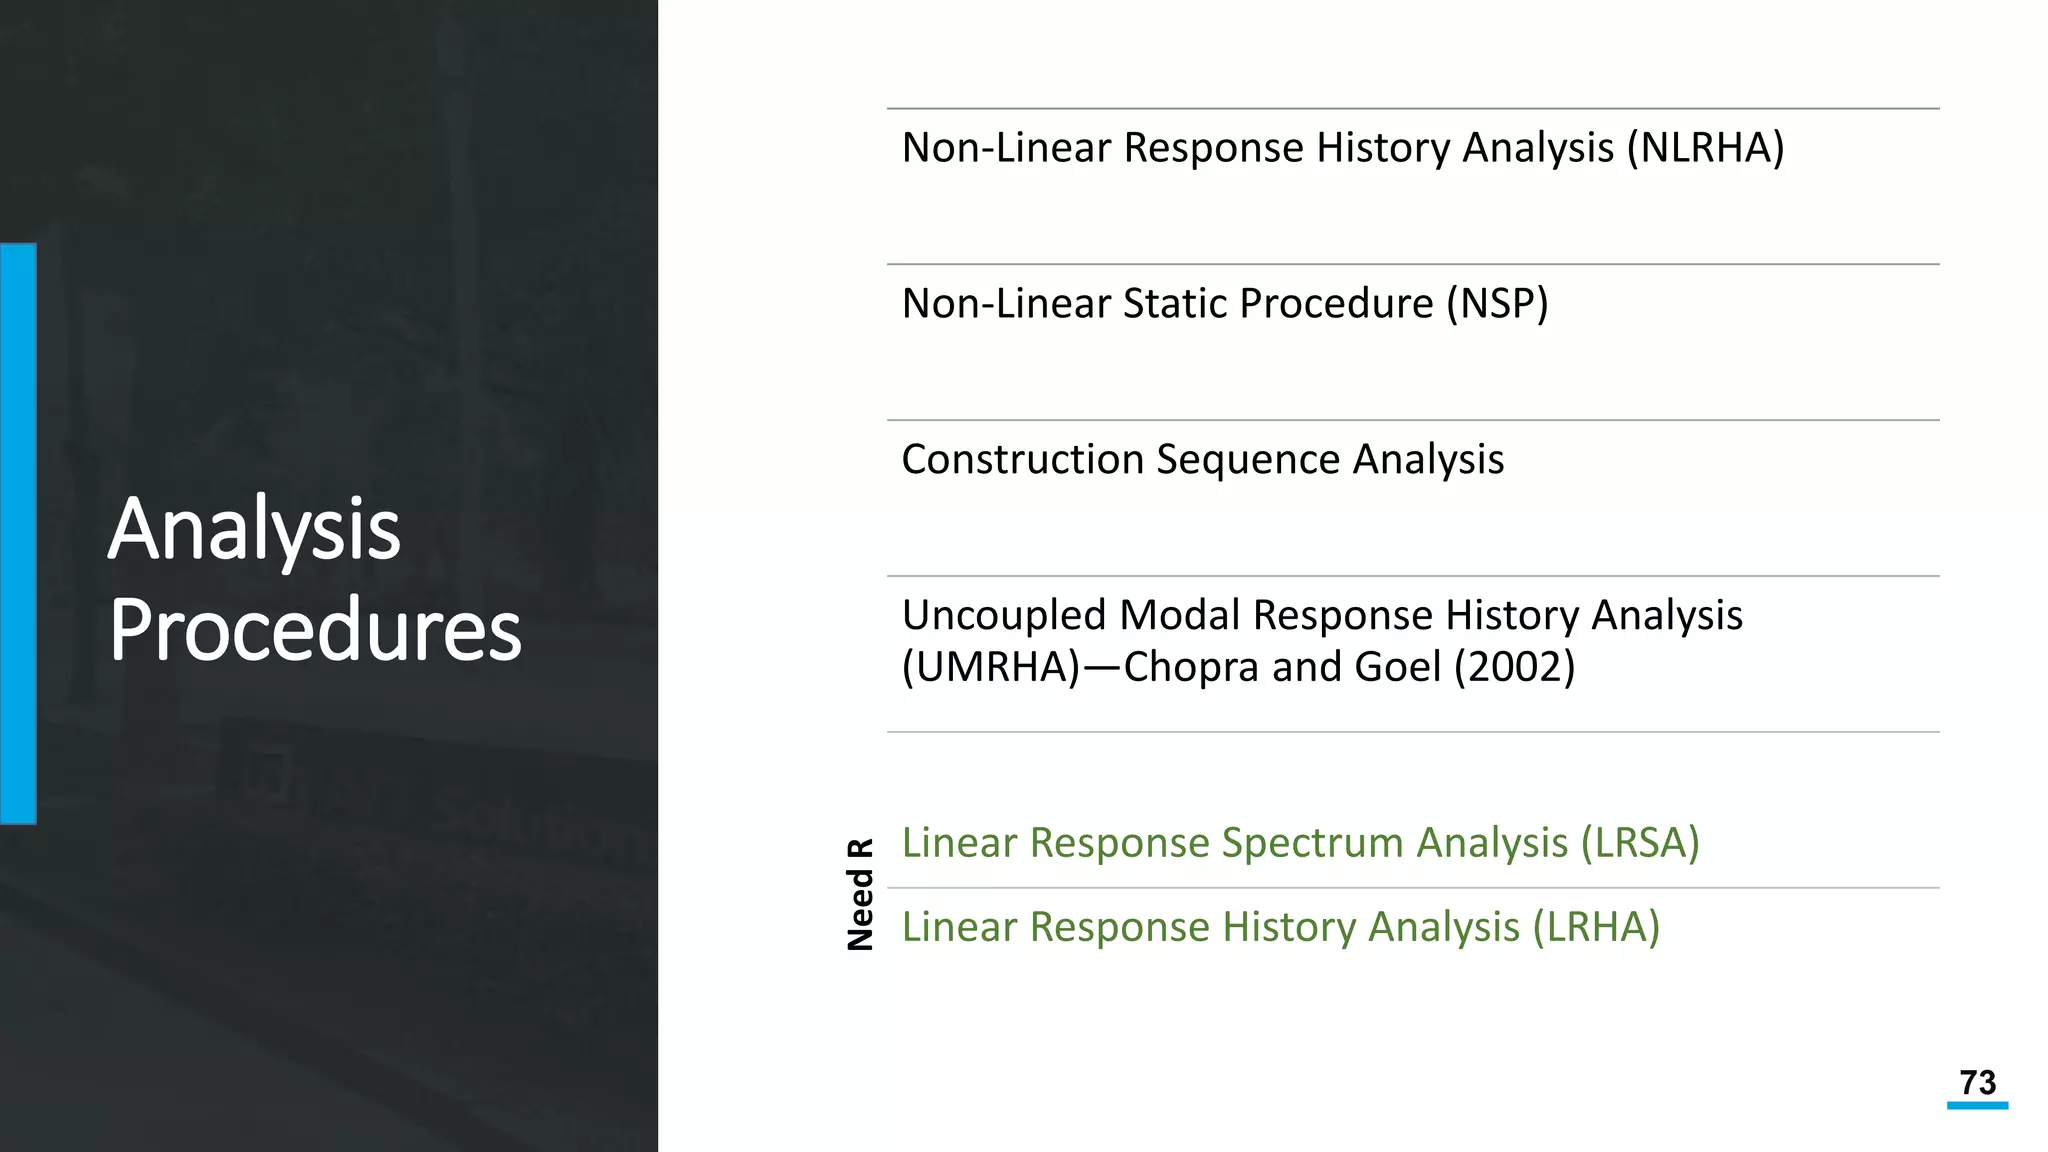
Analysis
Procedures
Non-Linear Response HistoryAnalysis (NLRHA)
Non-Linear Static Procedure (NSP)
Construction Sequence Analysis
Uncoupled Modal Response History Analysis
(UMRHA)—Chopra and Goel (2002)
Linear Response Spectrum Analysis (LRSA)
Linear Response History Analysis (LRHA)
NeedR
74.
74
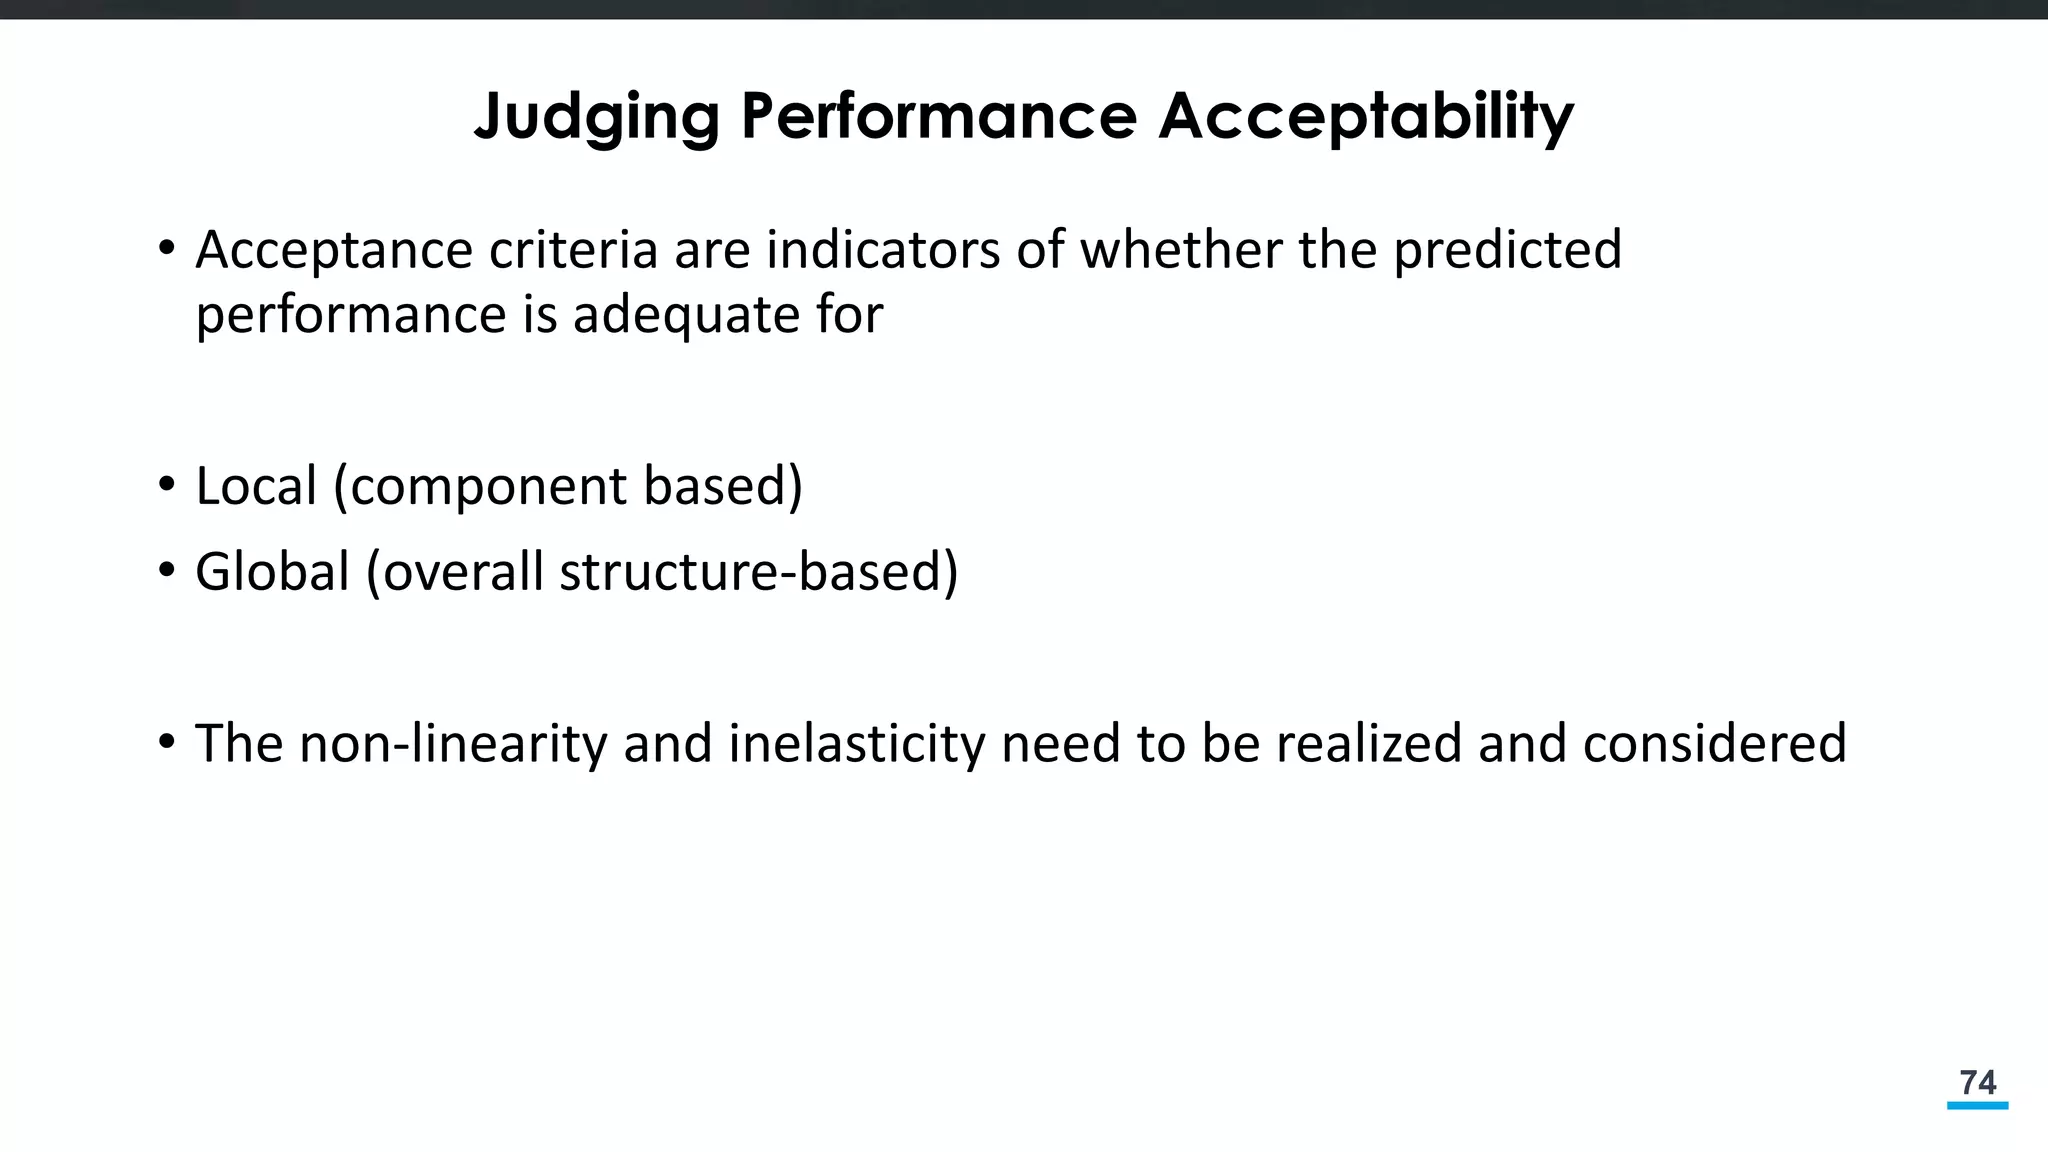
Judging Performance Acceptability
•Acceptance criteria are indicators of whether the predicted
performance is adequate for
• Local (component based)
• Global (overall structure-based)
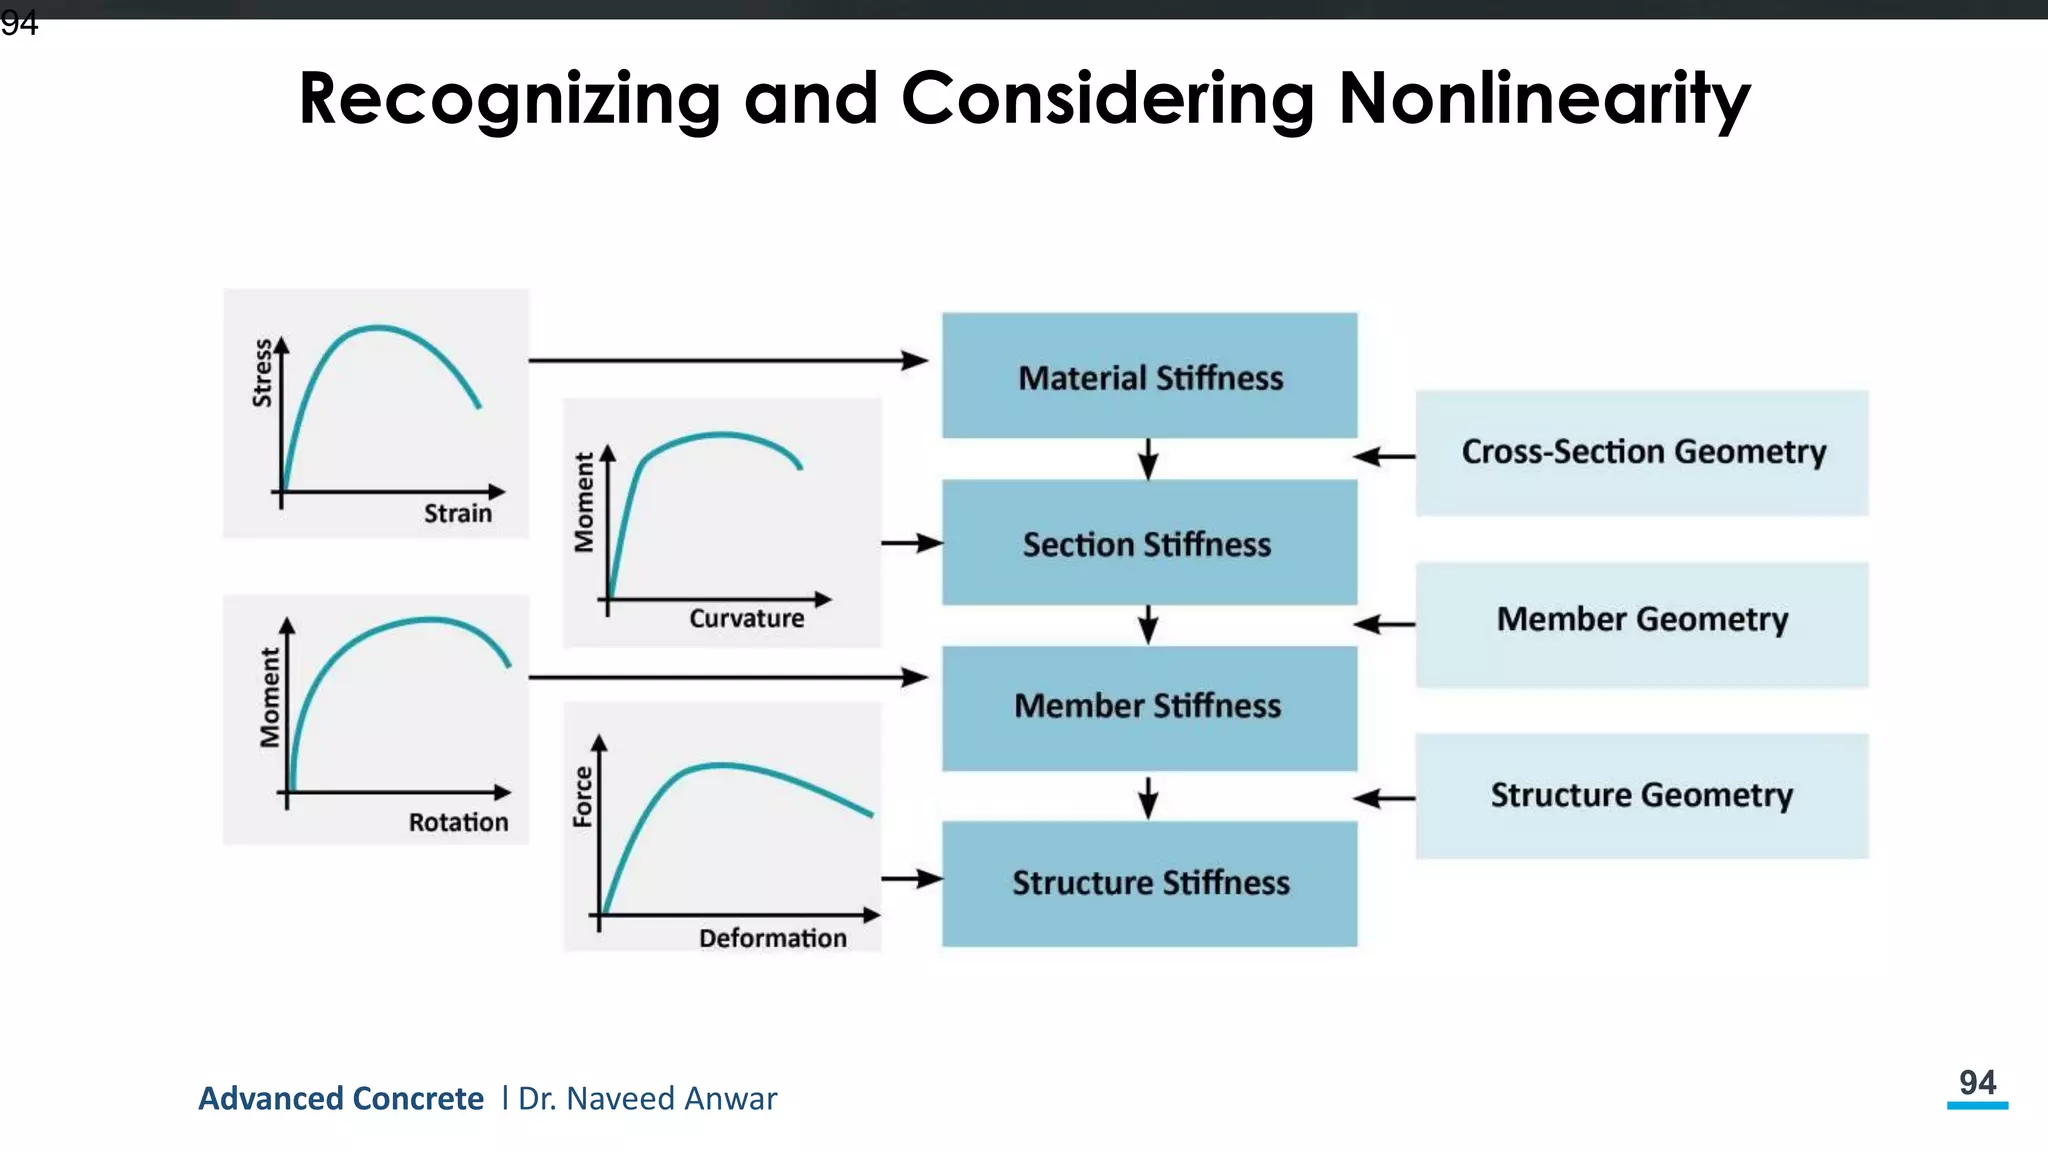
• The non-linearity and inelasticity need to be realized and considered
78
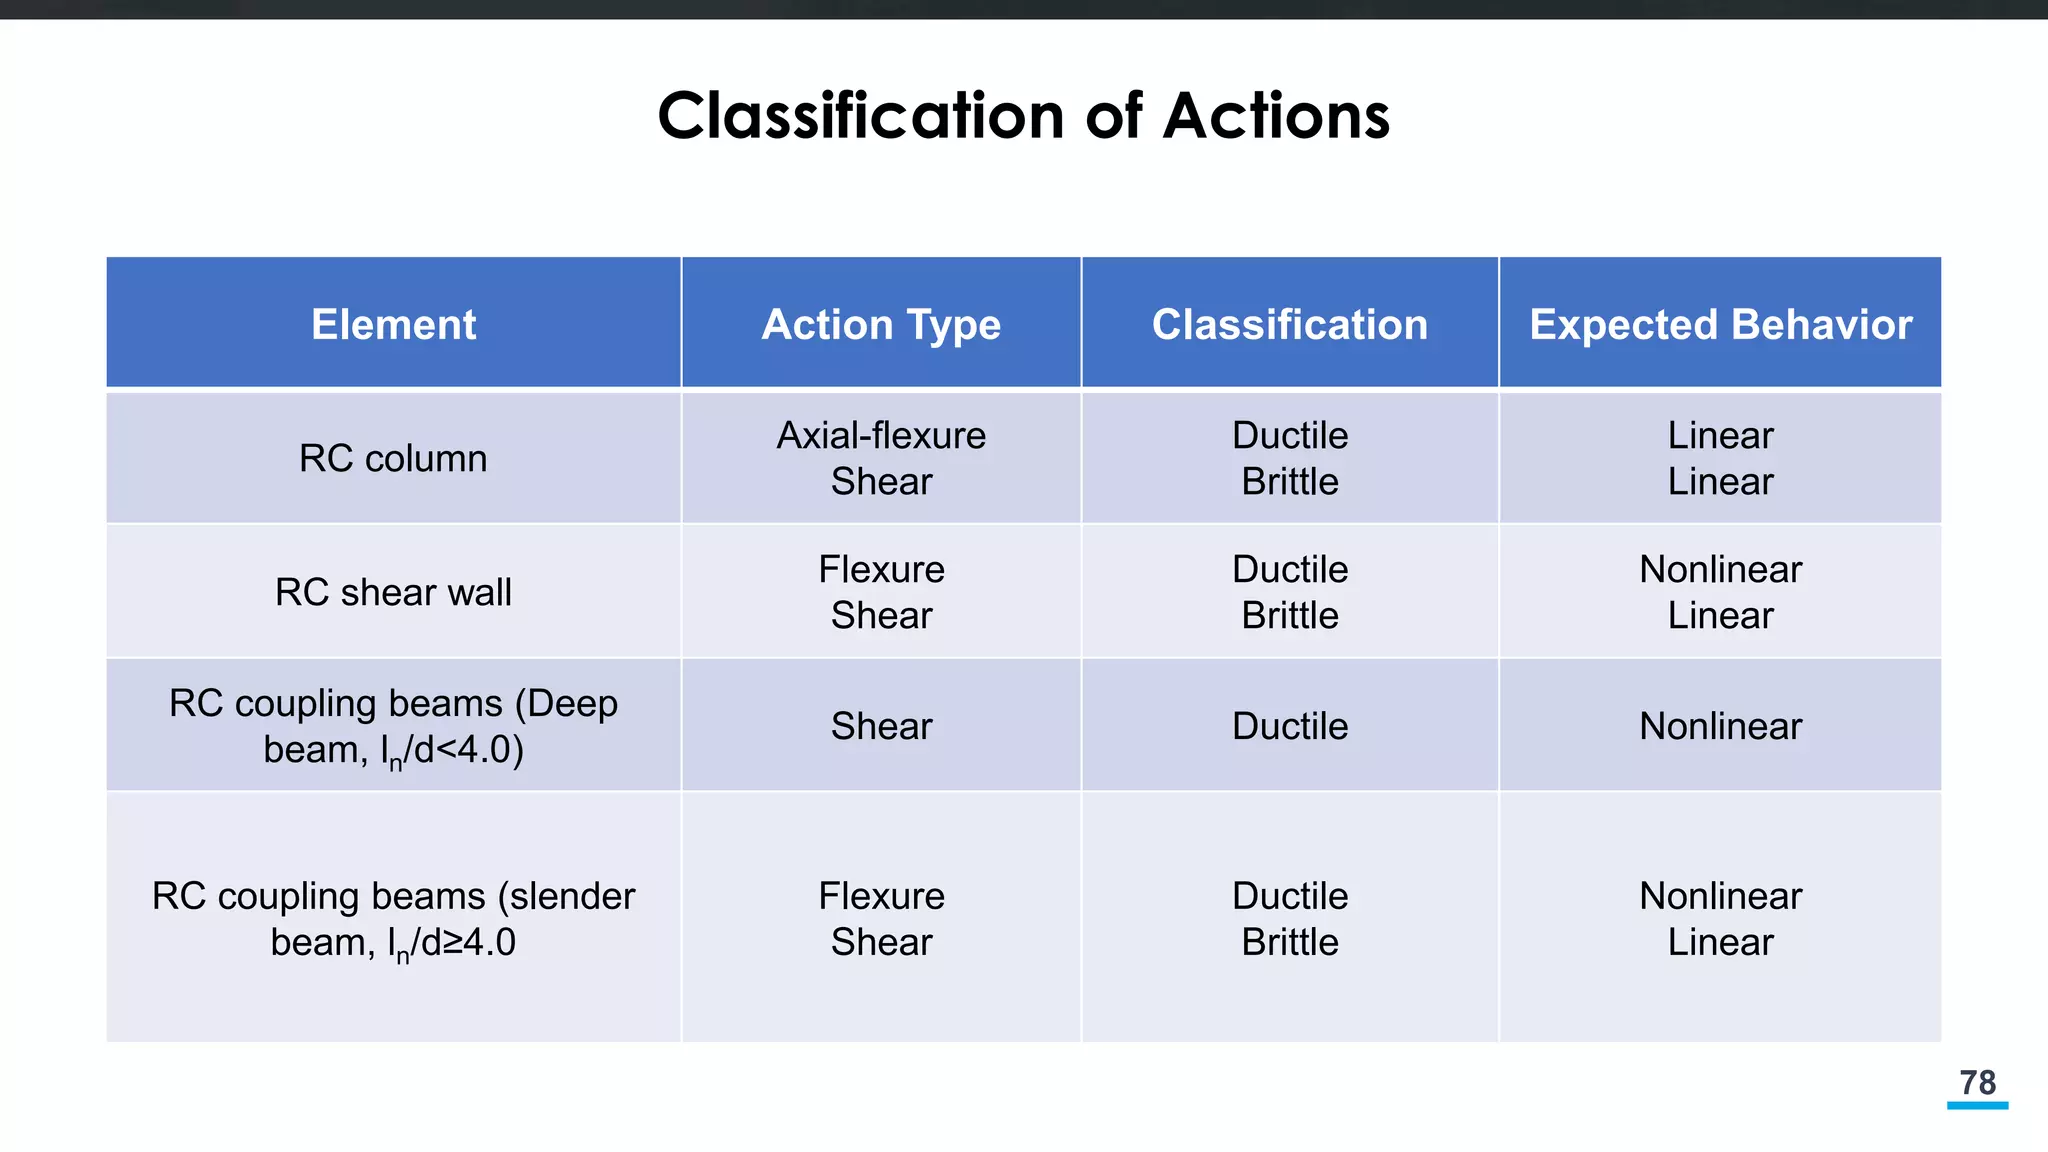
Classification of Actions
ElementAction Type Classification Expected Behavior
RC column
Axial-flexure
Shear
Ductile
Brittle
Linear
Linear
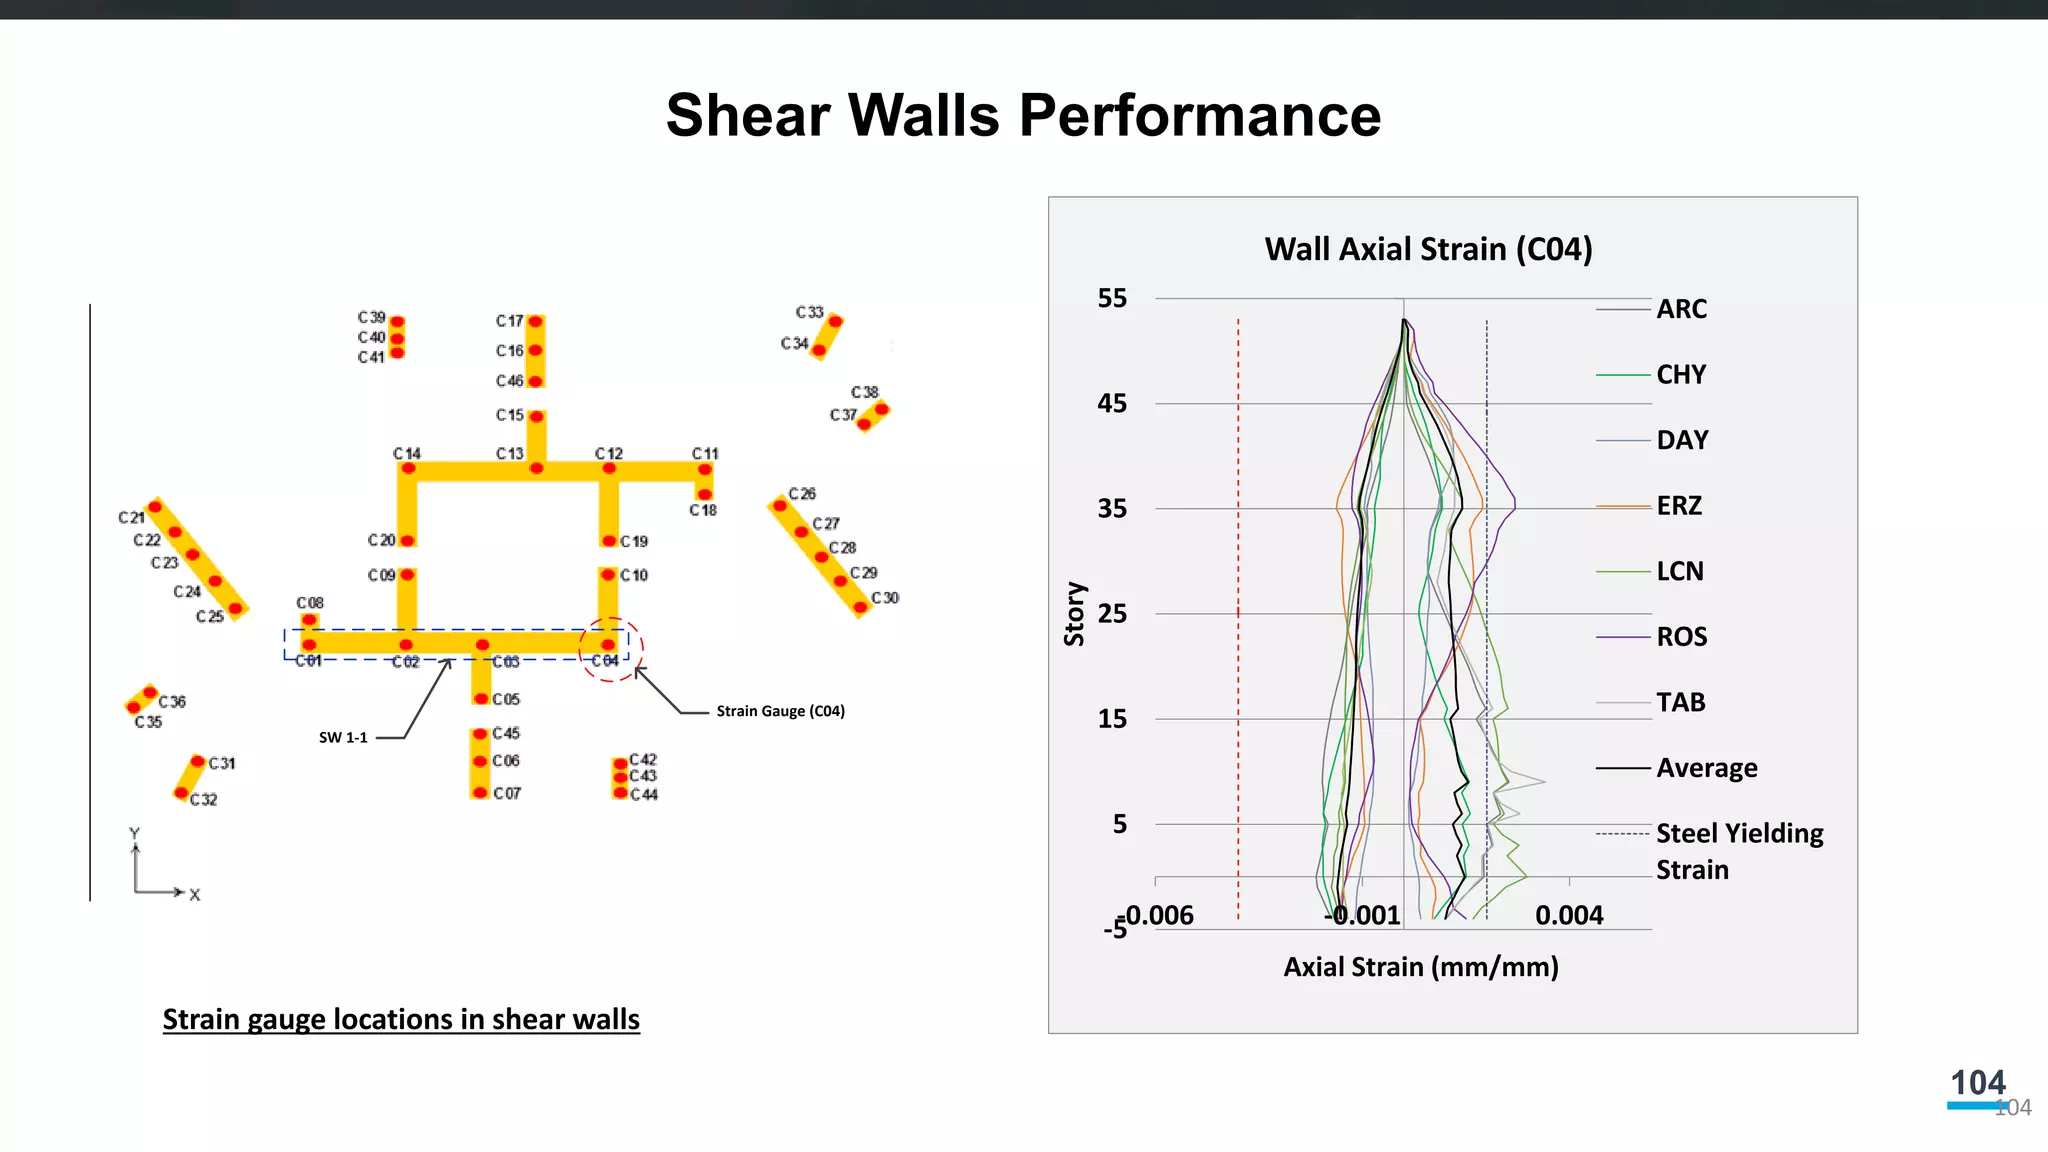
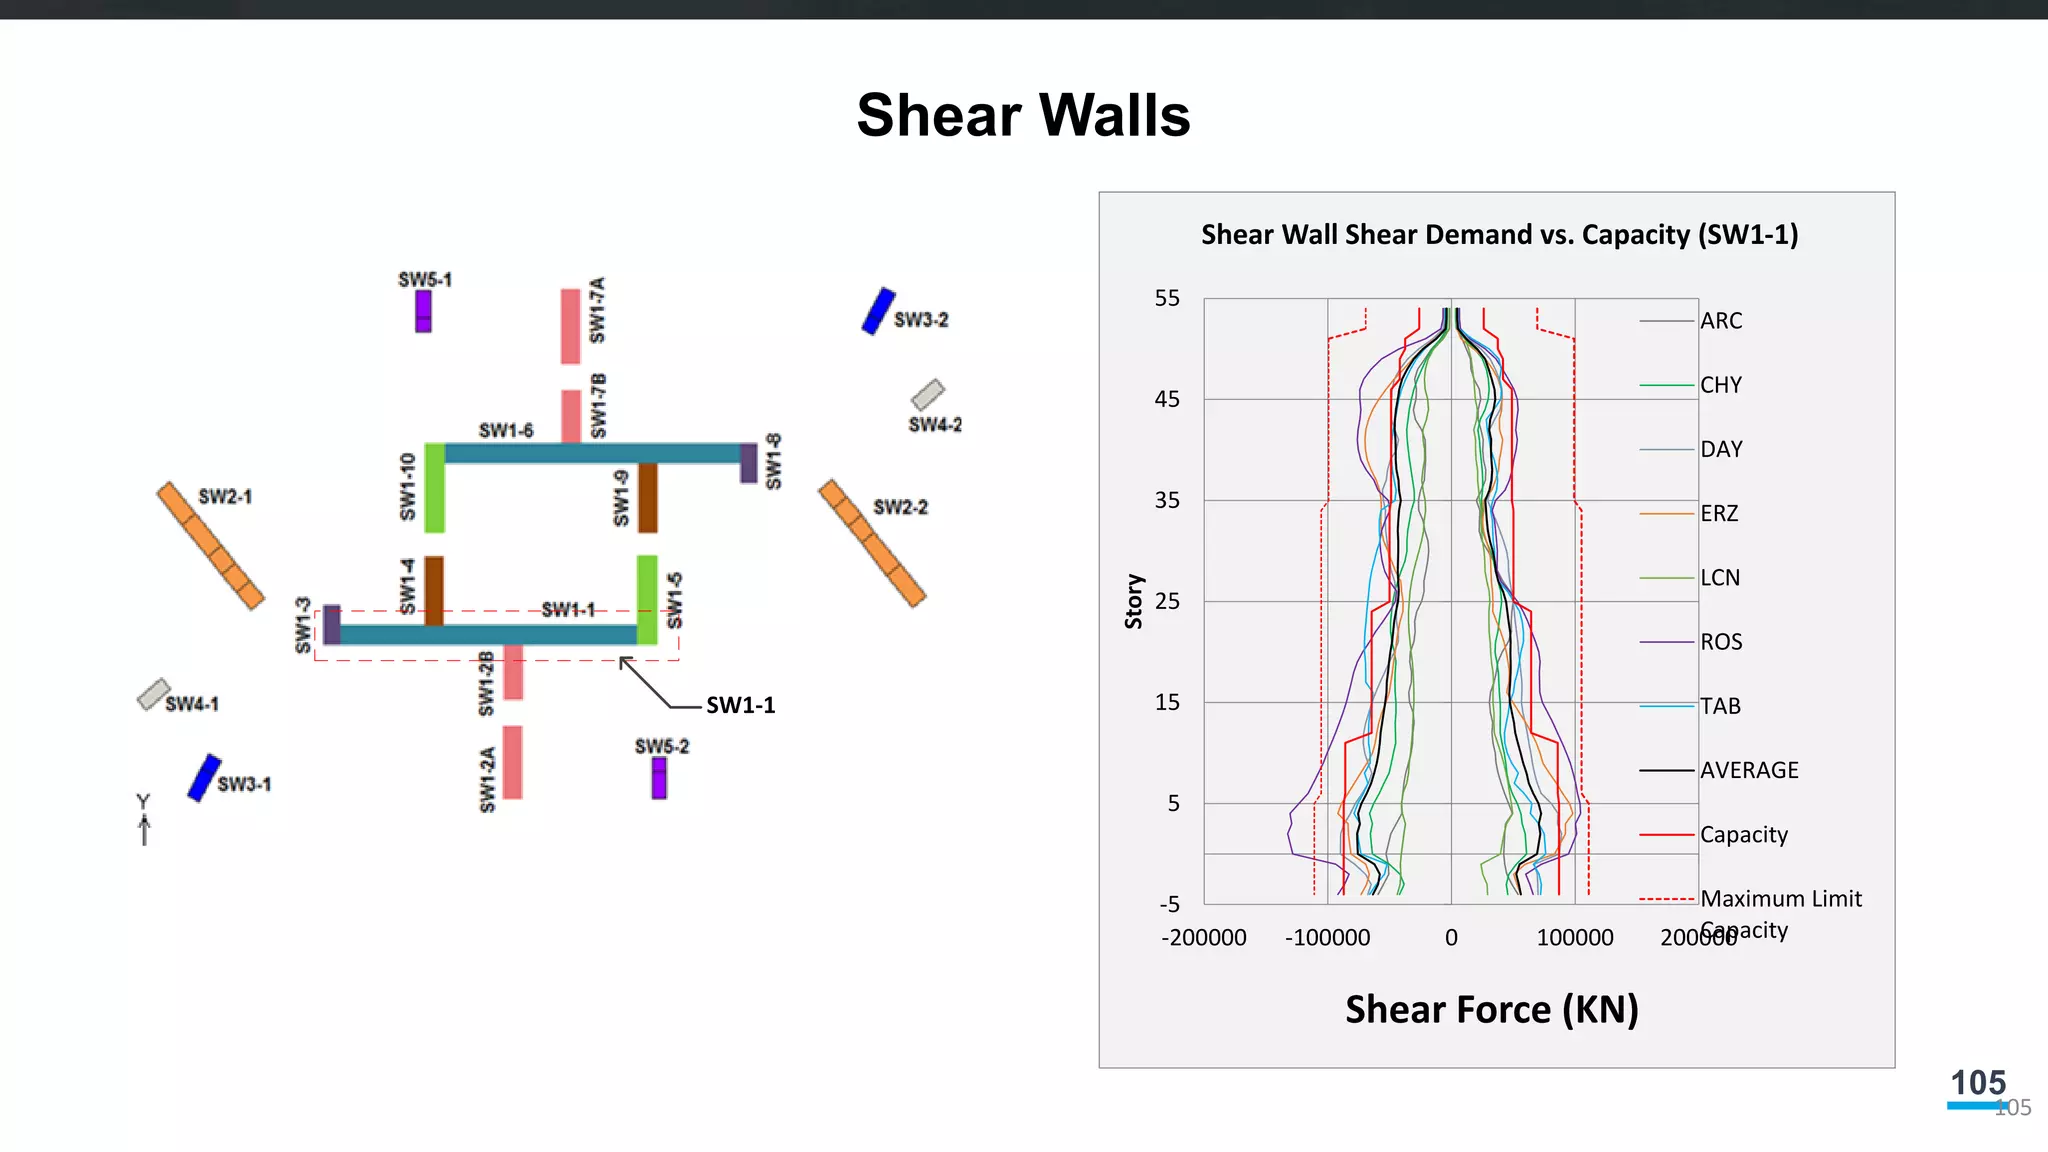
RC shear wall
Flexure
Shear
Ductile
Brittle
Nonlinear
Linear
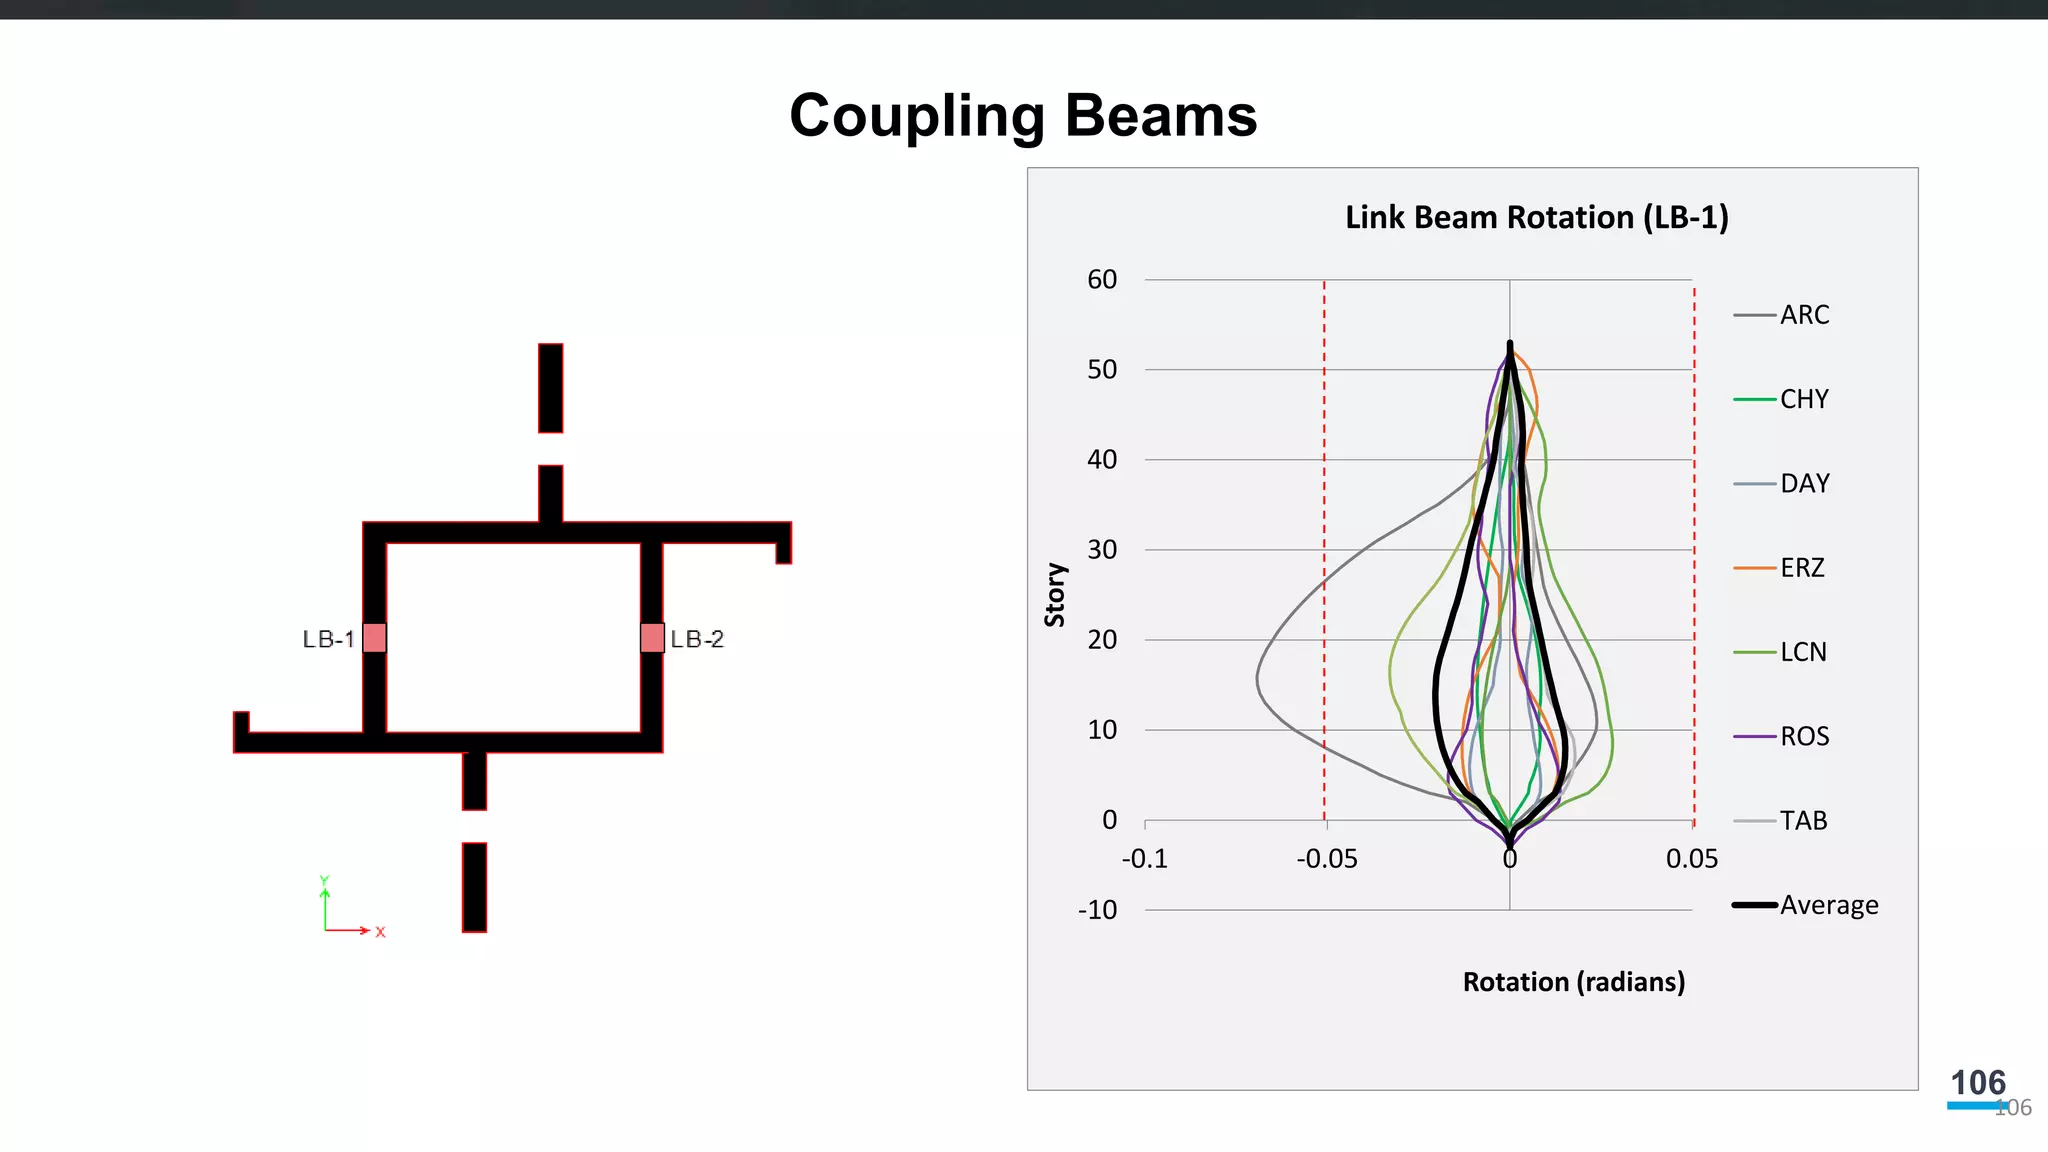
RC coupling beams (Deep
beam, ln/d<4.0)
Shear Ductile Nonlinear
RC coupling beams (slender
beam, ln/d≥4.0
Flexure
Shear
Ductile
Brittle
Nonlinear
Linear
79.
79
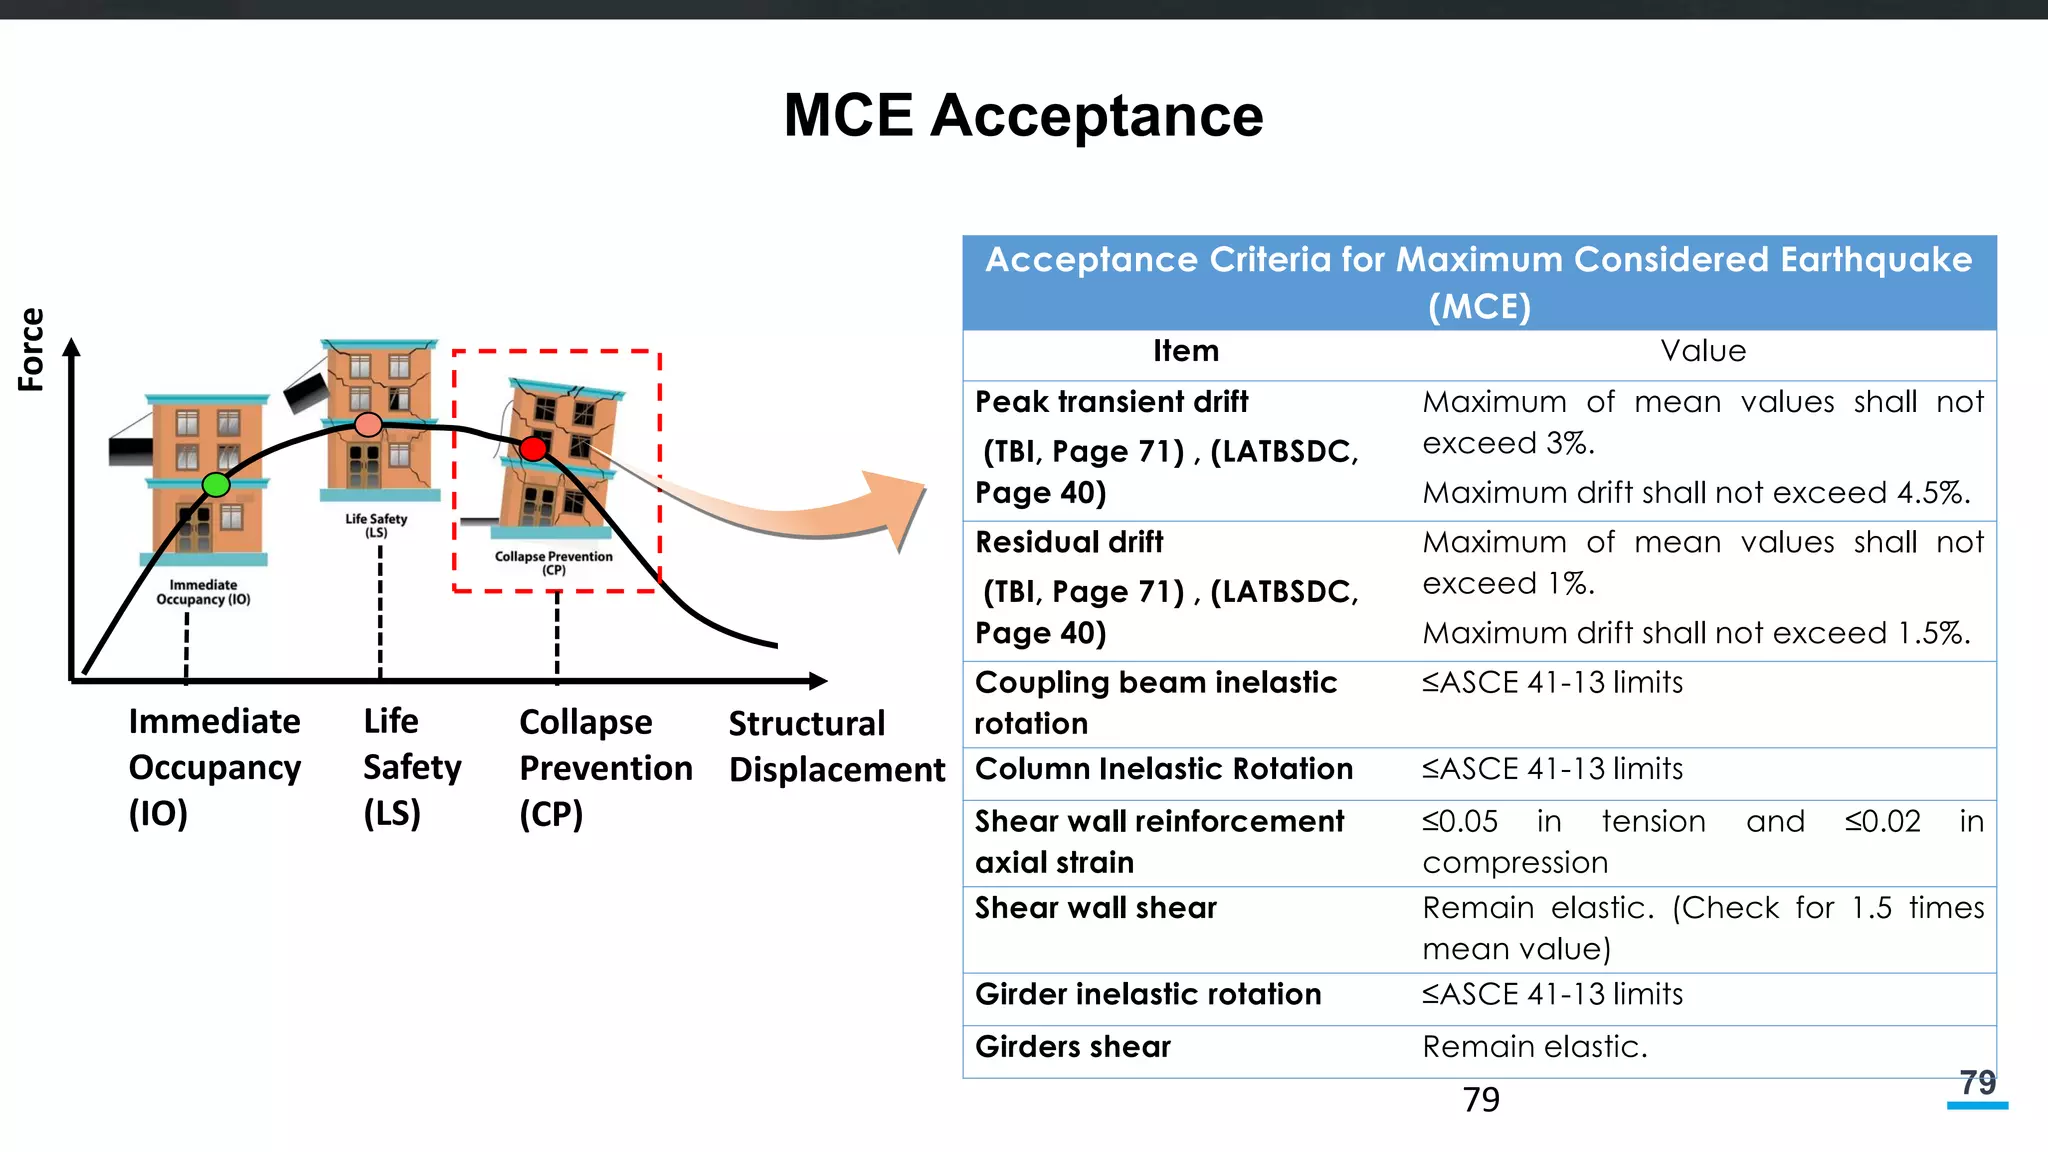
MCE Acceptance
79
Acceptance Criteriafor Maximum Considered Earthquake
(MCE)
Item Value
Peak transient drift
(TBI, Page 71) , (LATBSDC,
Page 40)
Maximum of mean values shall not
exceed 3%.
Maximum drift shall not exceed 4.5%.
Residual drift
(TBI, Page 71) , (LATBSDC,
Page 40)
Maximum of mean values shall not
exceed 1%.
Maximum drift shall not exceed 1.5%.
Coupling beam inelastic
rotation
≤ASCE 41-13 limits
Column Inelastic Rotation ≤ASCE 41-13 limits
Shear wall reinforcement
axial strain
≤0.05 in tension and ≤0.02 in
compression
Shear wall shear Remain elastic. (Check for 1.5 times
mean value)
Girder inelastic rotation ≤ASCE 41-13 limits
Girders shear Remain elastic.
Force
Structural
Displacement
Immediate
Occupancy
(IO)
Life
Safety
(LS)
Collapse
Prevention
(CP)
80.
80
Demand
Capacity
(DC Ratio)
• Definitionof D/C: It is an index that gives an overall
relationship between affects of load and ability of member to
resists those affects.
• This is a normalized factor that means D/C ratio value of 1
indicates that the capacity (strength, deformation etc) member
is just enough to fulfill the load demand.
• Two types of D/C ratio
Members with brittle behavior D/C is checked by Strength
(Elastic)
Members with ductile behavior D/C is checked by deformation
(Inelastic)
• Total D/C ratio of the member is combined of these two.
81.
81
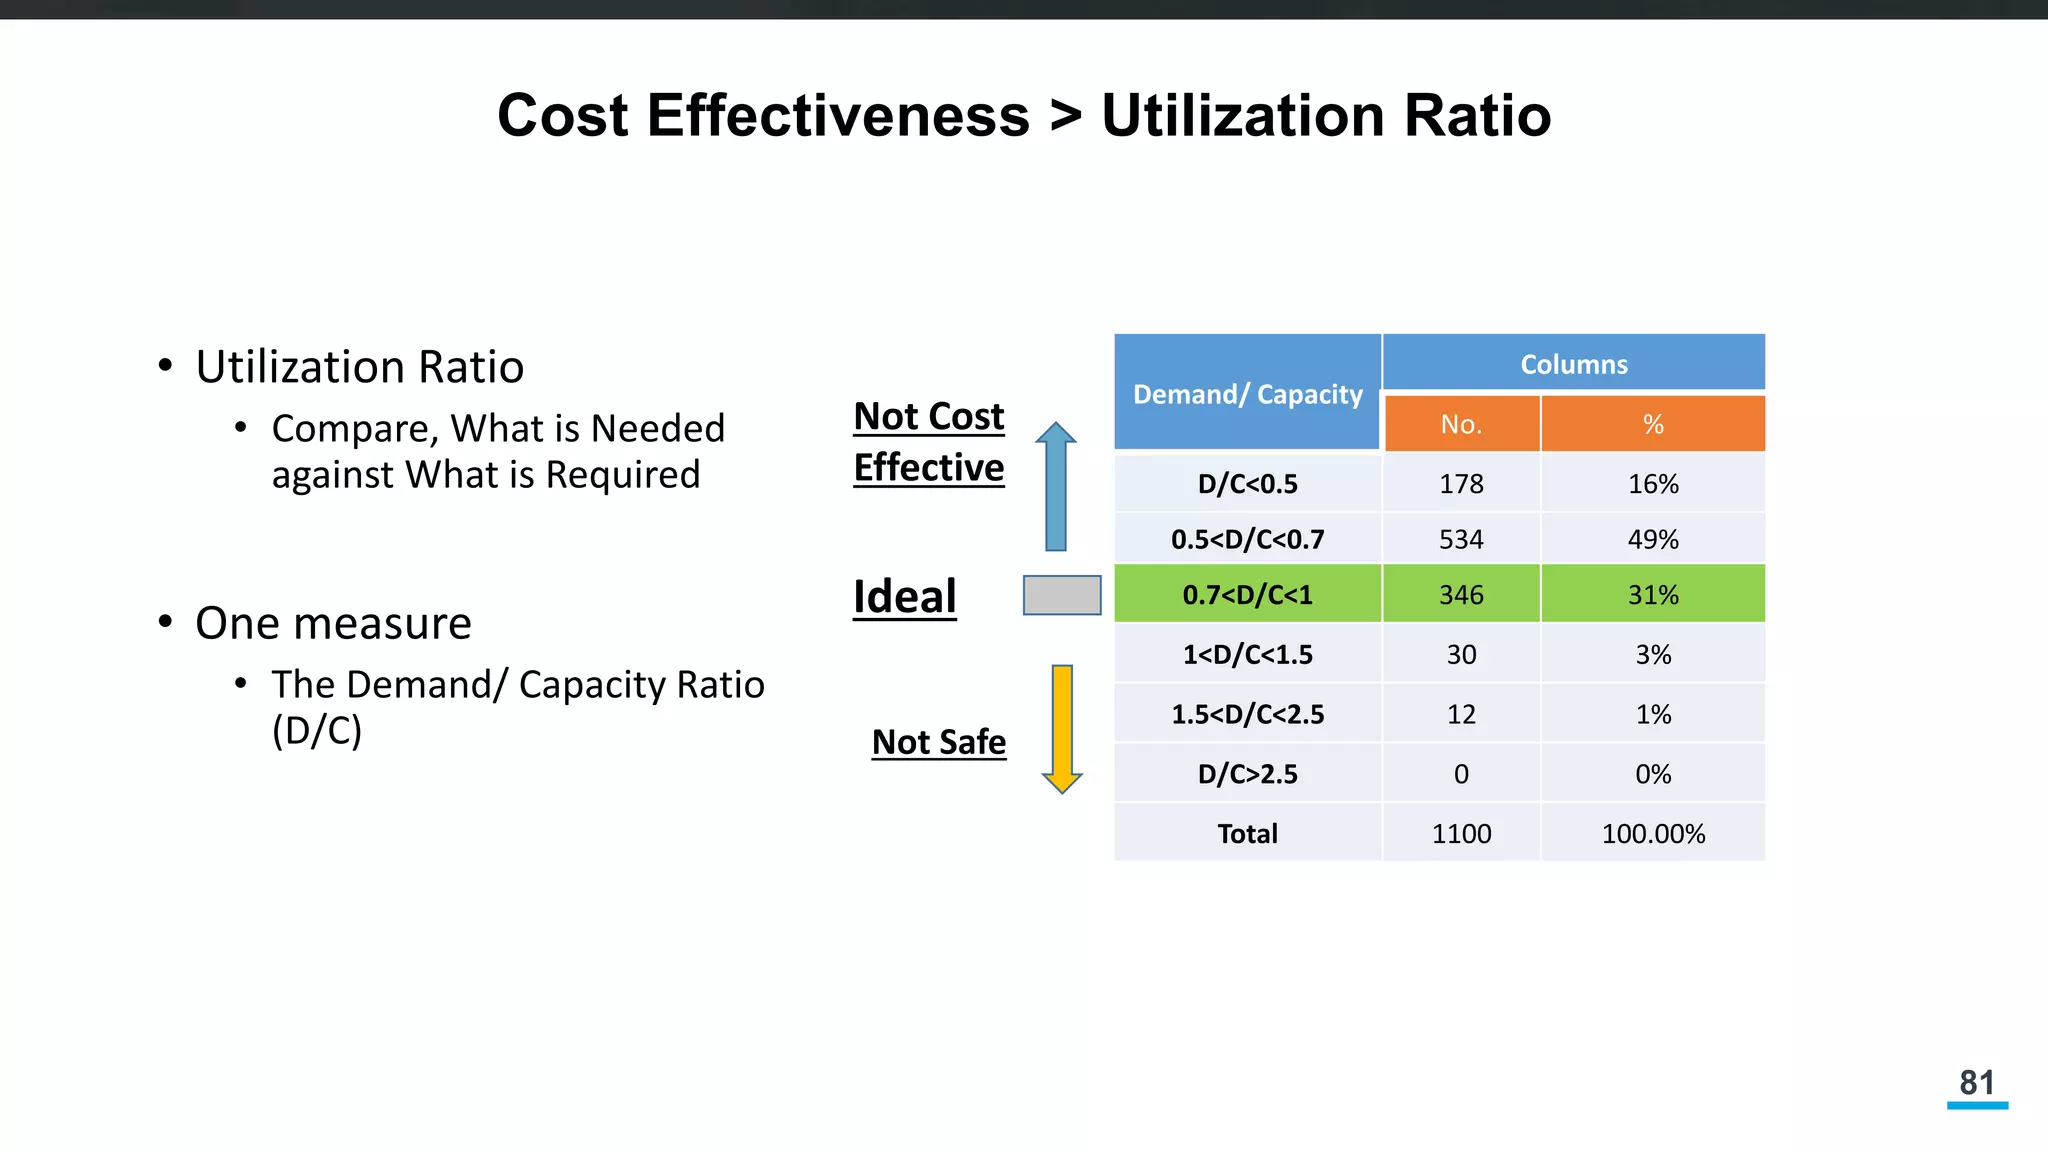
Cost Effectiveness >Utilization Ratio
• Utilization Ratio
• Compare, What is Needed
against What is Required
• One measure
• The Demand/ Capacity Ratio
(D/C)
Demand/ Capacity
Columns
No. %
D/C<0.5 178 16%
0.5<D/C<0.7 534 49%
0.7<D/C<1 346 31%
1<D/C<1.5 30 3%
1.5<D/C<2.5 12 1%
D/C>2.5 0 0%
Total 1100 100.00%
Ideal
Not Cost
Effective
Not Safe
82.
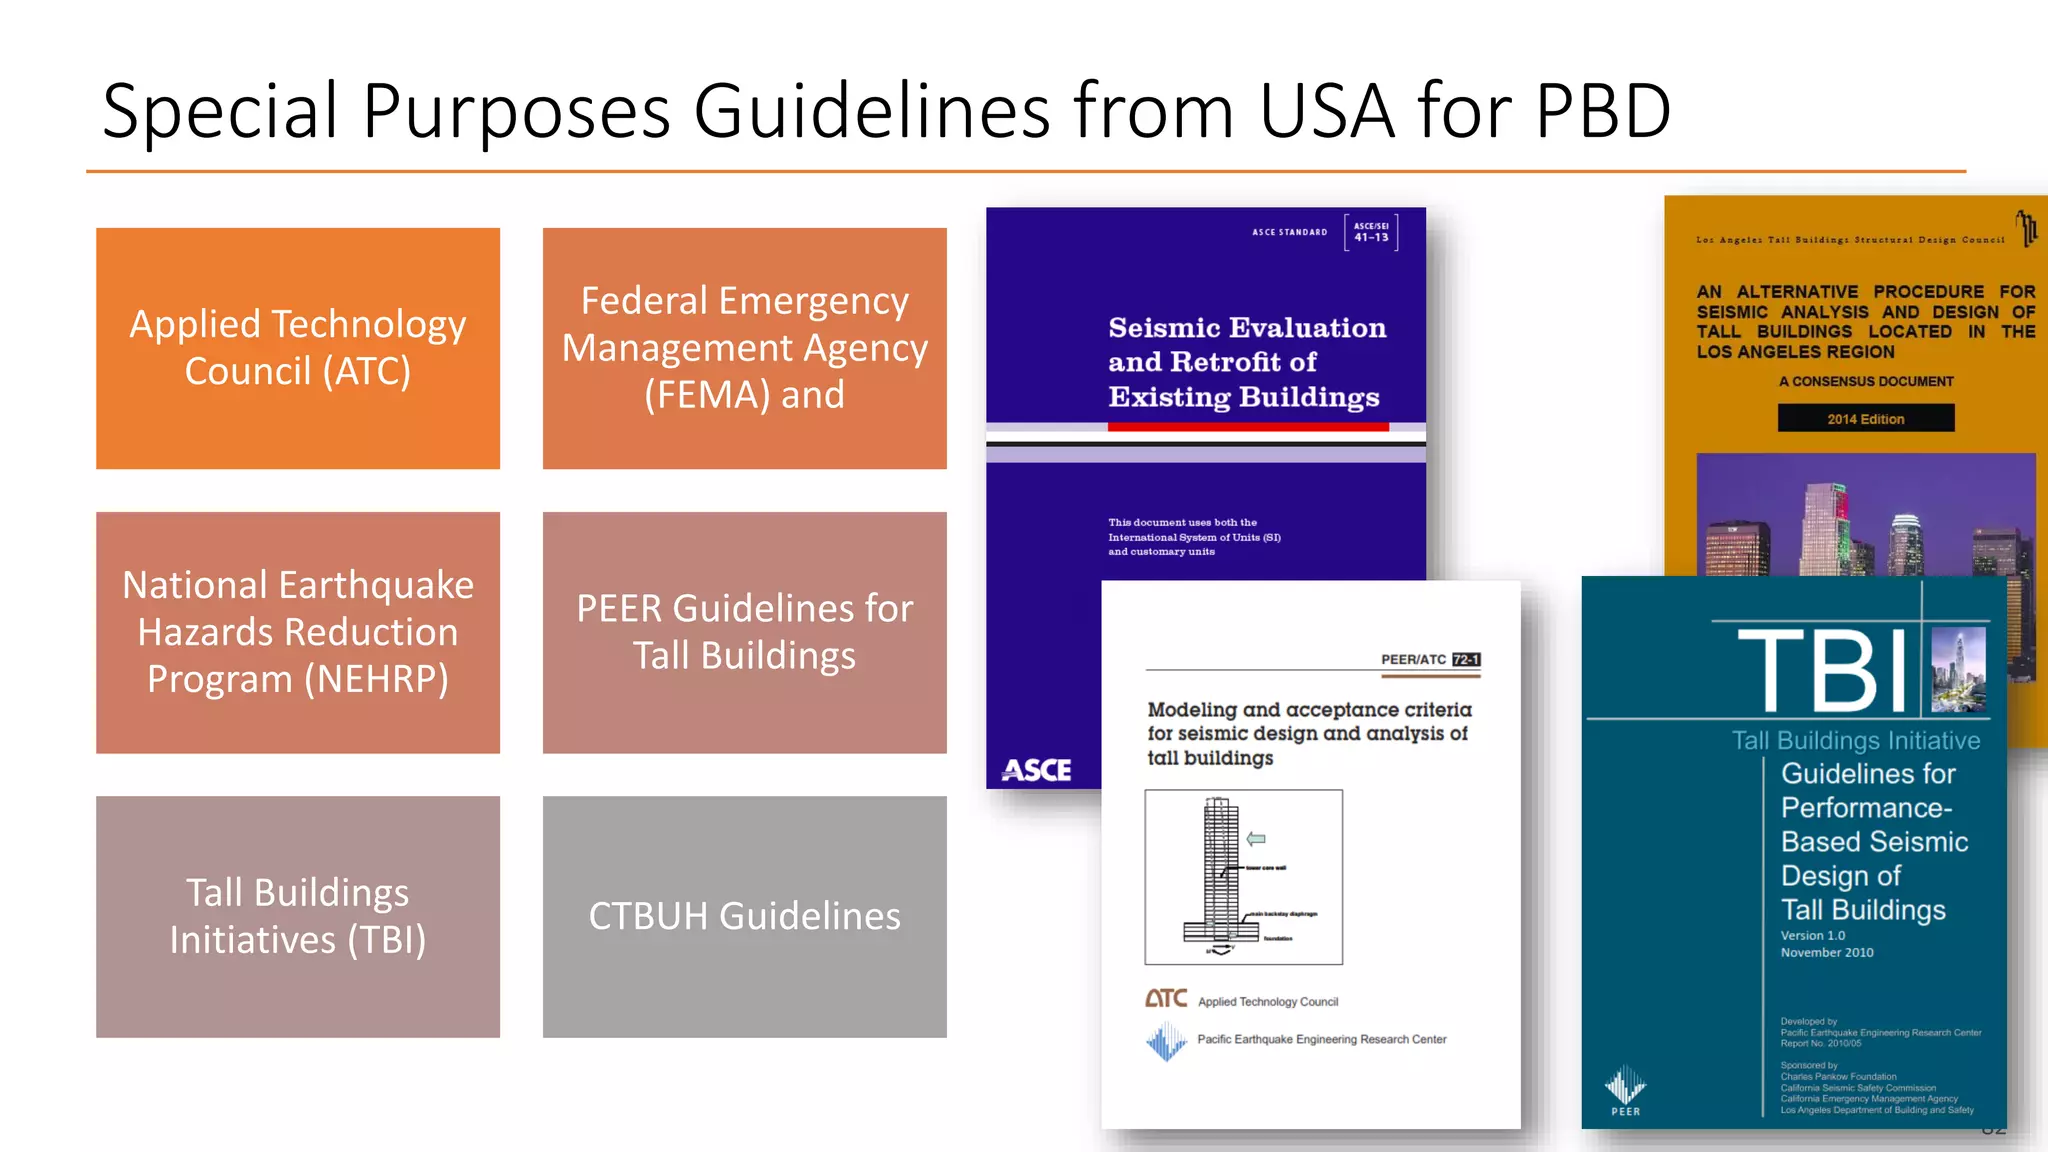
Special Purposes Guidelinesfrom USA for PBD
82
Applied Technology
Council (ATC)
Federal Emergency
Management Agency
(FEMA) and
National Earthquake
Hazards Reduction
Program (NEHRP)
PEER Guidelines for
Tall Buildings
Tall Buildings
Initiatives (TBI)
CTBUH Guidelines
83.
AIT and PBD
•Research labs to support
innovation
• More than 100 tall building
projects in Asia
• Carried out for several
developers and structural
engineers
• Many of which further reviewed
by third-party experts based in
the USA
• More than 50 MS and PhD
Thesis on PBD Tall Buildings
85
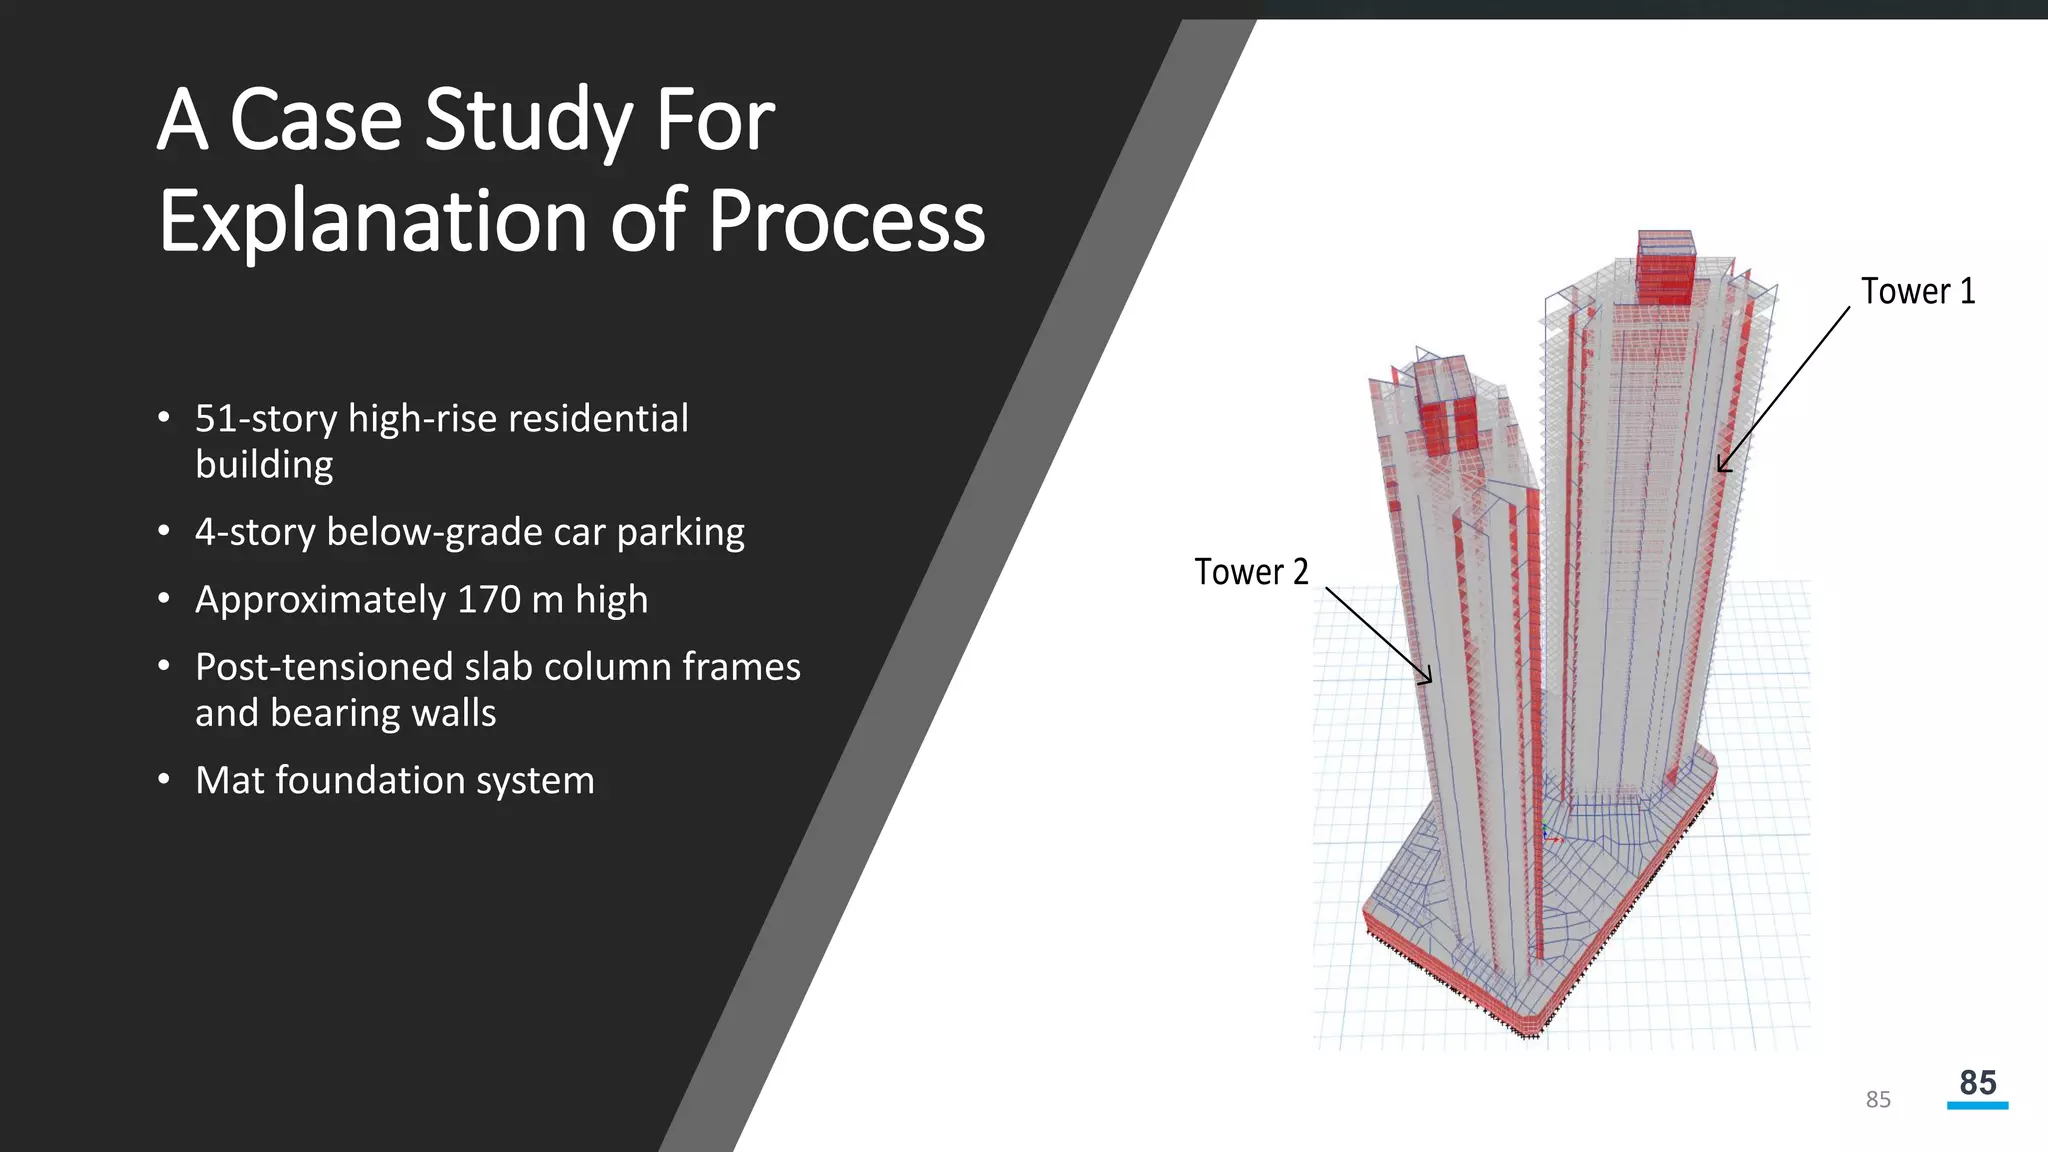
Tower 1
Tower 2
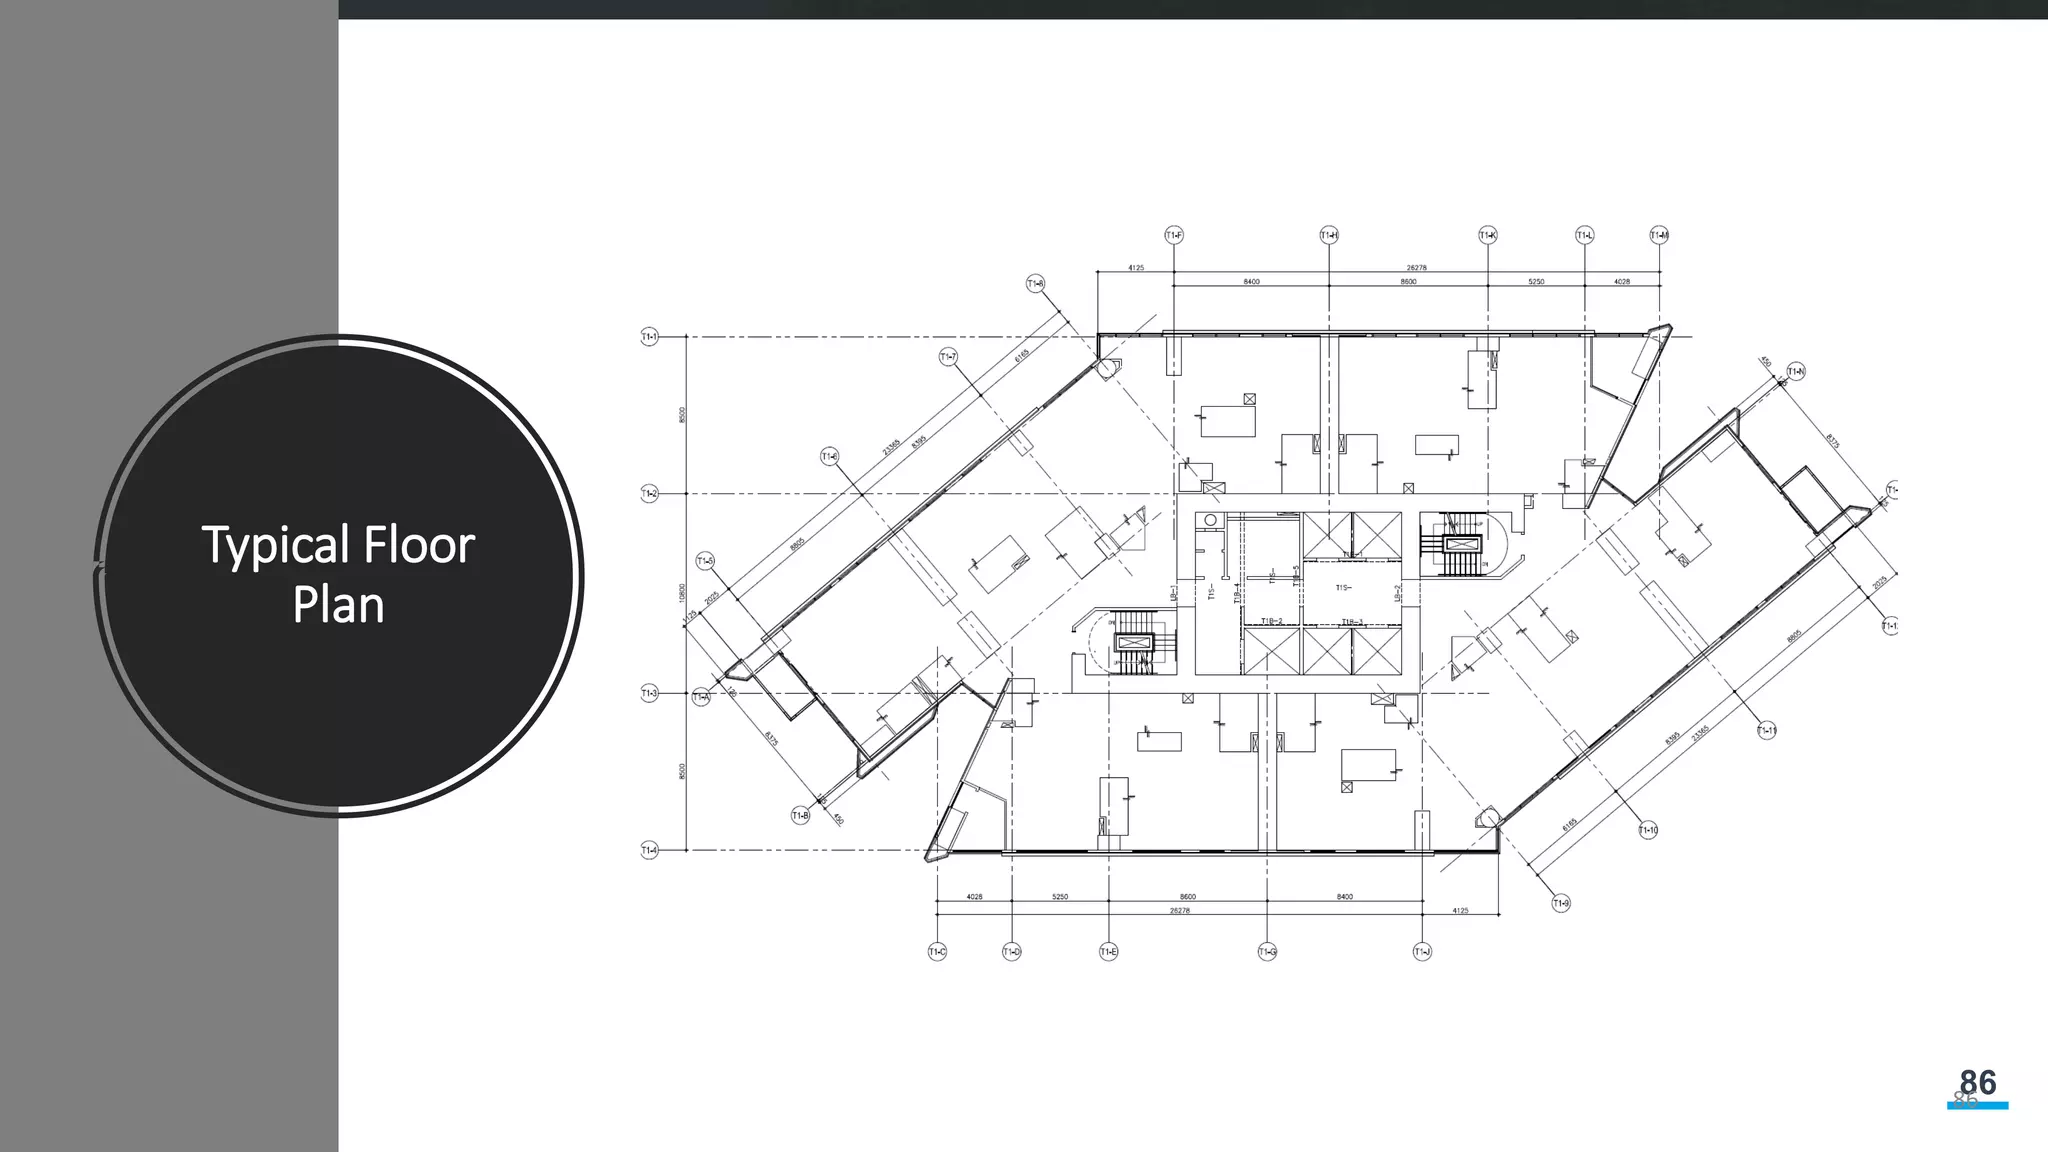
ACase Study For
Explanation of Process
• 51-story high-rise residential
building
• 4-story below-grade car parking
• Approximately 170 m high
• Post-tensioned slab column frames
and bearing walls
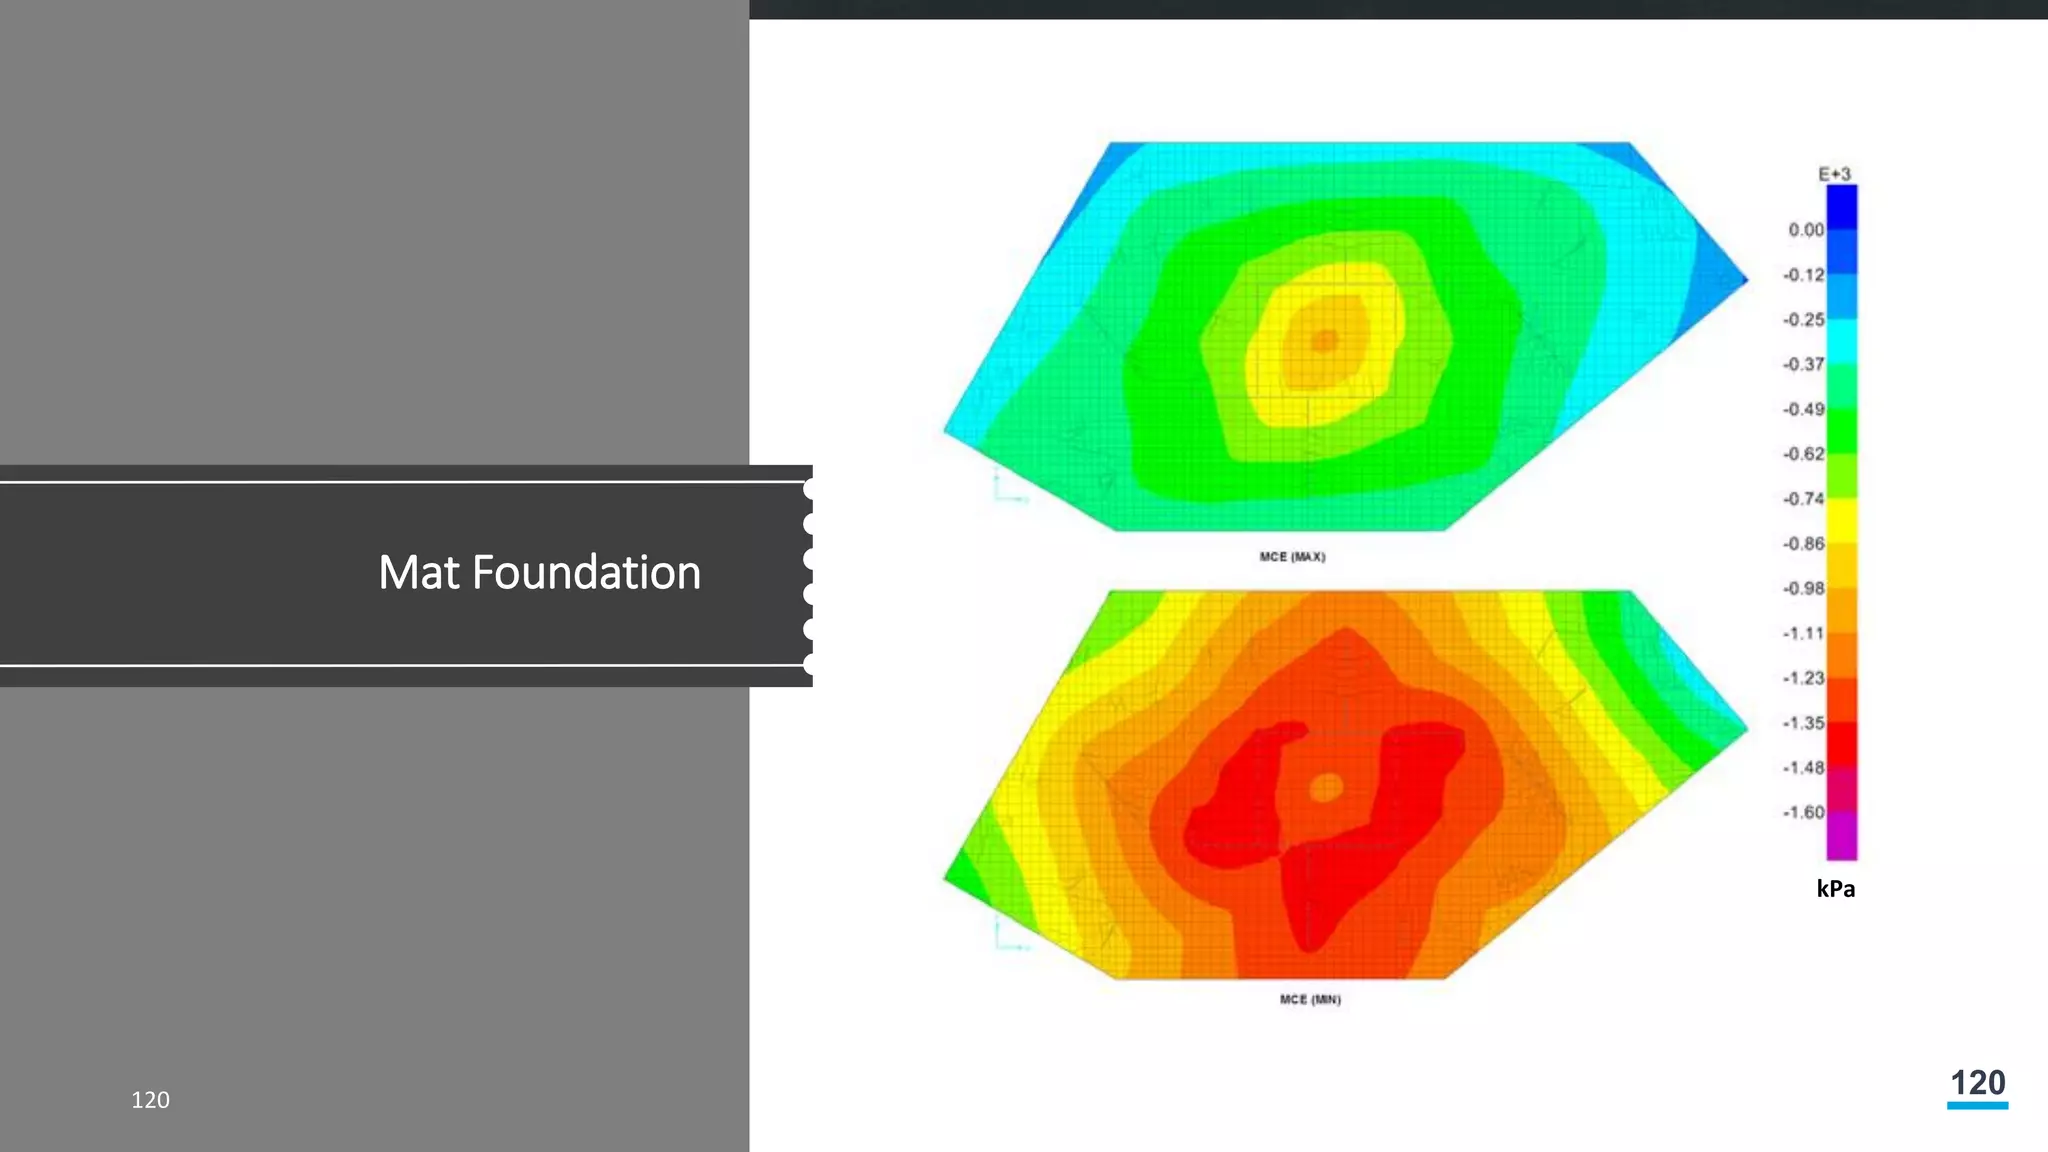
• Mat foundation system
85
88
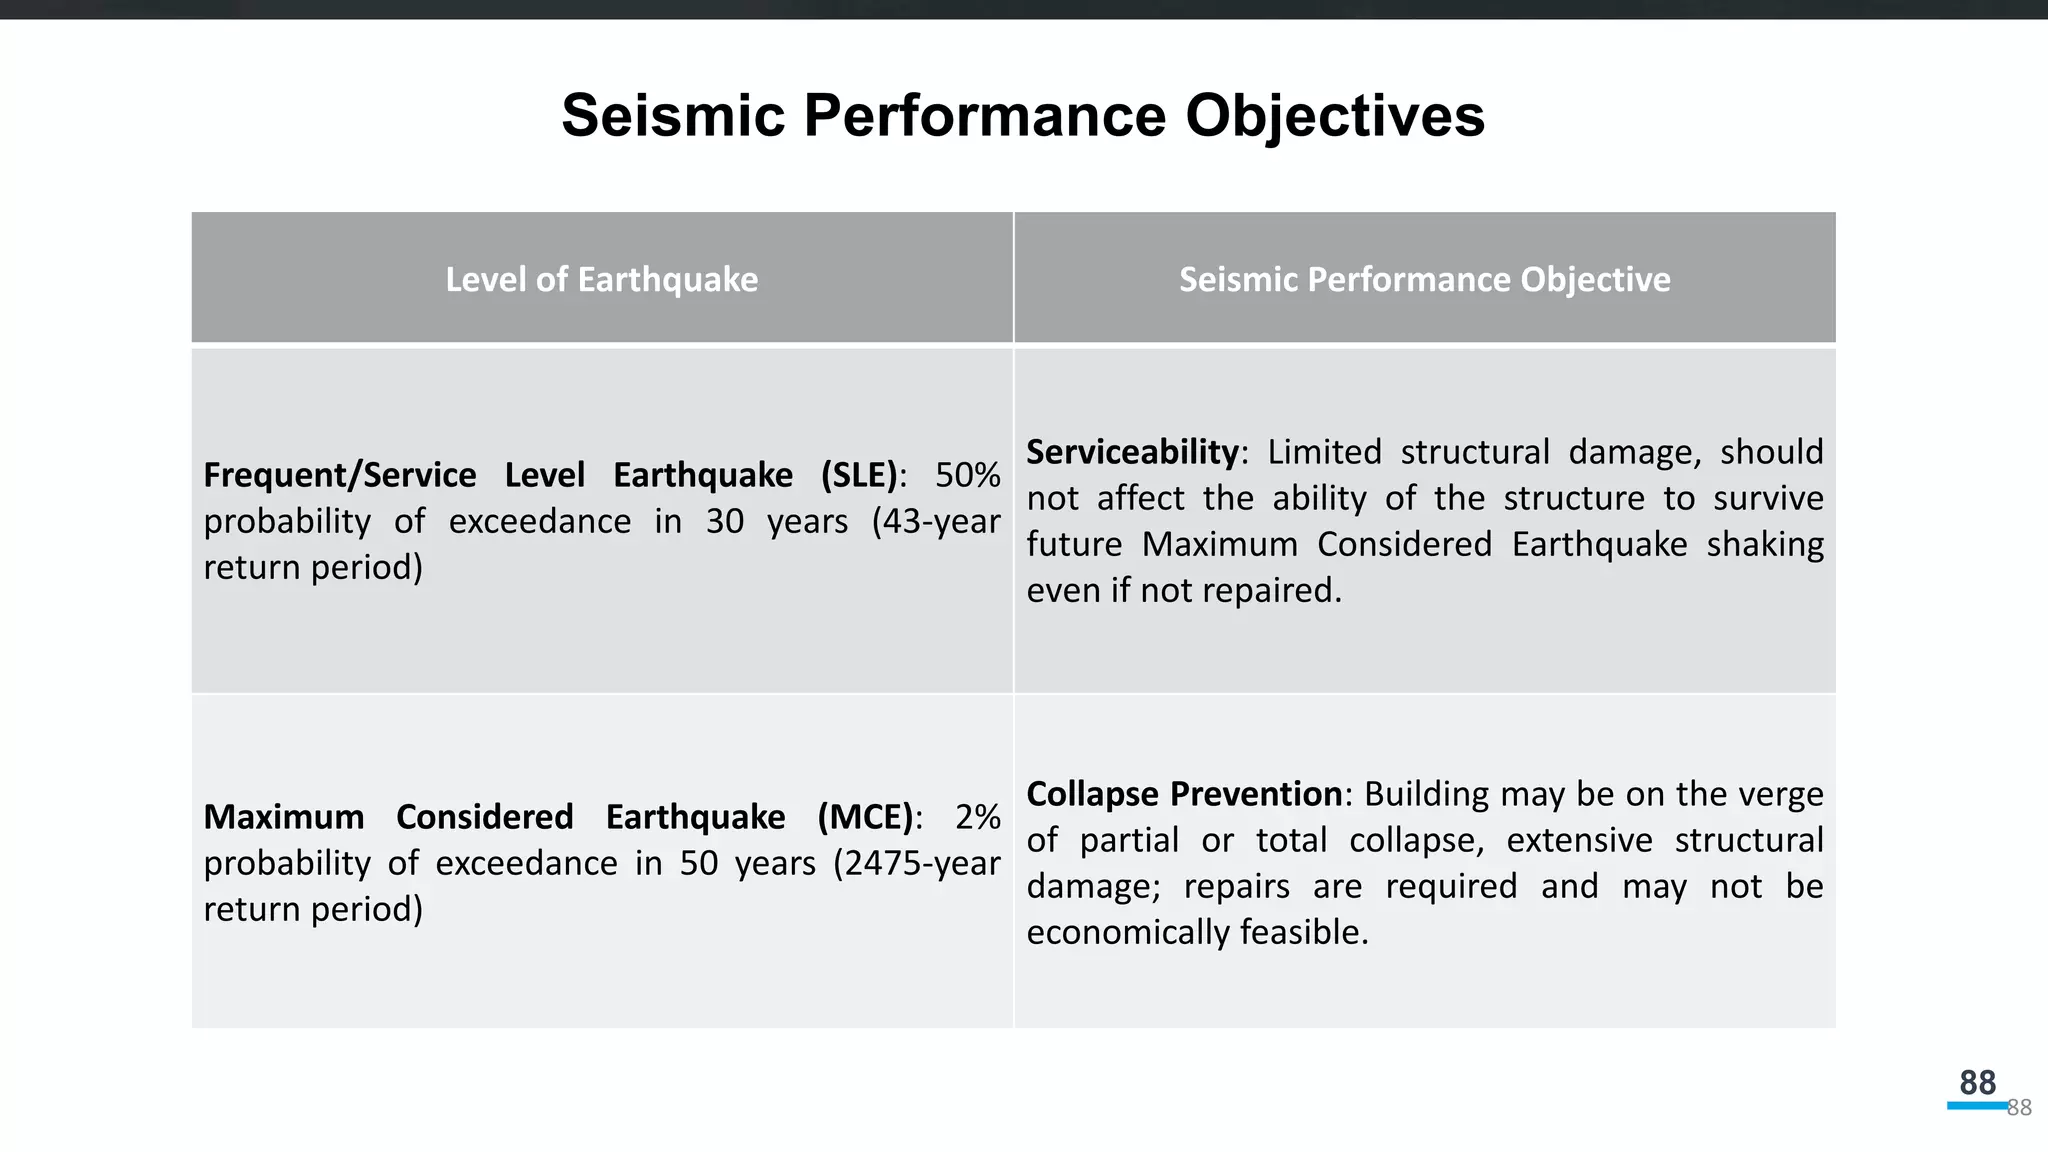
Seismic Performance Objectives
88
Levelof Earthquake Seismic Performance Objective
Frequent/Service Level Earthquake (SLE): 50%
probability of exceedance in 30 years (43-year
return period)
Serviceability: Limited structural damage, should
not affect the ability of the structure to survive
future Maximum Considered Earthquake shaking
even if not repaired.
Maximum Considered Earthquake (MCE): 2%
probability of exceedance in 50 years (2475-year
return period)
Collapse Prevention: Building may be on the verge
of partial or total collapse, extensive structural
damage; repairs are required and may not be
economically feasible.
89.
89
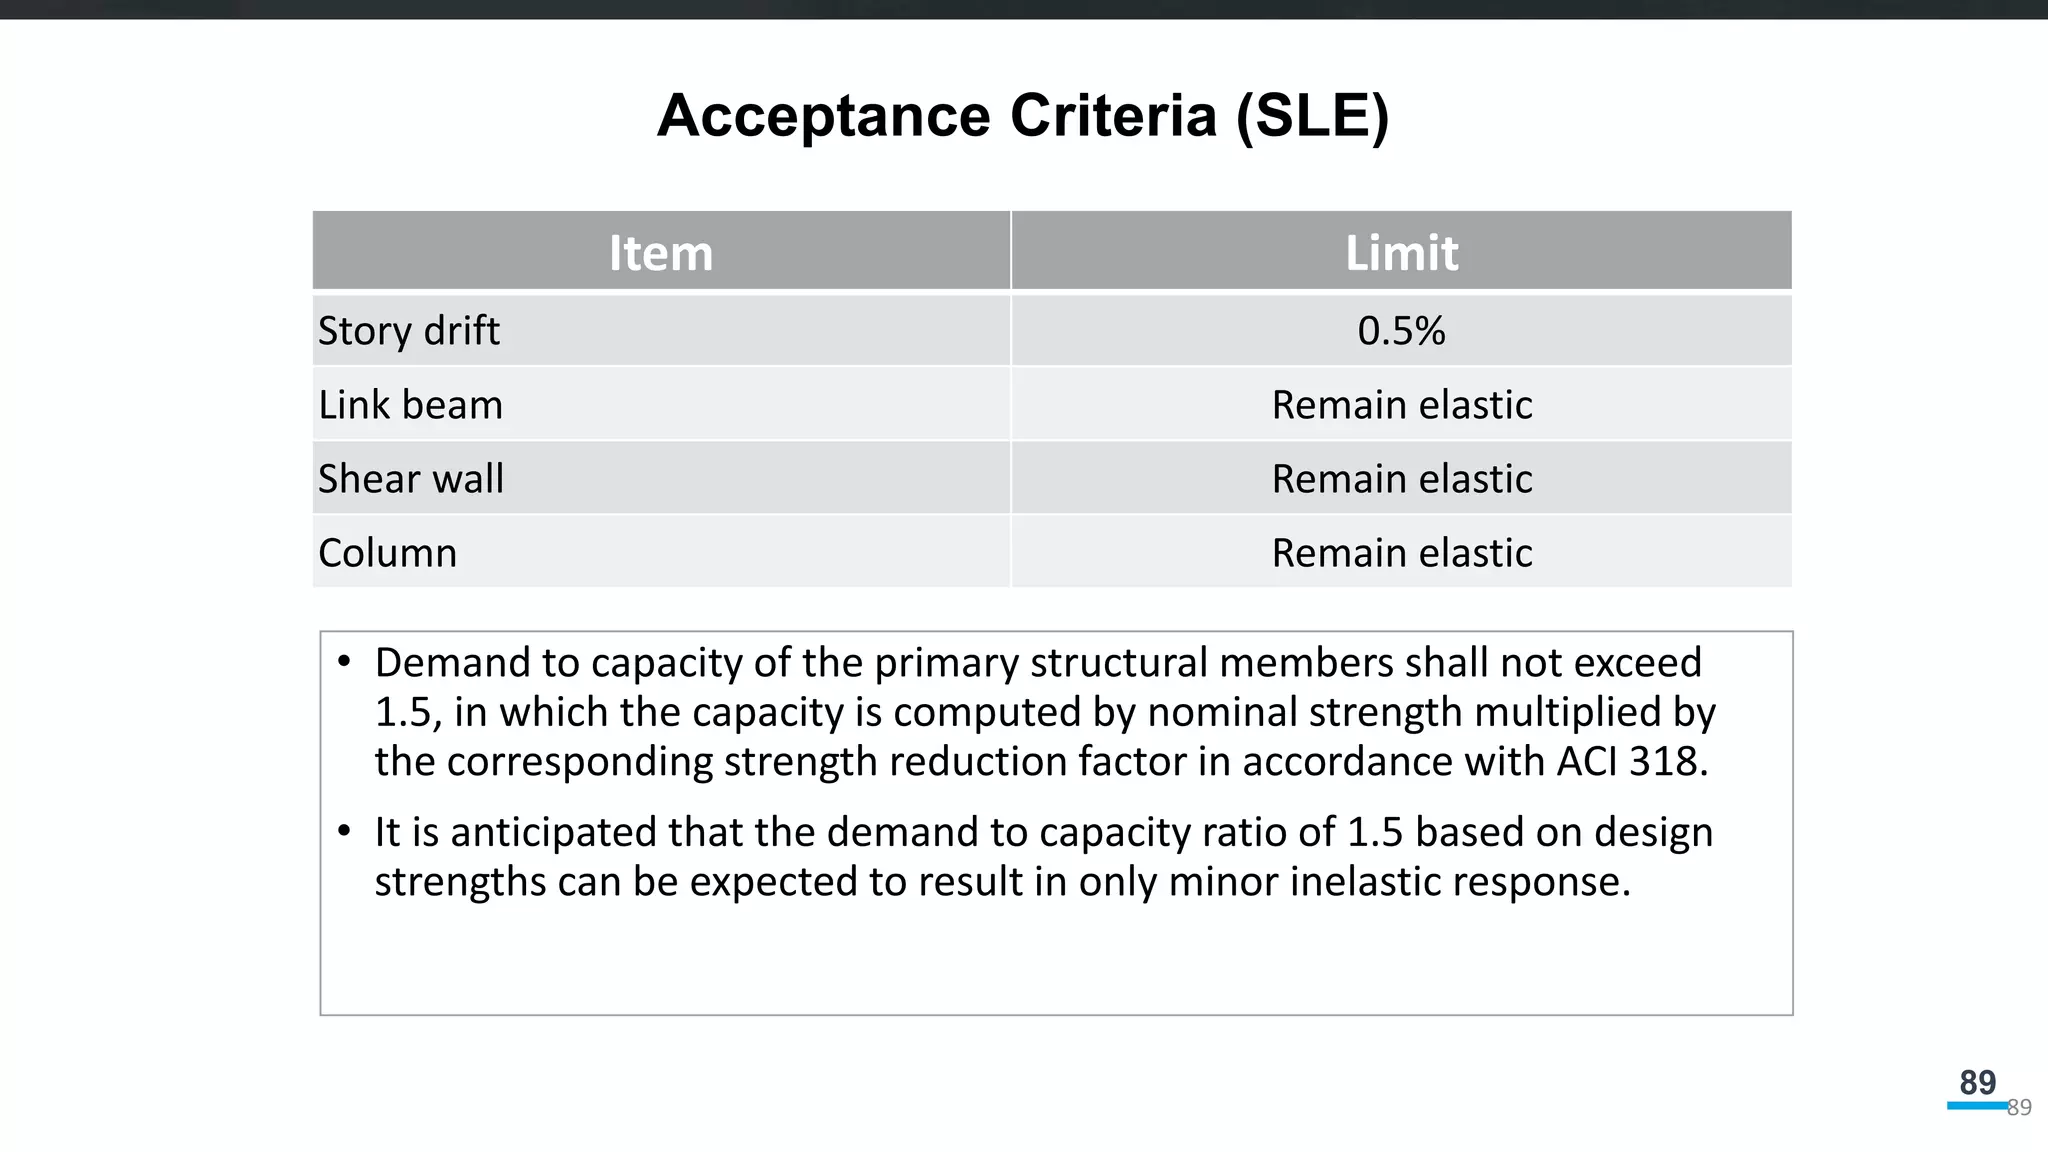
Acceptance Criteria (SLE)
89
ItemLimit
Story drift 0.5%
Link beam Remain elastic
Shear wall Remain elastic
Column Remain elastic
• Demand to capacity of the primary structural members shall not exceed
1.5, in which the capacity is computed by nominal strength multiplied by
the corresponding strength reduction factor in accordance with ACI 318.
• It is anticipated that the demand to capacity ratio of 1.5 based on design
strengths can be expected to result in only minor inelastic response.
90.
90
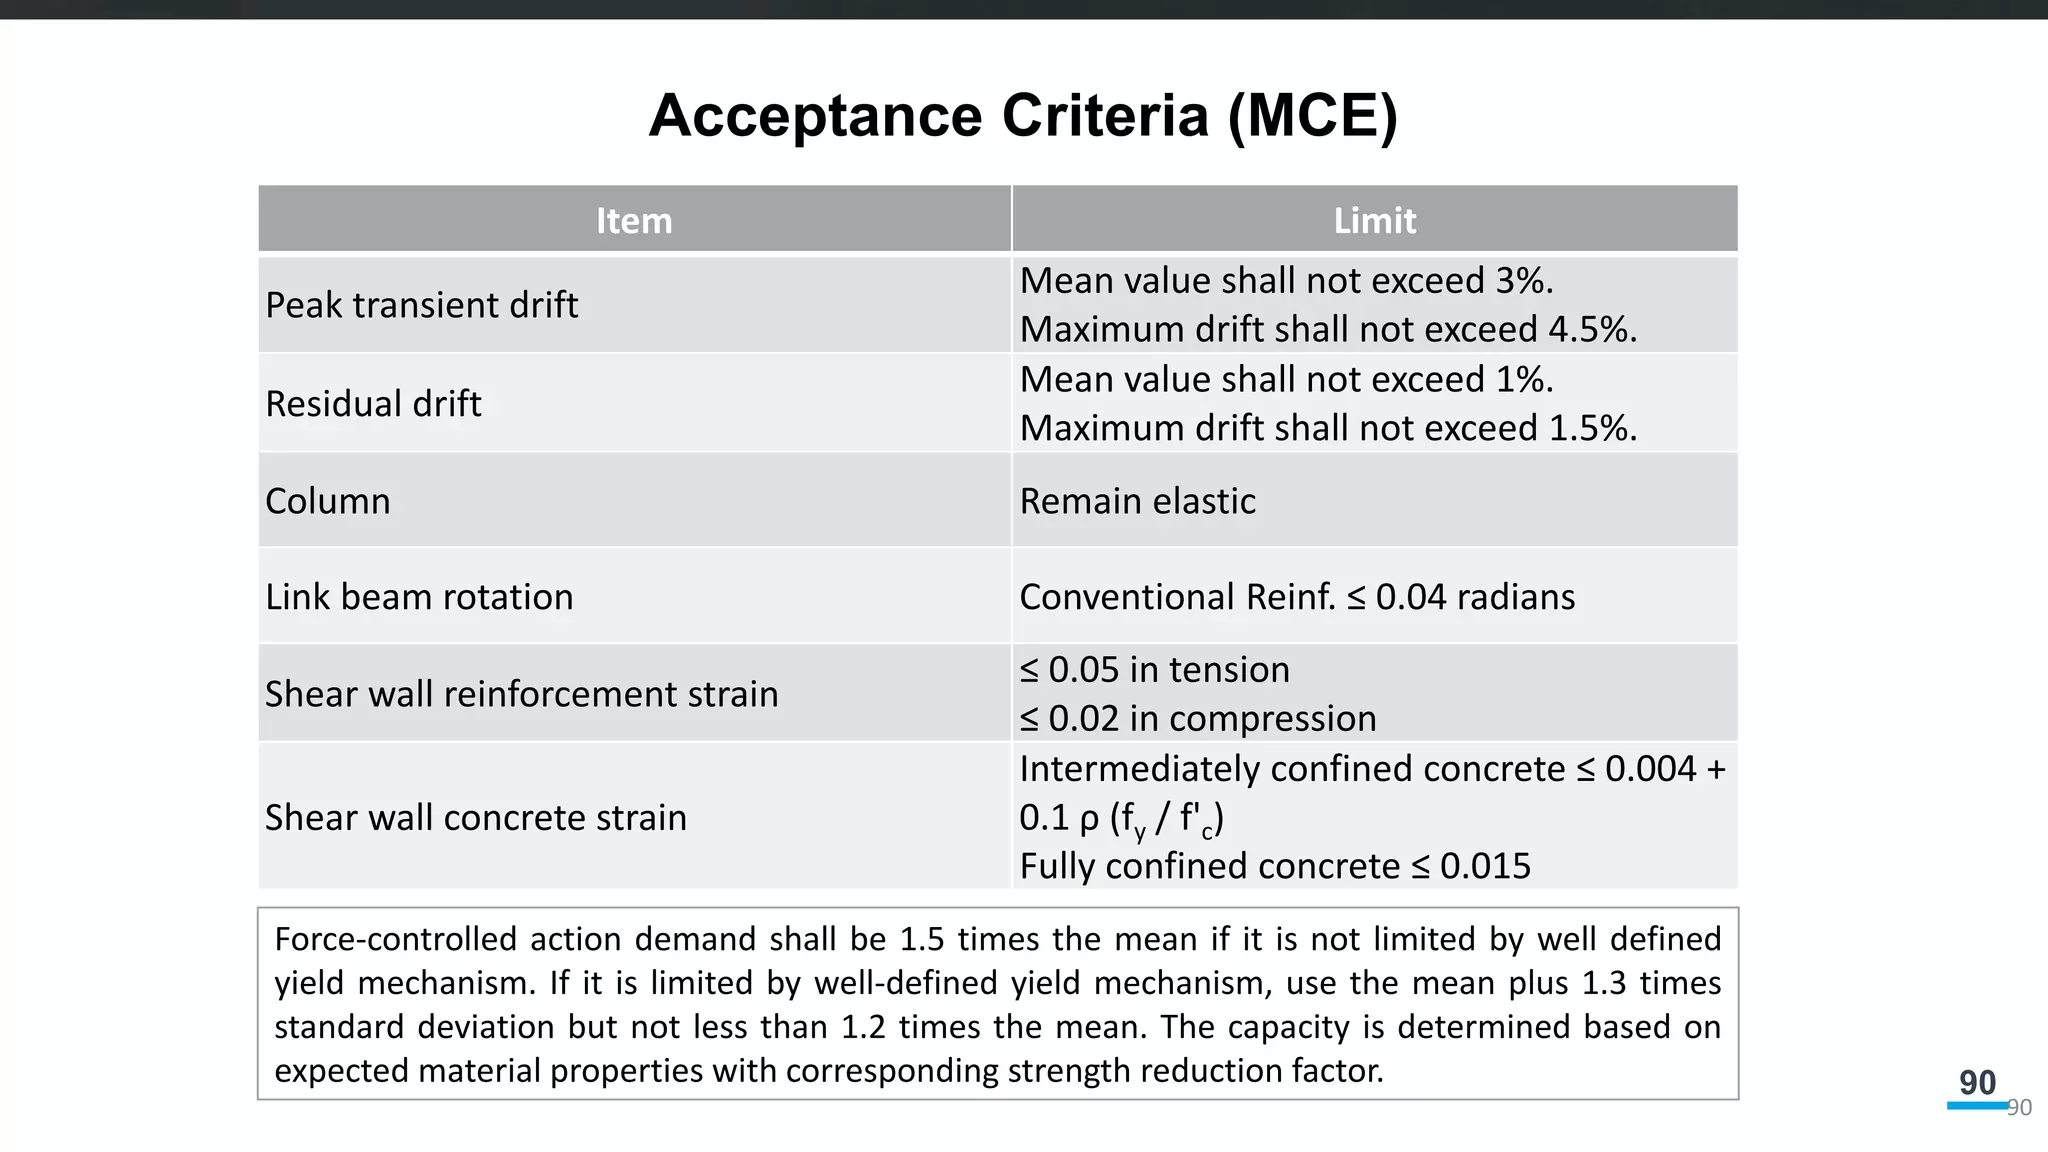
Acceptance Criteria (MCE)
90
ItemLimit
Peak transient drift
Mean value shall not exceed 3%.
Maximum drift shall not exceed 4.5%.
Residual drift
Mean value shall not exceed 1%.
Maximum drift shall not exceed 1.5%.
Column Remain elastic
Link beam rotation Conventional Reinf. ≤ 0.04 radians
Shear wall reinforcement strain
≤ 0.05 in tension
≤ 0.02 in compression
Shear wall concrete strain
Intermediately confined concrete ≤ 0.004 +
0.1 ρ (fy / f'c)
Fully confined concrete ≤ 0.015
Force-controlled action demand shall be 1.5 times the mean if it is not limited by well defined
yield mechanism. If it is limited by well-defined yield mechanism, use the mean plus 1.3 times
standard deviation but not less than 1.2 times the mean. The capacity is determined based on
expected material properties with corresponding strength reduction factor.
92
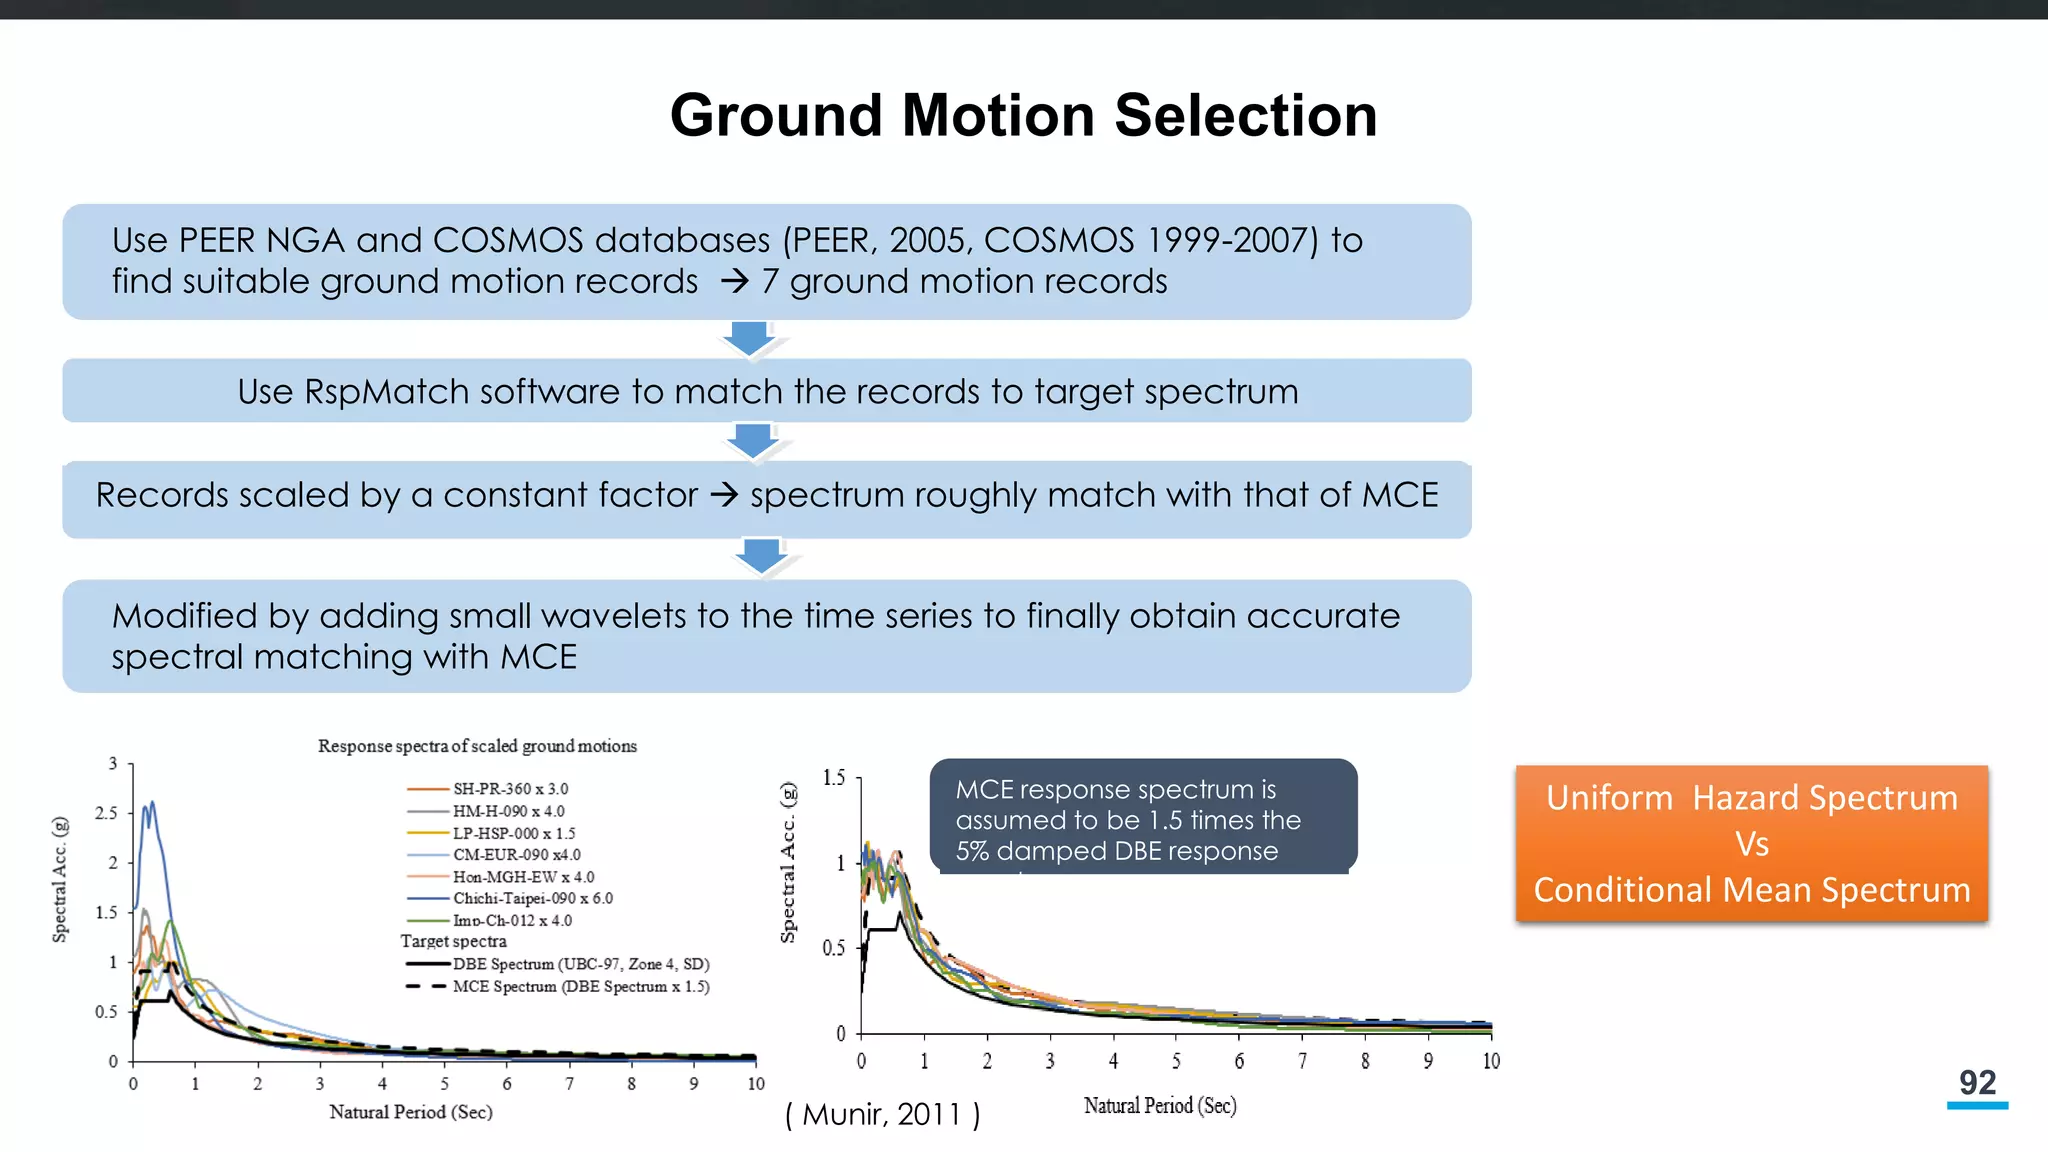
Ground Motion Selection
Modifiedby adding small wavelets to the time series to finally obtain accurate
spectral matching with MCE
( Munir, 2011 )
Use RspMatch software to match the records to target spectrum
Use PEER NGA and COSMOS databases (PEER, 2005, COSMOS 1999-2007) to
find suitable ground motion records 7 ground motion records
Records scaled by a constant factor spectrum roughly match with that of MCE
MCE response spectrum is
assumed to be 1.5 times the
5% damped DBE response
spectrum.
Uniform Hazard Spectrum
Vs
Conditional Mean Spectrum
93.
93
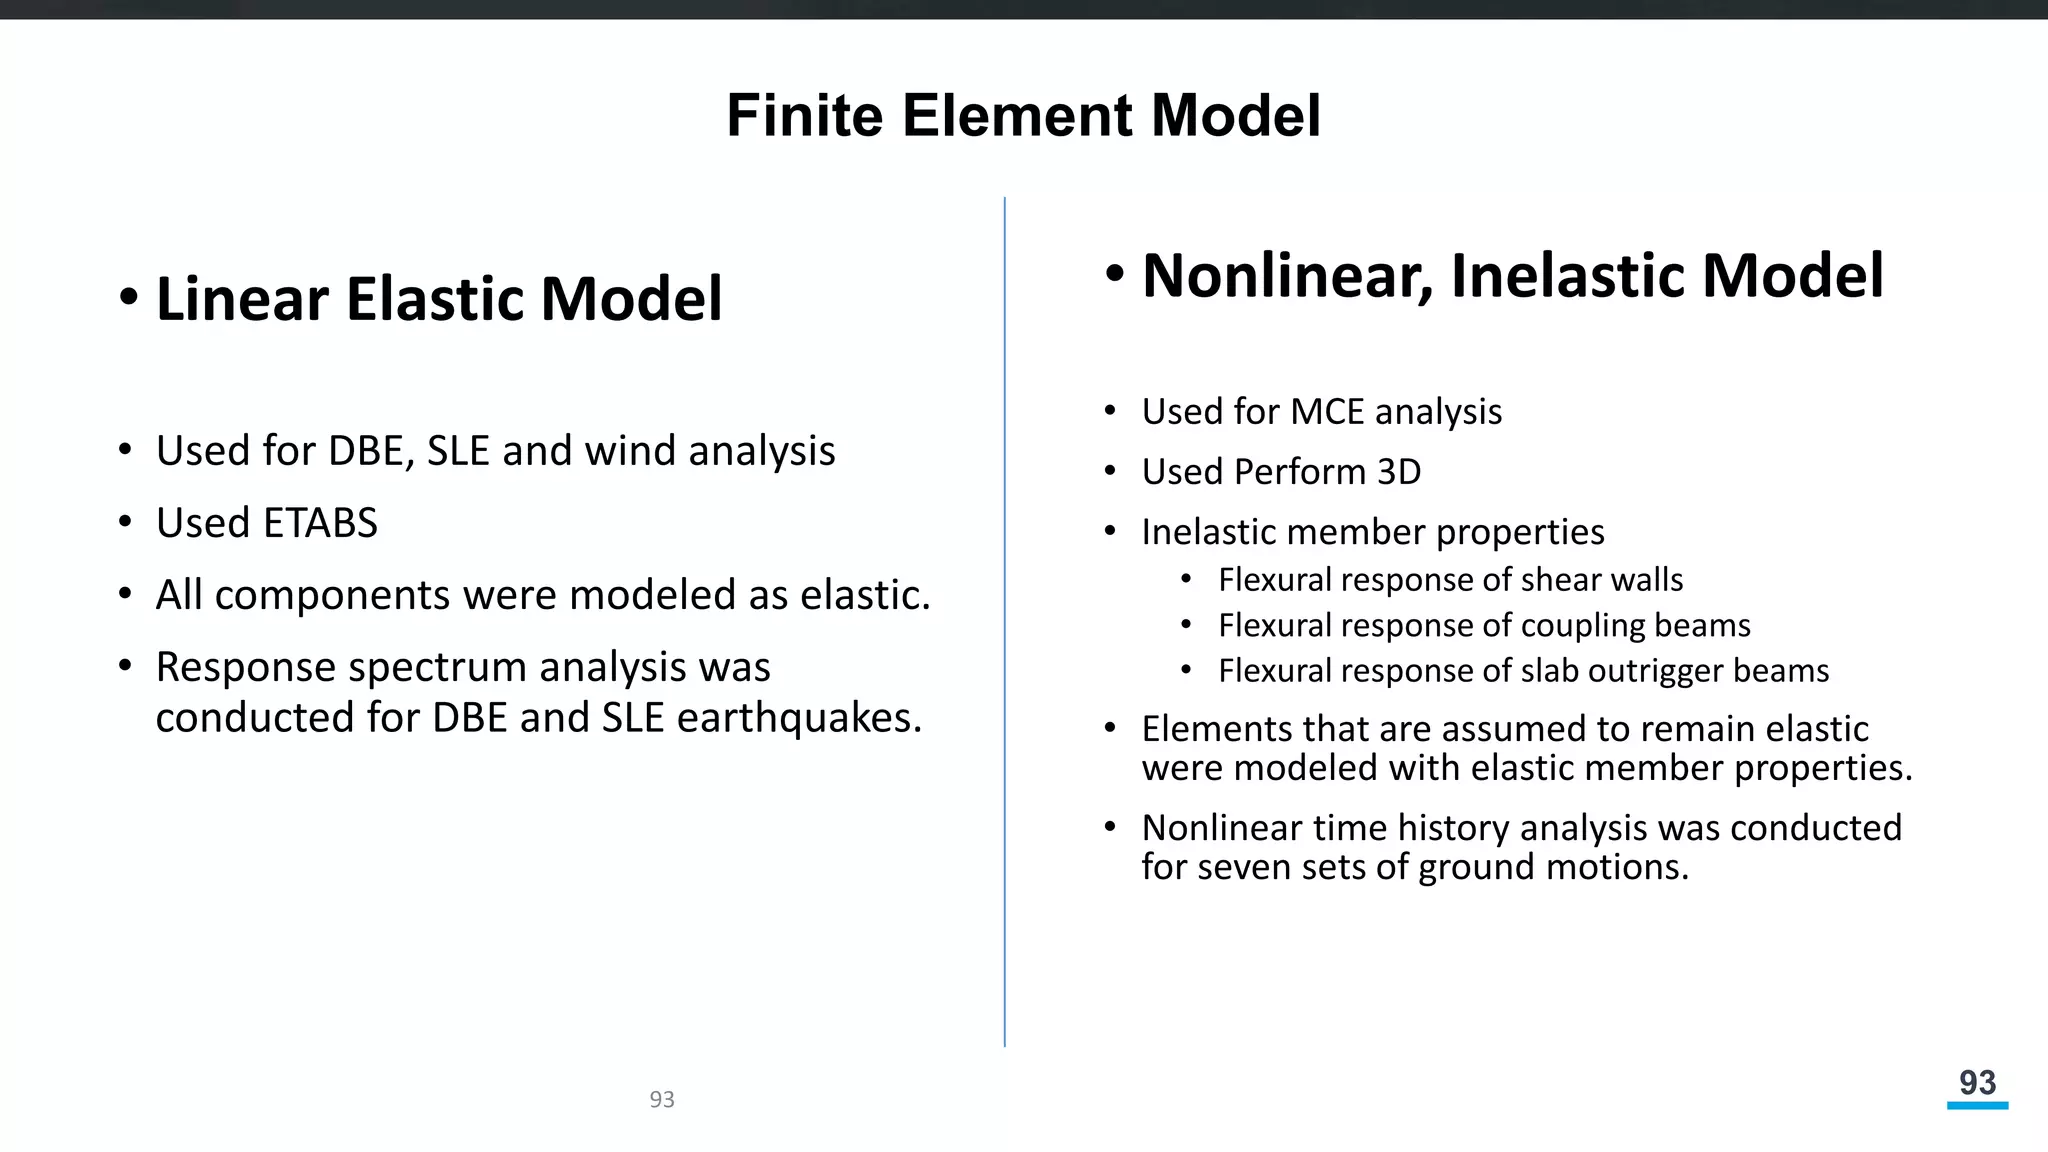
Finite Element Model
•Linear Elastic Model
• Used for DBE, SLE and wind analysis
• Used ETABS
• All components were modeled as elastic.
• Response spectrum analysis was
conducted for DBE and SLE earthquakes.
• Nonlinear, Inelastic Model
• Used for MCE analysis
• Used Perform 3D
• Inelastic member properties
• Flexural response of shear walls
• Flexural response of coupling beams
• Flexural response of slab outrigger beams
• Elements that are assumed to remain elastic
were modeled with elastic member properties.
• Nonlinear time history analysis was conducted
for seven sets of ground motions.
93
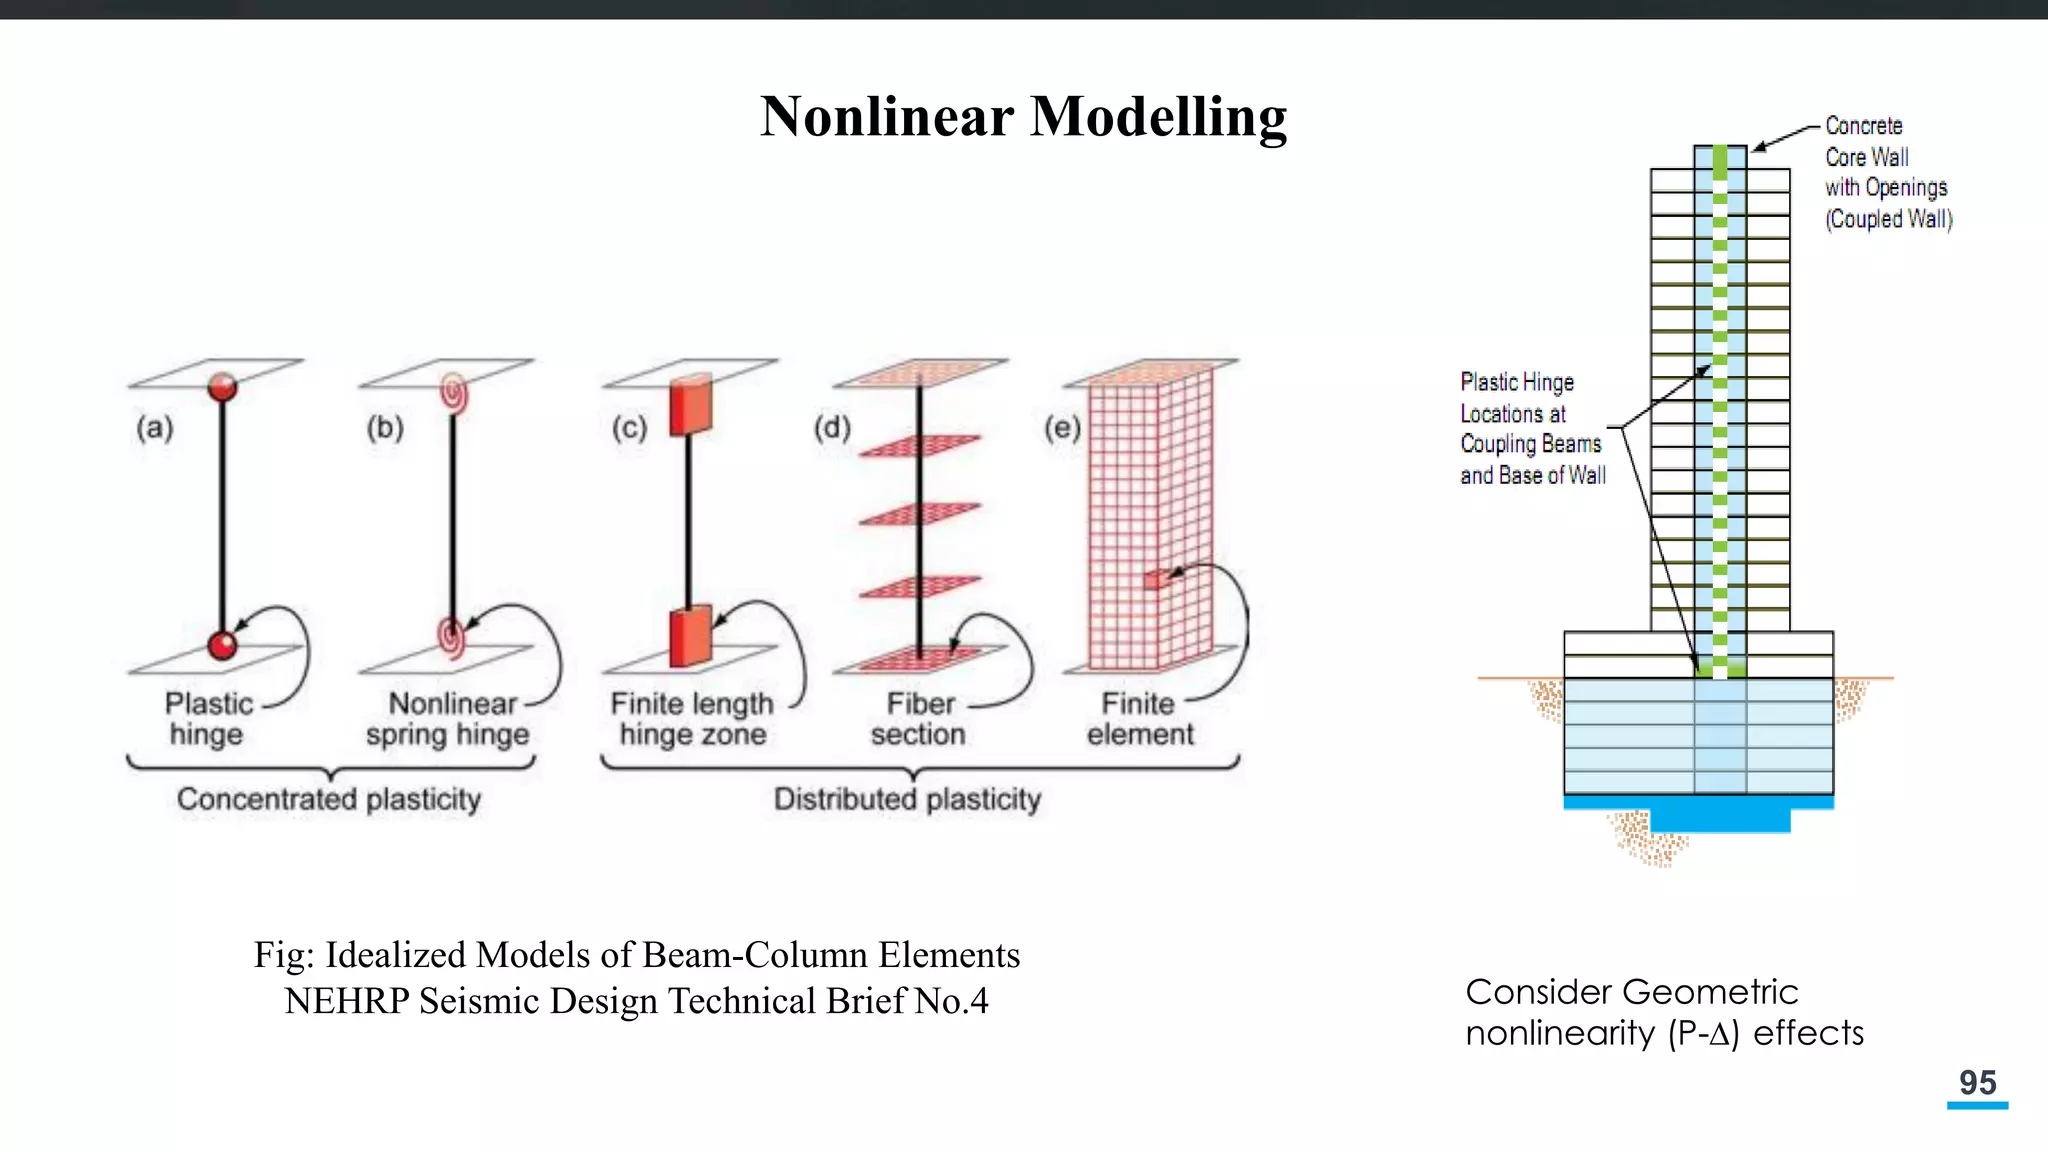
95
Nonlinear Modelling
Fig: IdealizedModels of Beam-Column Elements
NEHRP Seismic Design Technical Brief No.4 Consider Geometric
nonlinearity (P-∆) effects
96.
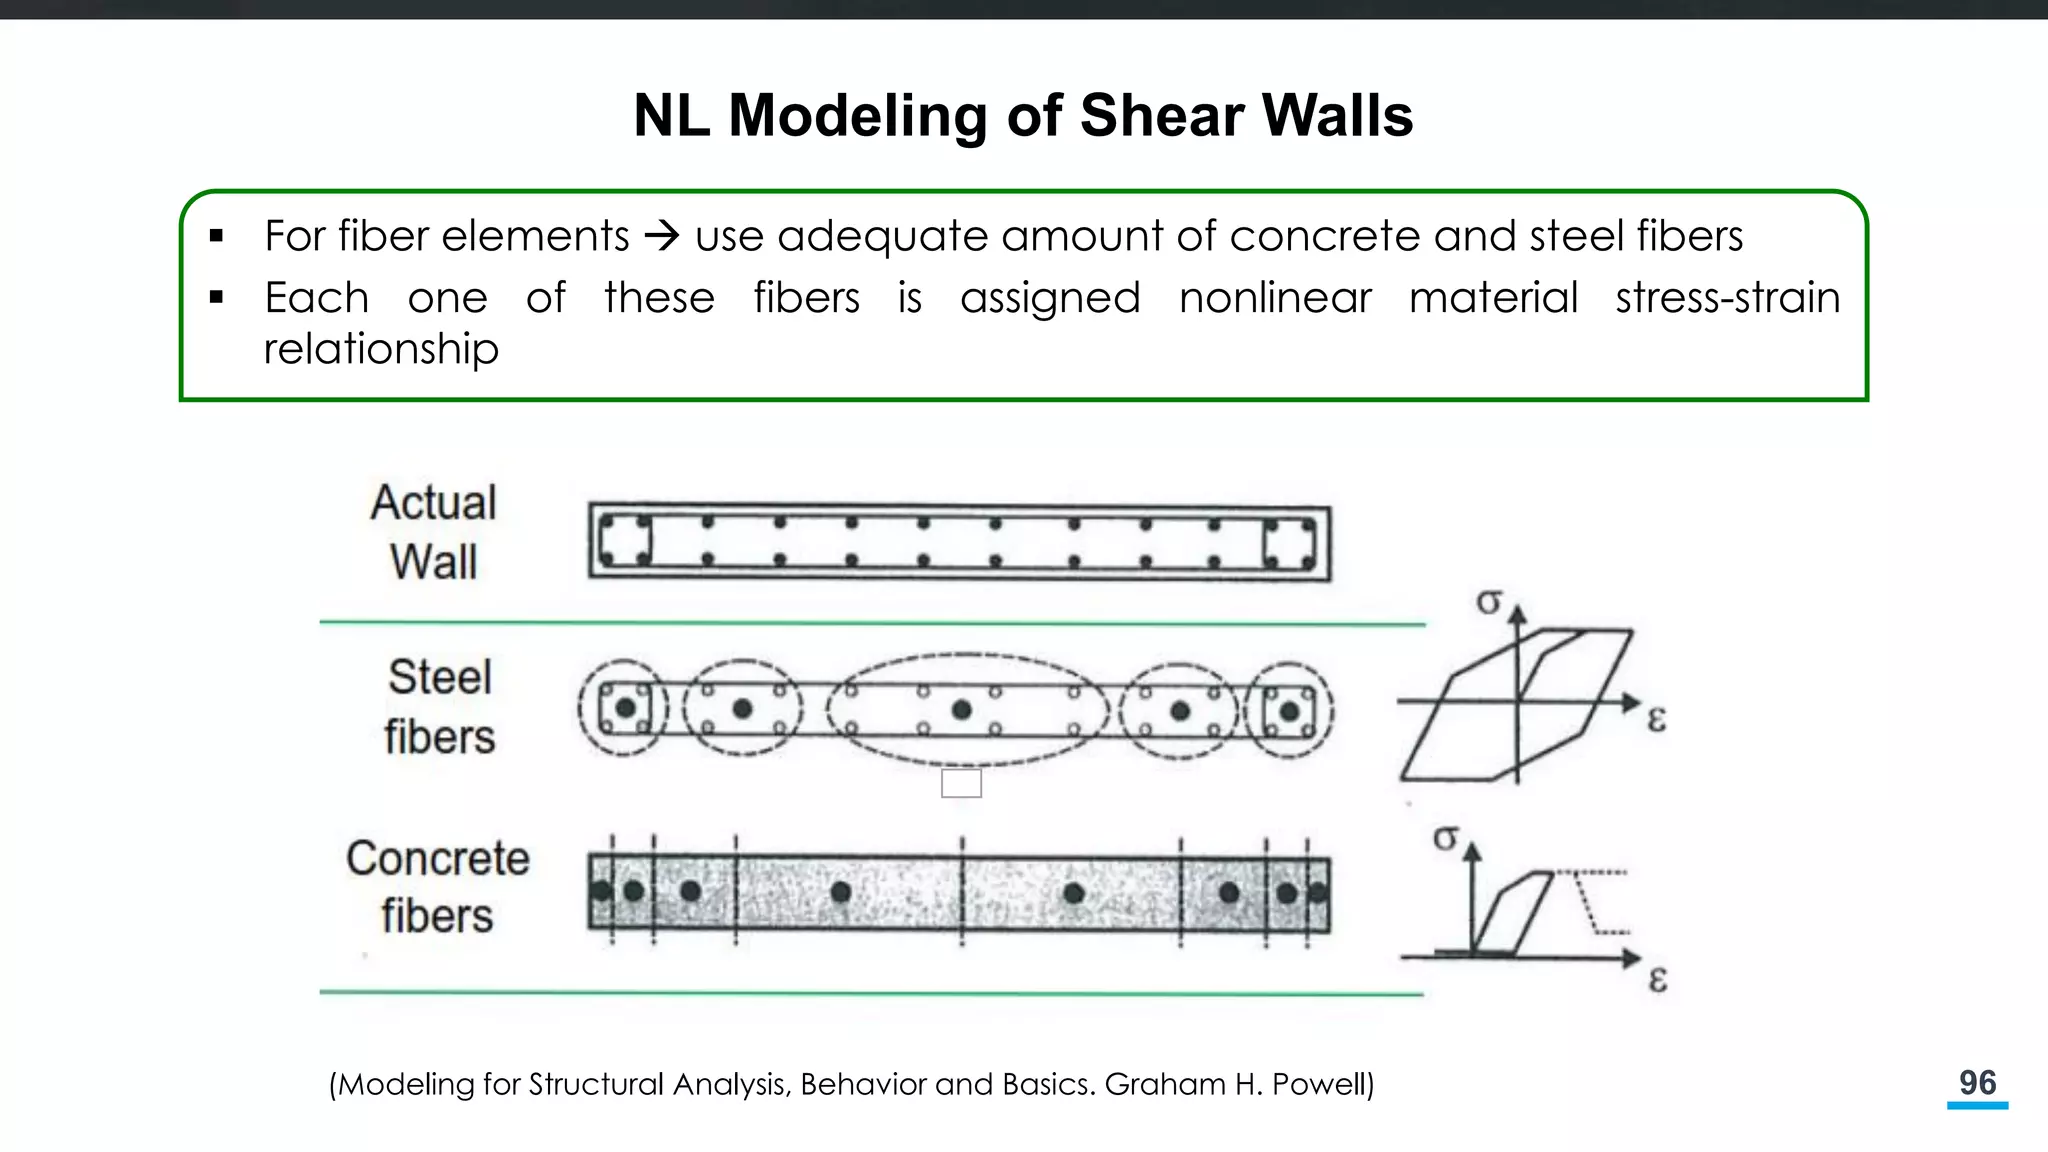
96
NL Modeling ofShear Walls
For fiber elements use adequate amount of concrete and steel fibers
Each one of these fibers is assigned nonlinear material stress-strain
relationship
(Modeling for Structural Analysis, Behavior and Basics. Graham H. Powell)
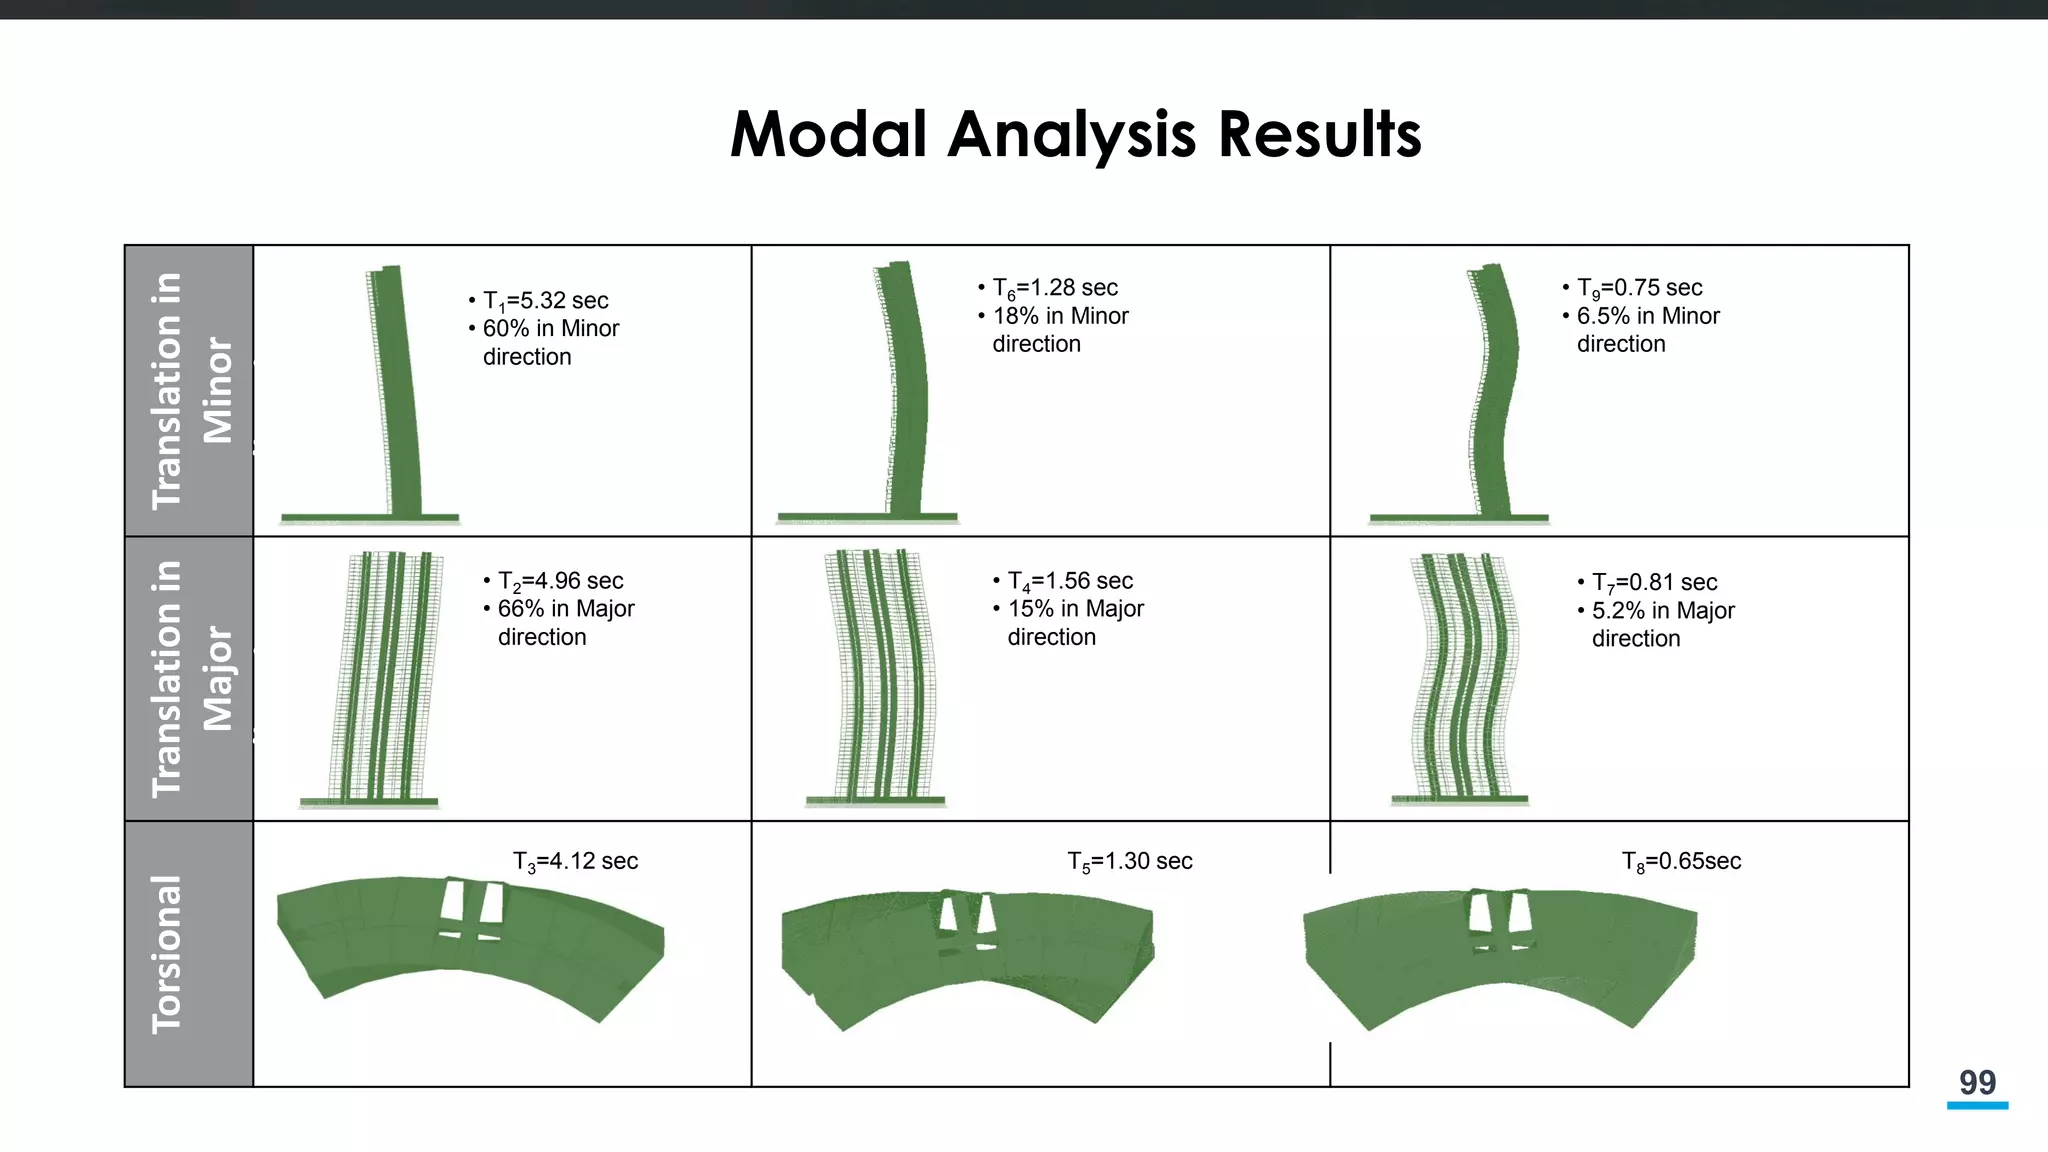
101
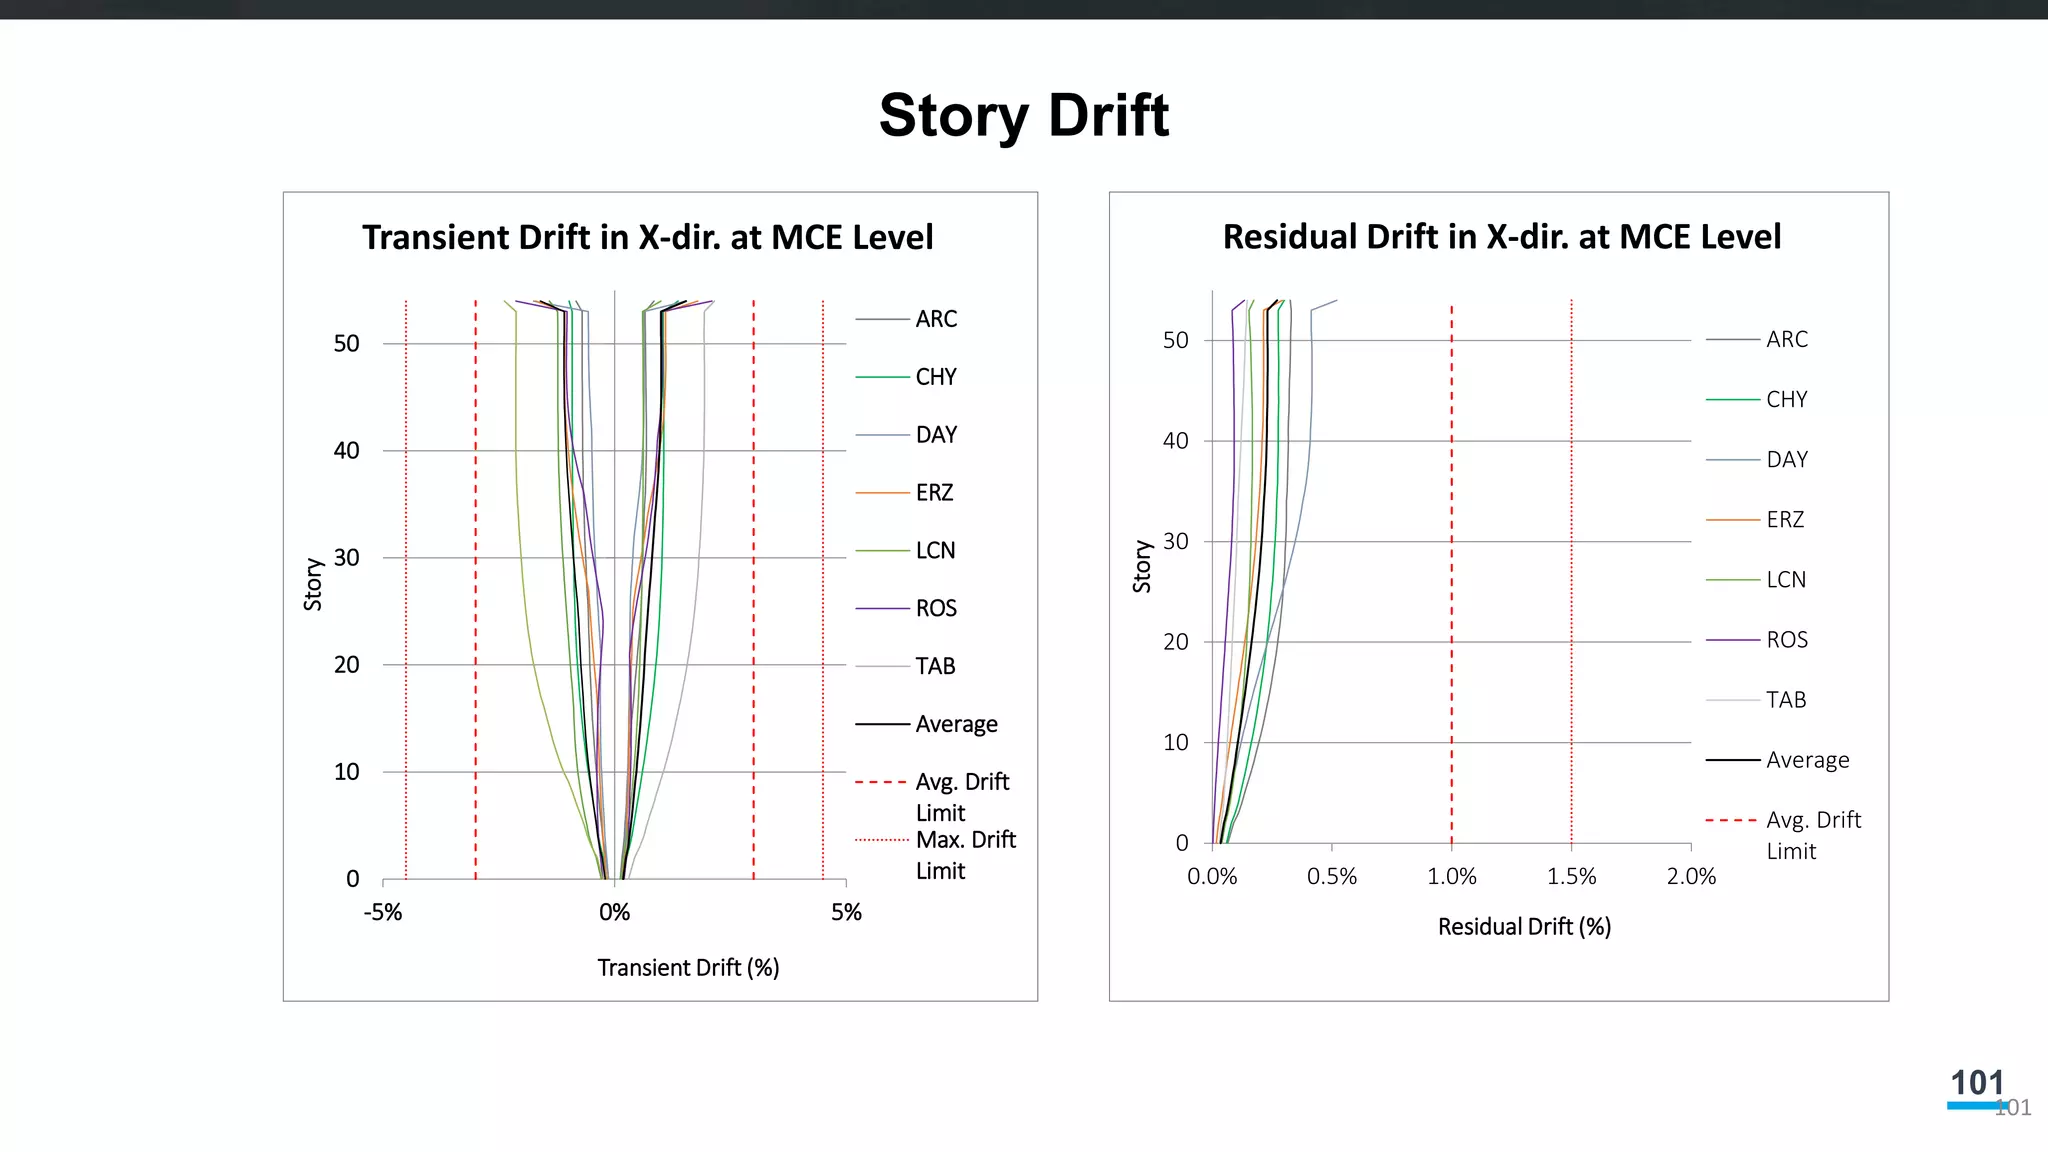
Story Drift
101
0
10
20
30
40
50
-5% 0%5%
Story
Transient Drift (%)
Transient Drift in X-dir. at MCE Level
ARC
CHY
DAY
ERZ
LCN
ROS
TAB
Average
Avg. Drift
Limit
Max. Drift
Limit
0
10
20
30
40
50
0.0% 0.5% 1.0% 1.5% 2.0%
Story
Residual Drift (%)
Residual Drift in X-dir. at MCE Level
ARC
CHY
DAY
ERZ
LCN
ROS
TAB
Average
Avg. Drift
Limit
102.
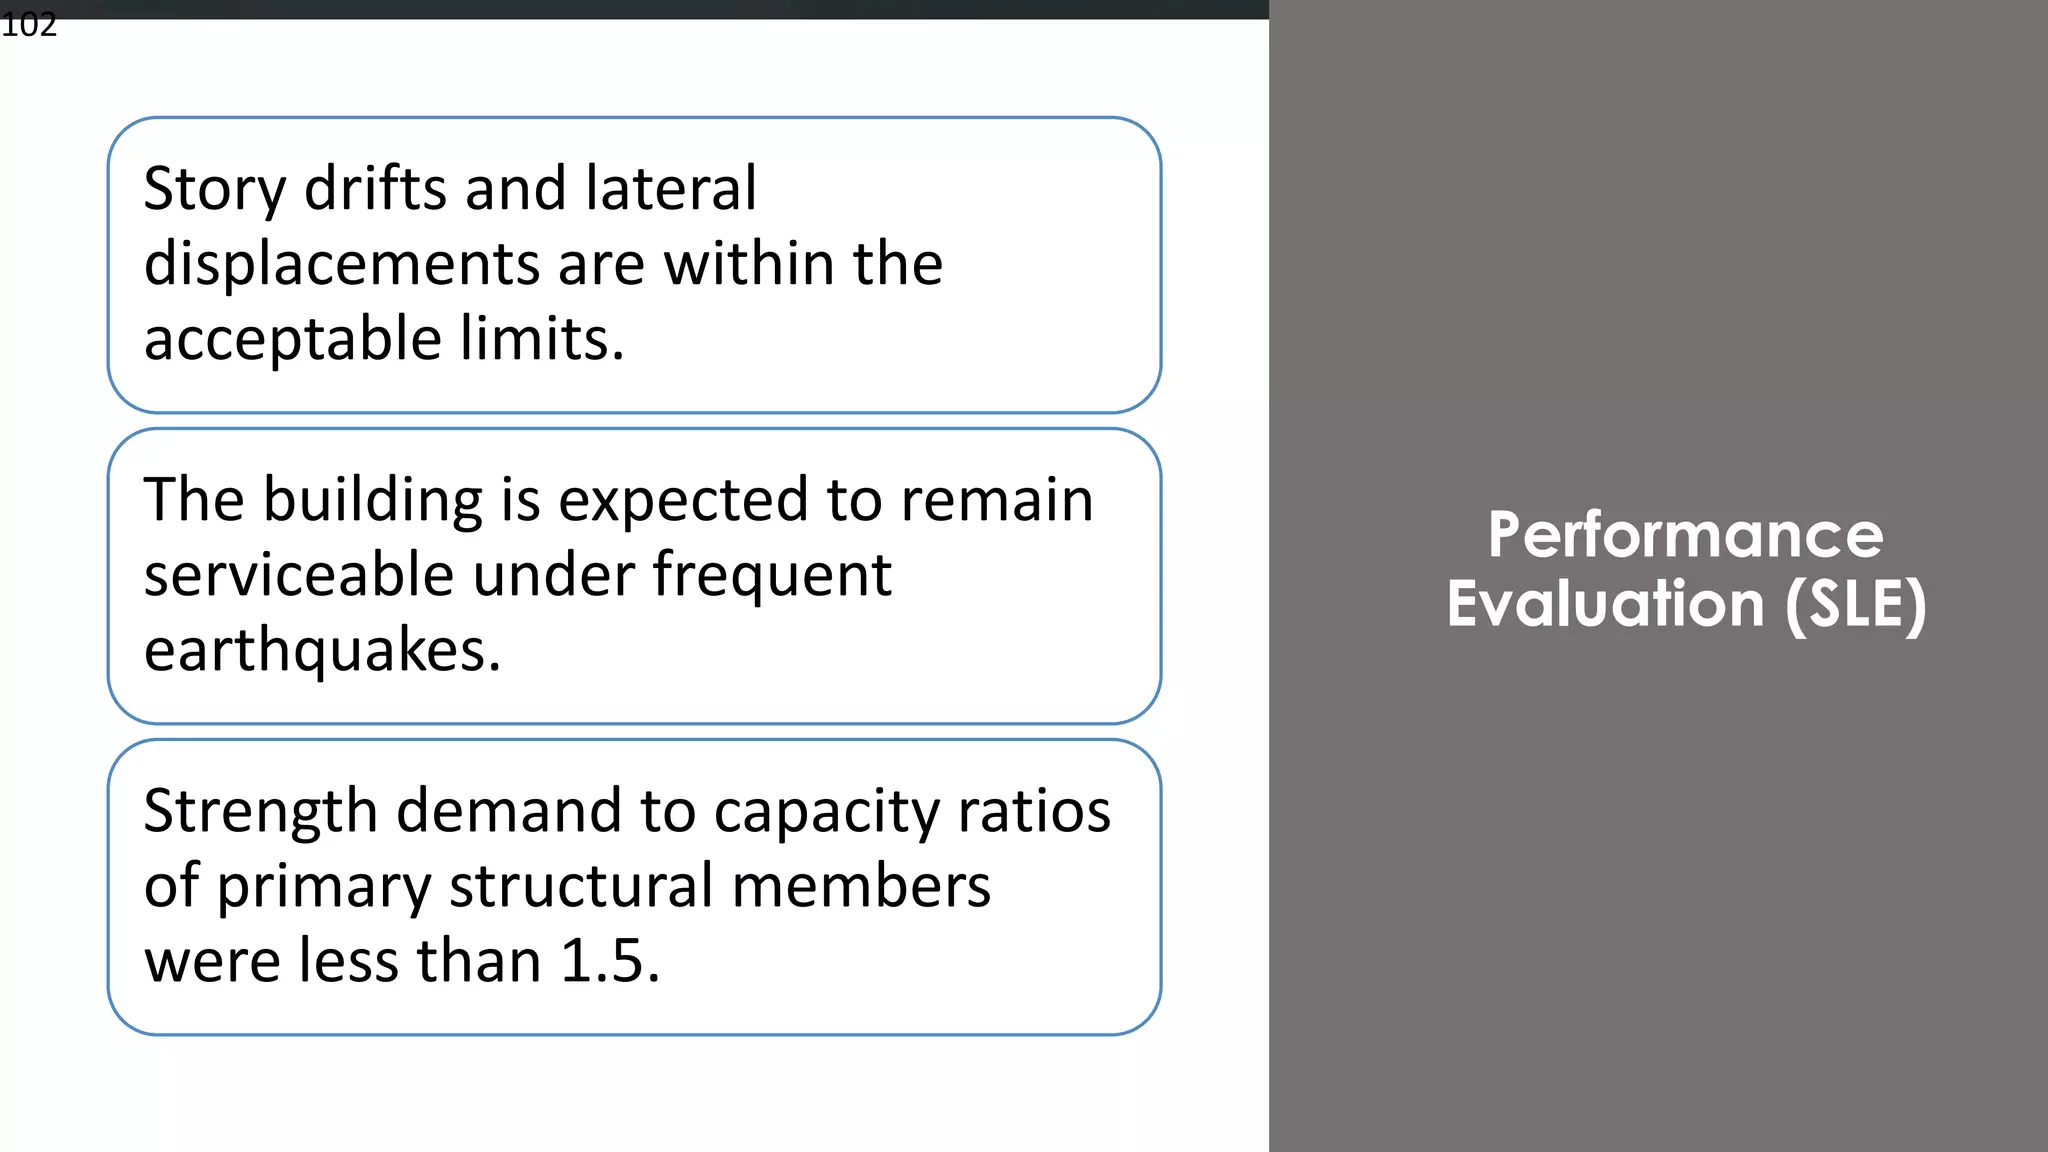
102
Story drifts andlateral
displacements are within the
acceptable limits.
The building is expected to remain
serviceable under frequent
earthquakes.
Strength demand to capacity ratios
of primary structural members
were less than 1.5.
Performance
Evaluation (SLE)
102
108
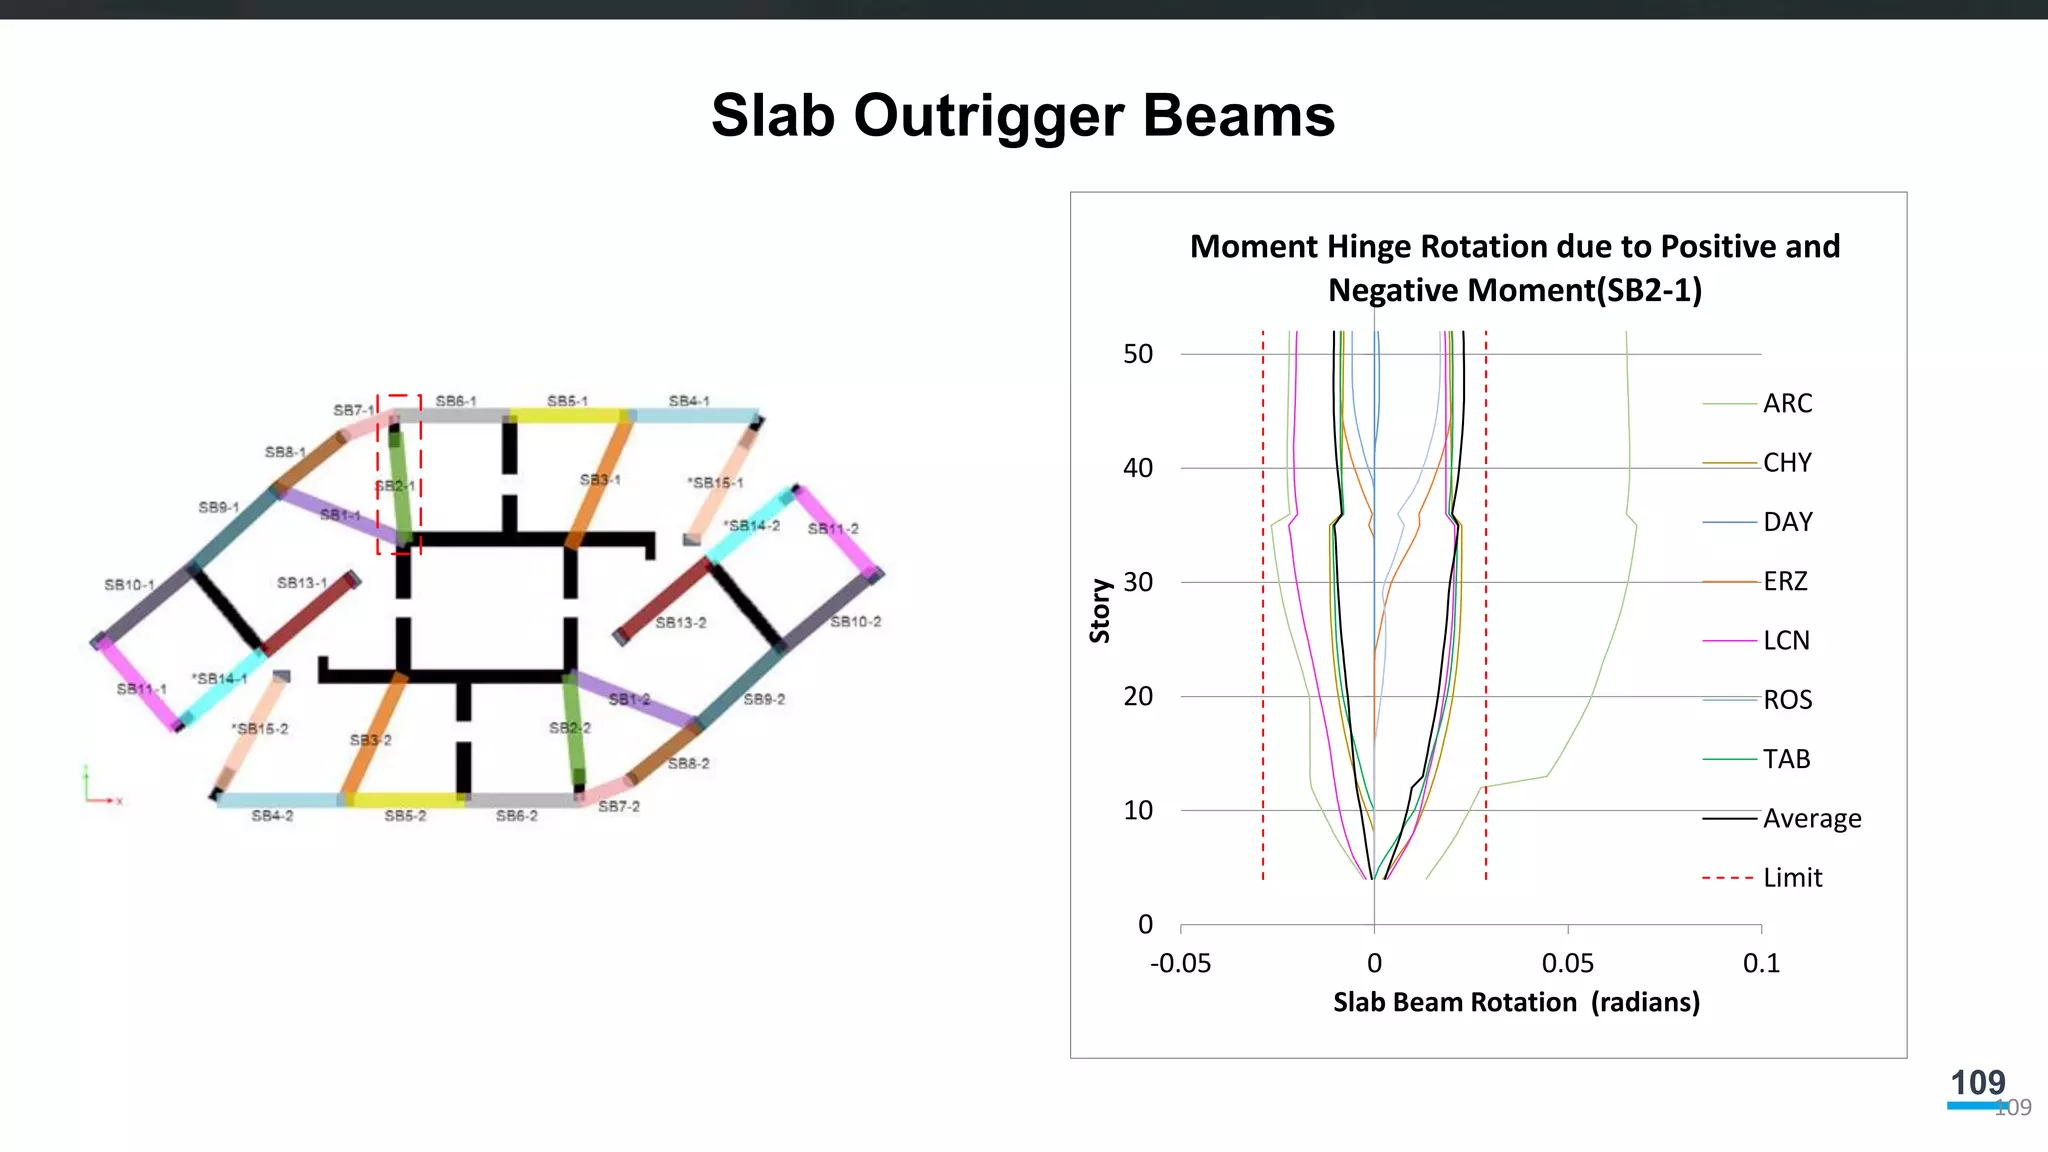
Slab Outrigger Beams
•Post-tensioned slab was designed as “nonparticipating” system (not part of the
lateral load resisting system) to resist the gravity loads under the expected lateral
displacements.
• Checked by two methods to reduce the likelihood of punching shear failure under
seismic loading.
• Inelastic rotation of the slab outrigger beams was checked in accordance with ASCE 41.
• Story drift with respect to gravity load punching shear D/C ratio was checked in accordance
with ACI 318-08 Sect. 21.13.6.
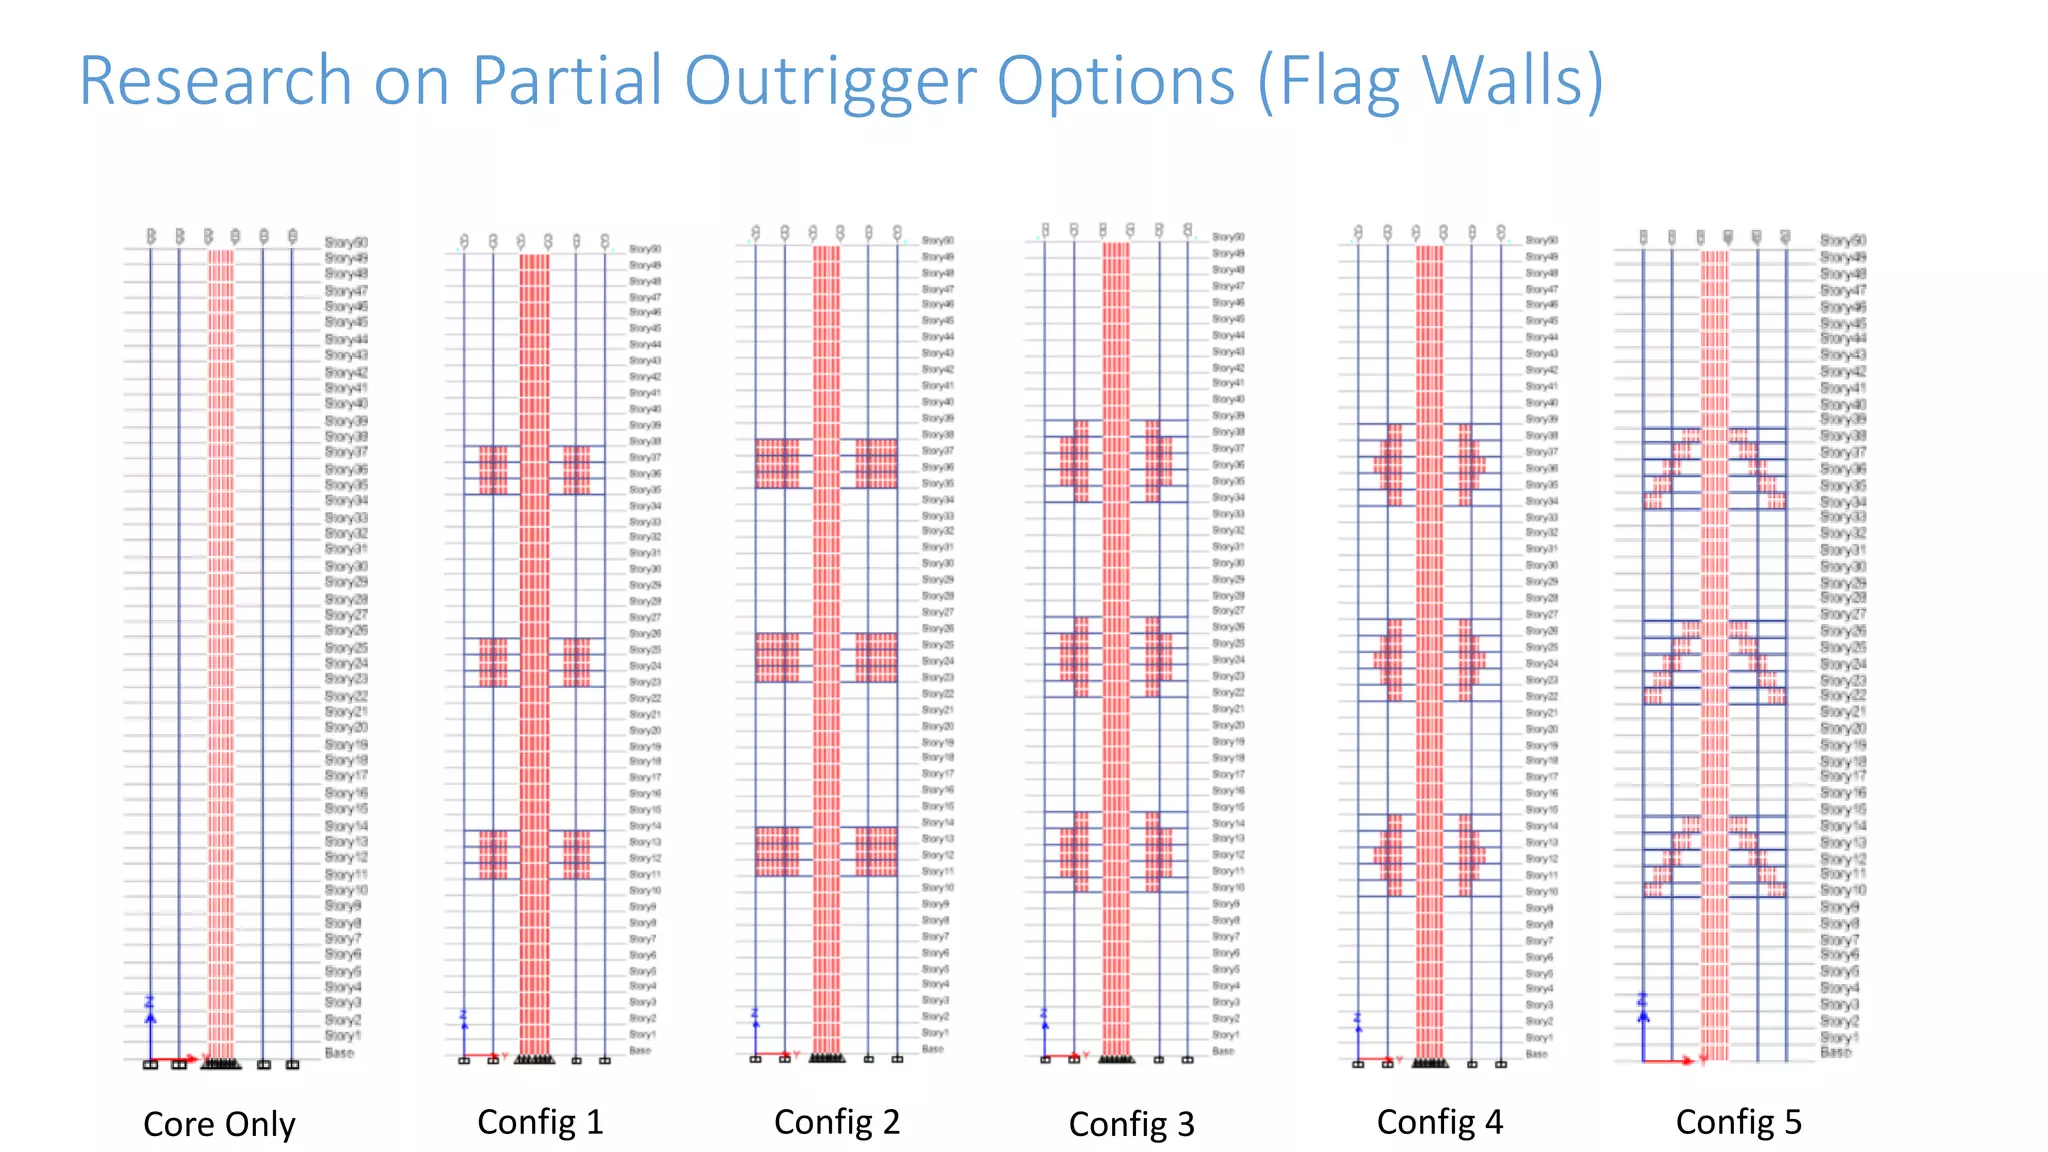
110
Core Only Config1 Config 2 Config 3 Config 4 Config 5
Research on Partial Outrigger Options (Flag Walls)
111.
111
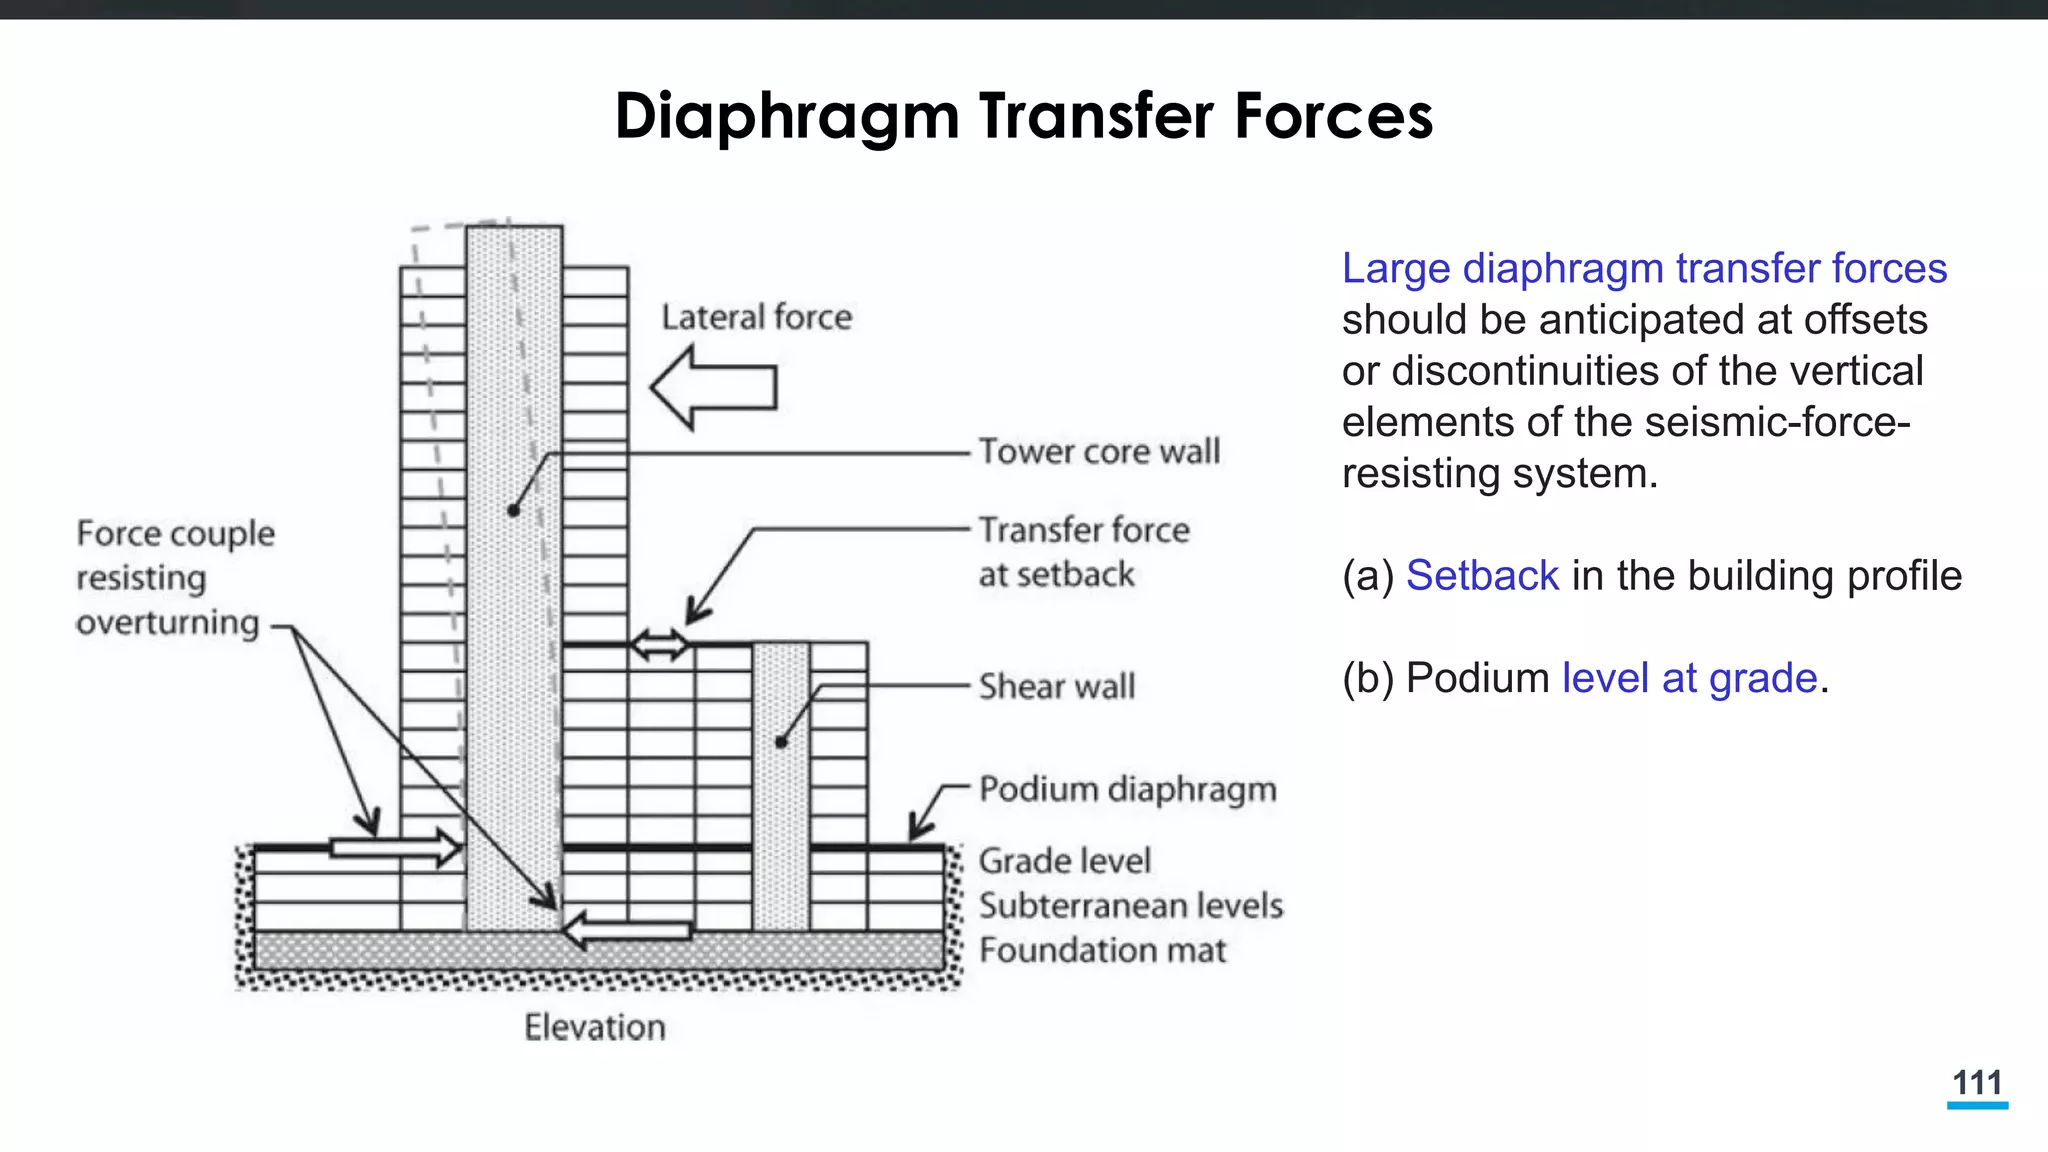
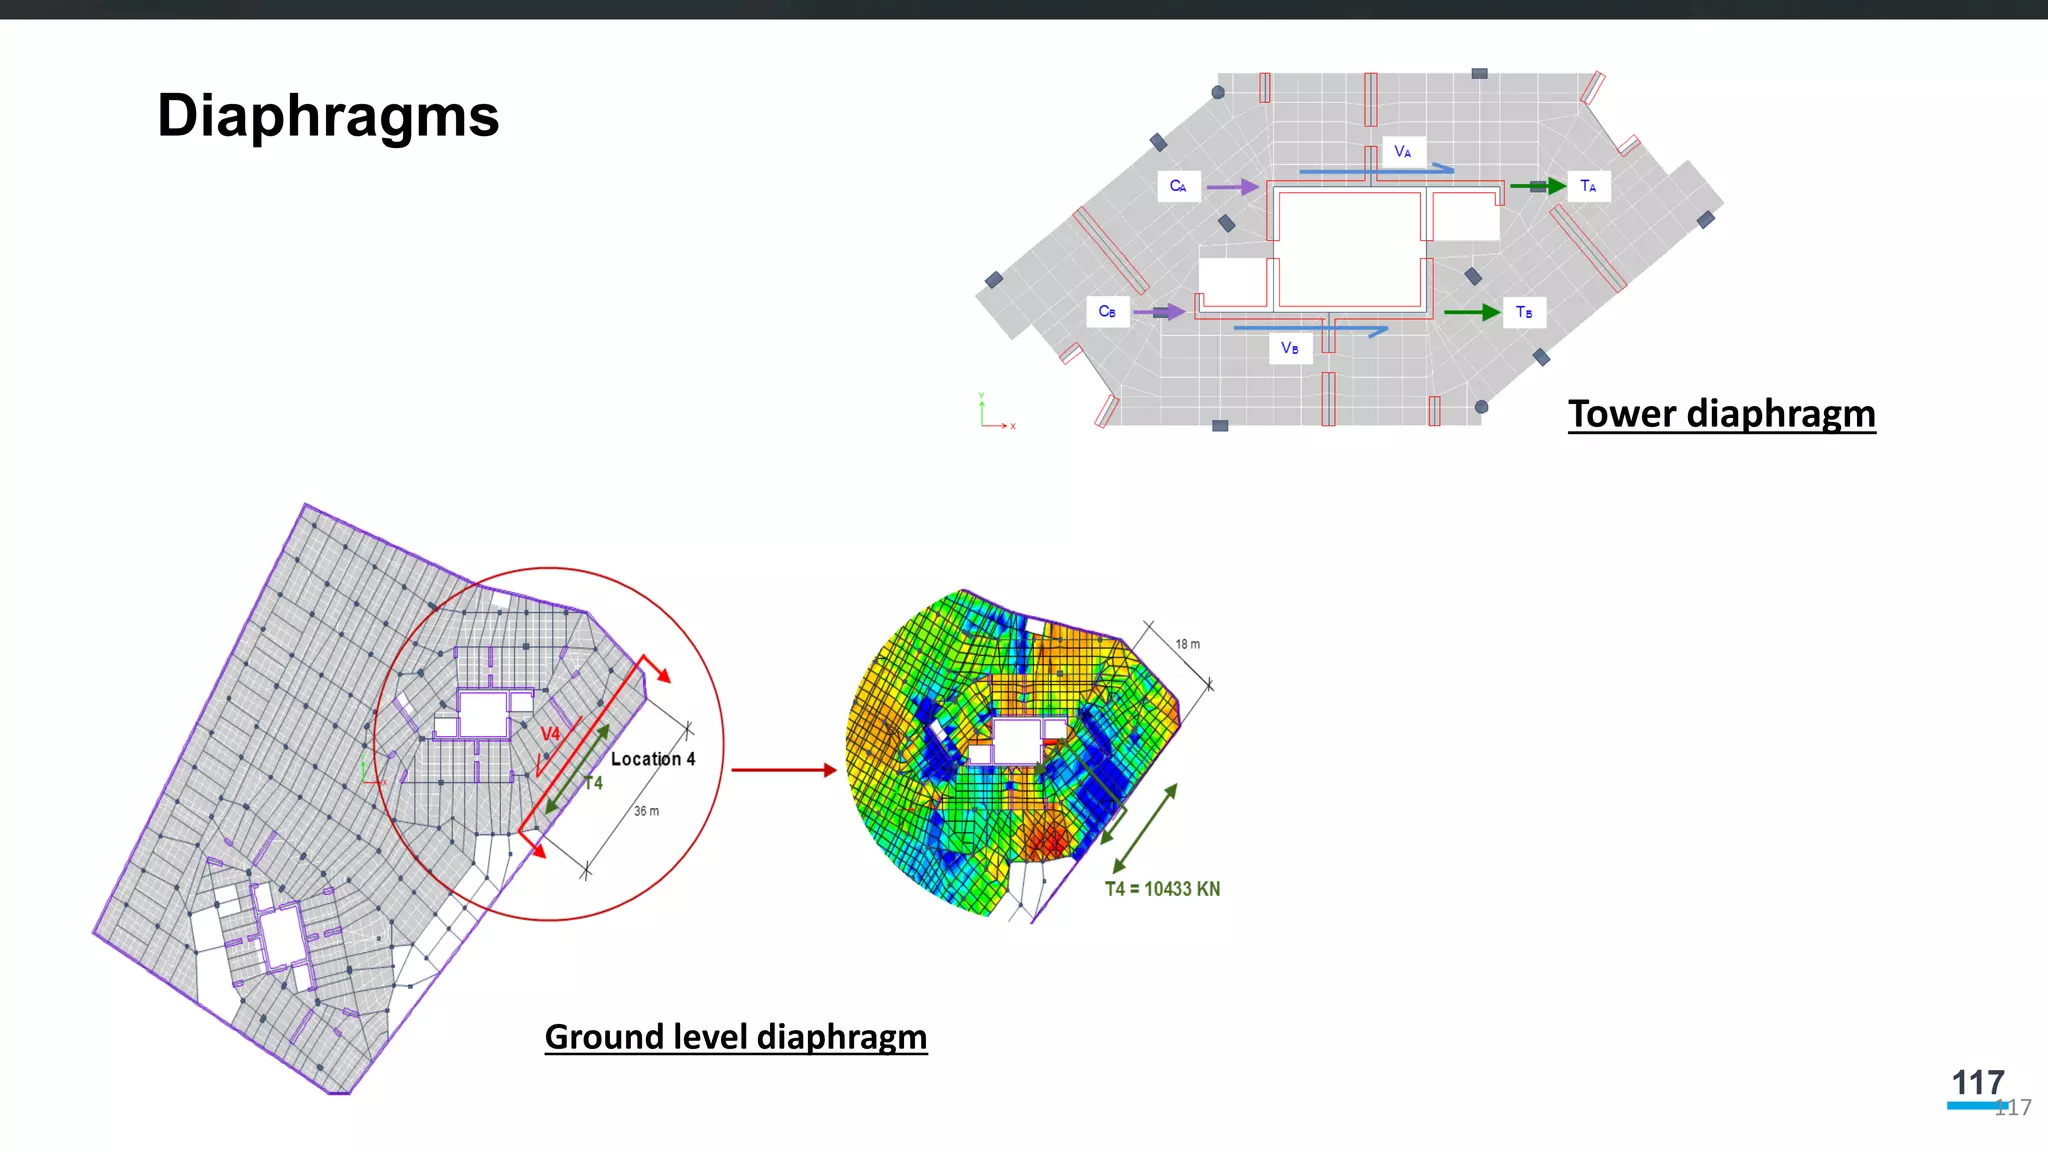
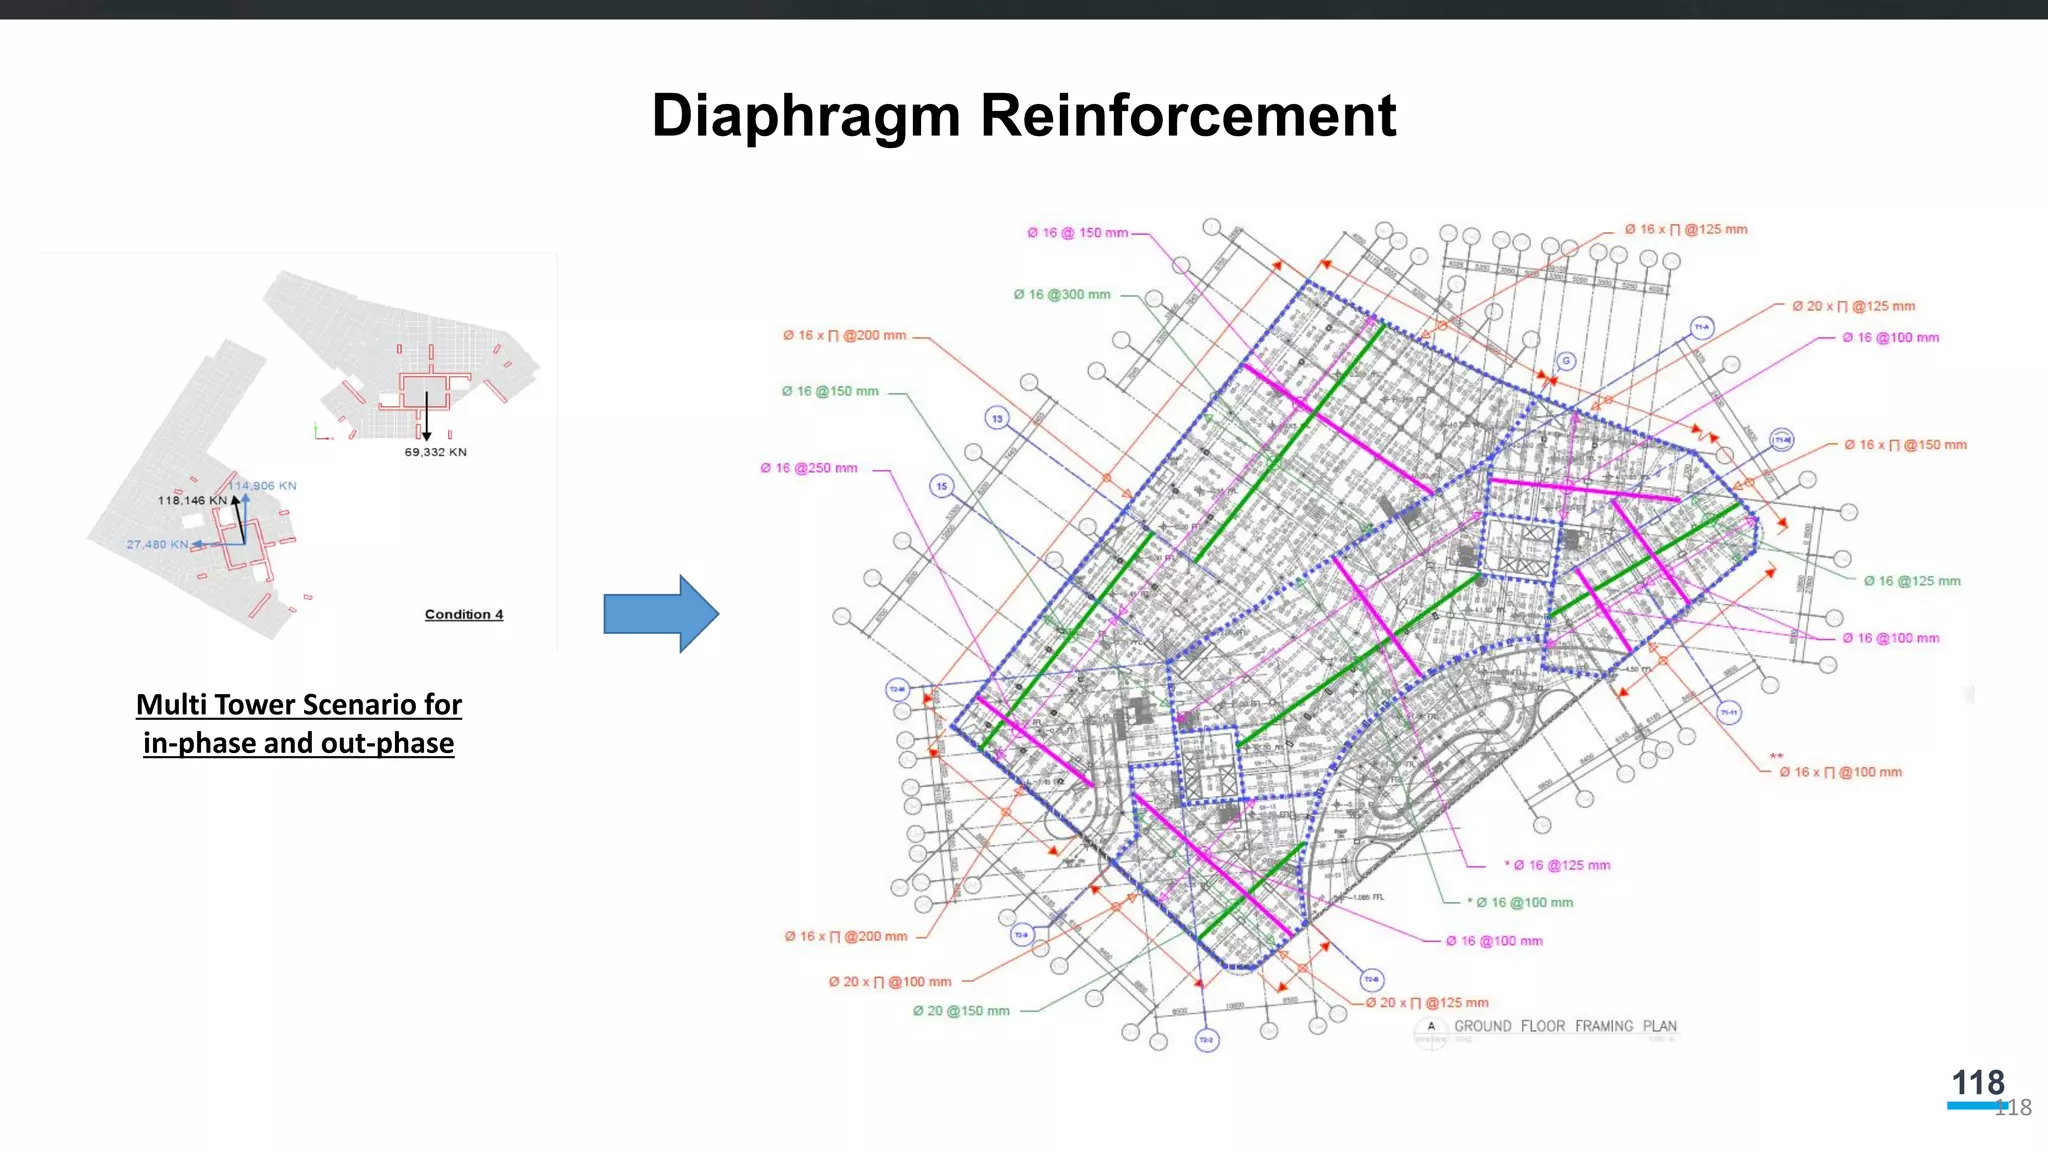
Diaphragm Transfer Forces
Largediaphragm transfer forces
should be anticipated at offsets
or discontinuities of the vertical
elements of the seismic-force-
resisting system.
(a) Setback in the building profile
(b) Podium level at grade.
114
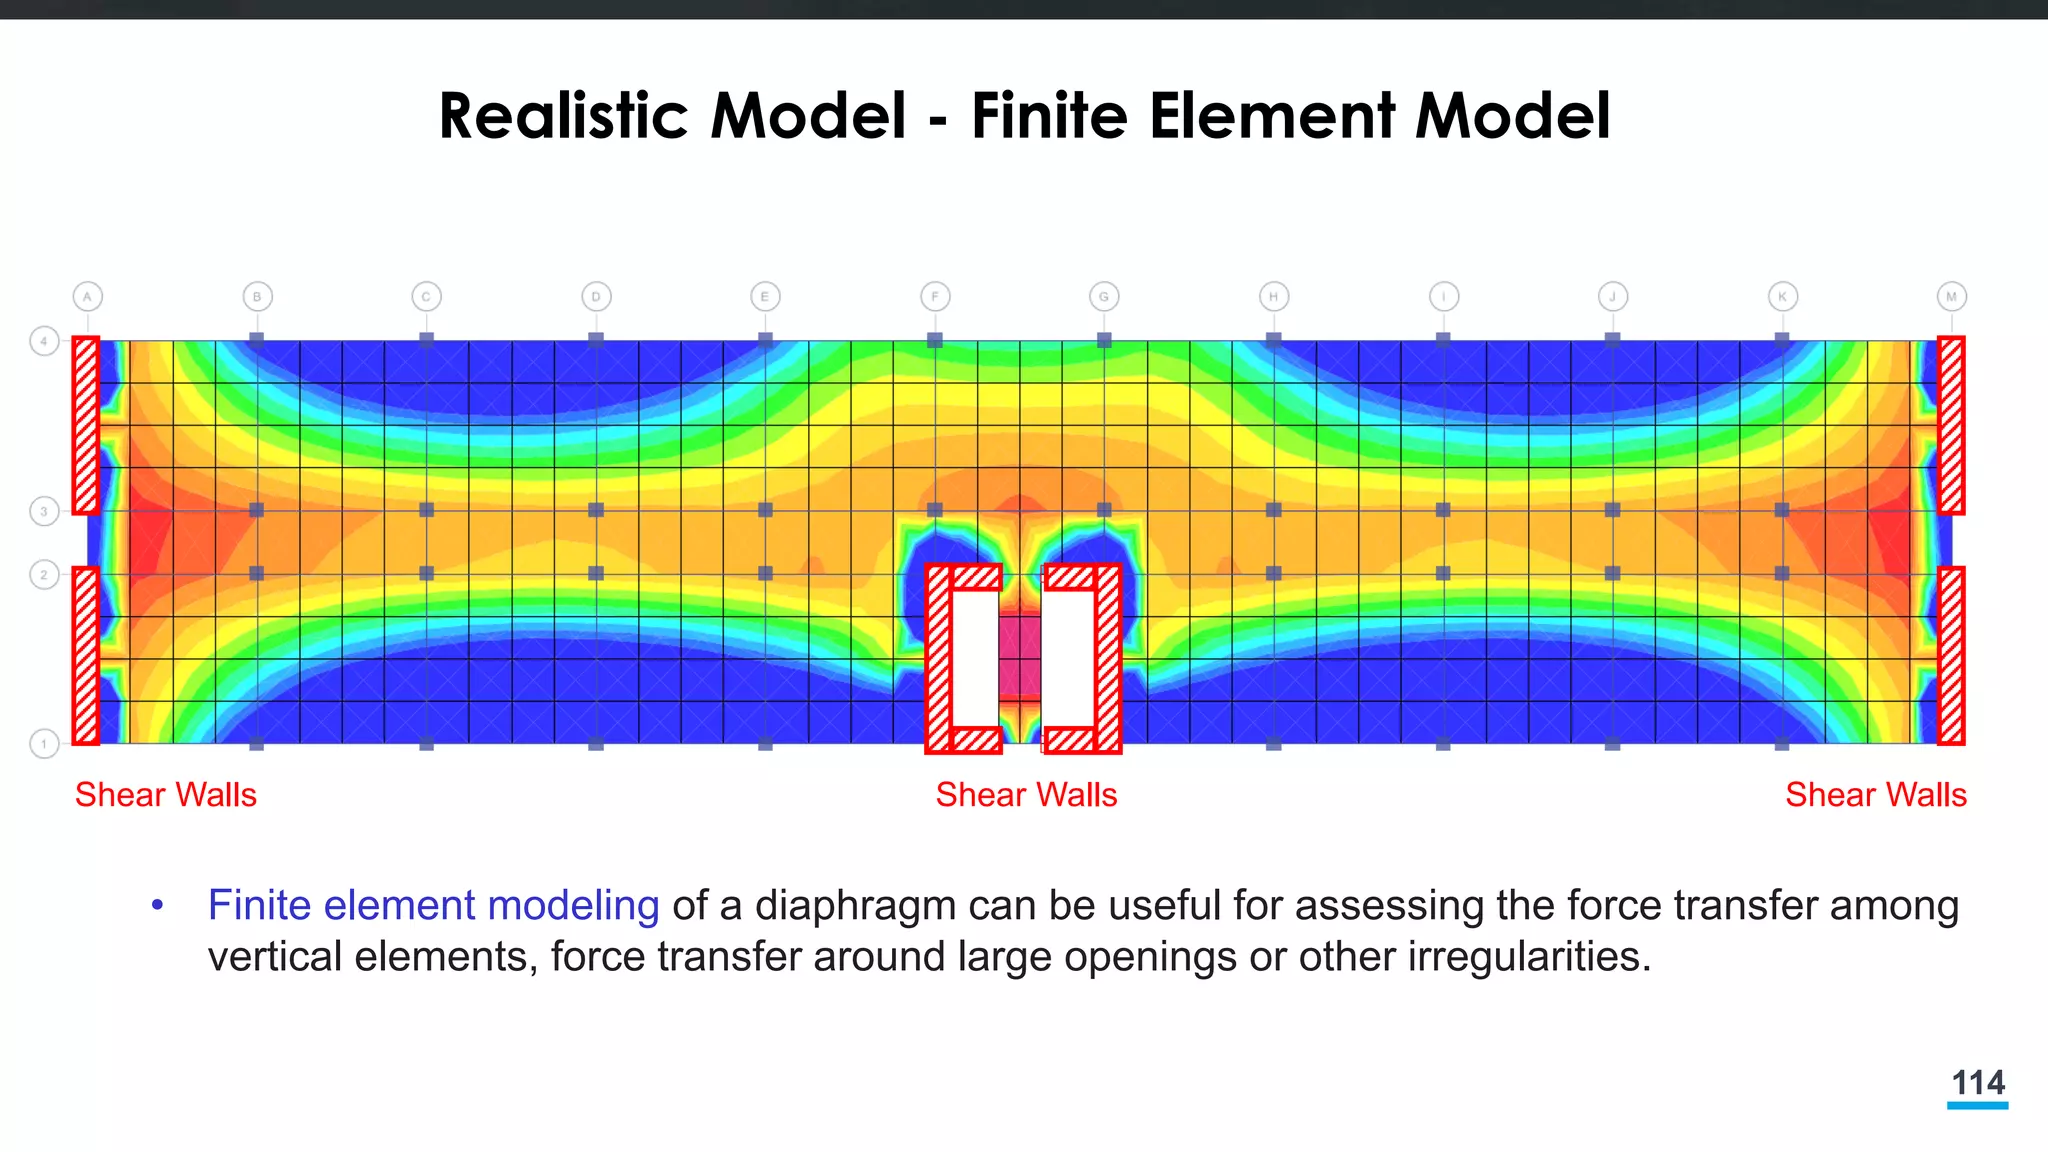
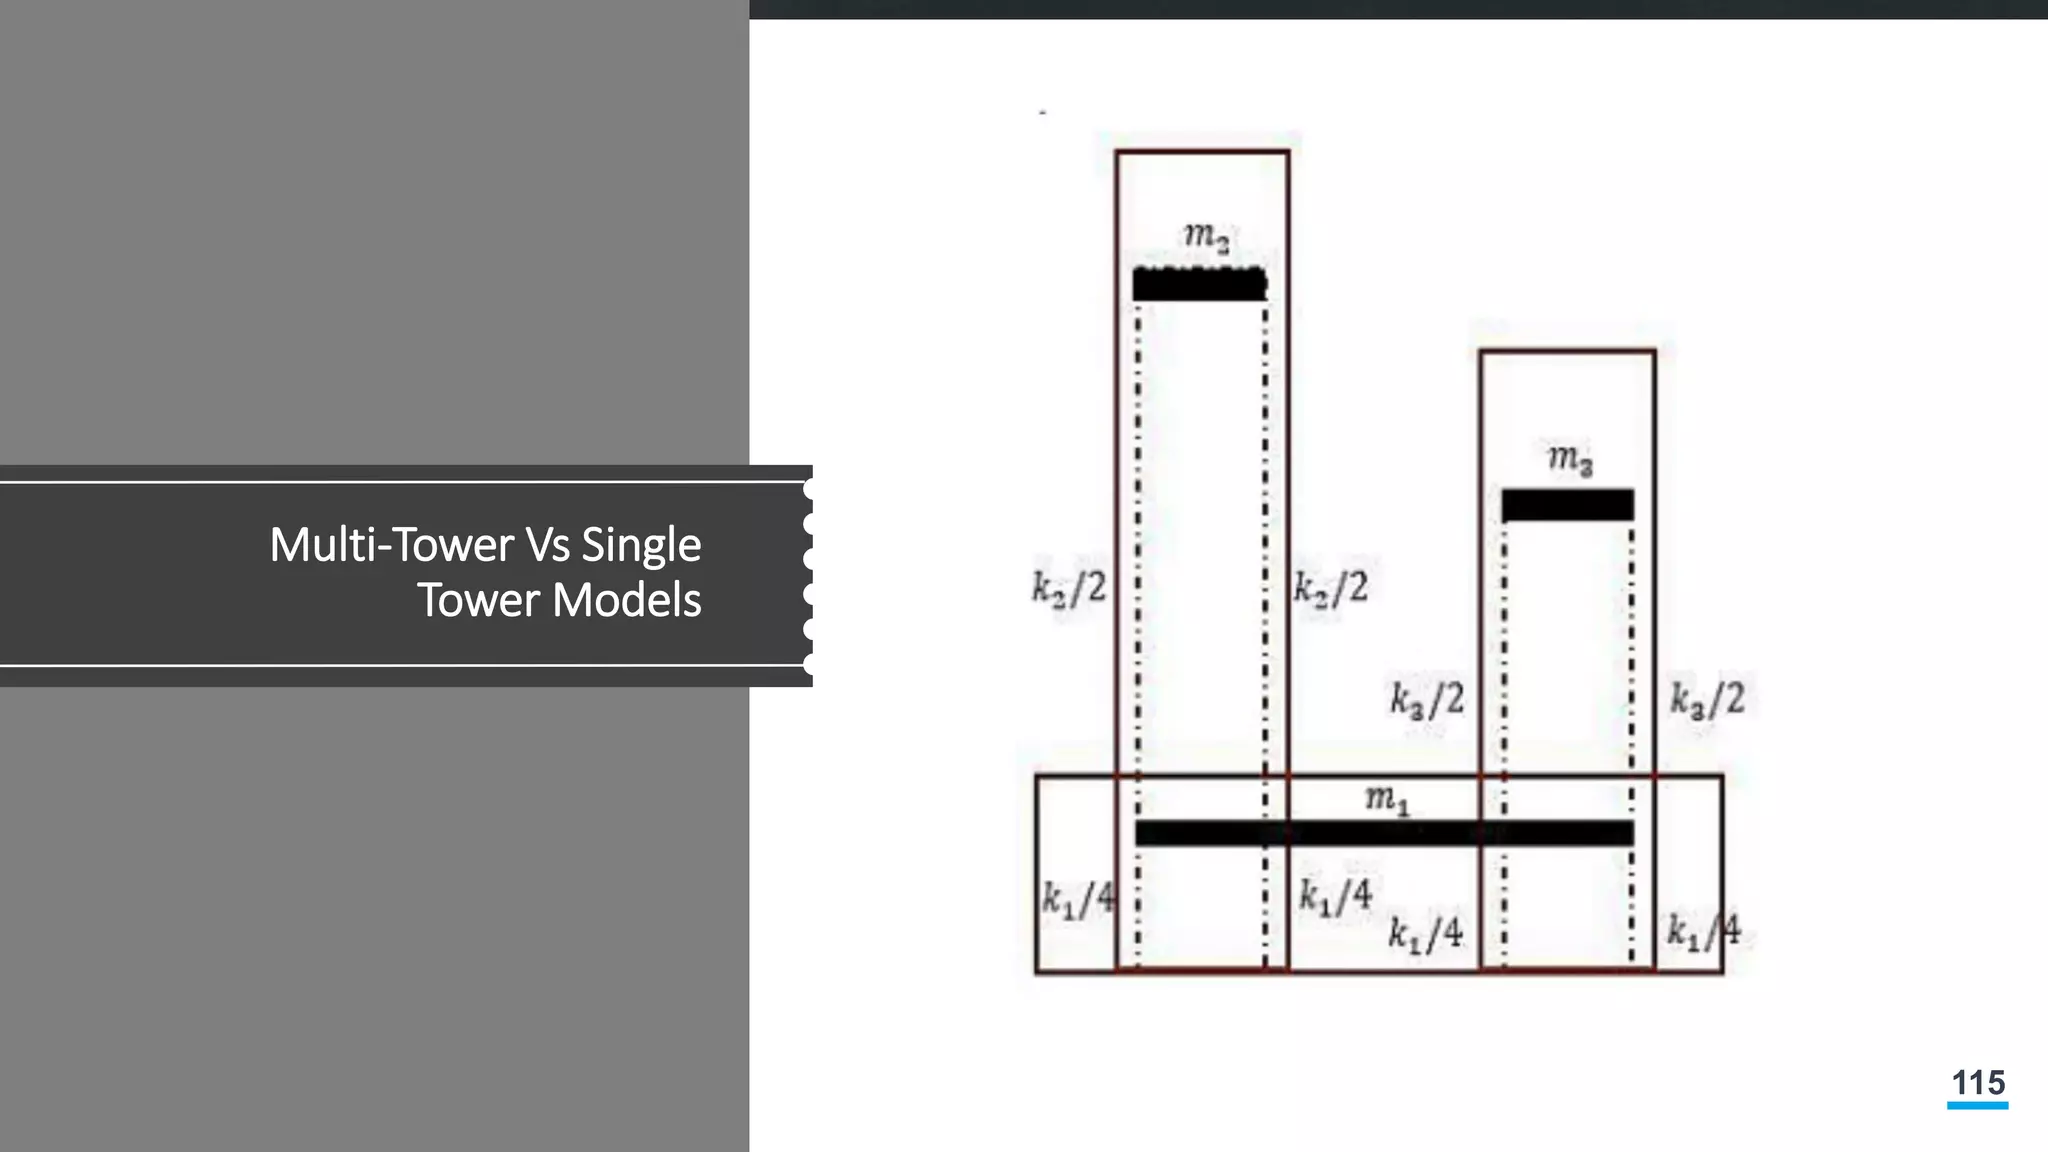
Realistic Model -Finite Element Model
• Finite element modeling of a diaphragm can be useful for assessing the force transfer among
vertical elements, force transfer around large openings or other irregularities.
Shear WallsShear Walls Shear Walls
116
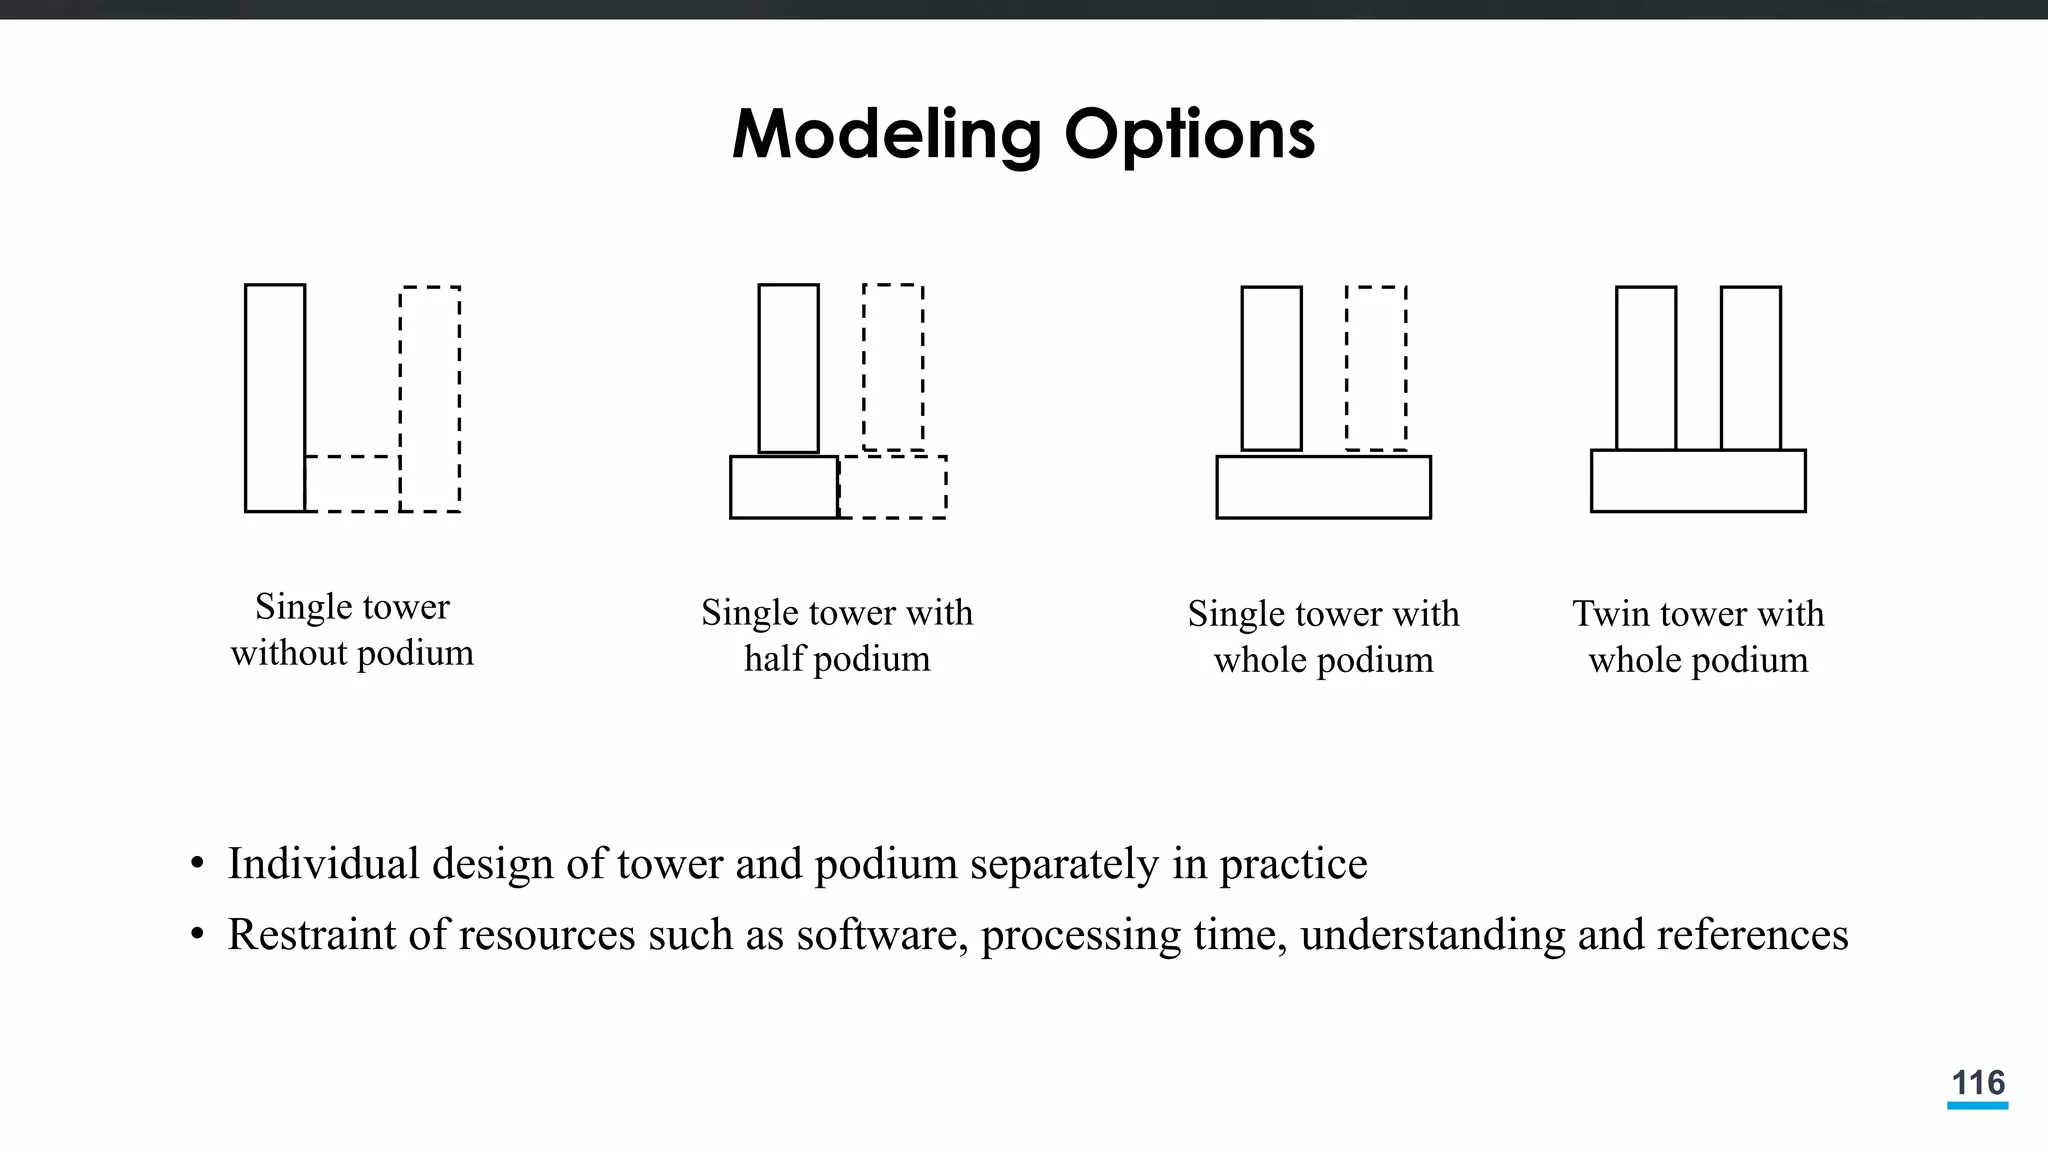
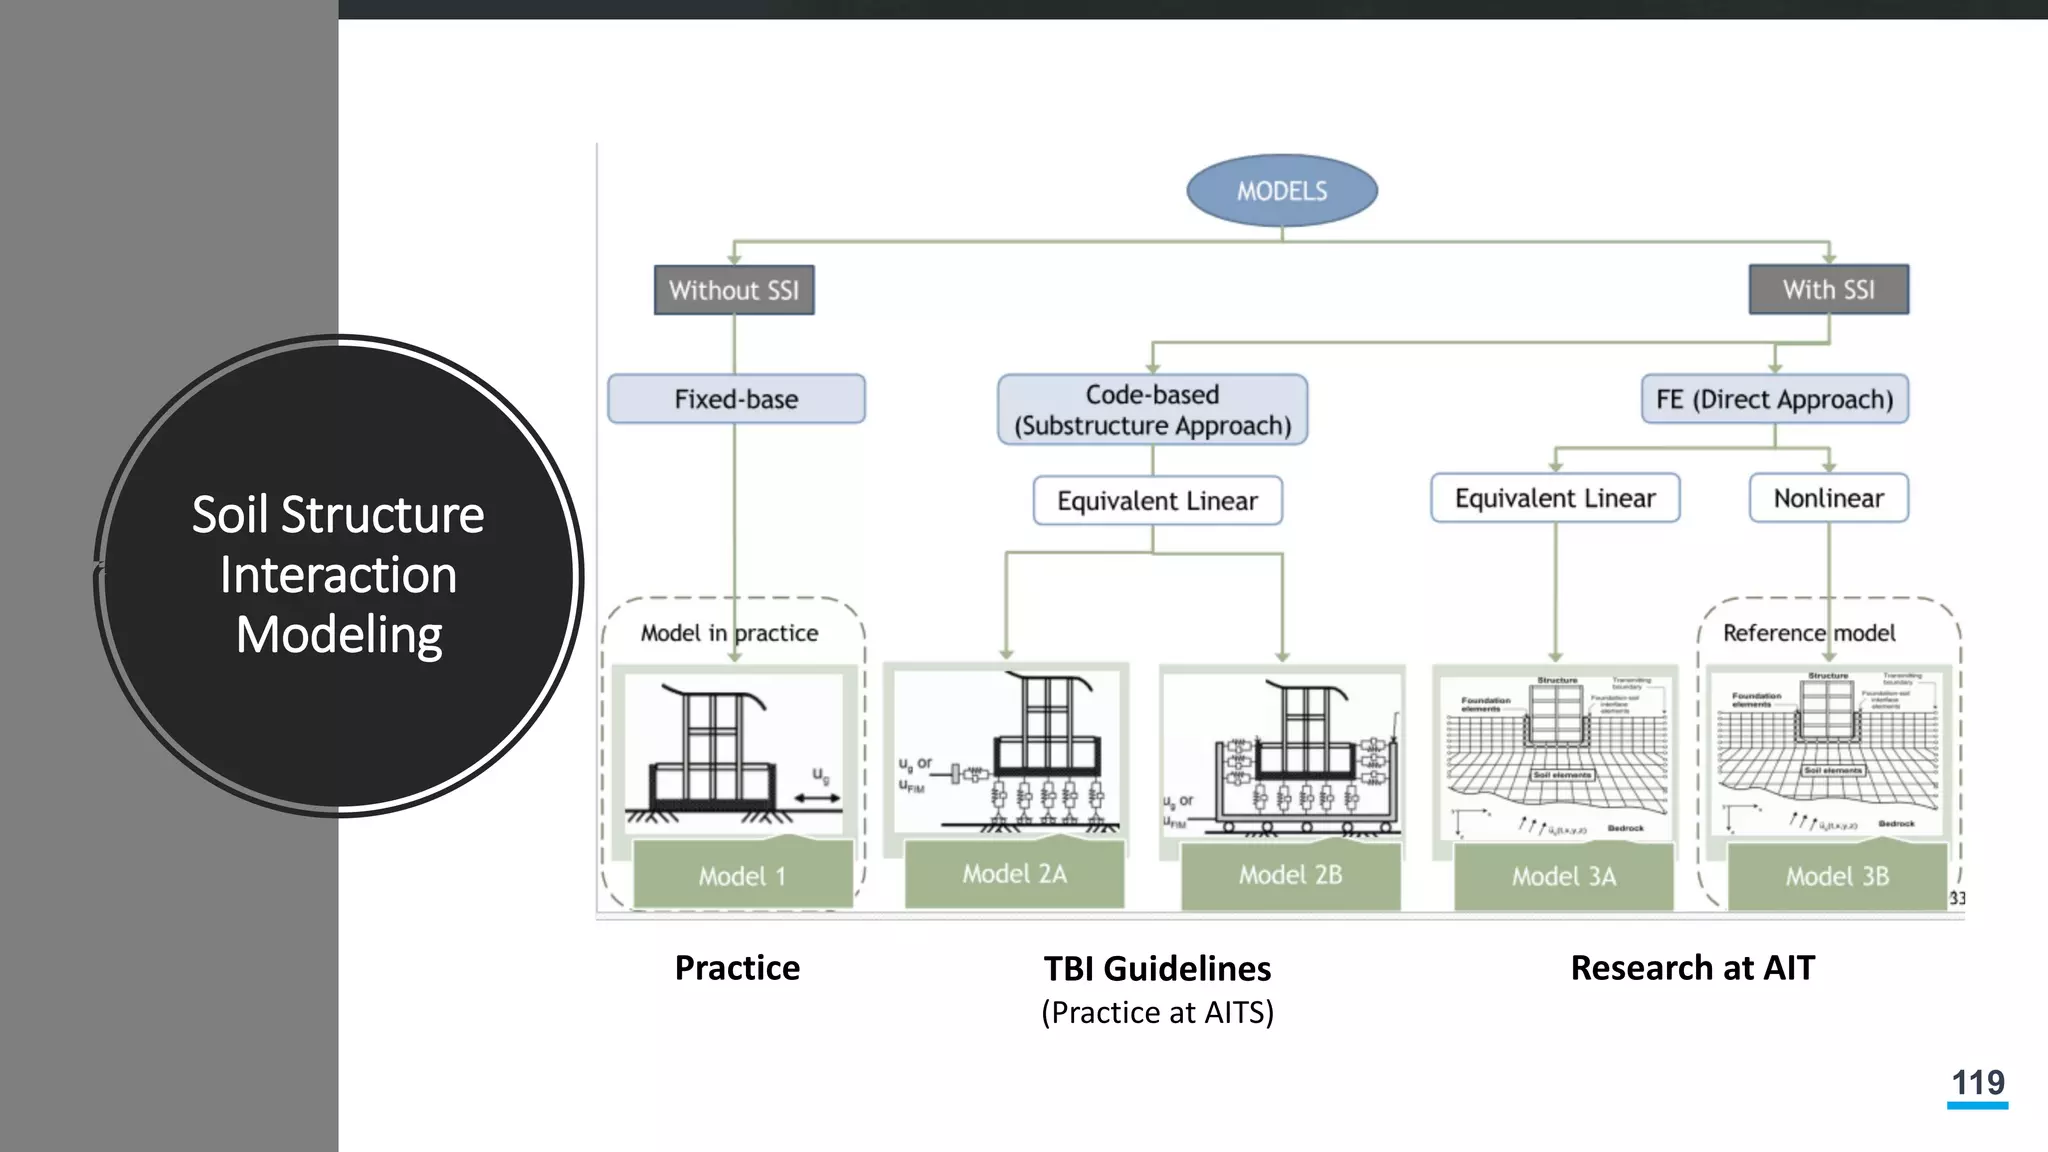
Modeling Options
• Individualdesign of tower and podium separately in practice
• Restraint of resources such as software, processing time, understanding and references
Single tower
without podium
Single tower with
half podium
Single tower with
whole podium
Twin tower with
whole podium
121
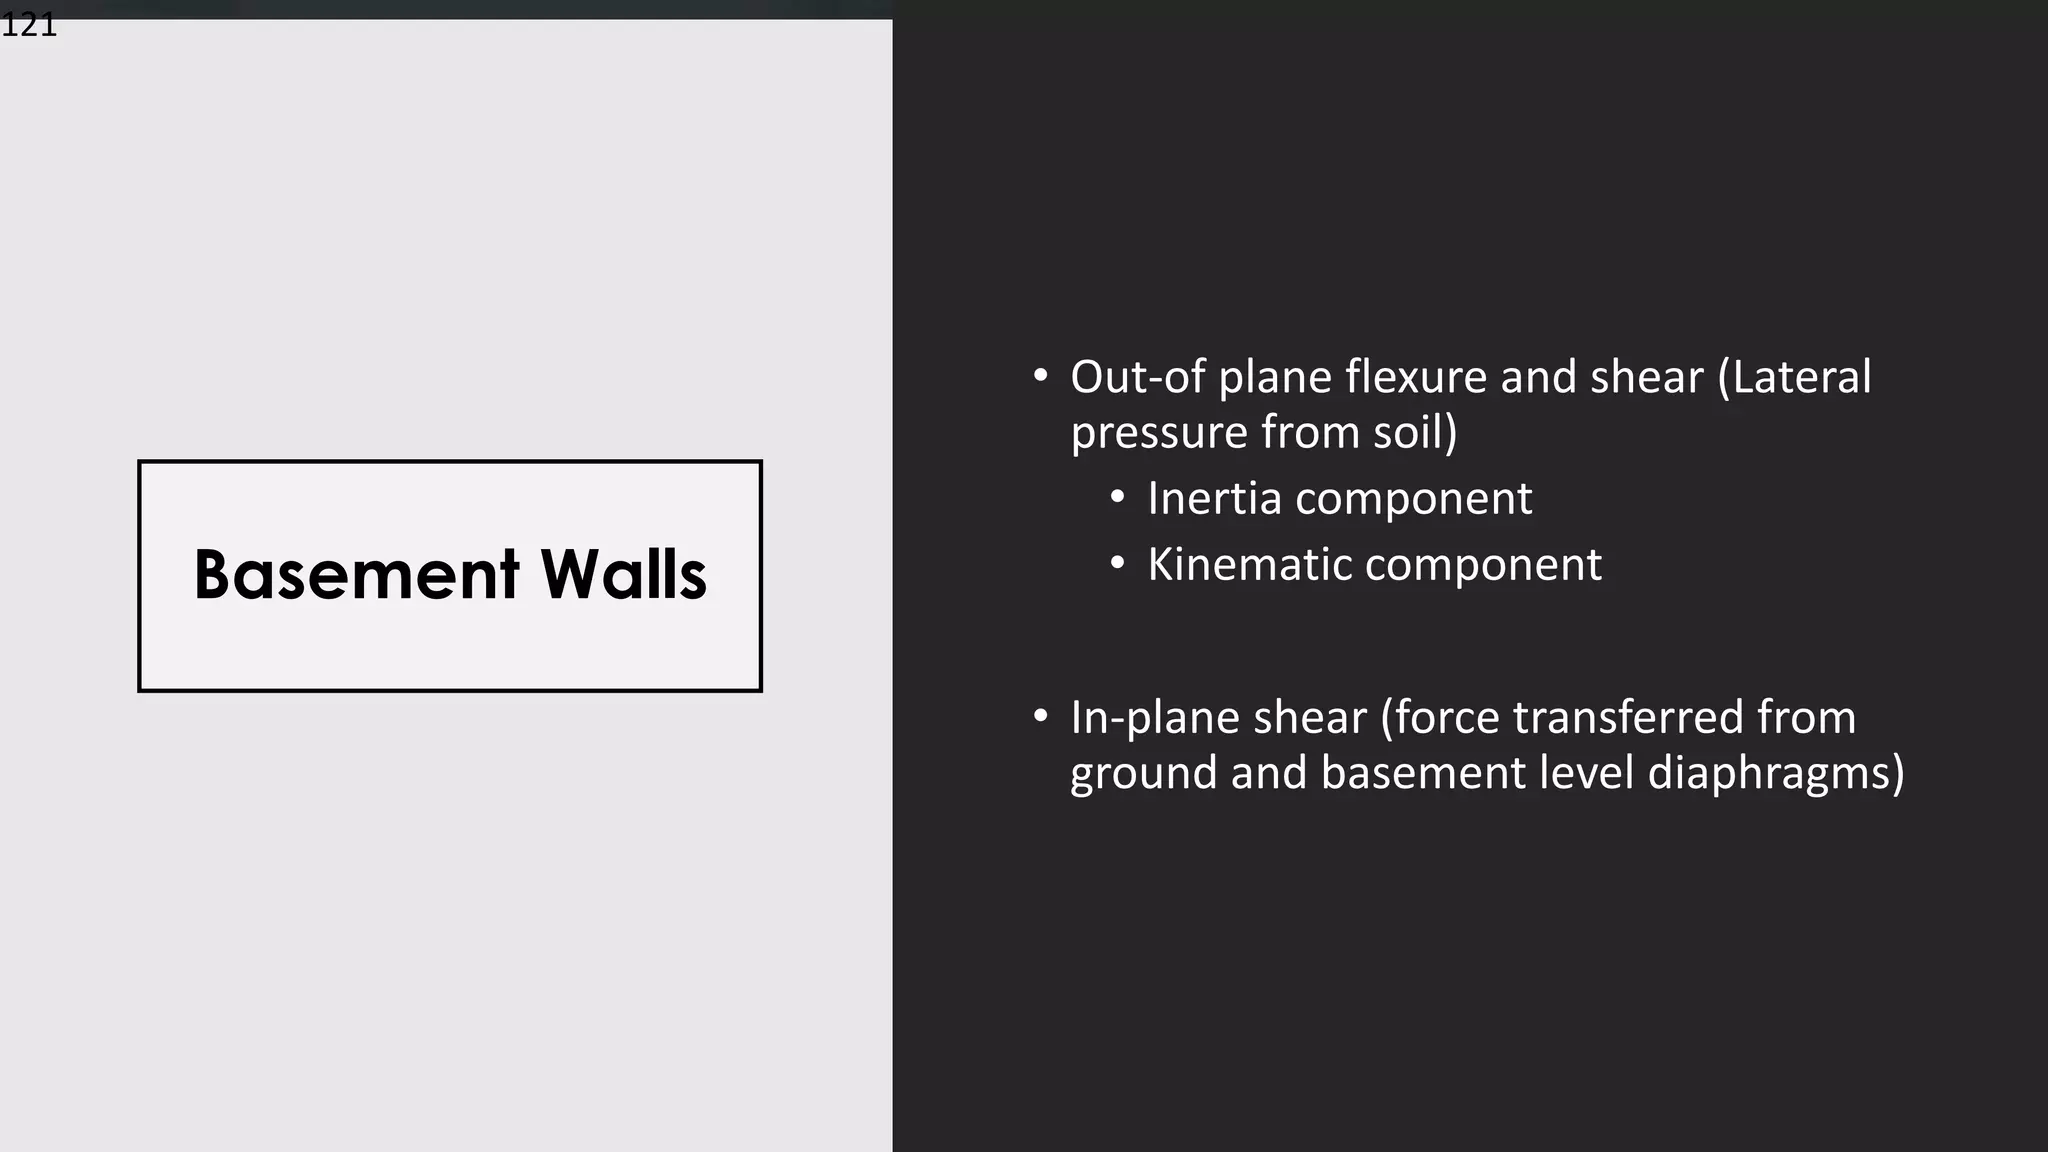
• Out-of planeflexure and shear (Lateral
pressure from soil)
• Inertia component
• Kinematic component
• In-plane shear (force transferred from
ground and basement level diaphragms)
Basement Walls
121
122.
122
How to Workwith PBD
122
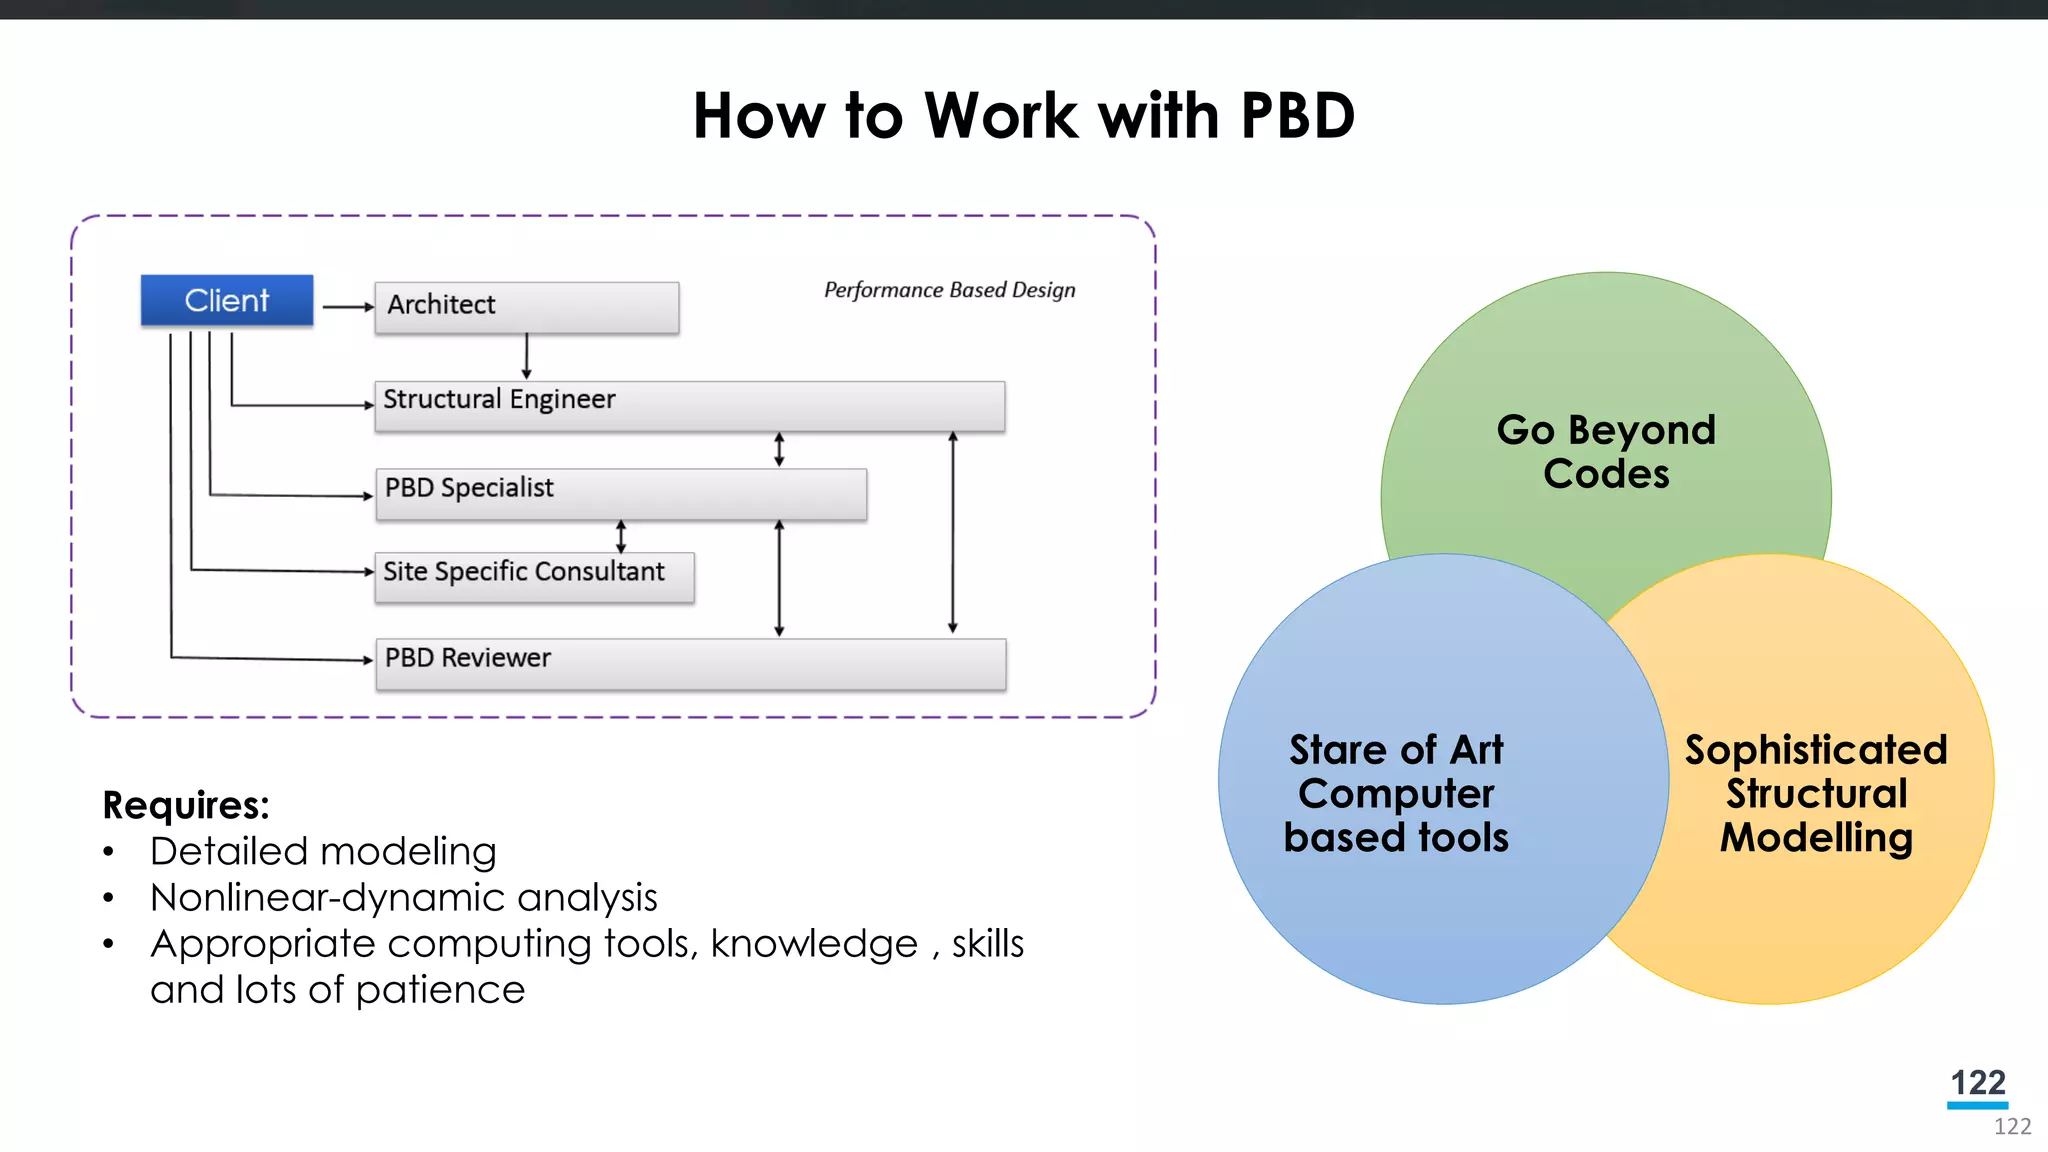
Requires:
• Detailed modeling
• Nonlinear-dynamic analysis
• Appropriate computing tools, knowledge , skills
and lots of patience
Go Beyond
Codes
Sophisticated
Structural
Modelling
Stare of Art
Computer
based tools
123.
123
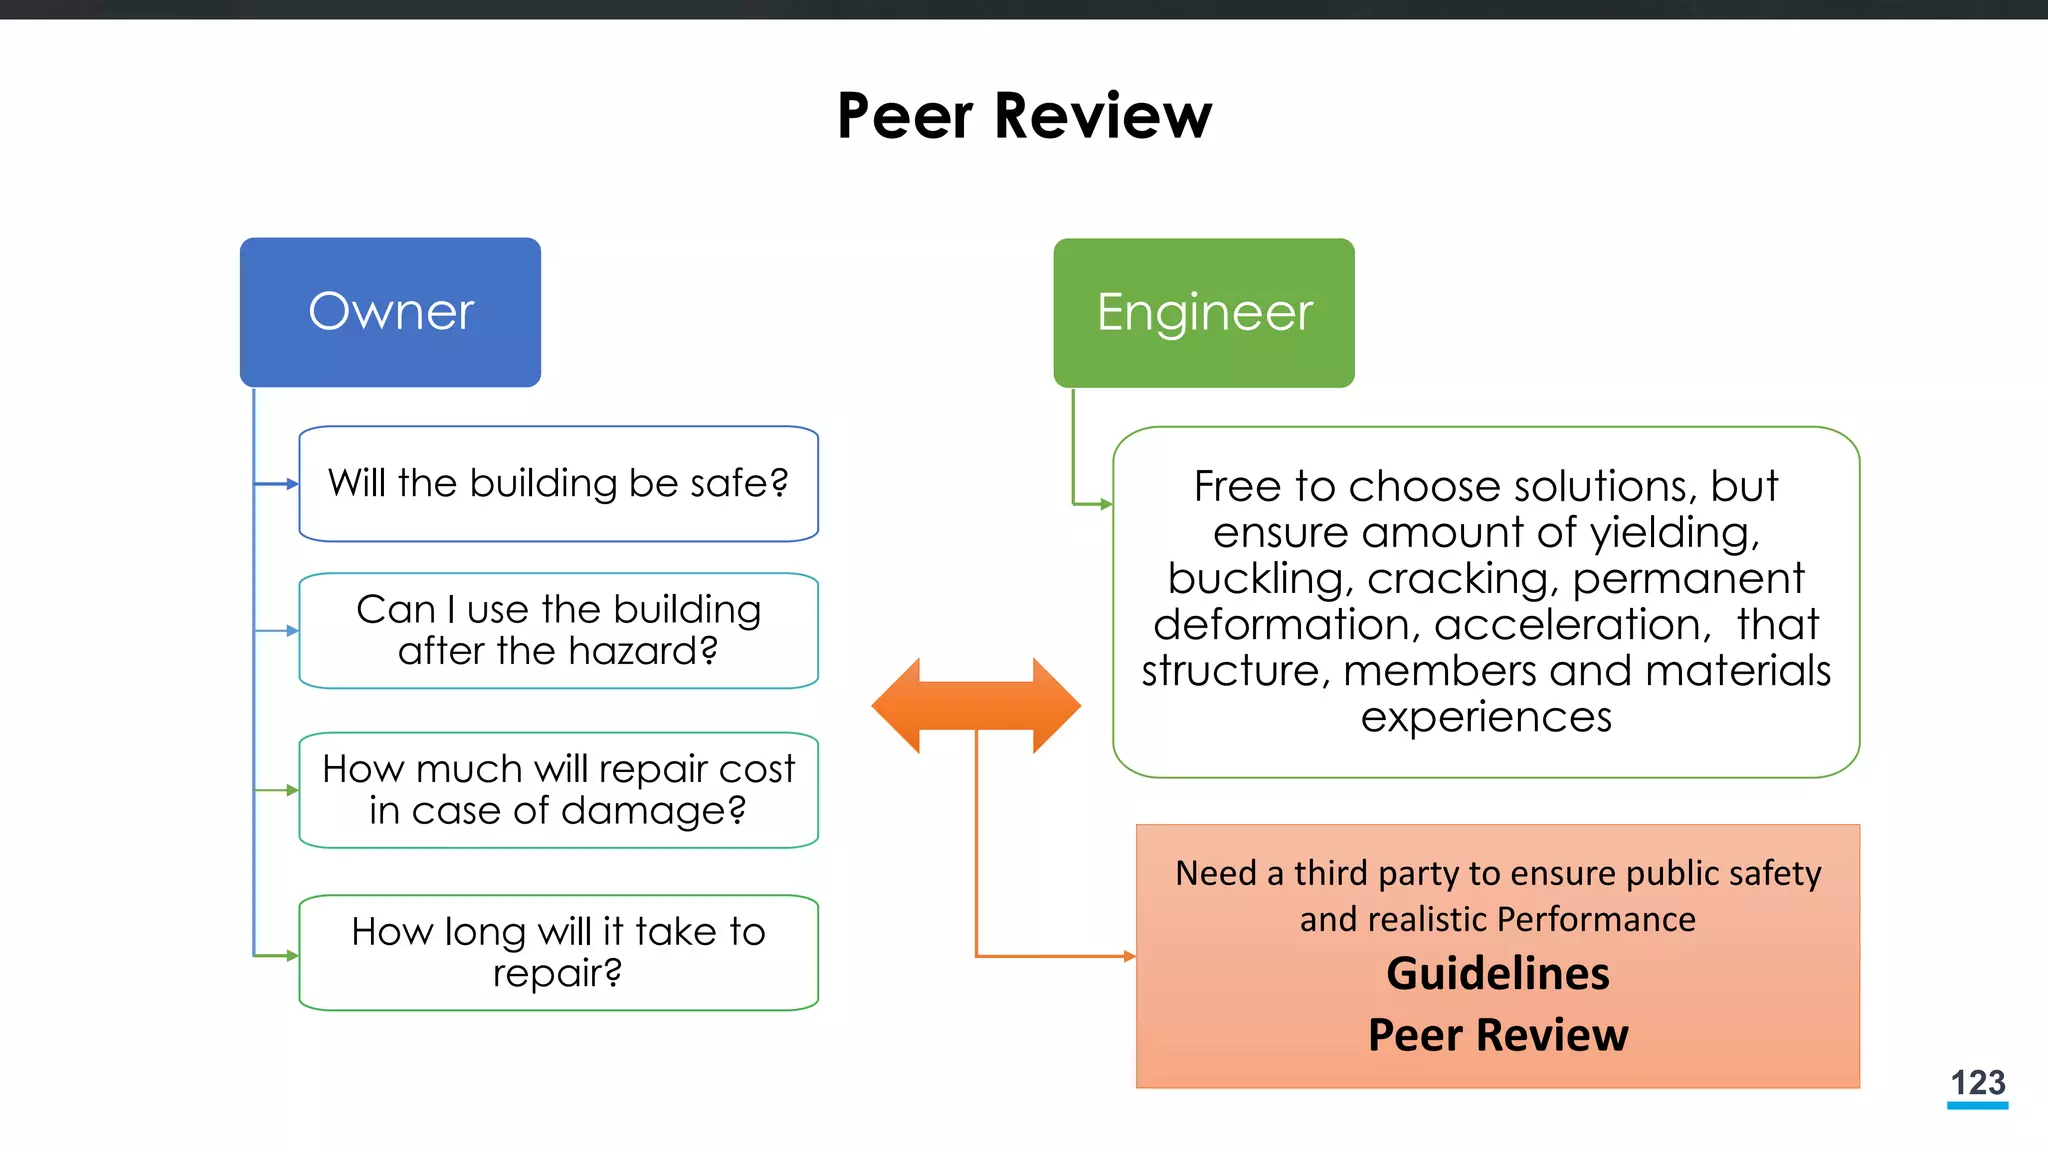
Peer Review
Owner
Will thebuilding be safe?
Can I use the building
after the hazard?
How much will repair cost
in case of damage?
How long will it take to
repair?
Engineer
Free to choose solutions, but
ensure amount of yielding,
buckling, cracking, permanent
deformation, acceleration, that
structure, members and materials
experiences
Need a third party to ensure public safety
and realistic Performance
Guidelines
Peer Review
128
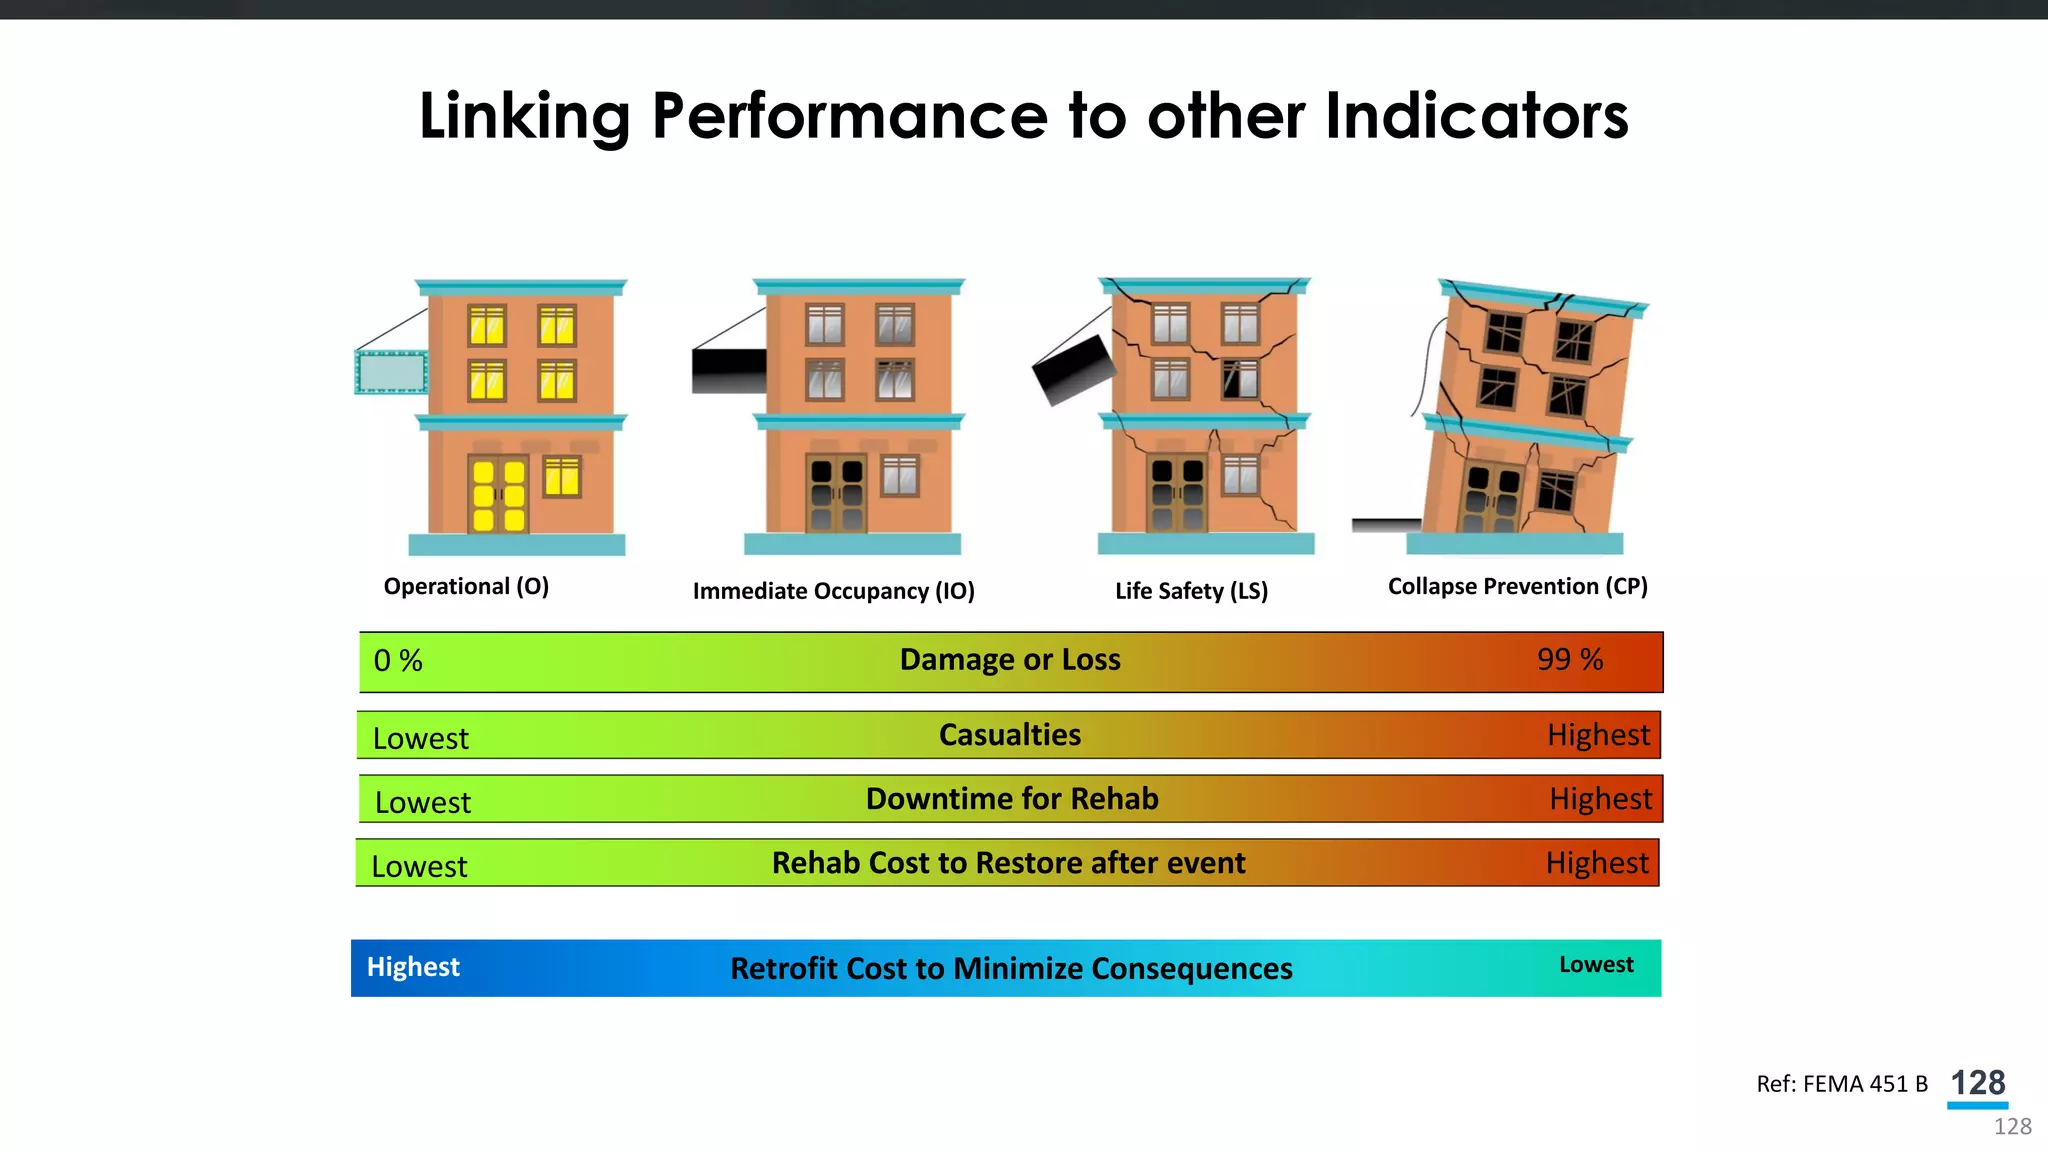
Linking Performance toother Indicators
128
Operational (O) Immediate Occupancy (IO) Life Safety (LS) Collapse Prevention (CP)
0 % Damage or Loss 99 %
Ref: FEMA 451 B
CasualtiesLowest Highest
Rehab Cost to Restore after eventLowest Highest
Retrofit Cost to Minimize ConsequencesHighest Lowest
Downtime for RehabLowest Highest
129.
129
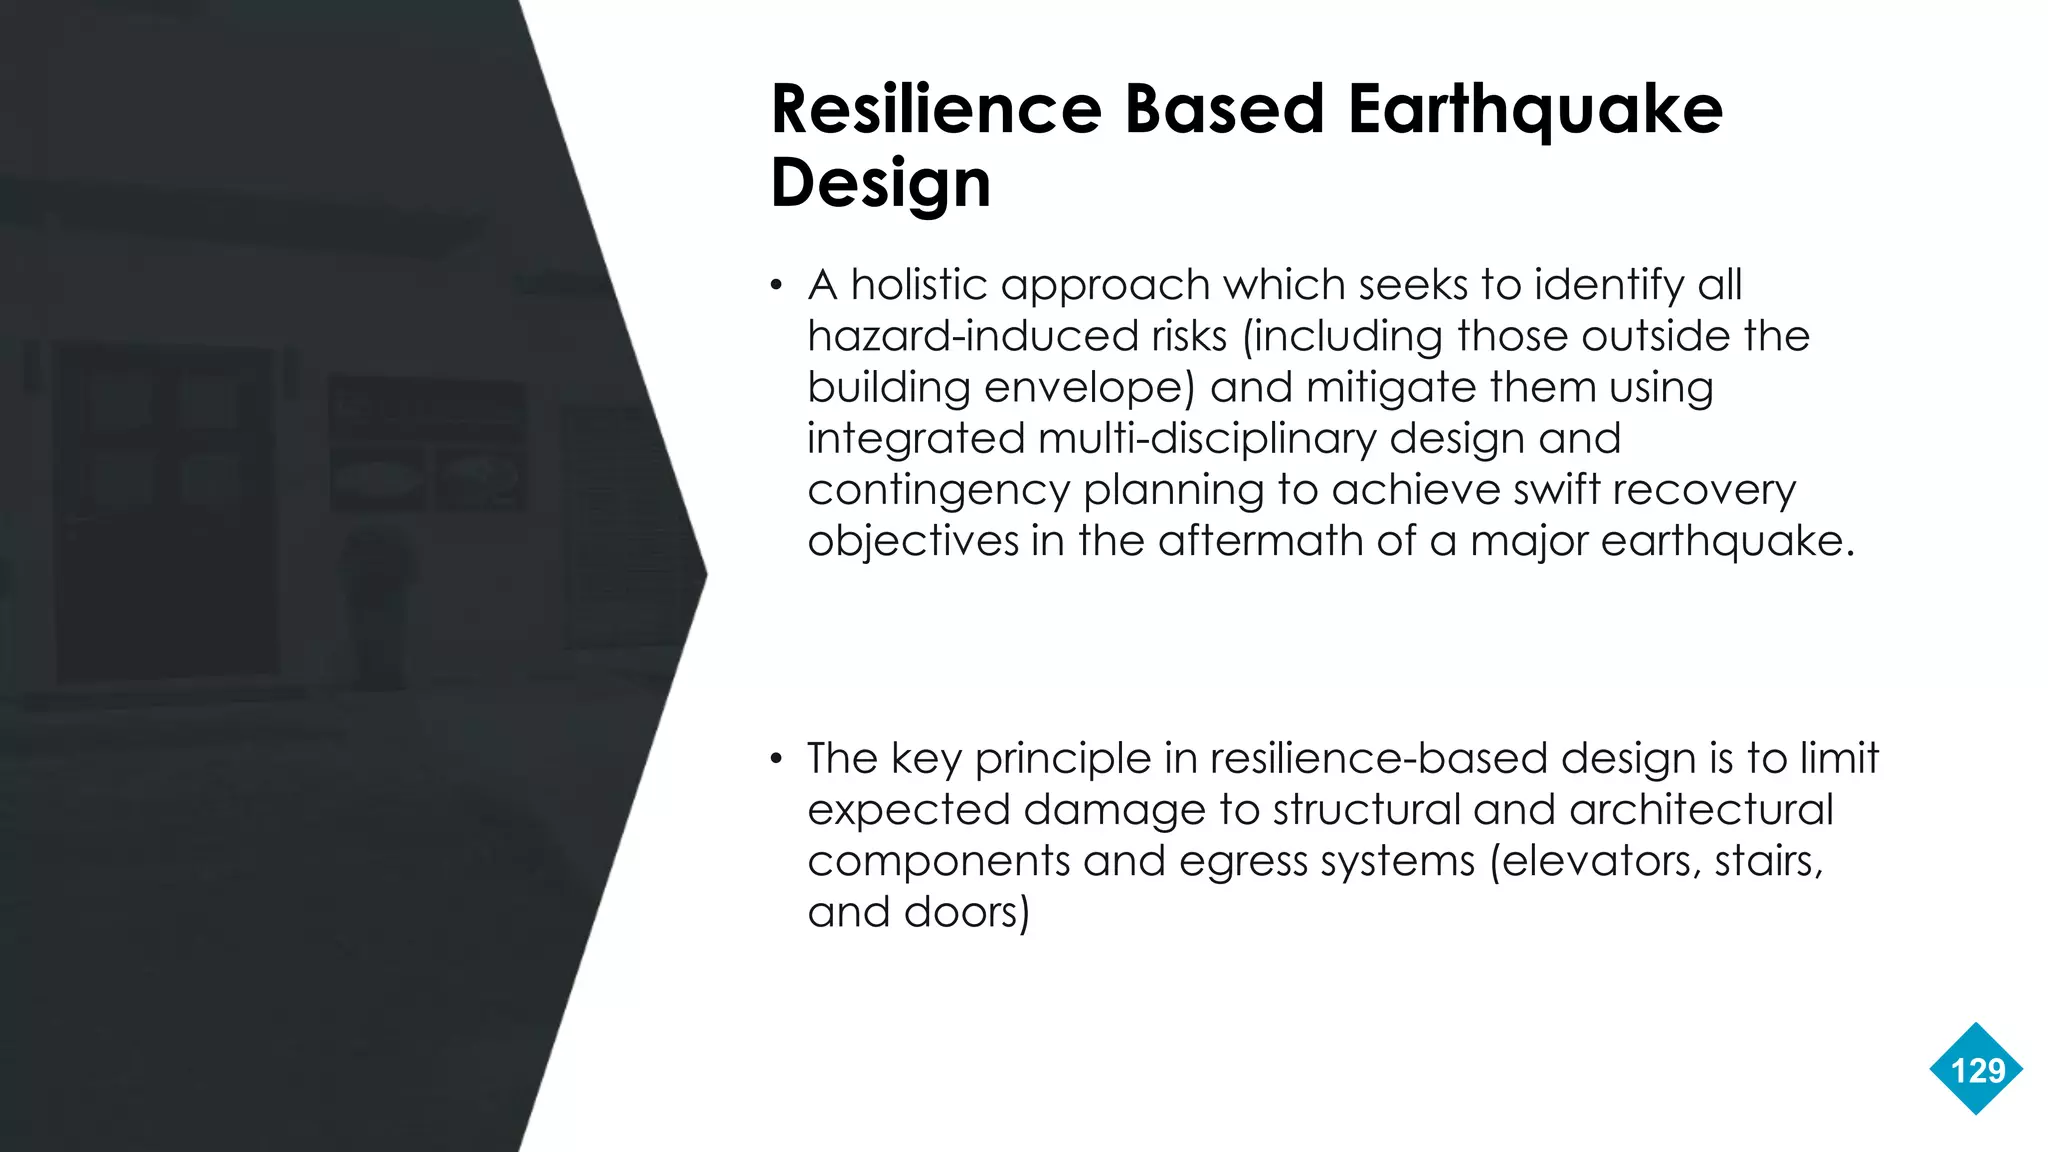
• A holisticapproach which seeks to identify all
hazard-induced risks (including those outside the
building envelope) and mitigate them using
integrated multi-disciplinary design and
contingency planning to achieve swift recovery
objectives in the aftermath of a major earthquake.
• The key principle in resilience-based design is to limit
expected damage to structural and architectural
components and egress systems (elevators, stairs,
and doors)
Resilience Based Earthquake
Design
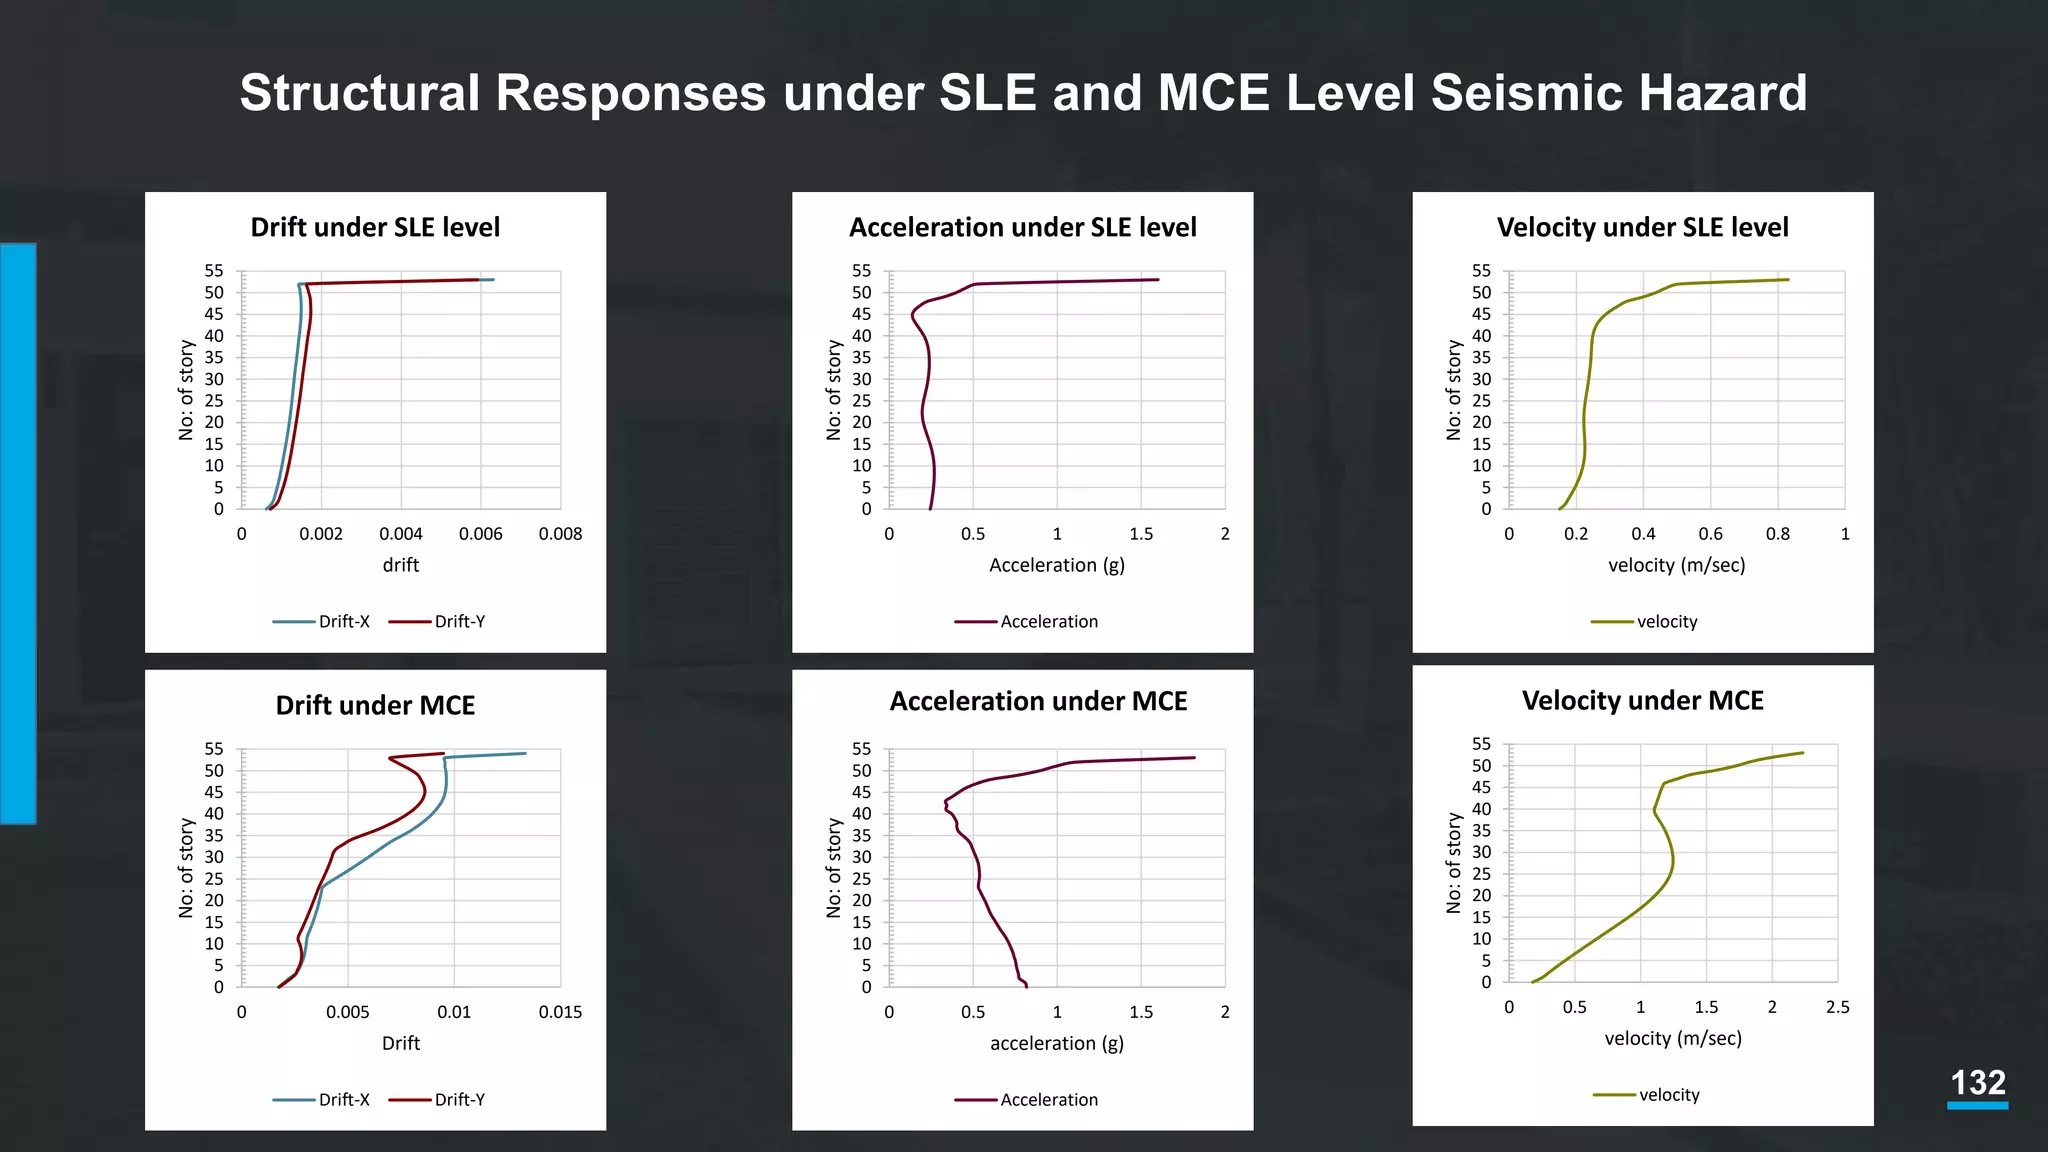
131
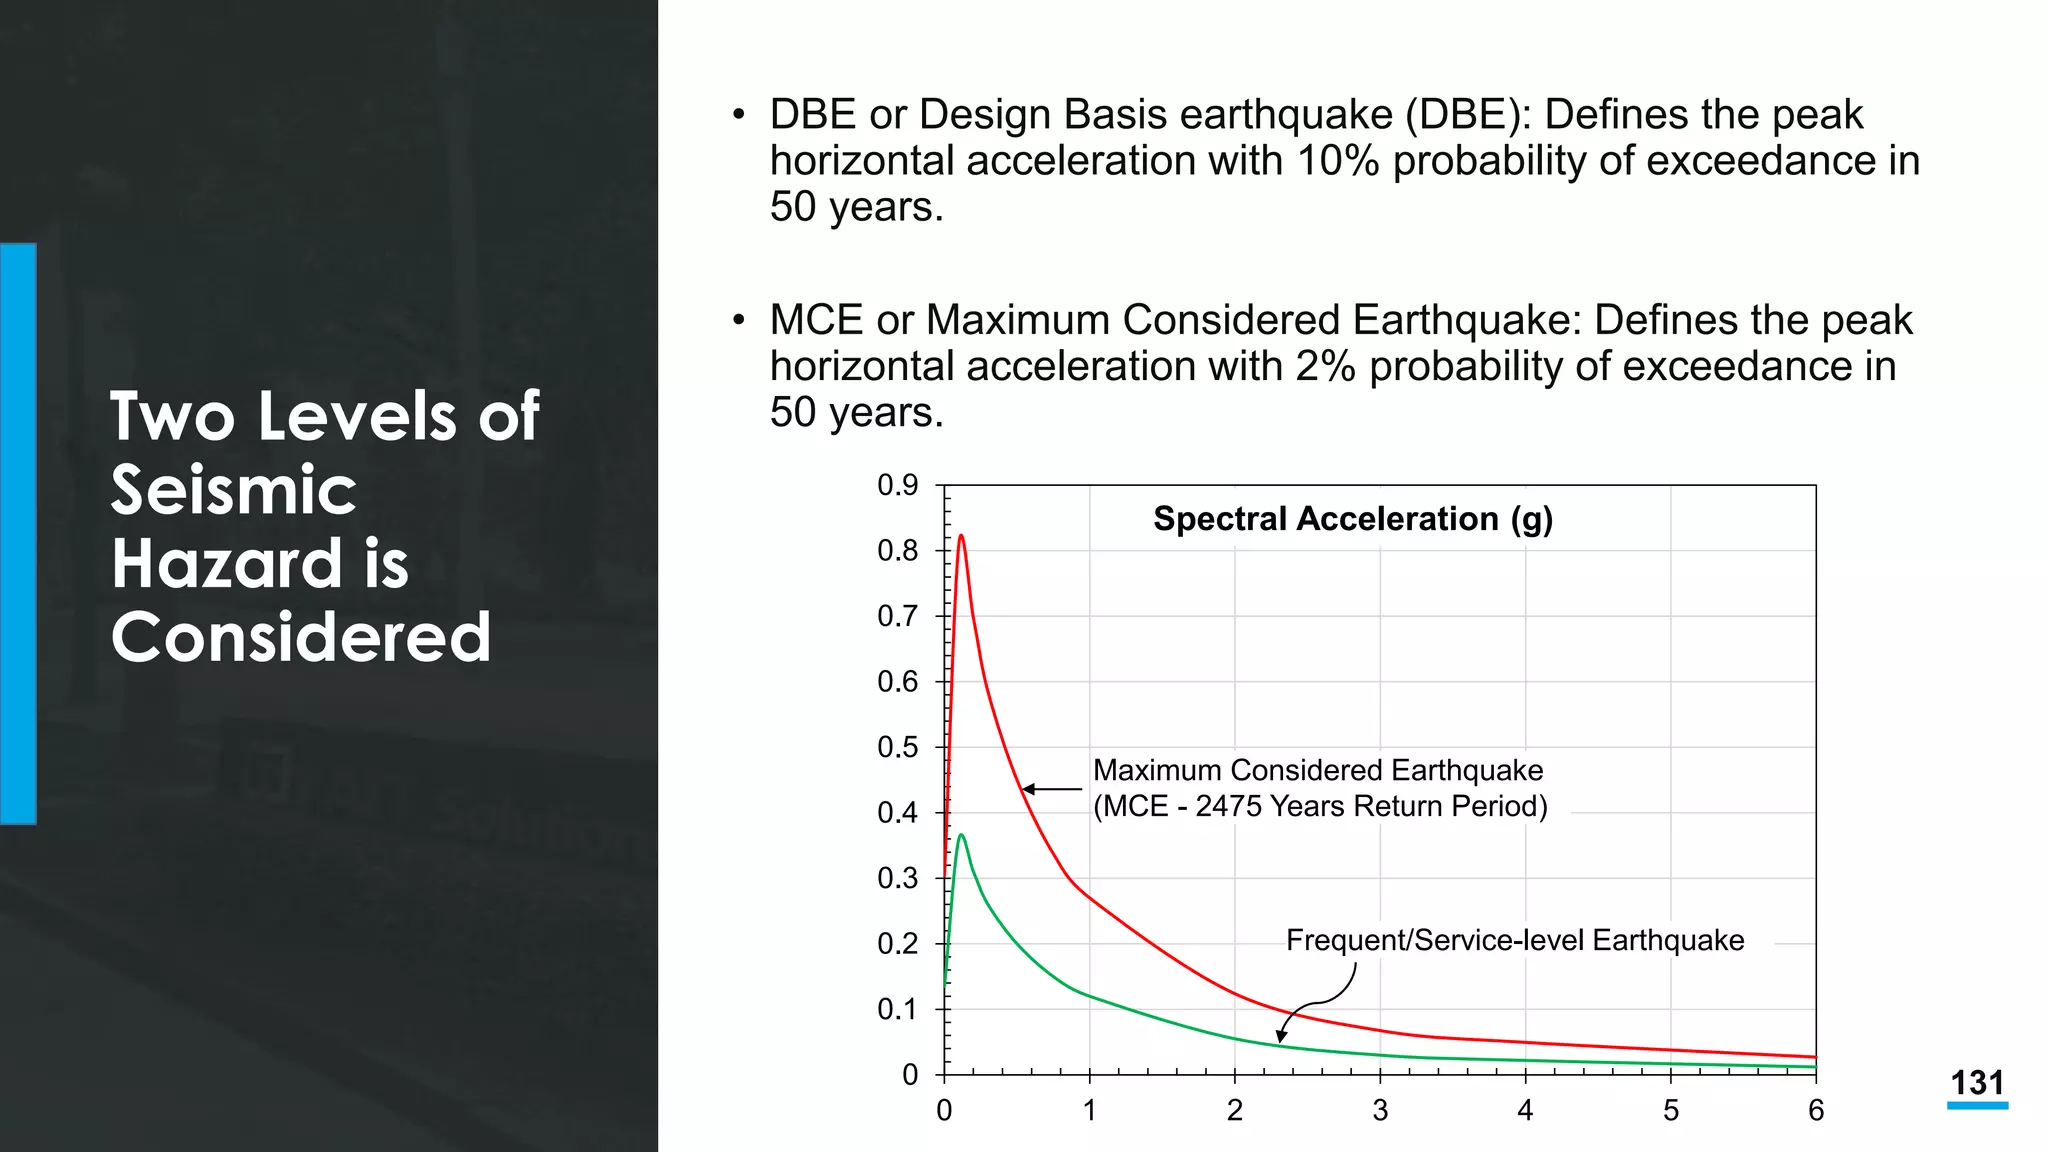
Two Levels of
Seismic
Hazardis
Considered
• DBE or Design Basis earthquake (DBE): Defines the peak
horizontal acceleration with 10% probability of exceedance in
50 years.
• MCE or Maximum Considered Earthquake: Defines the peak
horizontal acceleration with 2% probability of exceedance in
50 years.
0
0.1
0.2
0.3
0.4
0.5
0.6
0.7
0.8
0.9
0 1 2 3 4 5 6
Frequent/Service-level Earthquake
Spectral Acceleration (g)
Maximum Considered Earthquake
(MCE - 2475 Years Return Period)
133
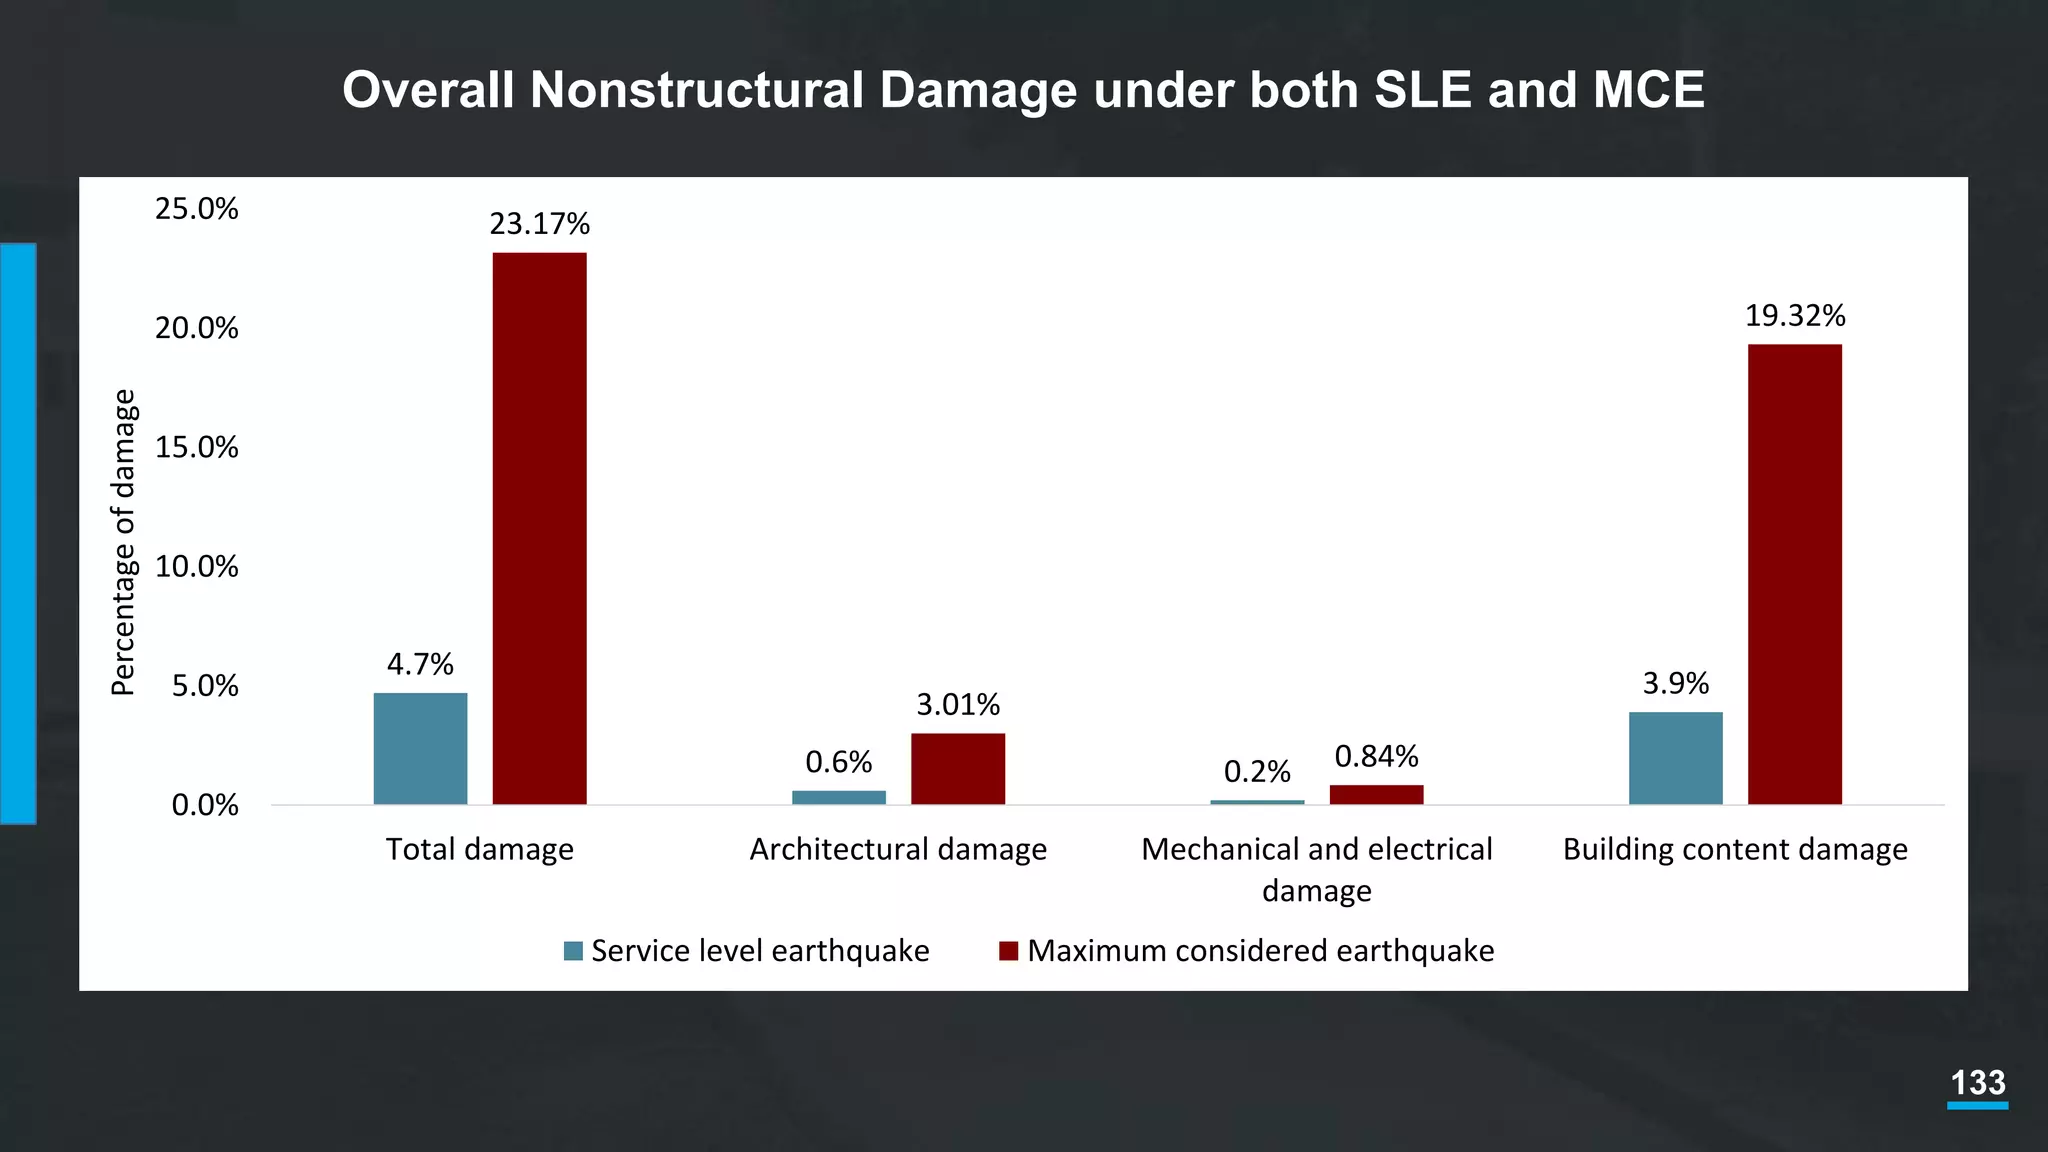
Overall Nonstructural Damageunder both SLE and MCE
4.7%
0.6% 0.2%
3.9%
23.17%
3.01%
0.84%
19.32%
0.0%
5.0%
10.0%
15.0%
20.0%
25.0%
Total damage Architectural damage Mechanical and electrical
damage
Building content damage
Percentageofdamage
Service level earthquake Maximum considered earthquake
134.
134
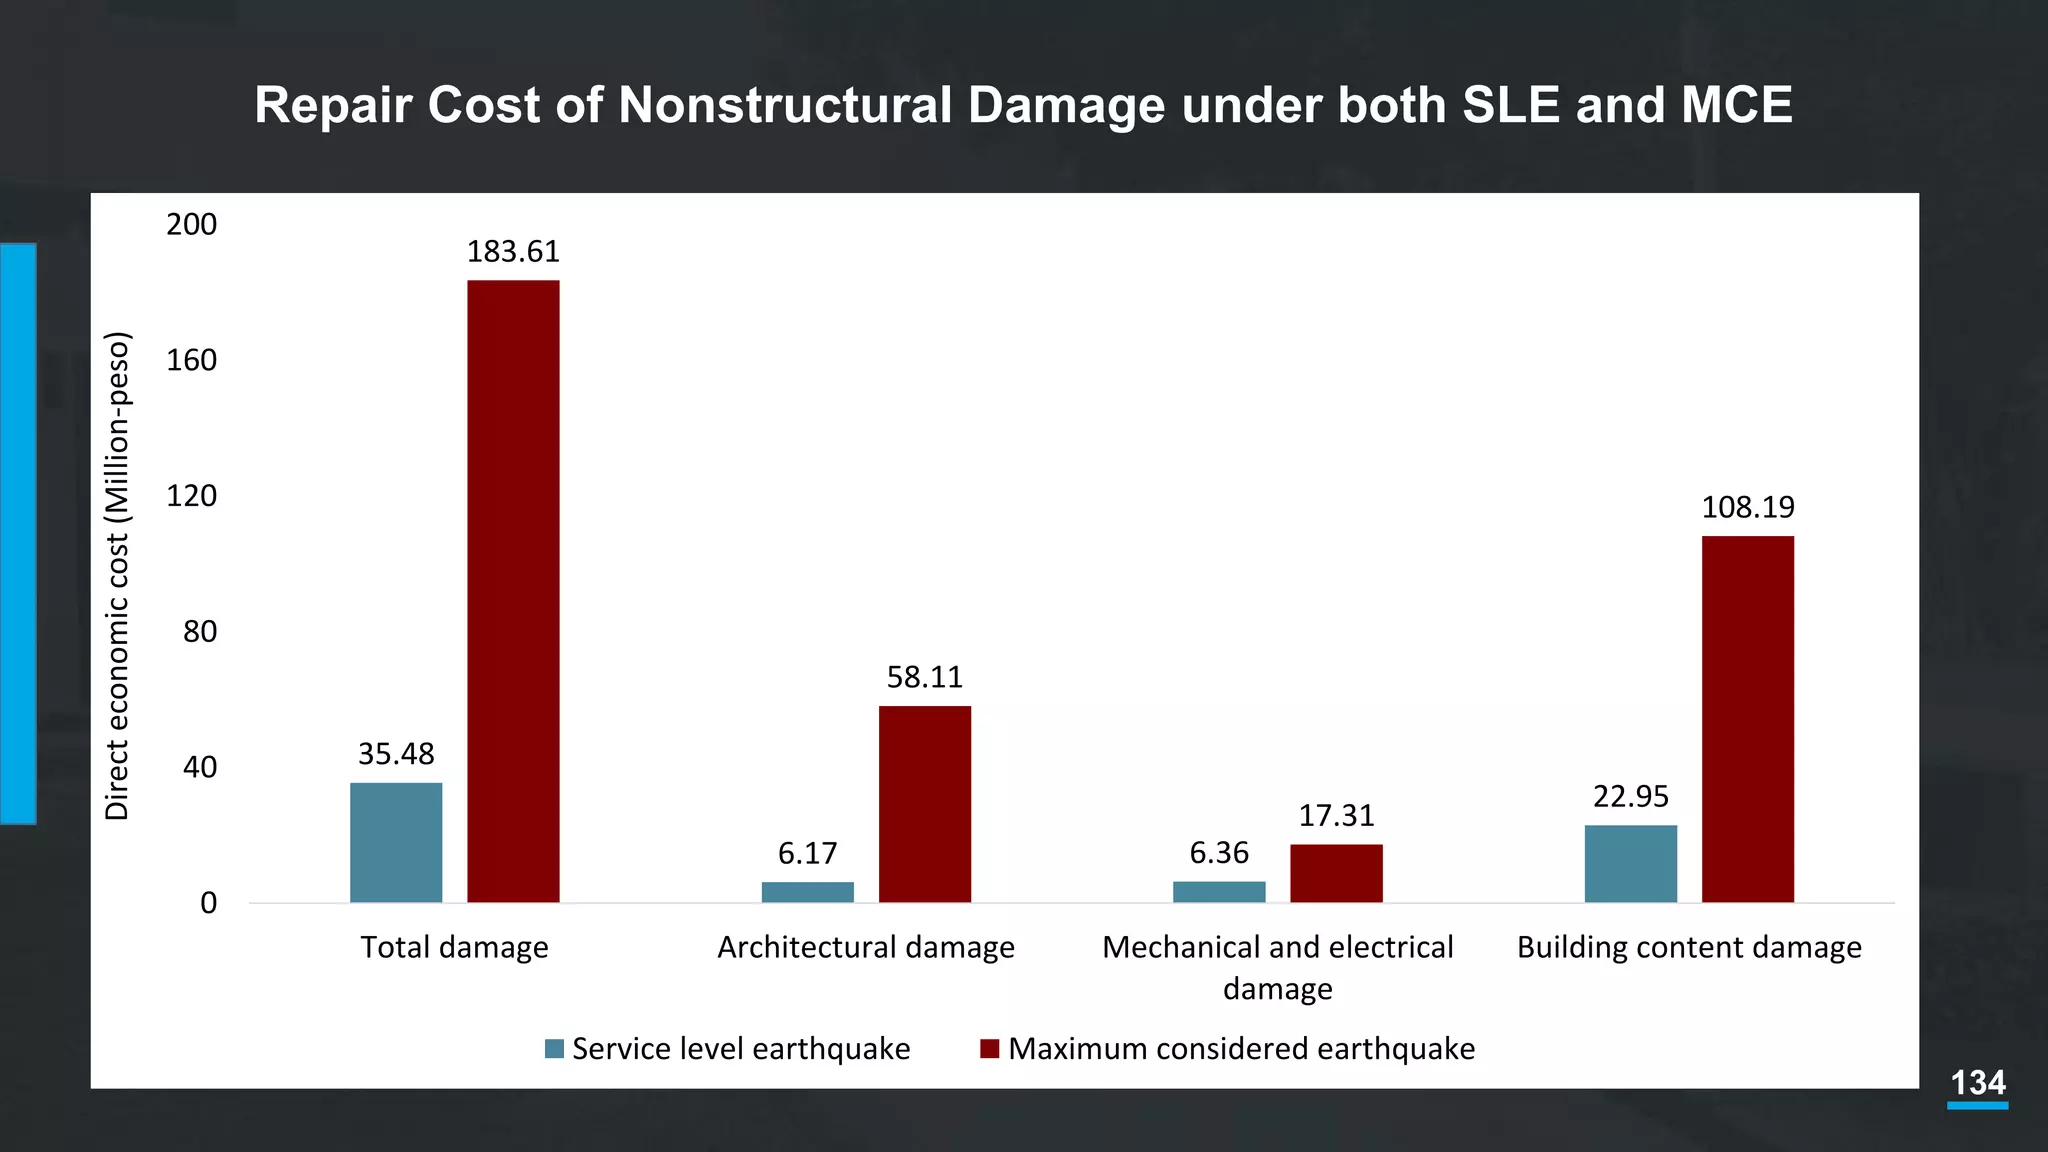
Repair Cost ofNonstructural Damage under both SLE and MCE
35.48
6.17 6.36
22.95
183.61
58.11
17.31
108.19
0
40
80
120
160
200
Total damage Architectural damage Mechanical and electrical
damage
Building content damage
Directeconomiccost(Million-peso)
Service level earthquake Maximum considered earthquake
135.
135
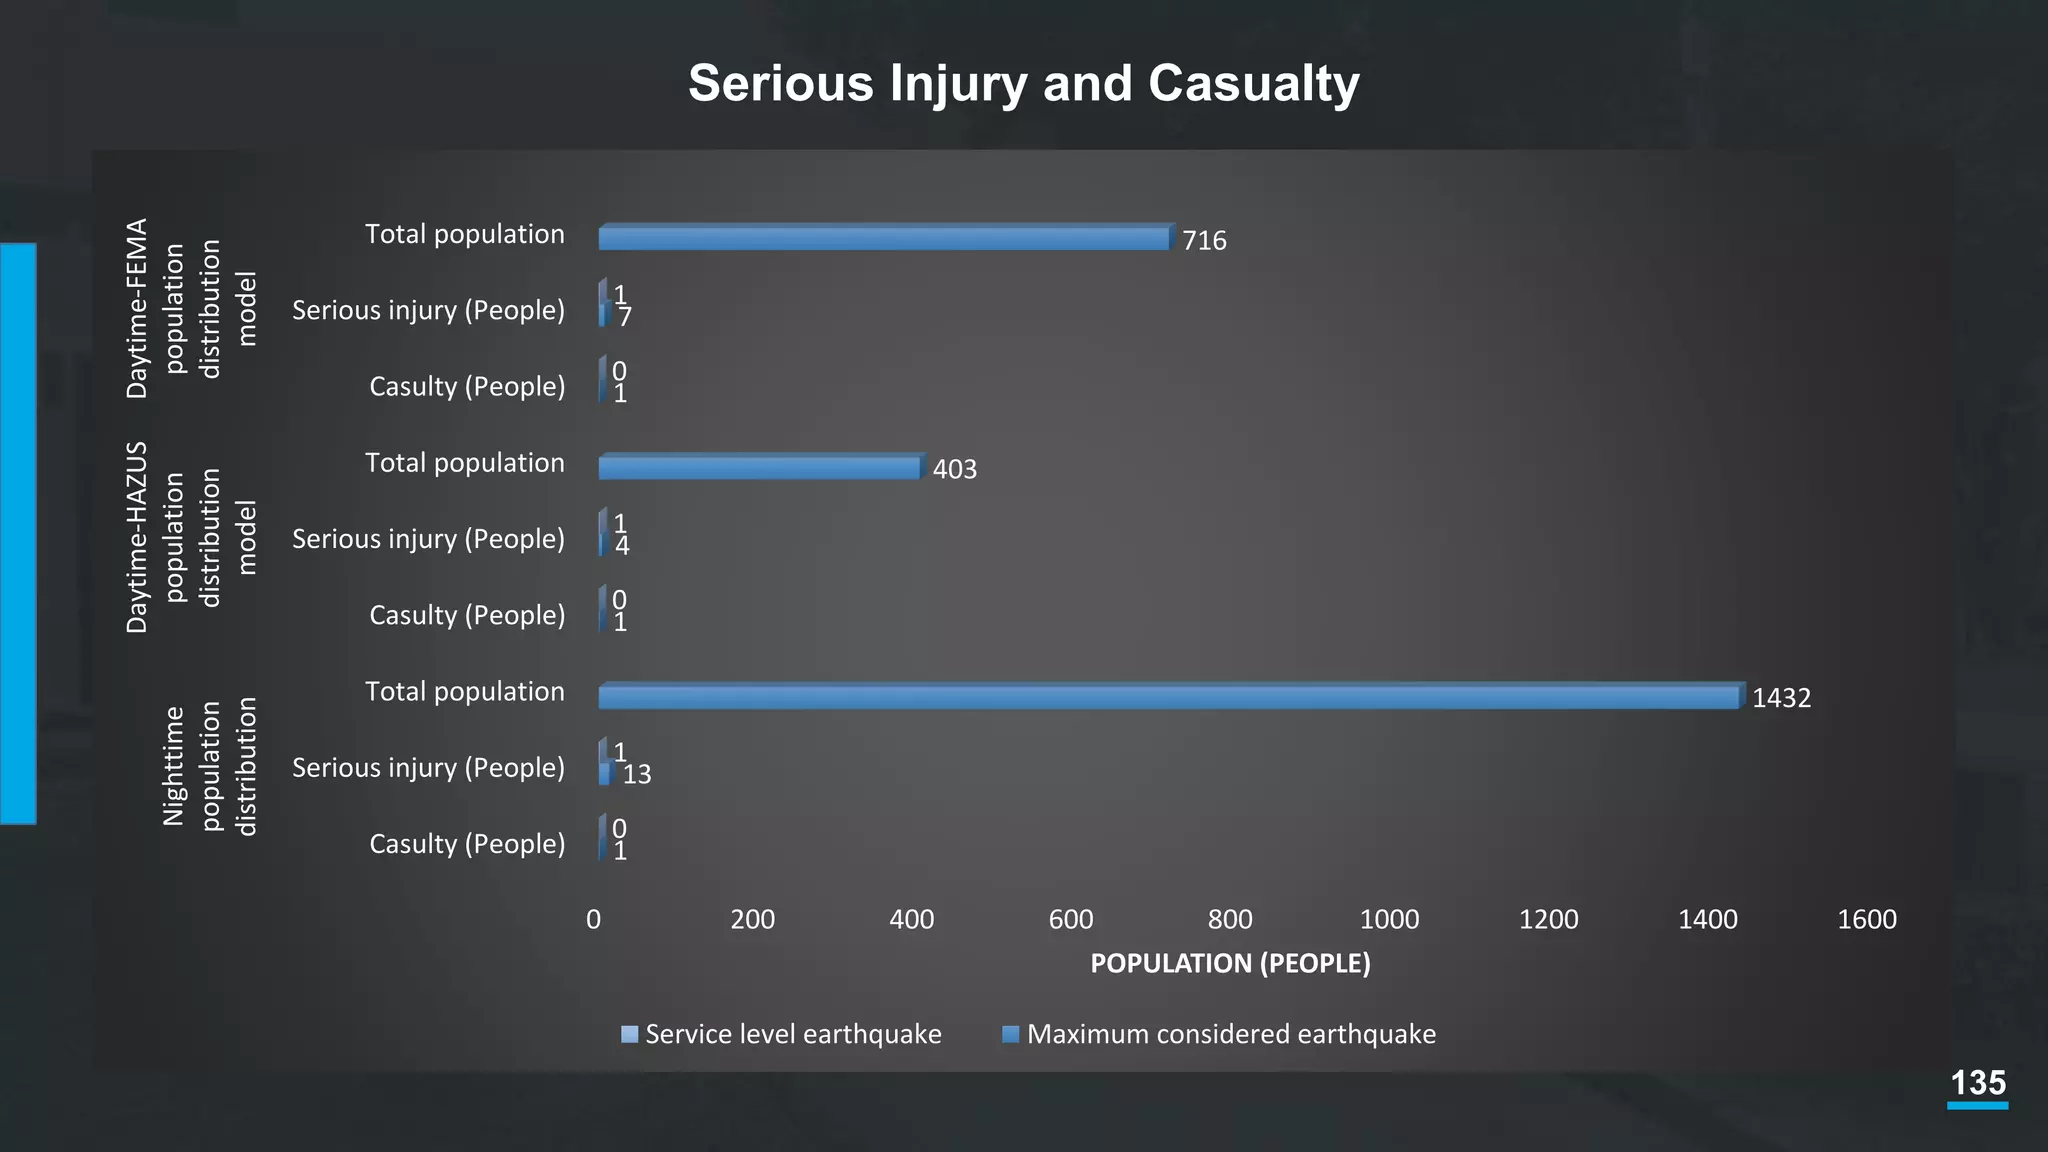
Serious Injury andCasualty
0 200 400 600 800 1000 1200 1400 1600
Casulty (People)
Serious injury (People)
Total population
Casulty (People)
Serious injury (People)
Total population
Casulty (People)
Serious injury (People)
Total population
Nighttime
population
distribution
Daytime-HAZUS
population
distribution
model
Daytime-FEMA
population
distribution
model
1
13
1432
1
4
403
1
7
716
0
1
0
1
0
1
POPULATION (PEOPLE)
Service level earthquake Maximum considered earthquake
137
A Swing Towardsthe AI
• Rich Pictures
• Analytical Hierarchy Process (AHP)
• Artificial Neural Networks (ANN)
• Genetic Algorithms (GA)
• Expert Systems (ES)
• Machine learning (ML)
• Fuzzy Logic
• Deep Thinking
• Big Data and Data Mining
137
138.
138
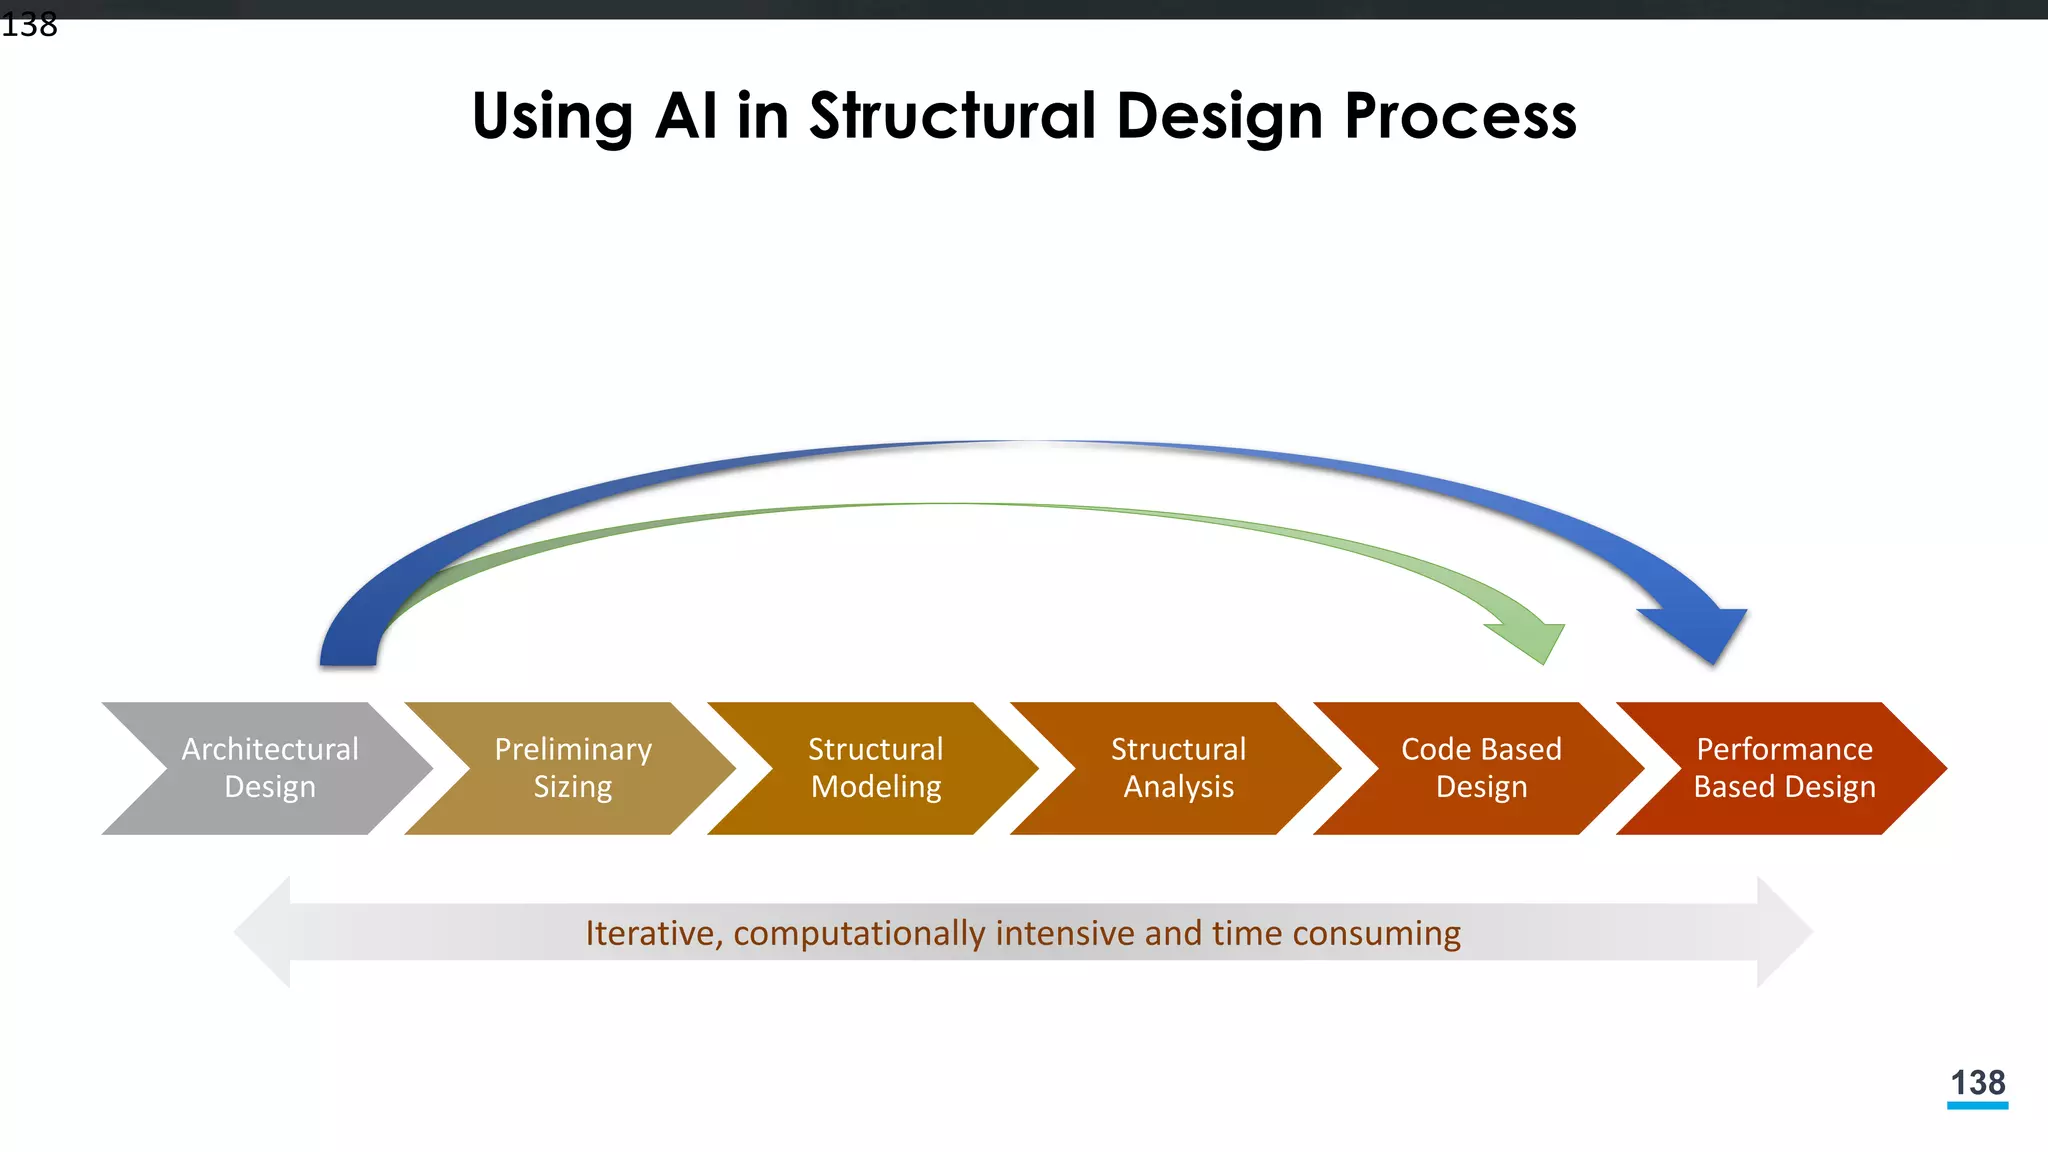
Using AI inStructural Design Process
Architectural
Design
Preliminary
Sizing
Structural
Modeling
Structural
Analysis
Code Based
Design
Performance
Based Design
138
Iterative, computationally intensive and time consuming
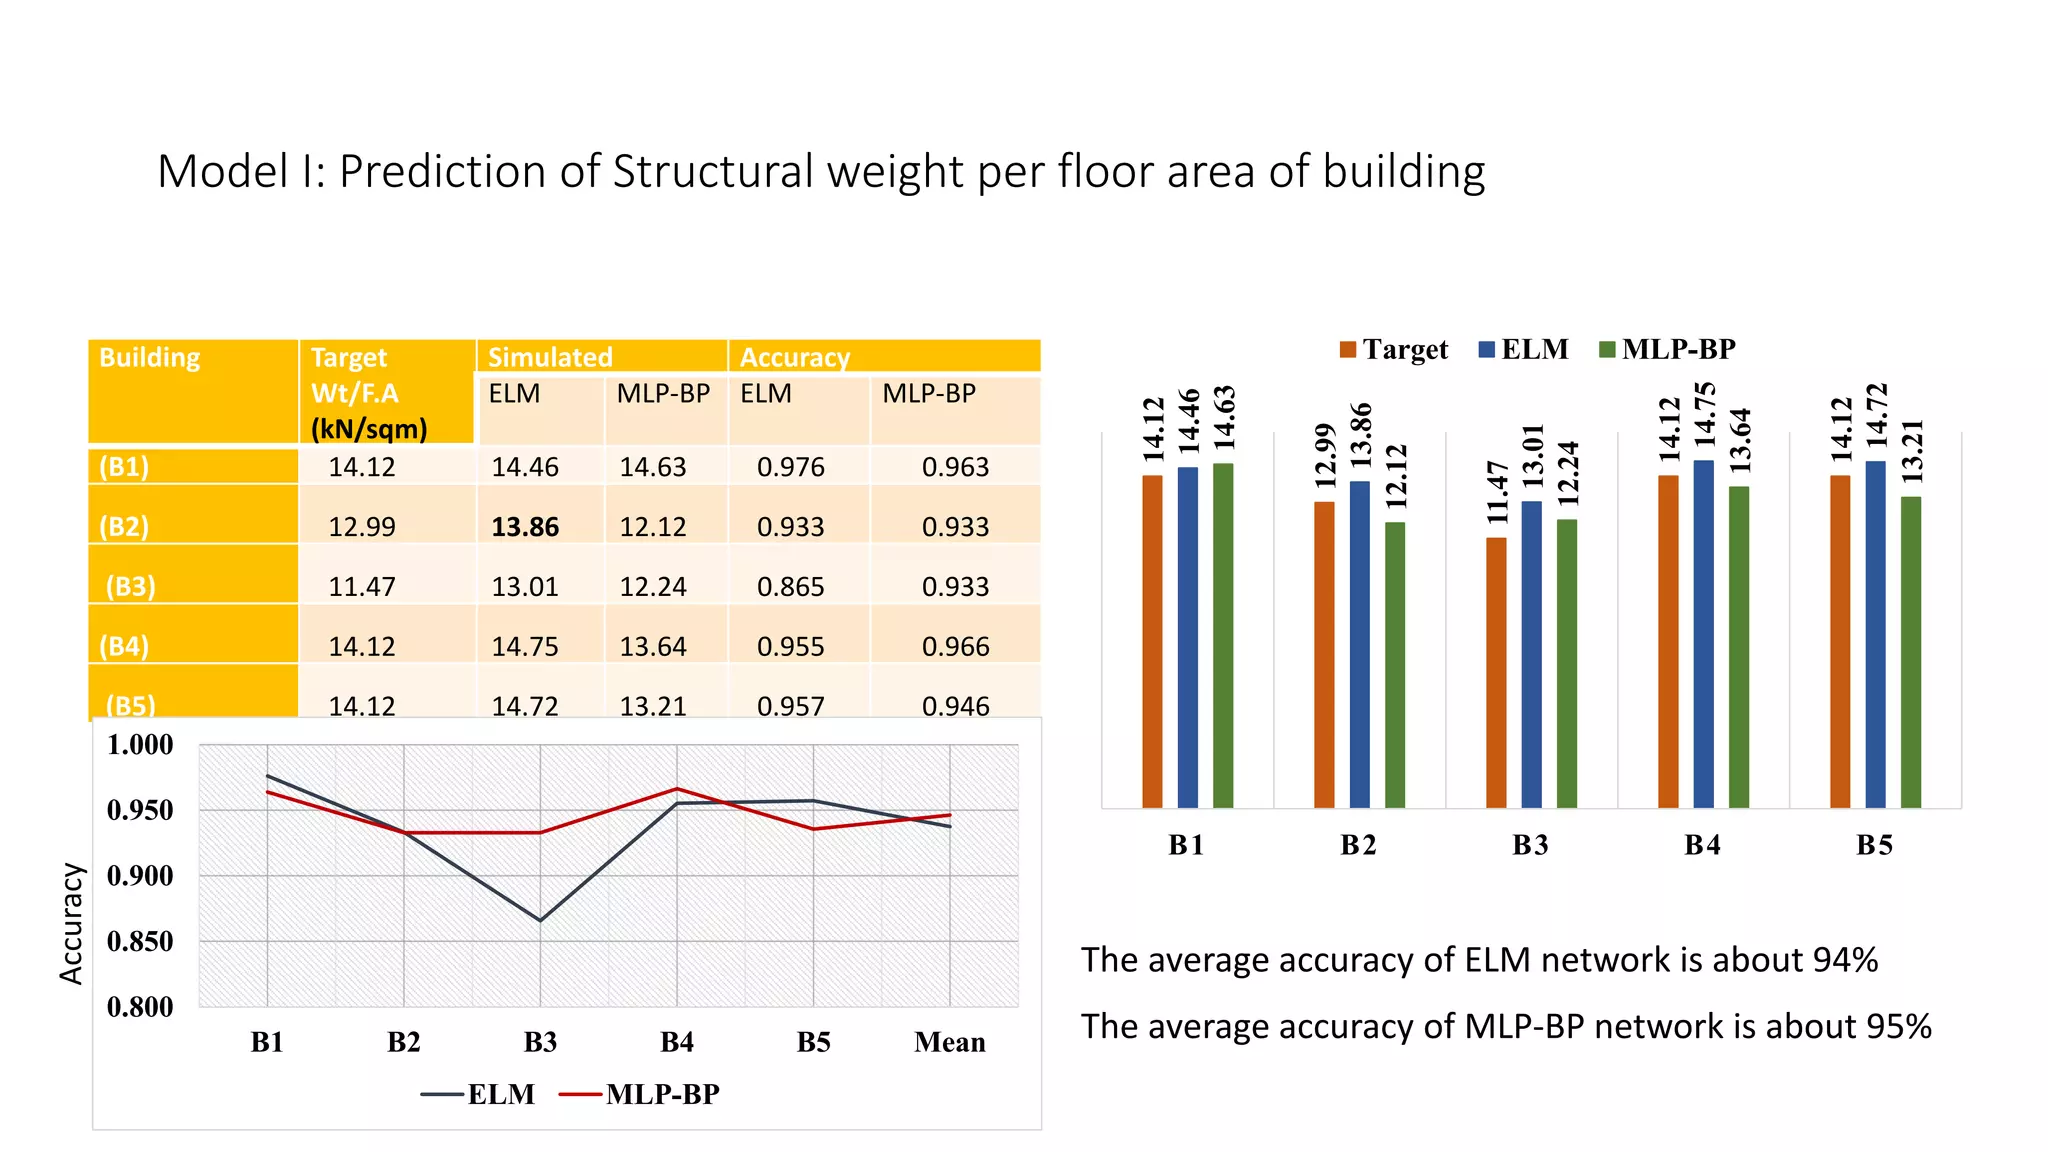
Model I: Predictionof Structural weight per floor area of building
Building Target
Wt/F.A
(kN/sqm)
Simulated Accuracy
ELM MLP-BP ELM MLP-BP
(B1) 14.12 14.46 14.63 0.976 0.963
(B2) 12.99 13.86 12.12 0.933 0.933
(B3) 11.47 13.01 12.24 0.865 0.933
(B4) 14.12 14.75 13.64 0.955 0.966
(B5) 14.12 14.72 13.21 0.957 0.946
14.12
12.99
11.47
14.12
14.12
14.46
13.86
13.01
14.75
14.72
14.63
12.12
12.24
13.64
13.21
B1 B2 B3 B4 B5
Target ELM MLP-BP
0.800
0.850
0.900
0.950
1.000
B1 B2 B3 B4 B5 Mean
ELM MLP-BP
The average accuracy of ELM network is about 94%
The average accuracy of MLP-BP network is about 95%
Accuracy
146
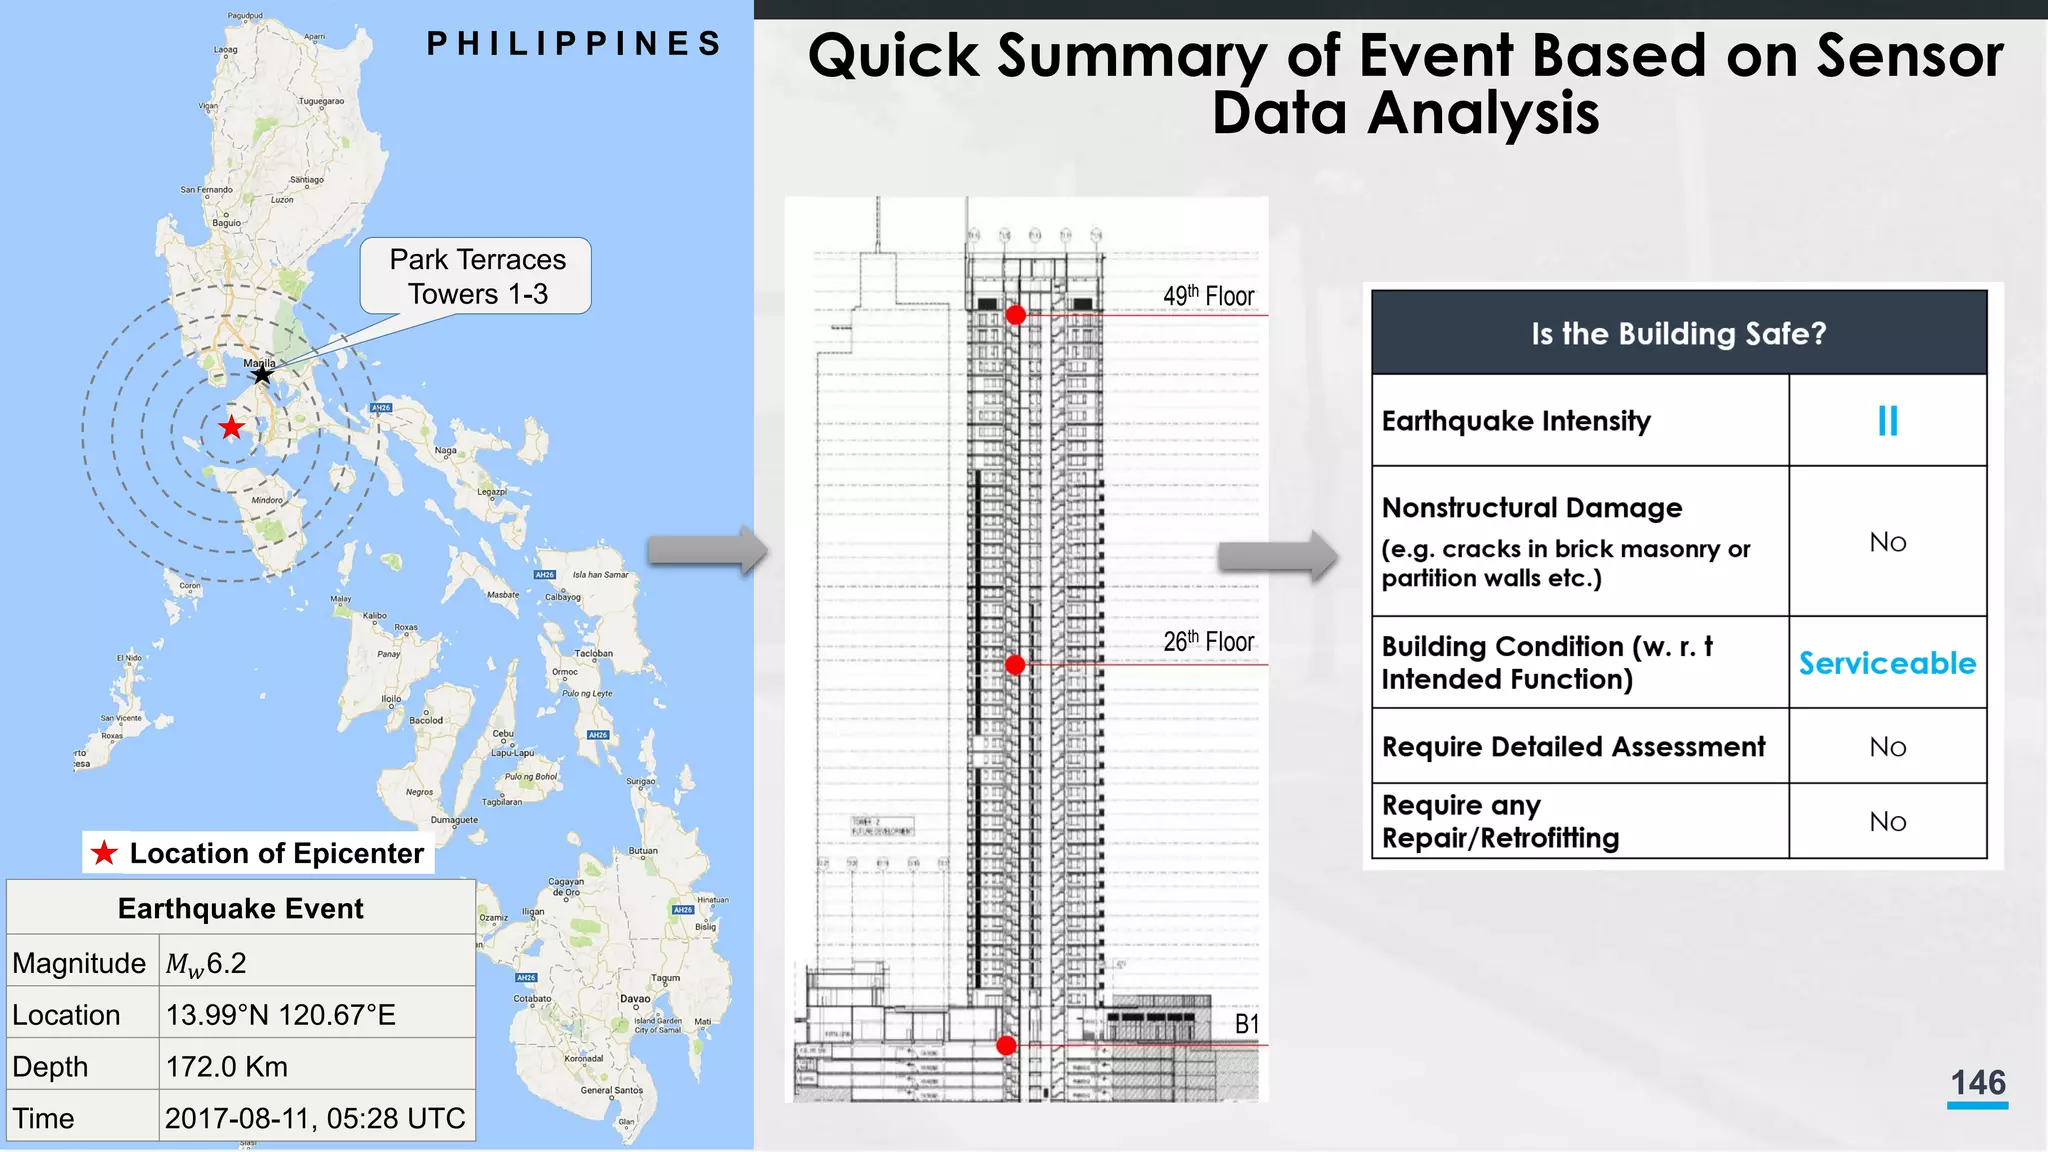
49th Floor
26th Floor
B1
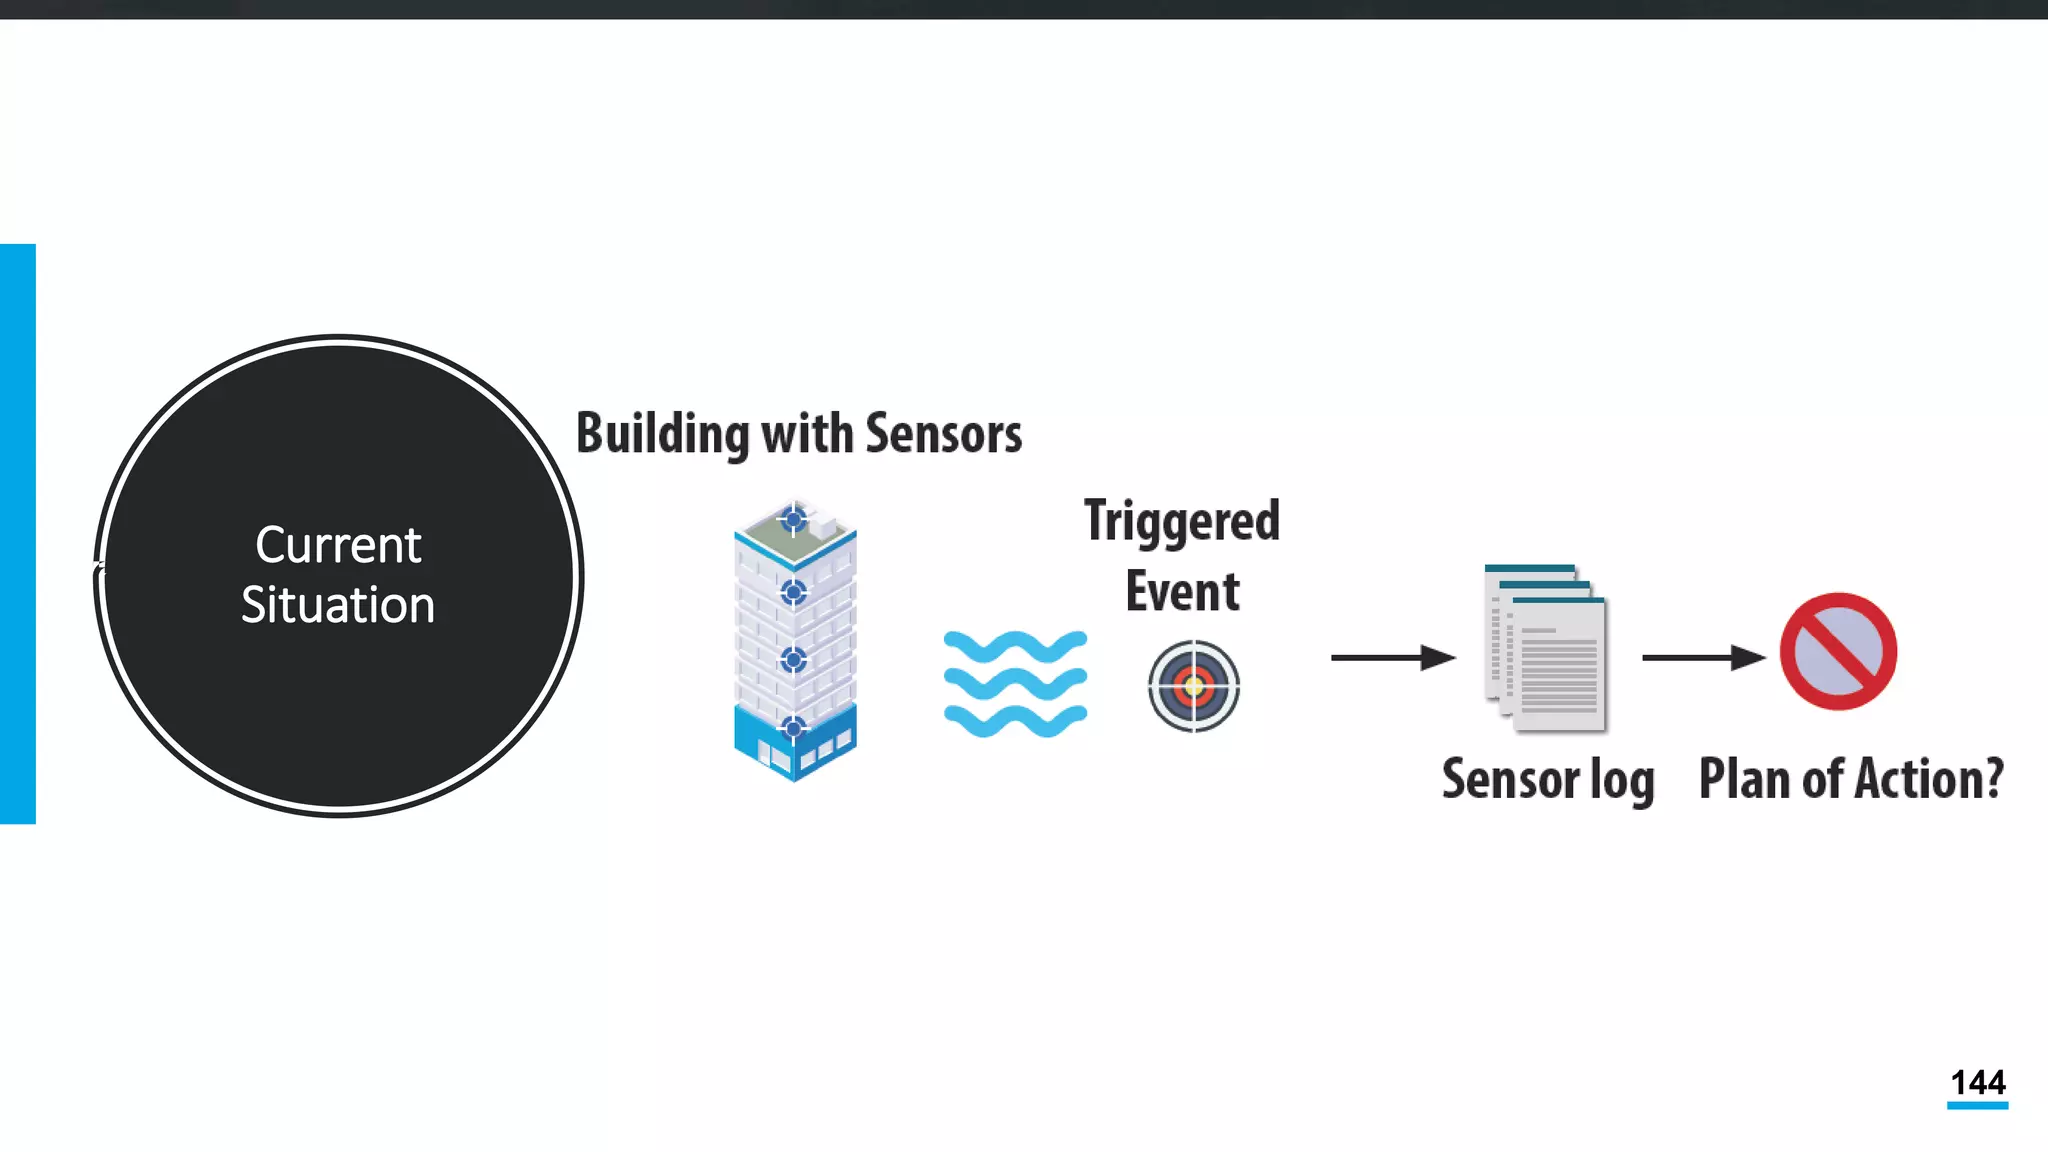
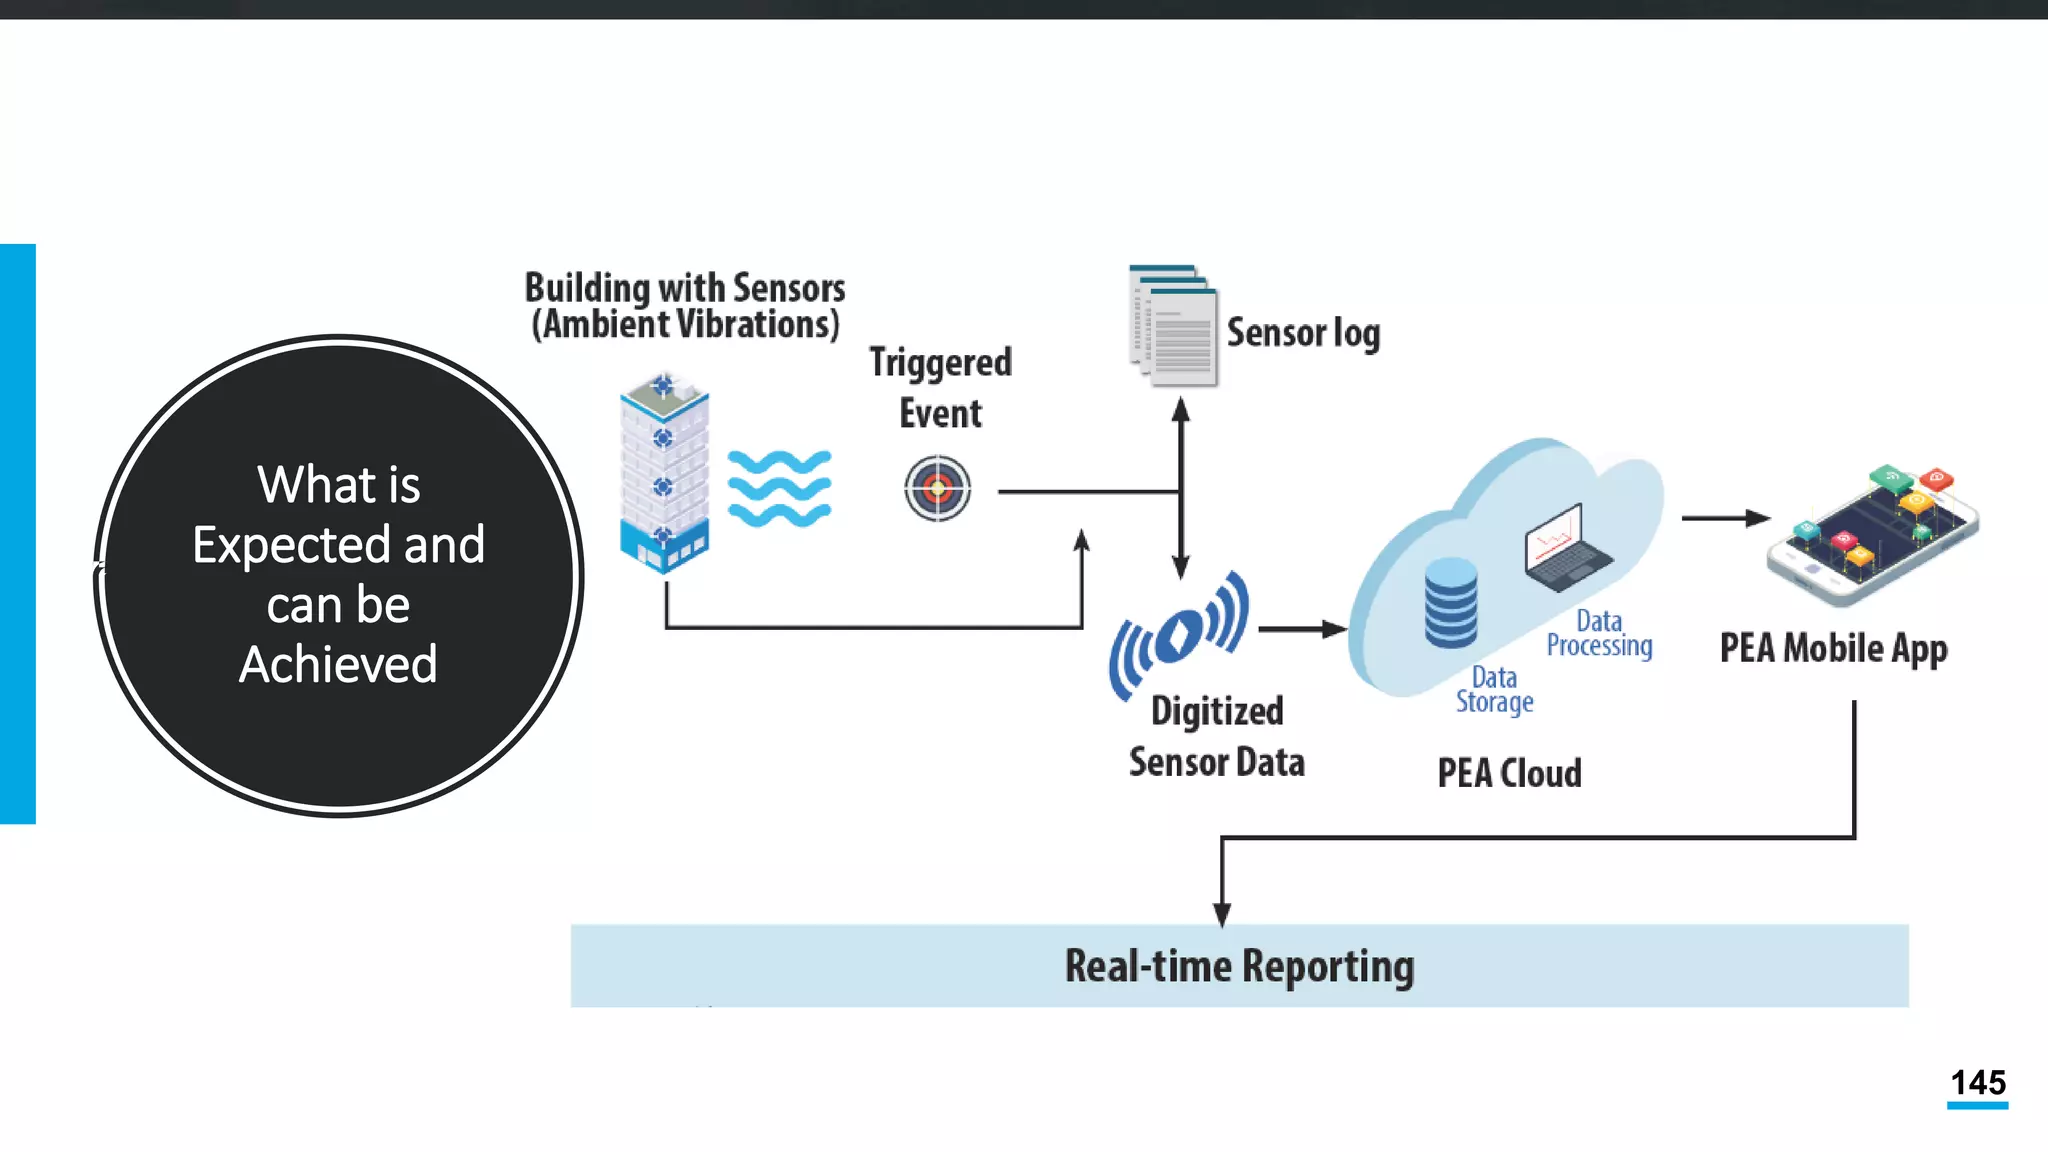
QuickSummary of Event Based on Sensor
Data Analysis
Location of Epicenter
Earthquake Event
Magnitude 6.2
Location 13.99 N 120.67 E
Depth 172.0 Km
Time 2017-08-11, 05:28 UTC
P H I L I P P I N E S
Park Terraces
Towers 1-3
147.
147
0
0.1
0.2
0.3
0.4
0.5
0.6
0.7
0.8
0.9
0 1 23 4 5 6
0
0.1
0.2
0.3
0.4
0.5
0.6
0.7
0.8
0.9
0 1 2 3 4 5 6
0
50
100
150
200
250
300
0 1 2 3 4 5 6
0
50
100
150
200
250
300
0 1 2 3 4 5 6
0
50
100
150
200
250
300
350
400
450
500
0 1 2 3 4 5 6
0
50
100
150
200
250
300
350
400
450
500
0 1 2 3 4 5 6
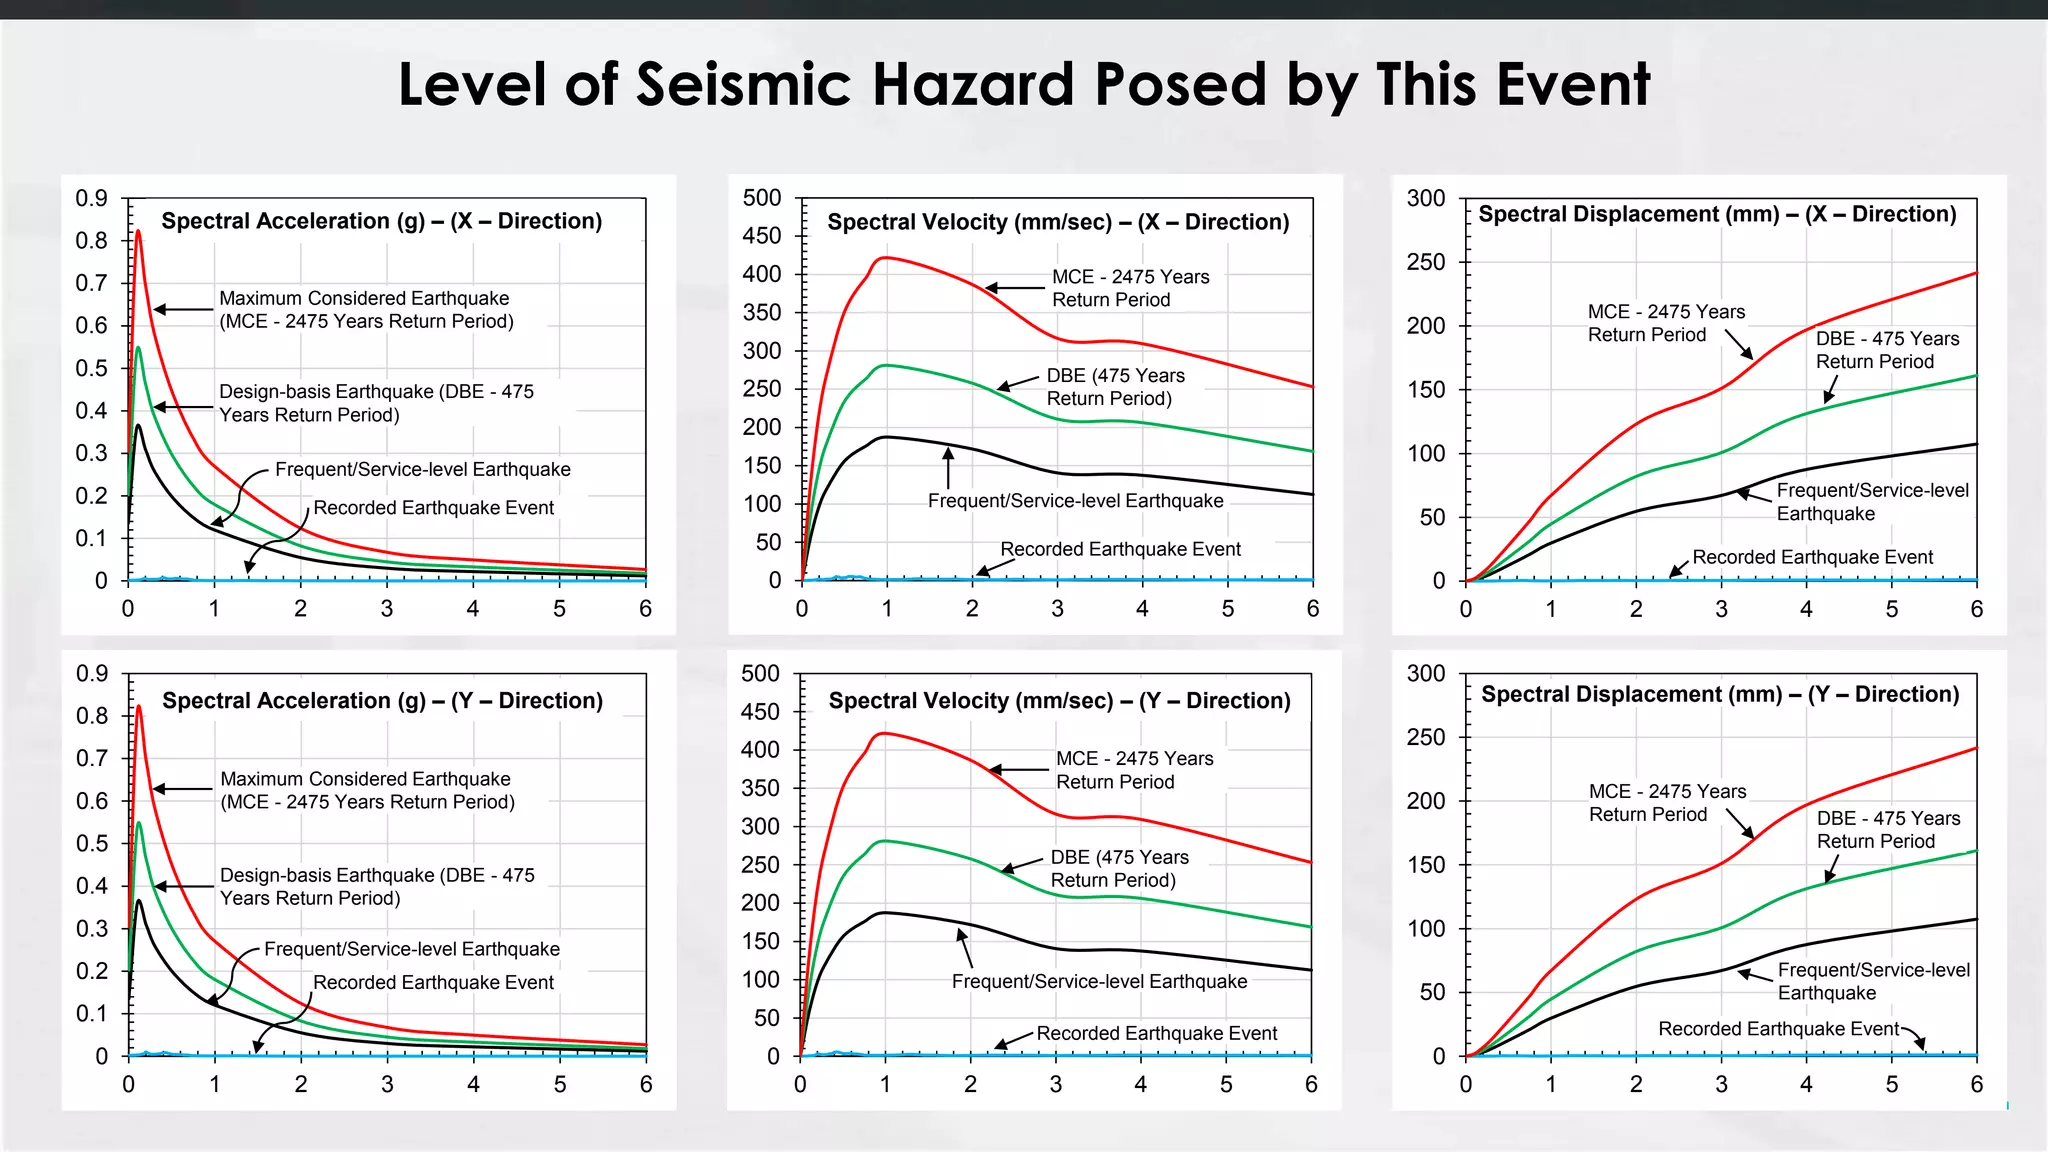
Frequent/Service-level Earthquake
Recorded Earthquake Event
Spectral Acceleration (g) – (X – Direction)
Design-basis Earthquake (DBE - 475
Years Return Period)
Maximum Considered Earthquake
(MCE - 2475 Years Return Period)
Frequent/Service-level Earthquake
Recorded Earthquake Event
Spectral Acceleration (g) – (Y – Direction)
Design-basis Earthquake (DBE - 475
Years Return Period)
Maximum Considered Earthquake
(MCE - 2475 Years Return Period)
Frequent/Service-level Earthquake
Recorded Earthquake Event
Spectral Velocity (mm/sec) – (X – Direction)
DBE (475 Years
Return Period)
MCE - 2475 Years
Return Period
Spectral Velocity (mm/sec) – (Y – Direction)
Frequent/Service-level Earthquake
Recorded Earthquake Event
DBE (475 Years
Return Period)
MCE - 2475 Years
Return Period
Frequent/Service-level
Earthquake
Recorded Earthquake Event
Spectral Displacement (mm) – (X – Direction)
DBE - 475 Years
Return Period
MCE - 2475 Years
Return Period
Spectral Displacement (mm) – (Y – Direction)
Frequent/Service-level
Earthquake
Recorded Earthquake Event
DBE - 475 Years
Return Period
MCE - 2475 Years
Return Period
Level of Seismic Hazard Posed by This Event
148.
148
In the viewof practicing structural engineer a gap
between what is taught and what is needed to
practice in performance based design is filled by on
job learning and knowledge acquired from
experienced engineers
149.
Thank you foryour kind
attention
View publication statsView publication stats


![[EAS664] - Part 2_Design Philosophys .pdf](https://cdn.slidesharecdn.com/ss_thumbnails/eas664-part2designphilosophy-250630121641-62675ee5-thumbnail.jpg?width=640&height=640&fit=bounds)


