Download to read offline

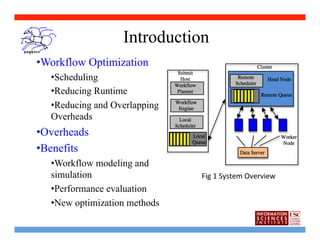
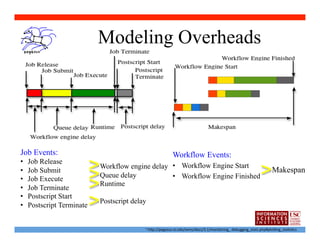
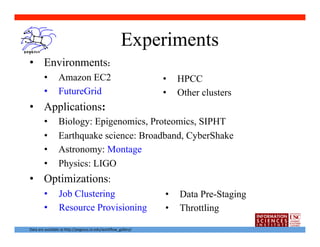
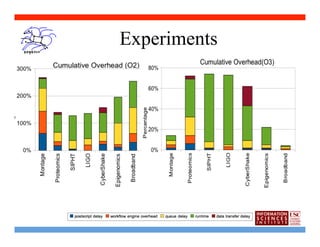
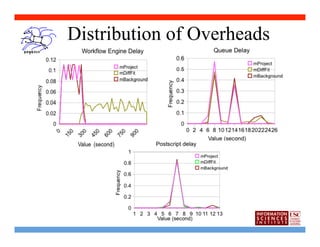
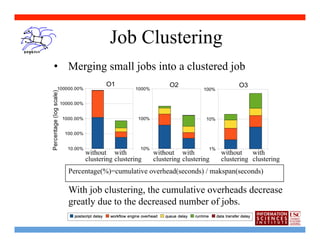
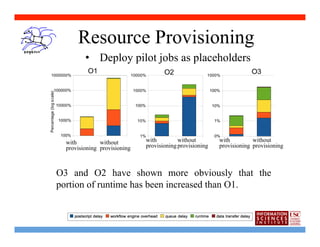


The document presents methods for modeling and analyzing workflow overhead in distributed systems, introducing approaches for calculating cumulative overhead, and reports on experiments applying optimization techniques like job clustering and resource provisioning to evaluate their effects on reducing overhead and improves workflow performance on different computational environments and applications.


![5G Explained! A High Level Overview [Introduction]](https://cdn.slidesharecdn.com/ss_thumbnails/5gexplainedahighleveloverview-260119165306-cc137a3e-thumbnail.jpg?width=640&height=640&fit=bounds)


