

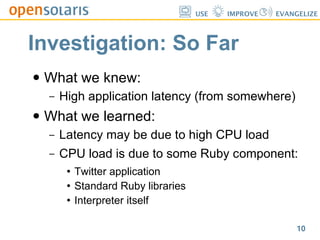

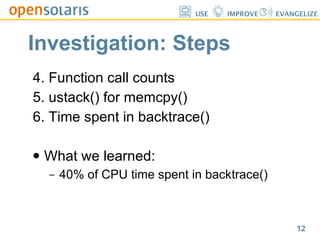

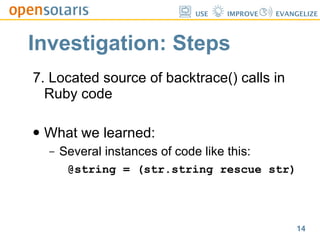
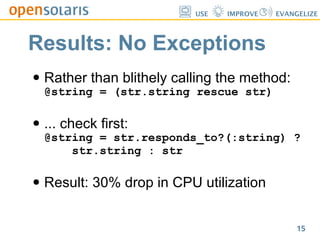

This document summarizes how Twitter used DTrace to investigate performance issues. DTrace helped Twitter identify that 40% of CPU time was spent in backtrace() calls in Ruby code, due to unnecessary exception handling. Removing these checks led to a 30% drop in CPU usage. DTrace also found that rewriting a CRC32 computation from Ruby to C could yield a further 15% CPU reduction. In general, DTrace allows identifying performance bottlenecks and improving application efficiency.


![[Part 1] automation of home appliances using raspberry pi – software installa...](https://cdn.slidesharecdn.com/ss_thumbnails/part-1automationofhomeappliancesusingraspberrypisoftwareinstallationguide-170529121638-thumbnail.jpg?width=640&height=640&fit=bounds)


