
Recommended
More Related Content
What's hot
What's hot (20)
Viewers also liked
Viewers also liked (18)
Similar to Opportunities and Challenges for the 20th Anniversary of the Montreal Protocol
Similar to Opportunities and Challenges for the 20th Anniversary of the Montreal Protocol (20)
Opportunities and Challenges for the 20th Anniversary of the Montreal Protocol
- 1. Opportunities and Challenges for the 20th Anniversary of the Montreal Protocol* Catherine S. Norman * Assistant Professor of Geography and Environmental Engineering The Johns Hopkins University norman@jhu.edu Stephen J. DeCanio Professor of Economics and Director, UCSB Washington Program University of California, Santa Barbara decanio@econ.ucsb.edu Lin Fan Graduate Student Department of Geography and Environmental Engineering The Johns Hopkins University lfan3@jhu.edu September 3, 2007 * Corresponding author. Funding for this research was provided in part by a grant from The American Standard Foundation. The positions and recommendations presented in this paper are ours alone, as is the responsibility for any errors or omissions. We appreciate the research assistance provided by the students in Stephen DeCanio's class on Environmental Policy and Economics, offered during the Winter Quarter of 2007 at the University of California Washington Center: Stefanie N. Berliant, Debbie A. Chan, Jacob T. Cutler, Osman Deger, Ashley B. Frederick, Poonum K. Kaberwal, Ana M. Kim, Qui M. Lam, Shan Shan Lee, Christopher J. Leydig, Liu Liu, Zhao Liu, Kathryn T. Lundquist, Michael R. Munoz, Maritsa P. Norton, Phoebe B. Park, Elaine H. Roark, Ashlee S. Ryan, Rachel S. Soper, and Sarah Stewart.
- 2. 2 Abstract This paper considers the success of the Montreal Protocol on Substances that deplete the Ozone Layer in addressing an incompletely understood global environmental hazard under risk and uncertainty, and its implications for and interactions with other global environmental protection regimes, particularly the Kyoto Protocol. We illustrate a method for assessing joint impacts of projects and policies designed to reduce environmental damage in the absence of a coordinated legal and regulatory framework. Further, we note areas for improvements in coordination and efficiency across the treaties. I. Background When the Montreal Protocol was signed in 1987, scientific understanding of the effects of anthropogenic emissions of CFCs and other halogenated chemicals on the ozone layer was incomplete. The full effects of ozone depletion on human health, other species, and ecosystems were not known. Large uncertainties surrounded estimates of the economic costs of phasedown of ozone-depleting substances (ODSs), in part because of an absence of proven technical alternatives for many of the applications of ozone-depleting compounds. Over the past twenty years, many of these gaps in scientific knowledge and technological capability have been filled in. The Protocol itself has undergone significant evolution, increasing in stringency and participation as evidence on both the severity of ozone depletion and the range of possibilities for substitution away from ODSs became available. The Protocol is now widely viewed as the most successful international environmental agreement to date. It has near-universal membership, an excellent record of compliance, a history of promoting cooperation in the development and diffusion of ozone-friendly technologies, and a record of effective multilateral funding of ODS-reducing investments in developing countries. The success of the Protocol is most clearly evident in the massive reductions in ODS use worldwide since 1986. Ninety percent of ODS use is now in developing countries with ongoing access to Multilateral Fund (MF) monies. Figure 1, from UNEP’s 2005 Consumption and Production Report (p. 16), illustrates the overall trend. Table 1 reports a breakdown of recent usage by annex and Article 5(1) status1 (exclusive of quarantine and pre-shipment (QPS) uses, feedstock, and process agent uses). 1 Article 5(1) countries are, loosely speaking, less developed countries.
- 3. 3 Figure 1 Table 1 2003-2004 Average Reported ODP Consumption* Despite the success to date, opportunities remain to further protect the ozone layer. Remaining significant uses include CFCs, HCFCs, methyl bromide and carbon tetrachloride, as shown in Article 5(1) Countries Non-Article 5(1) Major Uses % total ODP Countries 69753CFCs MDIs, refrigeration2051 48.3 region share of total 0.97 0.03 7406Halons 2.3Specialised fire extinguisher-3952 0HBFCs 0 0 region share of total 17825HCFCs Refrigerant12874 20.7 region share of total 0.58 0.42 6694Methyl Bromide** Soil and building9884 11.2 region share of total 0.40 fumigant0.60 1332Methyl Chloroform 0.7-262 Other Fully 7 Inhaled anesthetic during surgery 0-722 Halogenated CFCs 37Bromochloromethane 0-36 Fire extinguisher fluids 25950Carbon Tetrachloride Solvent, for production of CFCs 17.3-311 * Consumption is production plus imports minus exports and thus can be negative as stocks are drawn down. ** Excludes QPS
- 4. 4 Table 1. Of these, HCFCs and MeBr are still fairly widely used in non-Article 5(1) countries. CFCs are scheduled for 85% phaseout in Article 5(1) countries this year and complete phaseout by 2010; in these countries, 2004 (the last year for which complete reporting is available) levels of consumption were still 40% above the baseline. Carbon tetrachloride was scheduled for 85% reduction from the 1998-2000 baseline in 2005 and is to be eliminated by 2010, though there is a provision for exemptions totaling less than 15% of baseline extending indefinitely. HCFCs are scheduled for phaseout in non-Article 5(1) countries according to the following schedule: 35%, 1/1/04; 65%, 1/1/10; 90%, 1/1/15; 99.5%, 1/1/20; and 100%, 1/1/30. In 2003 and 2004, reported consumption was 40 and 30% of baseline, respectively. In Article 5(1) countries, use of HCFCs can continue to expand prior to a 2016 freeze. Full phaseout is scheduled for 2040. Methyl Bromide for (QPS) fumigation is not yet controlled under the Protocol in any of the Parties. Methyl Bromide is available for non-QPS use in non-Article 5(1) countries only under Critical Use Exemptions (CUEs) agreed to by the Parties. With the exception of CUEs, phaseout was to be complete in 2005. Nonetheless, the process of negotiating these exemptions has proven to be complicated, and the CUEs have been and continue to be significant. In Article 5(1) countries, a 20% reduction from the baseline was required by 2005 and full phaseout is scheduled for 2015. Reported total use in 2004 was just over 40% of baseline. Figure 2
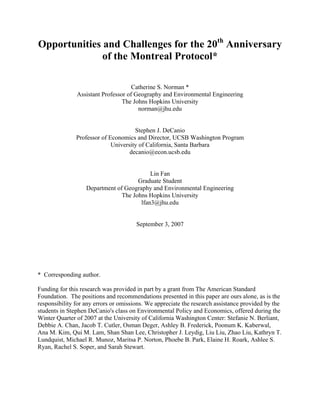
- 5. 5 Total non-QPS MeBr consumption actually increased from 2003 to 2004; Figure 2 shows that the reductions in use have not been as rapid in this sector as in others.2 In the United States, which has received the largest exemptions thus far, 2004 consumption more than doubled 2002 consumption, and 2005-2007 CUEs, while declining from year to year, are for amounts greater than 2004 consumption. Current projections show that ODS phaseout will proceed in an orderly fashion moving forward in time if current goals are met. Figure 3 plots maximum permitted ODS consumption levels in Article 5(1) and non-Article 5(1) countries through 2040, including maximum permitted exemptions where specified. Note that this figure assumes HCFC use is fixed at 2005 levels through 2030 in Article 5(1) countries and declines linearly to complete phaseout, and that no further EUEs or CUEs will be granted. Figure 3 Consumption Phase-Out Schedule 0 30000 60000 90000 120000 150000 180000 2005 2015 2025 2035 2045 Year ODPTonnes A(5) Non_A(5) The achievements of the Protocol are deeper and more far-ranging than the story told by the data alone, impressive as that is. In a time when environmental concerns and strategies to address them increasingly transcend borders, the Multilateral Fund provides a working example of how developed and developing countries can cooperate to solve a vital global environmental problem while simultaneously promoting economic development. The diplomatic formula for the Fund’s financing of “agreed incremental costs” has proven workable in the consensus framework of the Fund’s decision-making process. Political and economic support for the Fund has remained strong, with its periodic replenishments adequate for its financial requirements. On the ground, 2 Figure 2 is from the UNEP Production and Consumption of Ozone Depleting Substances: 1986-2004 (2005, p. 15). The 1994 dip reflects a reporting anomaly rather than an actual reduction.
- 6. 6 the Fund has supported thousands of projects to eliminate ODSs and develop institutional and technological capacity in Article 5(1) countries. This success includes repeated increases in the stringency of the agreement, facilitated in part by a substantial information gathering capacity within the treaty organization itself. The Protocol has a flexible legal framework that allows Parties to incorporate, by Amendment, chemicals that were not included in the original 1987 list of regulated substances. The Parties agreed on several occasions to accelerate the phaseout schedule in the light of new scientific information that emerged during the 1990s and 2000s, and moved from eight initially-controlled compounds to more than 90 (Bird 2001). The Protocol has developed procedures for handling Critical Use Exemptions and Essential Use Exemptions. Its working committees operating under the Technical and Economic Assessment Panel (TEAP) have been a consistent source of reliable, high-quality information, and have greatly facilitated the transfer of technological information across national and corporate boundaries. The TEAP and the Scientific Assessment Panel (SAP) of the Montreal Protocol have also worked with the IPCC to assess the interaction between ozone depletion and climate change.3 Implementation of the Protocol has also produced unanticipated benefits. In some cases, the stimulus provided by the phaseout schedule resulted in research breakthroughs that lowered cost and/or improved quality, and helped overcome institutional barriers that otherwise would have hindered the transition out of ODSs.4 It has been observed that ex ante estimates of the costs of environmental regulations tend to be higher than the actual costs (Harrington et al. 2000, Goodstein 1997), and this pattern has been borne out for the ODS phaseout. Per unit costs of ODS abatement have fallen over time; this finding as reported in DeCanio and Norman (2005) based on statistical analysis of data from the Multilateral Fund through 2003 has been confirmed for Fund data extending through the end of 2006 (see Section III below). Any tendency to take advantage of low-cost abatement opportunities first (the so-called ‘low hanging fruit’ phenomenon) has been dominated by cost reductions over time associated with learning by doing, achievement of scale economies as the new technologies have become widespread, and the possibilities of applying more sophisticated techniques (e.g., computer controls) to problems such as the design and operation of HVAC systems. Despite these successes, concerns remain. The Antarctic ozone hole was of record or near record size for three months of 2006.5 The continuing damage caused by previous ODS emissions and ODS “banked” in old equipment cannot be ignored, given that full recovery of the ozone layer is 3 Significant examples include the IPCC/SAP Special Report on Aviation and the Global Atmosphere (Penner et al., eds., 1999) and the IPCC/TEAP Special Report On Safeguarding the Ozone Layer and the Global Climate System (Metz et al., eds., 2005). 4 For examples of the technological progress and increased productivity brought about by Protocol-induced research, see Cook (1996) and Andersen and Zaelke (2003). For institutional innovations (such as the replacement of a 113- based standard in military specifications by a performance standard), see Wexler (1996). These may be thought of as illustrations of the “Porter hypothesis” that regulatory pressure can stimulate innovation (Porter 1991; Porter and van der Linde 1995a,b). 5 See http://www.cpc.ncep.noaa.gov/products/stratosphere for updates.
- 7. 7 not predicted to occur until mid-century at the earliest.6 The estimated date of recovery has recently been revised upward (NASA 2006). Most significantly, the threat posed by climate change has not yet been adequately addressed by the global community and will affect stratospheric ozone outcomes. James Hansen, a leading climate scientist at NASA in the United States, stated in September 2006 that he believes the world has “no longer than a decade, at most” to take decisive action on anthropogenic climate change (MSNBC News Services 2006). The IPCC released a summary of the first part of its Fourth Assessment Report on February 2, 2007, reporting that climate change is happening rapidly and is being driven by anthropogenic factors, chiefly the use of fossil fuels for energy. The IPCC projects an increasing pace of change for a broad number of future growth and development scenarios. As the health of the ozone layer and the global climate are inextricably connected, the open-ended nature of climate risk means there is no room for complacency regarding the Montreal Protocol’s success to date. In the absence of radically new energy generating technology, socially and politically feasible ways to reduce energy use without massive reductions in the quality of life are critical. The Kyoto Protocol has proposed reductions but has had limited success in reaching agreement among major greenhouse gas emitters and in achieving the reductions for those countries that have committed to the process. Kyoto’s agreed-upon provisions run out in 2012, and the recent agreement by the European Union to achieve a 20% reduction in greenhouse gas emissions from the 1990 baseline does not include the United States, China, India, and other major emitters (Bilefsky 2007). Reductions in CFCs already undertaken by Parties to the Montreal Protocol amount to significant cuts in direct greenhouse effects; CFC-12 emissions, for instance, have been nearly eliminated and this chemical has a direct global warming potential (GWP) estimated at 10,720 (relative to carbon dioxide). The IPCC/TEAP Special Report (2005) cited previous estimates that ODS reductions under Montreal accounted for a 0.5 GtCO2-equivalent annual reduction in greenhouse emissions from 1990 to 2000. The Montreal Protocol has accounted for GHG reductions to date equivalent to approximately five times the reductions that would be accomplished by meeting the first Kyoto target.7 Some large sources of greenhouse gas emissions are only covered by the Montreal Protocol, while Kyoto, which regulates atmospheric emissions of six greenhouse gasses, explicitly excludes all substances listed under Montreal. However, most of the Montreal substances are powerful greenhouse gases, and many of the substances that replace phased-out ODSs are also drivers of climate change. Major sectors using ODS and HFC/PFC substitutes include refrigeration, air conditioning, foams, aerosols, fire protection and solvents (IPCC/TEAP 2005, p. 2). Nevertheless, even given these clear connections between climate and ozone protection (Molina 2007), co-investment to realize joint benefits has been difficult to accomplish under the current treaty frameworks. 6 Estimates are subject to considerable uncertainty about the impacts of changes in climate patterns on ozone accumulation and depletion. 7 Computed from Velders et al. (2007, Table 2), under the assumption that the Kyoto target is approximately 2 GtCO2-eq. per year.
- 8. 8 II. Multi-objective policies for global environmental protection under the Montreal Protocol A. Analytical framework8 In this section, we first lay out a rationale for using information on the value placed on climate and ozone protection by the global community to consider the two impacts simultaneously for particular projects or uses. We present data on expenditures on abatement and emissions permits to estimate the implicit stringency of joint regulation that takes these values into account, and show how a decision rule that incorporates these values might work in practice. Currently, technology exists to support continued progress on ODS reduction with simultaneous significant improvements in energy uses that contribute indirectly to climate change. Further, it is possible that allowing a small increase in anthropogenic ODS emissions might be socially desirable if climate benefits were sufficiently positive. For example, the large variation in the energy efficiency of refrigerants for chillers, air conditioners, and refrigeration – where in many cases the indirect effects account for most of the global warming effect associated with use of the refrigerant9 – implies a significant climate impact as well as ozone impacts for decisions taken under the Montreal Protocol. Parties to both Protocols are aware of their interconnectedness; the 2004 Chiller Task Force report (UNEP 2004) notes with concern the risks to the climate associated with HFC-134a, and in 2005 the Intergovernmental Panel on Climate Change issued a special report in collaboration with the TEAP of the Montreal Protocol, prompted by decisions made within each body. The special report called for the “development of simplified standard methodologies” “to identify cost-effective reduction options” in the future (IPCC/TEAP 2005, p. 11). This paper represents an effort in that direction. The calculation of control levels under the Protocol (Article 3, a) and the definition of production (Article 1, 5) together create a “destruction offset” that allows new production of ODS when offset by destruction an equal or greater ODP-weighted ODS from within the same ‘Group’ of controlled substances if both production and destruction occur during the accounting year. For example, two kilograms of halon 1211 (Group II, ODP=3) can be produced for each kilogram of halon 2402 (Group II, ODP=6) destroyed in the same year. This provision could facilitate progress on climate change while remaining consistent with the Protocol’s focus on stratospheric ozone protection. If the “destruction offset” provision in the Montreal Protocol were implemented with flexibility and appropriate incentives across groups and time, ozone protection could be unaffected or improved while reducing risks of climate change by use of an energy-efficient refrigerant with some ozone-depleting potential. The energy efficiency (and thus climate) gains would be ozone- neutral if an ODP-weighted amount of ODS were destroyed equal to what would be emitted from leak-tight equipment offering superior energy efficiency. Of course, the energy efficiency 8 This section reproduces some parts of DeCanio and Norman (2007a). 9 See the IPCC/TEAP (2005, pp. 276-279), which includes detailed illustrations for air conditioning across different refrigerants, technologies, and climate conditions.
- 9. 9 gains would be ozone-positive if a greater ODP-weighted amount of ODS were destroyed than what would be emitted. Trading schemes can be designed to encourage the proper balance of incentives; an initial step might be to require all trades to be at least ozone and climate neutral. Limited offset credits for ODS destruction are currently embodied in the international framework developed by the Parties to the Montreal Protocol, but have not been implemented by national governments. Nevertheless, current stockpiles of ODS (both in storage and in existing equipment) are large enough to allow considerable room for such efforts. In the case of large building chillers, for example, there is ample existing ODS (which will eventually be released into the atmosphere) to more than offset decades of use of the HCFC-123 that would be used in the most energy-efficient chillers or of other HCFCs that may be difficult to replace given current technology. Offsetting this HCFC-123 with destruction of equivalent ODS would enable progress towards both ozone protection and climate stabilization goals. The Parties could choose a policy rule requiring that the total estimated depleting effects produced by offsets and trading are equal to or less than those under the business-as-usual regime (Solomon and Albritton 1992). This might require flexibility among groups of ODS and the ability to carry forward unused credits (such that production and destruction need not occur in the same calendar year). Other examples of the potential value of a destruction tradeoff can be considered. Rather than going through a contentious process of application for Critical Use Exemptions for Methyl Bromide each year, the Parties to the Protocol could agree to new flexibility across ODS and over time to allow MeBr emissions offset by assured destruction of other ODS not otherwise scheduled to be destroyed, at an agreed amount of MeBr production for each quantity of ODS destroyed. The costs of the destruction could be borne by the Parties’ governments, thereby alleviating the economic burden on MeBr users, or could be financed from user fees, as each Member state sees fit. In other cases, unpredictable technological change makes it likely that the precise substitution possibilities will not be known in advance. This speaks for the desirability of a general policy rule, rather than repeatedly going back to the Protocol Parties for specific exceptions. Thus, a flexibility mechanism built into the Protocol stating the circumstances under which an ODS can be used provided an equivalent or greater amount of ODS is destroyed would minimize regulatory uncertainty and the costs of negotiation. An improved market for recovered ODS would also allow governments to protect the ozone layer by paying for collection and destruction and retiring the credits. Beyond the general desirability of a broad destruction offset mechanism for efficient ozone protection, it is also possible to evaluate tradeoffs between the global warming and ozone impacts of the chemicals regulated exclusively under the Montreal Protocol. Implicitly, values on reductions of ODP and GWP/TEWI/LCCP10 have been and are being determined by member 10 The “life-cycle climate performance” or LCCP is a measure of the total effect on GHG emissions of a change in technologies, including both the direct global warming impact of the emissions and differences in indirect emissions due to differences in the energy efficiency of the technologies over their lifetimes. Reduction of LCCP mitigates climate change. LCCP is more comprehensive than the earlier concept of “total equivalent warming impact” (TEWI), which ignored the energy embodied in product materials, the greenhouse gas emissions during chemical manufacturing, and the impacts of weight on energy consumption of mobile equipment. LCCP was defined by the HFC and PFC Task Force of the TEAP (1999). It is being incorporated into a consensus methodology for evaluating mobile air conditioning efficiency by a VDA [Verband der Automobilindustrie, or German Association of the Automotive Industry]/SAE [Society of Automotive Engineers]/JAMA [Japan Automobile Manufacturers’
- 10. 10 parties to both Kyoto and Montreal as well as the carbon markets being established in Europe and the United States. The most direct approach, to compare the benefits of climate change mitigation and ozone layer protection, is impractical because these benefits are extraordinarily difficult to quantify.11 The aggregate benefits can be monetized only by making dubious assumptions about the “value of a statistical life” across countries at different stages of development; there is no universally accepted method for comparing costs and benefits across generations; and the key role of risk aversion in addressing climate policy opens up issues not ordinarily addressed in the cost-benefit framework12 Furthermore, estimates of the macroeconomic cost of greenhouse gas reductions range from negative to positive, with the magnitudes of the positive cost estimates differing by as much as a factor of four.13 Even if the aggregate impacts were known with more certainty than can be achieved with present information and analytical capabilities, the response curves of impacts to changes in greenhouse gas or ODS emissions are almost certainly non-linear, so the marginal effect of specific projects cannot be inferred from aggregate effects. More fundamentally, it is debatable whether cost- benefit analysis is the appropriate tool for analysis of problems that are global in scope, non- marginal in impact, cover centuries of time, and involve the fate of non-human species as well as human beings.14 Nevertheless, we can infer social values based on the real money has been and is being spent to reduce both ODS and GHG emissions.15 The current expenditures for emissions reductions provide a benchmark of the “political willingness to pay” (PWTP) of present-day governments (DeCanio and Norman 2005). Political willingness to pay reflects collective decisions to finance essential functions of society such as national defense, public health, education, and environmental protection, even when traditional cost-benefit calculations are inappropriate or Association] team chaired by General Motors (Hill 2006). The original TEWI methodology was implemented in S. K. Fischer et al. (1991, 1994) and Sand et al. (1997). 11 Computations of the net losses from ozone depletion and global temperature increases have been published (for the ozone case, see DeCanio (2003a); for climate, see IPCC (1996, pp. 178-224; 2001, pp. 913-967), and HM Treasury (2006, Chapter 6). It should be kept in mind that very large uncertainties must be attached to these numbers, for reasons given in the references cited. 12 With regard to the treatment of risk in climate policy, see Hall and Behl (2006) and in particular the forthcoming review by Martin Weitzman (2007) of the Stern Review. 13 See Baker and Ekins (2004), DeCanio (2003b), and Sanstad et al. (2001) for extended discussions of macroeconomic cost estimates. 14 On the limitations of cost-benefit analysis, see Ackerman and Heinzerling (2005) and DeCanio (2006). 15 It should be noted that in this paper we will assume the automatic desirability of those emissions-reduction projects that can be undertaken at a pure profit by private-sector firms or governmental agencies. These “no regrets” opportunities should be seized regardless of their environmental benefits, and are uncontroversial from a policy perspective. There is an extensive literature documenting the existence of these no-regrets opportunities for both GHG and ODS emissions reductions. See IPCC, Contribution of Working Group III (1996, Chapters 8 and 9) and Interlaboratory Working Group on Energy-Efficient and Clean-Energy Technologies (2000) for GHG opportunities, and Cook (1996) for ODS cases.
- 11. 11 impossible. Although decisions to invest in ozone layer protection and climate change mitigation have been made independently, expenditures on these projects provide a basis for estimating the current level of combined regulatory stringency of the two Protocols. Consider a two-dimensional mapping of project characteristics with reductions in ODP per dollar spent on one axis and reductions in emissions according to “life-cycle climate performance” or LCCP per dollar on the other. Data on the money spent to eliminate or reduce ODSs can be drawn from the database maintained by the Multilateral Fund operating under the Montreal Protocol,16 or from case studies of ODP reduction projects undertaken by firms or government entities. From these data we can infer the maximum PWTP to reduce ODP, as well as various measures of the central tendency of this PWTP. Similarly, information is available on the cost of GHG reduction projects undertaken by private firms, international projects certified under the Clean Development Mechanism of the Kyoto Protocol, and the prices of CO2 emissions permits LCCP reduction/$ ODP reduction/$ Greater regulatory stringency Region of clearly justifiable tradeoff ODS reduction projects undertaken by MLF GHG reduction projects or carbon price Figure 4 - Balancing ODS and GHG Reductions A B A' B' D C E F where traded. The ODP or LCCP reductions per dollar spent on these projects can be represented by points along the two axes as shown in Figure 4. The circles on the axes represent 16 This institution finances the “agreed incremental cost” of ODS replacement projects in developing countries with contributions from the developed countries according to the UN funding formula. See Andersen and Sarma (2002) and Benedick (1998).
- 12. 12 the emissions changes per dollar of the different projects (either ODP or LCCP reductions).17 The square “dots” reflect the fact that most ODP reductions have also reduced the global warming impact of the transformed processes, either because the new technologies have used gases with a lower direct GWP than the CFCs they replaced, or they are more energy-efficient, or both. Nevertheless, it is possible for an ODP reduction to be associated with an increase in GHG emissions due to indirect effects associated with energy use, so that the “improvement” in LCCP/$ is negative. These cases show square dots below the horizontal axis. The diagonal “stringency tradeoff line” AB is drawn to reflect the combined degree of stringency implicit in the two regulatory regimes. This line connects the central tendencies (e.g., the means or medians) of the distributions of the LCCP reduction project points and the ODP reduction project points. Shifting the AB line towards the origin represents an increase in regulatory stringency; if the axes had been drawn in units of $/ODP reduction and $/LCCP reduction, increasing regulatory stringency would be expressed by a movement away from the origin.18 The slope of AB is a rough measure of the dollar tradeoff between LCCP reductions and ODP reductions embodied in current levels of PWTP. The tradeoff line could also have been drawn in other ways. For example, the dotted line A'B' connects the most expensive emissions reduction projects. It could be maintained that A'B' more accurately reflects the PWTP frontier than AB, because all projects currently funded lie above and to the right of A'B'. Alternatively, if it were decided under the successor to Kyoto that there should be (for example) a fixed global emissions charge per annual tonne of CO2 production, the anchoring point of the AB line on the vertical axis would be at the reciprocal of the fee, with the LCCP axis scaled in tonnes of CO2 equivalent per dollar. The area above and to the right of the AB line (or A'B', if the more inclusive definition of PWTP is used as the standard) represents those projects that are desirable at the depicted levels of regulatory stringency of the two Protocols, while projects falling in the area below and to the left of the line AB (or A'B') are less desirable. This is not to suggest that projects on the axes below point A or to the left of point B should not have been undertaken. Indeed, if A and B are central tendencies, a considerable number of projects will lie on either side of the stringency boundary by definition. It may also be the case that PWTP has not yet caught up with the socially desirable degree of emissions reductions, so that a shift of AB (or A'B') down and to the left would improve general welfare. This conceptual framework offers several advantages. First, it enables policy-makers to evaluate projects having both global warming and ozone-protection benefits in a unified way, given the current levels of regulatory stringency implicit in the two Protocols. Second, it shows how 17 The “data points” shown in Figure 4 are indicative only. Note also that the larger the LCCP reduction per dollar (i.e., the farther up the vertical axis), the greater the environmental benefit. Figure 6 below shows the same framework with actual data. 18 The choice of whether to use ODP/$ and LCCP/$ or $/ODP and $/LCCP as units on the axes is arbitrary. The substantive application of the methodology is not affected, so long as consistency is maintained in describing the projects. Of course, the tradeoff line could have curvature, but that is a second-order consideration that will not be discussed here.
- 13. 13 projects might be compared in the cases in which one is not preferable to the other along both dimensions. Thus, in Figure 4, Project C is preferable to Project D because C results in more cost-effective reductions of both ODP and LCCP. But what about comparisons between Project D and Project E, or between Project D and Project F? All three lie in the region above and to the right of line AB, so arguably all three should be undertaken at current levels of regulatory stringency. However, E is preferable to D at the current tradeoff rate between LCCP/$ and ODP/$ as indicated by the slope of AB. Similarly, D is preferred to F at the tradeoff rate illustrated by AB, but F could be preferred to D if the slope of the tradeoff line were steep enough (i.e., sufficiently negative). B. Aggregated data from the Multilateral Fund and global carbon reduction markets Decisions made by the MF form a rich dataset on the actual costs of ODS abatement thus far.19 Decisions made to date suggest that a conservative estimate of the political willingness to pay for Table 2 – Summary Statistics ODP-tonnes/1,000 US Dollars* Min 0.000247 Max 14.093 Mean(Raw; n = 2,296) 0.158 Median 0.105 Fifth percentile 0.021 Ninety-fifth percentile 0.413 Mean(central 90% of data points; n = 2,068) 0.121 Mean(central 90% weighted by Grant) 0.105 Mean(central 90% weighted by ODP ton) 0.107 Tenth percentile 0.037 Ninetieth percentile 0.273 Mean(central 80% of data points; n = 1,838) 0.114 Mean(central 80% weighted by Grant) 0.087 Mean(central 80% weighted by ODP ton) 0.075 * Prices converted to 2006 dollars reductions in ozone depleting chemicals, based on central tendencies, lies around $8,300 to $10,000 per ODP tonne (1,000/0.12 to 1,000/0.10). Table 2 shows summary statistics for projects reducing ODS usages under the MF. A variety of data is also available on amounts paid to reduce GHG emissions, though it is less consistent in terms of types of payments and in reporting. Hasselknippe and Roine (2006) provide some insight into payments under the Kyoto Clean Development Mechanism (CDM), 19 The authors would like to thank Julia Anne Dearing for providing this data and updates to it on several occasions.
- 14. 14 with the caveat that their survey suggests many players in these markets do not view them as fully mature yet. Trading in CO2 emissions markets has been increasing rapidly, with 94 million tonnes traded internationally on all markets in 2004 and 799 million tonnes traded internationally in 2005. Carbon prices have averaged about $6.30/Annual TnCO2-eq in recent years. Lecocq and Capoor (2005) show project-based funding averaging from less than $ 2 to $ 6 per tonne, depending on the type of project, from January 2004 through April 2005. Current and futures values from carbon markets, though volatile, are also available. Figure 5 shows prices for current carbon allowances on ECX, the best developed and largest of the carbon exchange markets. Other significant markets exist, both in countries committed to Kyoto reductions and in uncommitted countries. As would be expected, the largest US market, the Chicago Climate Exchange (CCX), has lower prices than the carbon markets in locations with regulatory caps on emissions; the highest price to date was around $5 in June of 2006, when the US Congress included a statement in support of mandatory caps in a spending bill for 2007. Figure 5 - ECX Allowance Carbon Market Price 2006 0 5 10 15 20 25 30 35 40 45 3-Jan-06 8-Feb-06 16-Mar-06 25-Apr-06 1-Jun-06 7-Jul-06 14-Aug-06 19-Sep-06 25-Oct-06 30-Nov-06 Dec07_$ Prices on ECX for current permits have recently fallen to all-time lows, a cause for concern to some observers. The drop in the Spring of 2006 was associated with a downward revision of the baseline emissions levels in the countries of the EU. Prices for Phase 2 permits, which will be less numerous than Phase 1 permits, (Phase 1 permits cannot be carried forward) are higher – December 2008 permits are selling for around USD20/tonne, and prices past 2011 (when jet fuel purchased in the EU will require permits) are still higher. There is little doubt that some sort of Phase 3 will be implemented (Morrison 2007).
- 15. 15 It is important to note that carbon permit prices quoted on the ECX are for a single annual tonne of emissions, while the data from the MF are from projects to eliminate usage of an ODS for the indefinite future. Thus, a tonne of abatement under the MF is a tonne of ODS every year from the present onward. For comparability between the two types of data, it is necessary to convert the ECX data to a price for permanent removal of the annual emissions stream. In the absence of detailed project information, a rough approximation might consider the anticipated lifetime of the equipment changed, so CO2 emissions of a project to switch refrigerants in a chiller expected to last twenty years would be valued at twenty times the annual emissions price per tonne. An alternative might be to sum up futures prices over twenty years, but given the rapid evolution of the carbon markets this seems unlikely to add meaningful precision (as well as being subject to the limitation that futures contracts this far out are not being traded). Either method could be discounted using an agreed discount rate. Under conventional discounting, impacts more than 25 years out are very small contributors to total value of abatement of a stream. It is more consistent with considerations of intergenerational equity to use equipment lifetimes to convert annual emissions permits to “permanent” CO2 reductions rather than to use discounted future values.20 As more information about possible ‘tipping points’ for climate change impacts emerges, emissions reductions at different times may well be valued differently by policymakers; this valuation could of course be incorporated into our proposed framework. Figure 6 displays a subset of the MF data, as well as estimated costs of permanent CO2 reductions from a variety of markets, both permit-based and project based. Each tonne of ODS eliminated by an MF project is assigned a direct global warming impact based on its GWP only, not its full LCCP. The blue diamonds in Figure 6 reflect the direct effects of MF projects. Only half the MF projects (the most expensive half in terms of cost per unit of ODP eliminated) in the current MF database are represented; the other half of the projects are so cost-effective they are literally “off the chart” because if they were plotted, these points would be so far above and to the right of the stringency tradeoff line that they would not fit into the diagram with the axes as drawn. The multicolored points on the vertical axis are based on estimated carbon prices converted into GWP/$ units. To be consistent with the project-based market price, permit-based prices for 2005 through 2007 are multiplied by a lifetime of 20 years, which makes the unit dollar measure of the global warming potential benefits so small that they clustered on the range of 0.001-0.01GWP/$ on the vertical axis. Prices from aggregate data on project-based reductions are treated as ongoing reductions, because many of these are intended to provide ongoing abatement. Prices from permit sales are based on weighted averages from the ECX market from 2005 through January 2007. The two sharp lines in the data are CFC-12 (upper) and CFC-11 (lower). All projects that involve replacement of a single ODS will lie along a straight line, because the ratio of a chemical’s ODP and its GWP per tonne is fixed by its physical characteristics. The CFC-12 and CFC-11 replacement projects are the most numerous, so the straight lines marking projects to replace these two chemicals stand out in Figure 6. The linear relationships between ODP/$ and GWP/$ for the other chemicals are not as sharply visible because of the multiplicity of compounds covered and the fact that many projects entail changes in use of several compounds simultaneously, at ratios varying from project to project. 20 See the Stern Review (HM Treasury 2006), and the reviews of it by Weitzman (2007) and Dasgupta (2006) for discussion of discounting complexities.
- 16. 16 Figure 6 – Actual MF Projects and GWP Reduction Costs 0.00 0.10 0.20 0.30 0.40 0.50 0.60 0.70 0.80 0.90 1.00 1.10 1.20 0.00 0.05 0.10 ODP/K$ GWP/$,CO2e/$ Stringency Tradeoff Line Using central tendencies of this data (as in DeCanio and Norman 2005) is a conservative approach to estimating PWTP; in some sectors, such as MeBr phaseout, costs have been considerably higher, and in principle the highest-cost projects undertaken by the MF (which operates by consensus) could be considered a better measure of PWTP. However, some funding may have been associated with considerations other than or in addition to ozone protection, or may reflect uncertainty of what constituted reasonable costs in the earliest stages of the phaseout. For this reason we have drawn the stringency line from the 95th percentile on the ODP axis (at 0.021 ODP tonnes/thousand dollars) to the point of the “average” $7.66/TnCO2-eq (or 0.131 GWP TnCO2-eq/dollar) on the LCCP axis. This point is somewhat arbitrary; the carbon price data remains quite noisy, and more work is needed to obtain a fully consistent set of data that would enable calculation with any real confidence the PWTP for CO2 reductions based on observed behavior. To be more general, policy conclusions based on the graph of projects as shown above could be based on the agreed values of carbon and ODP abatement that yield a combined “stringency
- 17. 17 line”. For example, with a stringency line AB as shown in Figure 4, where intercepts are , the line is defined as:( ,B AO G ) A A B G y x O = − + G (*) Where x represents the ODP/K$ on the horizontal axis and y represents the GWP/$ on the vertical axis. To choose among projects D, E and G, we could use the equation (*) to calculate where a policy point lies with respect to the stringency line, as well as the distance from the line. Agreeing on a stringency line could also highlight worthwhile abatement efforts in countries without access to the MLF monies. Consider also that Parties to the Protocol allow uses by enterprises in developed countries that are less expensive to eliminate per ODP tonne than the price paid to phase out the same quantity of ODS through the MLF. For example, if farmers of tomatoes in Florida and strawberries in California paid a surcharge on the methyl bromide they use, they would likely shift to alternatives more rapidly. In many cases the alternatives are nearly cost competitive or cost saving after investment costs and training are recovered. C. Some particular examples Calculating global warming impacts correctly is not just a matter of the chemistry of the substance considered. In many if not most cases, the prime drivers of climate change are the fuels that produce energy to manufacture and use the chemicals. This ‘indirect’ effect is in some cases the dominant source of climate impacts for an application. The importance of the indirect effect can be seen by consideration of the case of large centrifugal building chillers. Before the Montreal Protocol, this equipment mostly used CFC-11 as its working fluid. Eliminating CFC-based chillers still in use (and destruction of their embodied CFCs) would be of significant benefit to the ozone layer. Worldwide, there are approximately 65,673 – 105,076 CFC chillers containing 24,173 – 38,676 ODP-weighted tonnes of CFC.21 It has been estimated that there are 15,000 – 20,000 of these chillers in Article 5(1) countries, where the CFC phaseout date is 2010 (UNEP 2004, p. 23). Globally, there were about 120,000 chillers using a variety of refrigerants in the mid-1990s; precise estimates after this period are not available. Minimum leakage estimates are one tonne of CFCs for every 20 chillers every year (with high end estimates of ¼ tonne each per year), so a considerable volume of CFC will be emitted even if the remaining CFCs were captured and destroyed when the chillers are replaced at the end of a normal lifetime. 21 This conservative estimate was calculated from data in UNEP (2002). It is based on the estimates for the United States, Canada, and India given in that report, and the judgment that “[p]erhaps this accounts for 25-40% of the CFC chillers in service around the world” (ibid., p. 108). Details of the calculation are available from the authors. This 2002 Report notes that “[a]ccurate inventories of equipment in service around the world, and the types and amounts of refrigerants used in these chillers, are not available” (ibid., p. 108), so this sort of rough estimate may be the best that can be done in the absence of better data. Interestingly, UNEP (1994), using different sources and methods, estimated the 2007 inventory of CFC-11 in commercial chillers to be 26,583 tonnes, which is within the range given in the text.
- 18. 18 Today the two main competing replacement technologies are based on HCFC-123 and HFC- 134a. HCFC-123 has a slight ODP while HFC-134a has none, but the direct GWP of HFC-134a is ten times greater than that of HCFC-123. The relative direct ODP and GWP values are given in Table 3. _____________________________________________________________________________ Table 3 – Comparison of ODP and GWP of Chiller Refrigerants Capacity ODP Reg(Sci)* GWP (100-year) HCFC-123 .40kg/kW 0.020 (.012) 120 HFC-134a .36kg/kW 0.000 1300 *Reg is the official Protocol value; Sci is the value based on current science. Data from 2004 TEAP Chiller Task Force Report: Tables 2-2: Centrifugal Chiller Refrigerants and Charge Levels, and 2-4: Environmental Data for Chiller Refrigerants _____________________________________________________________________________ Even though GWP applies only to direct emissions, it should be noted that these emissions are documented to be substantially higher in HFC-134a systems because these are high-pressure systems while HCFC-123 is un-pressurized or at vacuum pressure during normal chiller operation and is a liquid at common operating temperatures (UNEP 2002, p. 118). A leak in a HFC-134a system discharges the pressurized greenhouse gas refrigerant, while a leak in a HCFC-123 system draws air into the system which is separated from the refrigerant by a component unique to HCFC-123 machines. The IPCC/TEAP Special Report estimates emissions from stationary air conditioning related to use of CFCs, HCFCs, and HFCs at a little less than 0.3 GtCO2-eq in 2002, and projects these emissions to increase to about 0.4 GtCO2-eq per year by 2015 under a business-as-usual scenario. These estimates are for direct effects only; the report notes that “[f]or individual applications, the relevance of indirect GHG emissions over a life cycle can range from low to high, and for certain applications may be up to an order of magnitude larger than direct GHG emissions” (IPCC/TEAP 2005, p. 10). The Special Report also notes that direct emissions associated with building cooling and heating can be reduced by 200 Megatonnes (Mt)CO2- eq/year relative to the BAU scenario, at costs (not accounting for savings associated with reduced energy consumption) of up to $170 USD/tCO2-eq, by better disposal, reduced refrigerant charges, better containment, and use of alternative refrigerants in some applications. Importantly, modern chillers using HCFC-123 are at least 10.5% more energy-efficient than HFC-134a chillers (UNEP 2004), so the indirect global warming impact of an HFC-134a chiller over its decades-long lifetime is much greater than that of an HCFC-123 chiller. The ICCP/TEAP Special Report (p. 285) notes that “the major portion of LCCP [for chillers] is the indirect warming associated with energy consumption. Direct warming…amounts to between 0.2
- 19. 19 and 3 percent of the total LCCP.”22 Refrigeration of varying sorts constitutes a significant fraction of electricity use globally, and coal-fired electricity generation is responsible for a large portion of global carbon emissions.23 Thus, the continuing use of HCFC-123 chillers if ODS emissions are offset is an example of an unambiguous benefit to global environmental protection, and it is arguably beneficial to allow the continuing use of HCFC-123 chillers even if the emissions of refrigerant are not offset, depending on the tradeoff between ozone and climate protection considered appropriate by the international community. However, under current rules, HCFC-123 (because it has a non-zero ODP) is scheduled for 99.5% phaseout by 2020 in non-Article 5(1) countries24 and for full phaseout by 2040 in Article 5(1) countries. HFC-134a is regulated under Kyoto but not Montreal, and as such is not currently projected for phaseout. As long as this lack of coordination persists, investments in chillers are likely to favor HFC-134a, with consequences for emissions of greenhouse gases for decades. China’s growing chiller market, already the largest in the world, currently invests in HFC-134a chillers about 70% of the time (IPCC/TEAP 2005, p. 283). Chillers have a lifetime of up to 40 years; if the ability to maintain and service them is in doubt, the significant energy savings associated with a more efficient refrigerant may not be sufficient to prompt investment at the level a multi-objective plan would find desirable. III. Other issues for the Montreal Protocol moving forward Perhaps the most important lesson learned so far from experience in implementing the Montreal Protocol is that the technological and economic disruptions accompanying replacement of ODSs with ozone-friendly technologies have been much less serious than originally feared. Also, the Protocol has stimulated both R&D and institutional change that have improved product quality and profitability in unanticipated ways. The progressive nature of the ODS replacement process is seen perhaps most clearly in the robust trend of falling costs per ODP eliminated. The magnitude of this trend can be estimated from the data on ODS replacement projects approved by the Multilateral Fund. Statistical analysis of this data demonstrates that the cost per unit of ODP eliminated has declined over time. Table 4 summarizes the analysis, and reproduces the results published in DeCanio and Norman (2005) for comparison. The earlier regression results, which were based on MLF data available through early 2003, are quite similar to the identical regression specifications estimated using the full body of MLF data through 2006. Estimating the parameters of the same regression 22 Precise estimates of the differing lifetime impacts are difficult, as set temperatures, outdoor temperatures, and other characteristics of the building and the cooling system affect energy use for all types of refrigerants. However, the Special Report does present several case studies of ‘typical’ settings for different-capacity units in different climates, all of which show that total direct and indirect warming effects are meaningfully larger for HFC-134a than for HCFC-123. Generally HCFC-123 has the lowest total impact of all examined refrigerants (pp. 285-287). 23 For example, the MARKAL model used by the U.S. EPA estimates 9% of electricity consumption in the U.S. is by building chillers (ETSAP 2004; Shay et al. 2006). 24 In some major manufacturing countries phaseout is scheduled sooner; the U.S. Clean Air Act calls for phaseout of HCFC-123 in new equipment by 2020.
- 20. 20 model on an earlier, less complete dataset and a later, more extensive dataset constitutes a kind of “natural experiment” that is unusual in the study of social phenomena. Table 4 contains estimates for regressions on MeBr projects only, all-ODS projects without dummy variables for the sectors in which the ODSs were replaced (i.e., refrigeration, foams, solvents, etc.) and all- ODS regressions including dummy variables for the different application sectors. The variable denoting the time trend is Meeting Number, which advances at a rate of approximately three meetings per year.25 Comparison of the two sets of regression results reveals a very clear declining trend in per-unit cost of ODP replacement, except in the case of the coefficient of Meeting Number in the all-ODS regression on the full dataset without the sectoral dummy variables. The trend does not appear in this regression because by the end of 2003 the composition of projects supported by the Multilateral Fund had changed because the phaseout of the ODSs in some applications was essentially complete. Hence, omission of the sector dummy variables conflates the change in composition of projects with the trend, rendering the estimate of the trend coefficient unreliable. The all-ODS regressions including the sectoral dummy variables (the rightmost column of Table 4) are the clearest manifestation of the results of the natural experiment.26 Table 4 Ordinary least squares regressions of cost (1,000s of 2002 US $) per ODP-tonne on meeting number, project size, and sector variables, Multilateral Fund-approved projects through March 2003 Sample of Projects Variable MeBr only All ODS All ODS Constant 99.91(3.97)** 18.47(20.78)** 20.94(13.36)** Meeting Number -1.33(-1.80)† -0.19(-5.53)** -0.19(-5.54)** Project Size -0.76(-4.57)** -0.024(-9.93)** -0.023(-9.51)** (Project Size)2 3.52E-03(3.15)** 6.60E-06(7.38)** 6.34E-06(7.09)** (Project Size)3 -4.52E-06(-2.57)* -4.40E-10(-5.98)** -4.23E-10(-5.75)** Sector Dummies -- No Yes Observations 39 1960 1960 Adjusted R2 0.508 0.061 0.067 F Probability-Value ~ 0 ~ 0 ~ 0 25 Chow tests of the model with sector dummies show that the data are most suggestive of a structural break around the end of 2002. Results of these tests are available from the authors. We report the previously published results to emphasize the consistency of the regressions on the full dataset with the previously published results. 26 The MeBr and all-ODS regressions without the sectoral dummies are included to emphasize that the previously published results were simply replicated using the updated information from the MF. Identical regression models were run, and there was no “adjustment” of data or models to improve the fit, appearance, or reported statistical significance of the results.
- 21. 21 Ordinary least squares regressions of cost (1,000s of 2002 US $) per ODP-tonne on meeting number, project size, and sector variables, Multilateral Fund-approved projects through November 2006 Sample of Projects Variable MeBr only All ODS All ODS Constant 87.45(9.11)** 13.30(18.54)** 18.45(9.82)** Meeting Number -1.24(-5.40)** 0.026(1.06) -0.14(-5.41)** Project Size -0.45(-5.00)** -0.022(-10.93)** -0.022(-11.94)** (Project Size)2 0.0018(3.20)** 5.92E-06(8.06)** 6.29E-06(9.55)** (Project Size)3 -1.99E-06(-2.46)* -3.95E-10(-6.38)** -4.29E-10(-7.79)** Sector Dummies -- No Yes Observations 91 2265 2265 Adjusted R2 0.424 0.055 0.279 F Probability Value ~ 0 ~ 0 ~ 0 Notes: (1) Outliers with cost per ODP-tonne > US$ 110k omitted (2) t-statistics in parentheses: * two-tailed Probability-value < 0.05 ** two-tailed Probability-value < 0.001 † one-tailed Probability-value < 0.05 Given that MF meetings to approve projects occur on average every four months, the all-ODS regression (with sectoral dummies) on the complete dataset indicates that the cost per ODP-tonne removed from the atmosphere has been declining at a rate of approximately $ 420 per year since the Fund began supporting investment projects. This empirical result indicates the importance of regulatory certainty, economies of scale, and learning by doing in bringing down the costs of technologies to replace ODSs. It also supports the notion that regulatory stringency can be increased as costs fall over time. Regulatory certainty makes it easier for firms to plan their investments optimally, stimulates R&D, reduces wasteful rent-seeking behavior associated with negotiating increases in stringency separately, and rewards innovators while promoting diffusion of the most environmentally friendly and cost-effective technologies. This is especially valuable for capital investments that last for decades.27 In proceeding to the Protocol’s “endgame,” it is also important to avoid mixing together the phaseout regime with the issues of the equitable distribution of the costs of the regulations. For example, in the case of the phaseout of CFCs from metered-dose inhalers (MDIs), a distinction needs to be drawn between efficient policy to protect the global public good of the ozone layer 27 See DeCanio and Norman (2005) for references to the benefits of regulatory certainty, and for references to the large literature on learning by doing and economies of scale.
- 22. 22 and the policies of the individual Parties’ governments required to insure that low-income citizens do not lose access to essential medicines as the price of non-CFC MDIs goes up (see DeCanio and Norman 2007b for a full discussion of this case; the point about the distribution of costs within countries is also made in DeCanio and Norman 2005). It is up to the individual Parties to assure equitable sharing of any burdens of the ODS phaseout among their citizens; it is not appropriate to ask the language of the Protocol (or the international institutions created by it) to solve the internal domestic political issues of distribution. Most relevant to the present discussion of assessing environmental concerns in a global context is the necessity of coordinating international ozone protection and climate protection efforts. The two regulatory efforts are already connected implicitly (see Section II), but failures of coordination have created loopholes and inefficiencies in providing global environmental goods. For example, the provision of the Montreal Protocol’s phaseout process that allows developing countries to increase their production and use of HCFCs through 2016 was decided from an ozone-only perspective, but in conjunction with provisions of the Kyoto Protocol it can create perverse incentives. A developing country might expand production of HCFC-22 beyond its immediate needs, in order to obtain Clean Development Mechanism (CDM) credits under Kyoto by destroying the HFC-23 that is a byproduct of the HCFC-22 production process. The IPCC/TEAP Special Report notes that “destruction of byproduct emissions of HFC-23 from HCFC-22 production has a reduction potential of up to 300 MtCO2-eq per year by 2015 and specific costs below 0.2 US$/tCO2-eq according to two European studies in 2000” (p. 15). Wara (2006, 2007) discusses the intentions and outcomes of the CDM process, noting that revenue from the CDM was expected to promote the development of cleaner energy infrastructure in developing countries, which was presumed to be cheaper than retrofitting existing developed- world energy generation. Instead, the bulk of the CDM monies have gone to relatively expensive subsidies for the destruction of chemical byproducts like HFC-23.28 Proper coordination of the two Protocols would entail simultaneous accounting for the impacts of the HCFC-22 and HFC- 23 that are jointly produced. It would not then be possible to exploit the provisions of one the Protocols at the expense of the other. We have already argued that increased flexibility for destruction offsets should be built into the Montreal Protocol. To do so in a consistent and verifiable way would require much more active management of ODS stocks (including those embodied in existing equipment) rather than exclusive focus on production and consumption. End-of-life emissions are increasingly an area of opportunity for reductions. As a reflection of this reality, the Parties might (1) require regular estimation and reporting of ODS stocks along with their reporting of production and consumption and (2) permit only ODS consumption that is offset by destruction of stocks that otherwise would be emitted (i.e., that are not already subject to required destruction, or, more stringently, stocks that are uncontained and likely to be emitted in the future) at an agreed-upon ratio. Better control and monitoring of stocks would also facilitate more effective enforcement of other protocol provisions, particularly control of illegal trade in ODSs. 28 Wara (2006) also notes that HFC-23 destruction linked to HCFC-22 production accounts for 37% of current and projected CERs; non-CO2 projects are more than 70% of the total.
- 23. 23 A number of additional issues warrant consideration in advancing the objectives of the Protocol. The Quarantine and Pre-Shipment application of Methyl Bromide is an application that is growing rapidly at this time. Leveling the regulatory playing field through clear phasedown schedules, fees and/or required destruction offsets would promote innovation and environmental efficiency. It would be desirable to have greater coverage and standardization in the reporting of data from and regulation of feedstock and process applications. New ozone-depleting chemicals may be developed, or as has been the case in the past, chemicals currently in use but not listed by the Protocol may be found to be ODSs. Currently, several compounds with known or suspected ODP are not subject to a phaseout timetable under the Protocol; some examples include hexachlorobutadiene, n-propyl bromide, 1,3,3-trichloropropenes, and ethane. It might be advisable to include in the Protocol a generic provision to include such compounds in the phaseout as they are identified; here again, the possibility of using destruction credits to manage the timing of the phaseout of such ODSs would increase transparency and avoid unnecessary emissions. Eventually, it might even be possible to implement trading “across Protocols” within a regulatory framework where ODP could be exchanged for LCCP according to the prevailing stringency tradeoff. Such trading would be premature at the present time because there is no assurance that the current PWTP for either ODS or greenhouse gas emissions reductions corresponds to the social, economic, and environmental benefits of avoiding those emissions, but the possibility of trading across Protocols in the future should not be ruled out.
- 24. 24 References Ackerman, Frank, and Lisa Heinzerling, 2005. Priceless: On Knowing the Price of Everything and the Value of Nothing. New York: The New Press. Andersen, Stephen O., and Durwood Zaelke, 2003. Industry Genius: Inventions and People Protecting the Climate and Fragile Ozone Layer. Aizlewood’s Mill, UK: Greenleaf Publishing. Andersen, Stephen O., and Madhava Sarma, 2002. Protecting the Ozone Layer: The United Nations History. London and Sterling, VA: Earthscan Publications. Barker, Terry, and Paul Ekins, 2004. “The Costs of Kyoto for the US Economy,” The Energy Journal, Vol. 25: 53-71. Benedick, Richard E., 1998. Ozone Diplomacy: New Directions in Safeguarding the Planet (2nd Revised Edition). Cambridge: Harvard University Press. Bilefsky, Dan, 2007. “Europe Sets Ambitious Limits on Greenhouse Gases,” New York Times (March 10), available at http://www.nytimes.com/2007/03/10/world/europe/10europe.html?_r=1&oref=slogin (last accessed 3/11/07). Bird, Gregory, ed., 2001. “Protecting the Ozone Layer – Volume 2: Solvents, Coatings, and Adhesives,” UNEP DTIE, available at http://www.uneptie.org/Ozonaction/information/mmcfiles/2334-e.pdf (last accessed 3/20/07). Cook, Elizabeth, ed., 1996. Ozone Protection in the United States: Elements of Success. Washington: World Resources Institute. Dasgupta, Partha, 2006. “Comments on the Stern Review’s Economics of Climate Change,” available at http://www.econ.cam.ac.uk/faculty/dasgupta/STERN.pdf (last accessed 3/20/2007). DeCanio, Stephen J., 2003a. “Economic Analysis, Environmental Policy, and Intergenerational Justice in the Reagan Administration: The Case of the Montreal Protocol,” International Environmental Agreements: Politics, Law and Economics, Vol. 3, No. 4: 299-321. __________, 2003b. Economic Models of Climate Change: A Critique. New York: Palgrave Macmillan. __________, 2006. “Is Economics the Wrong Language for Addressing Climate Policy?” paper presented to the joint University of California/American Council for an Energy-Efficient Economy workshop, “Energy and Economic Policy Models: A Reexamination of some
- 25. 25 Fundamentals,” Washington DC, November 16-17, available at http://www.aceee.org/conf/06modeling/ucsb.pdf (last accessed 12/29/2006). DeCanio, Stephen J., and Catherine S. Norman, 2005. “Economics of the ‘Critical Use’ of Methyl Bromide under the Montreal Protocol,” Contemporary Economic Policy, Vol. 23, No. 3: 376-393. __________, 2007a. “An Economic Framework for Coordinating Climate Policy with the Montreal Protocol,” Sustainable Development Law and Policy, Vol. VII, No. 2 (Winter): 41-44, 82. __________, 2007b, forthcoming. “Economics of ‘essential use exemptions’ for metered-dose inhalers under the Montreal Protocol,” Journal of Environmental Management. Energy Technology Systems Analysis Programme (ETSAP), 2004. “Documentation for the MARKAL Family of Models,” available at http://www.etsap.org/MrklDoc- I_StdMARKAL.pdf (last accessed 5/6/07). European Climate Exchange, 2007. “ECX Historical Data,” available at http://www.ecxeurope.com/index_flash.php (last accessed 2/2/ 2007). Fischer, S. K., P. J. Hughes, P. D. Fairchild, C. L. Kusik, J. K. Dieckmann, E. M. McMahon, and N. Hobday, 1991. “Energy and Global Warming Impacts of CFC Alternative Technologies,” Alternative Fluorocarbons Environmental Acceptability Study (AFEAS) and U.S. Department of Energy, available at http://www.afeas.org/tewi.html (last accessed 5/6/2007). Fischer, S. K., J. J. Tomlinson, and P. J. Hughes, 1994. “Energy and Global Warming Impacts of Not-In-Kind and Next Generation CFC and HCFC Alternatives,” Alternative Fluorocarbons Environmental Acceptability Study (AFEAS) and U.S. Department of Energy, available at http://www.afeas.org/tewi.html (last accessed 5/6/2007). Goodstein, Eban, 1997. “Polluted Data,” The American Prospect, Vol. 8, No. 35. Hall, Darwin C., and Richard J. Behl, 2006. “Integrating economic analysis and the science of climate instability,” Ecological Economics, Vol. 57: 442-465. Harrington, Winston, Richard D. Morgenstern, and Peter Nelson, 2000. “On the Accuracy of Regulatory Cost Estimates,” Journal of Policy Analysis and Management, Vol. 19, No. 2: 297-322. Hasselknippe, H., and K. Roine, eds., 2006. “Carbon 2006.” Point Carbon (February 28, 2006), available at http://www.pointcarbon.com/. Hasselknippe, H. and Roine, K., 2006. Carbon 2006 Report. Oslo: Point Carbon.
- 26. 26 Hill, William R., 2006. “North America projects to develop standard tests for MAC efficiency,” presentation at International Energy Agency Workshop, “Cooling Cars with less Fuel,” 23-24 October, available at http://www.iea.org/Textbase/work/workshopdetail.asp?WS_ID=247 (last accessed 1/4/2007). HM Treasury, 2006. Stern Review on the Economics of Climate Change, Chapter 6, “Economic modeling of climate change impacts,” available at http://www.hm- treasury.gov.uk/media/8AC/CC/Chapter_6_Economic_modelling.pdf (last accessed 12/26/2006). Interlaboratory Working Group on Energy-Efficient and Clean-Energy Technologies, 2000. Scenarios for a Clean Energy Future. Oak Ridge National Laboratory and Lawrence Berkeley National Laboratory, ORNL/CON-476 and LBNL-44029, Oak Ridge, TN and Berkeley, CA, available at http://www.ornl.gov/sci/eere/cef/ (last accessed 12/26/06). IPCC, Contribution of Working Group III to the Second Assessment Report of the Intergovernmental Panel on Climate Change, 1996. Climate Change 1995: Economic and Social Dimensions of Climate Change. Cambridge: Cambridge University Press. __________, Contribution of Working Group III to the Third Assessment Report of the Intergovernmental Panel on Climate Change, 2001. Climate Change 2001: Impacts, Adaptation, and Vulnerability. Cambridge: Cambridge University Press. IPCC/SAP – Penner, Joyce E., David H. Lister, David J. Griggs, David J. Dokken, and Mac MacFarland, eds., 1999. Aviation and the Global Atmosphere. Cambridge: Cambridge University Press. IPCC/TEAP – Metz, Bert, Lambert Kuijpers, Susan Solomon, Stephen O. Andersen, Ogunlade Davidson, José Pons, David de Jager, Tahl Kestin, Martin Manning, and Leo Meyer, eds., 2005. Special Report on Safeguarding the Ozone Layer and the Global Climate System: Issues Related to Hydrofluorocarbons and Perfluorocarbons. Cambridge: Cambridge University Press, also available at http://arch.rivm.nl/env/int/ipcc/pages_media/SROC- final/SpecialReportSROC.html (last accessed 217/2007). Lecocq, Franck and Karan Capoor, 2005. “State and Trends of the Carbon Market 2005,” available at http://www.ieta.org/ieta/www/pages/index.php?IdSitePage=669 (downloaded 1/29/2007). Molina, Mario, 2007. “The ozone treaty can do much more for the planet,” Financial Times (August 24).
- 27. 27 Morrison, Kevin, 2007. “Next Carbon Trading Phase Promises to Clean Up Anomalies,” ECX, category “News, 07 Feb 2007,” available at http://www.europeanclimateexchange.com/index_flash.php, (last accessed 3/14/07). MSNBC News Services (2006). “Warming expert: Only decade left to act in time” (September 14), available http://www.msnbc.msn.com/id/14834318/ (last accessed 1/30/2007). National Aeronautics and Space Administration (NASA), 2006. “NASA Study Finds Clock Ticking Slower On Ozone Hole Recovery,” available at http://www.nasa.gov/vision/earth/lookingatearth/ozone_recovery.html (last accessed 3/11/07). Porter, Michael E., 1991. “America’s Green Strategy: Environmental Standards and Competitiveness,” Scientific American, Vol. 264, No. 4 (April): 168. Porter, Michael E., and Claas van der Linde, 1995a. “Toward a New Conception of the Environment-Competitiveness Relationship,” Journal of Economic Perspectives, Vol. 9, No. 4 (Fall): 97-118. _____________, 1995b. “Green and Competitive: Breaking the Stalemate,” Harvard Business Review, Vol. 73, No. 5 (September-October): 120-134. Sand, James R., Steven K. Fischer, and Van D. Baxter, 1997. “Energy and Global Warming Impacts of HFC Refrigerants and Emerging Technologies,” Alternative Fluorocarbons Environmental Acceptability Study (AFEAS) and U.S. Department of Energy, available at http://www.afeas.org/tewi.html (last accessed 5/6/2007). Sanstad, Alan H., Stephen J. DeCanio, Gale A. Boyd, and Jonathan G. Koomey, 2001. “Estimating bounds on the economy-wide effects of the CEF policy scenarios,” Energy Policy 29: 1299-1311. Shay, C. L., J. Decarolis, D. Loughlin, C. L. Gage, S. Yeh, S. Vijay, and E. L. Wright, 2006. EPA U.S. National MARKAL Database: Database Documentation, EPA/600/R-06/057. Solomon, S., and D.L. Albritton, 1992. “Time-dependent ozone depletion potentials for short- and long-term forecasts,” Nature 357 (May 7): 33–37. United Nations Environment Programme (UNEP), 1994. 1994 Report of the Economic Options Committee [of the Technical and Economic Assessment Panel]. Nairobi: United Nations Environment Programme. ___________, 2002. 2002 Report of the Refrigeration, Air Conditioning, and Heat Pumps Technical Options Committee: 2002 Assessment, available at http://www.unep.org/ozone/pdf/rtoc-report2002.pdf (last accessed 2/18/2007).
- 28. 28 ___________, 2004. Report of the TEAP Chiller Task Force, available at http://www.uneptie.org/ozonaction/information/mmcfiles/4251-e-teap04chiller.pdf (last accessed 2/17/2007). ___________, 2006. “Report of the Ozone Secretariat Workshop on the IPCC/TEAP Special Report,” available at http://ozone.unep.org/teap/Reports/TEAP_Reports/Workshop2- 2E.pdf (last accessed 3/5/07). Velders, Guus J. M., Stephen O. Andersen, John S. Daniel, David W. Fahey, and Mack McFarland, 2007. “The importance of the Montreal Protocol in protecting climate,” Proceedings of the National Academy of Science Wara, Michael, 2006. “Measuring the Clean Development Mechanism’s Performance and Potential,” Stanford University, Program on Energy and Sustainable Development, Working Paper #56 (July), available at http://iis- db.stanford.edu/pubs/21211/Wara_CDM.pdf (last accessed 3/5/07). __________, 2007. “Is the global carbon market working?” Nature 445 (8 February): 595-596. Weitzman, Martin L., 2007. “The Stern Review of the Economics of Climate Change,” Journal of Economic Literature (forthcoming), available at http://www.economics.harvard.edu/faculty/Weitzman/papers/JELSternReport.pdf (last accessed 3/20/07). Wexler, Pamela, 1996. “New Marching Orders,” in Elizabeth Cook, ed., Ozone Protection in the United States: Elements of Success. Washington: World Resources Institute.