Download as PDF, PPTX


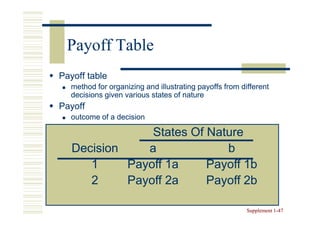

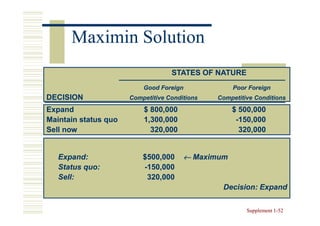
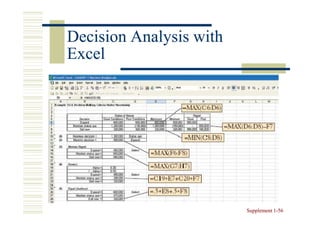
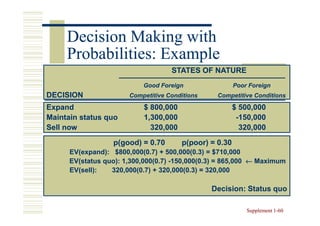
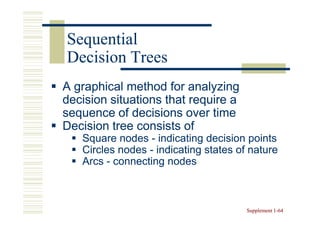


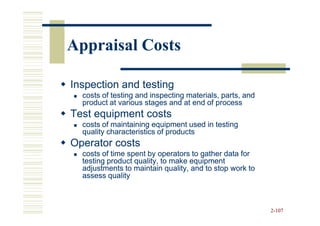
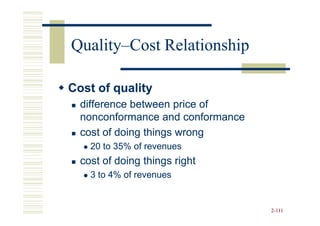


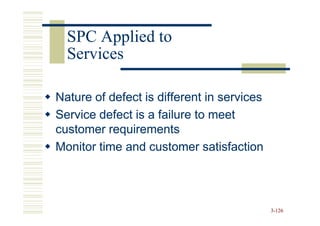
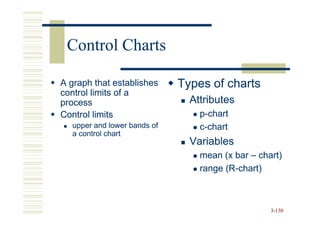
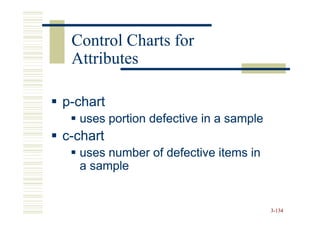
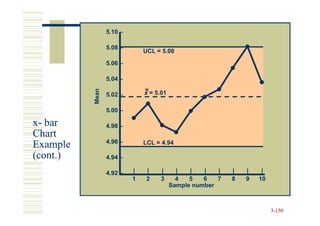
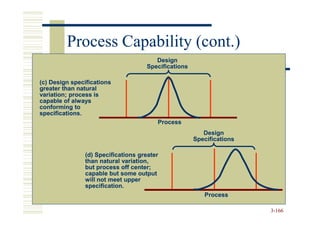
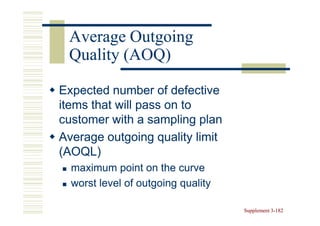


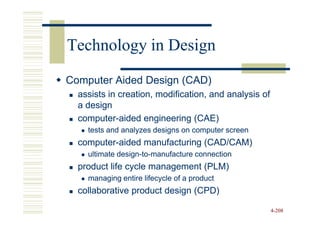


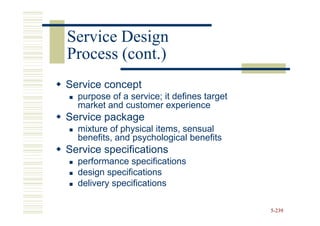
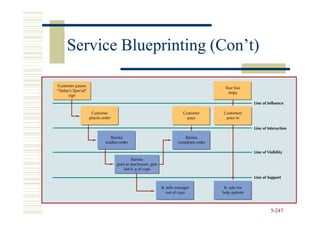

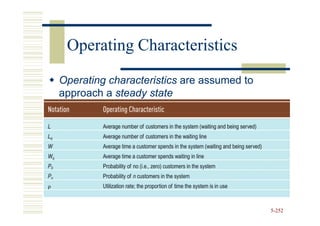

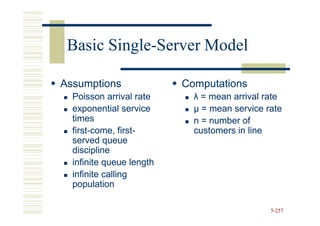

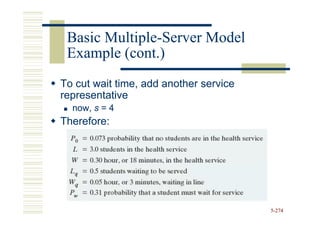
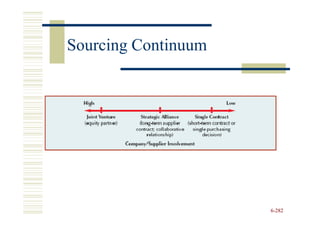
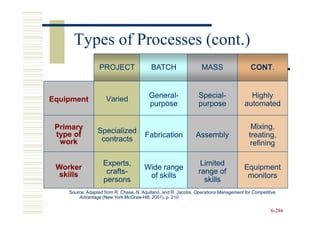
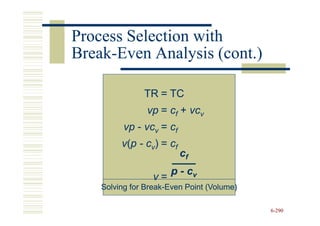
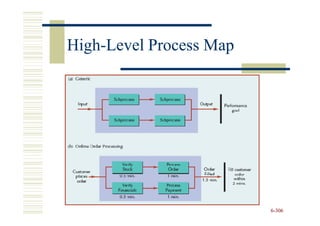


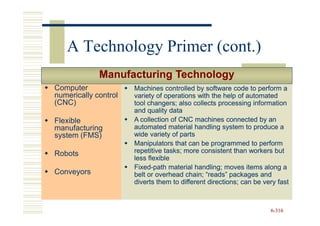
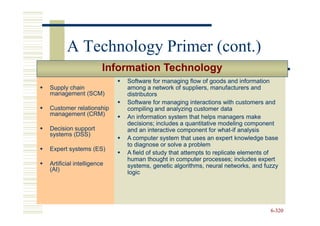

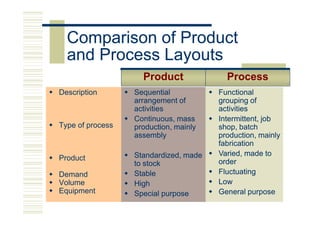


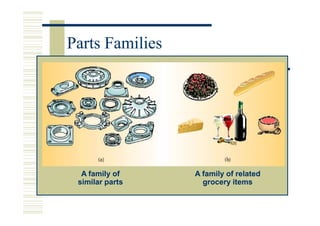

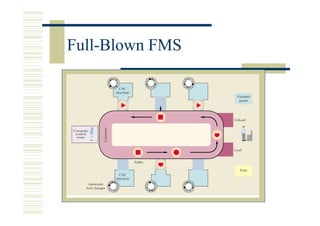
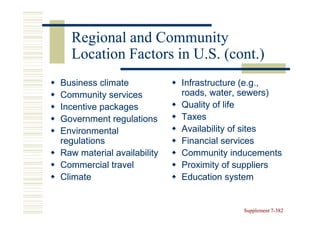
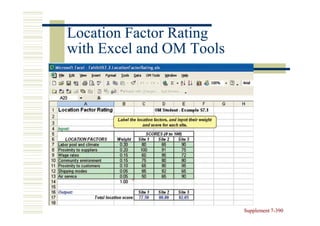
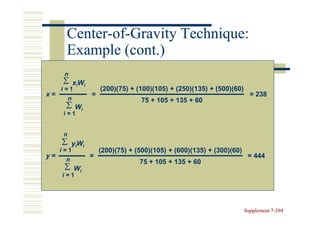
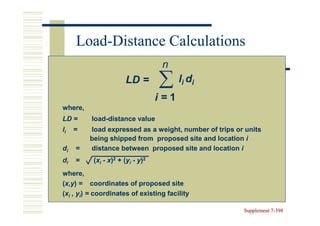


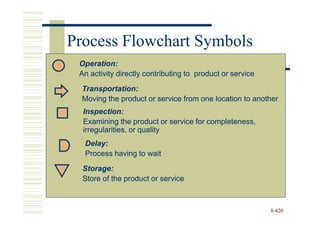


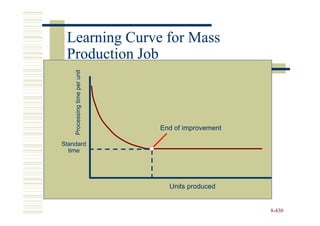


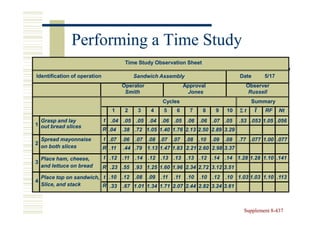
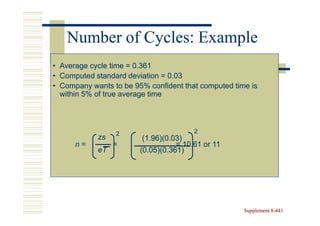
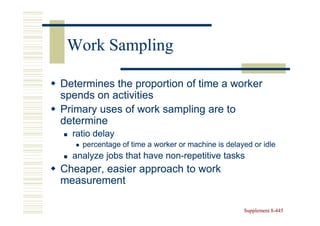
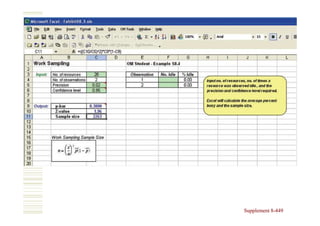

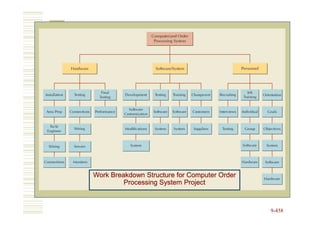


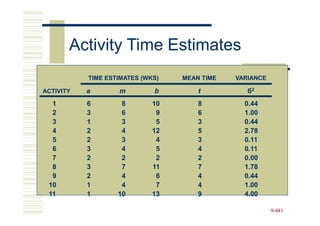
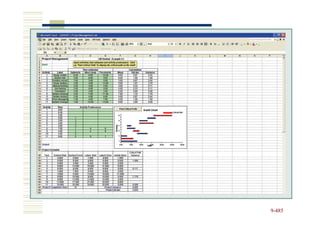
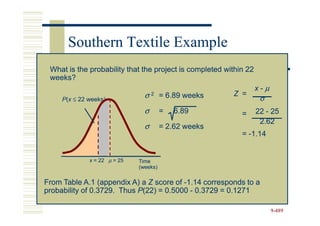


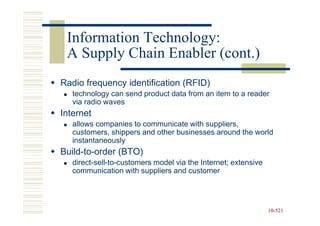


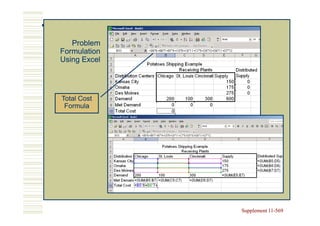
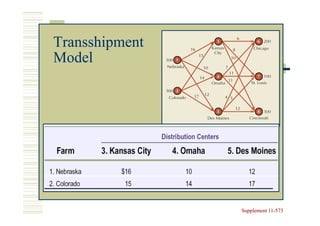

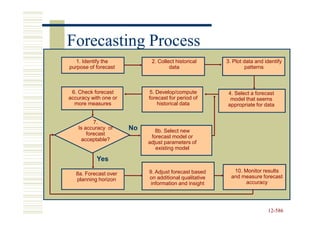
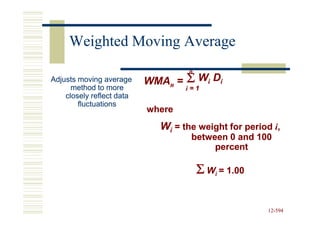
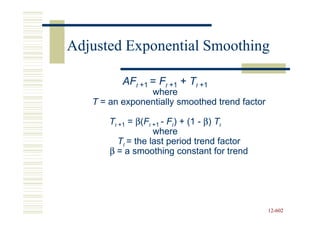
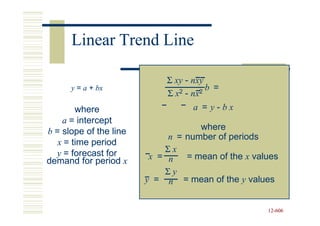
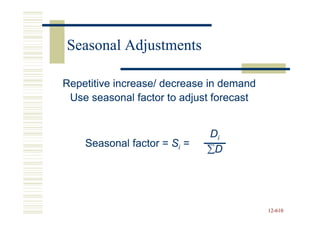
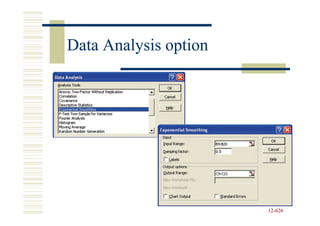
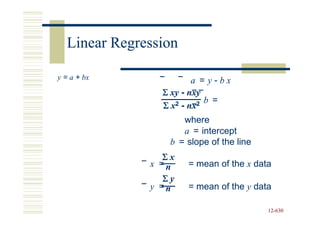
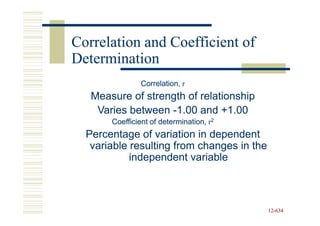
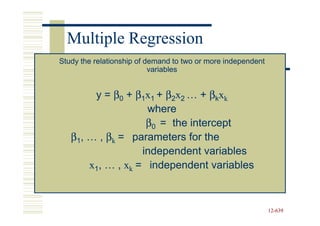
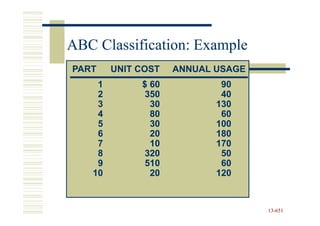
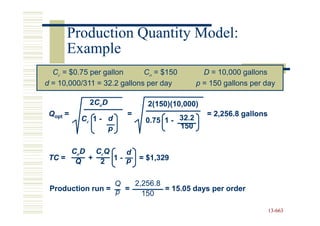
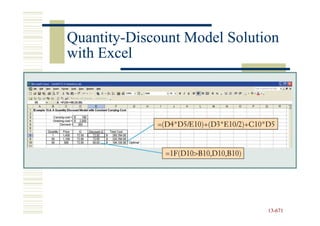
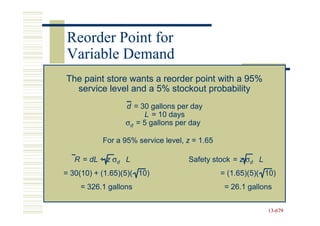
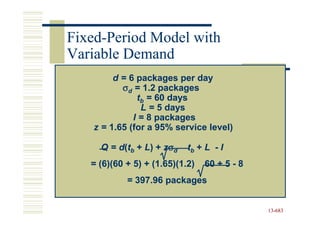
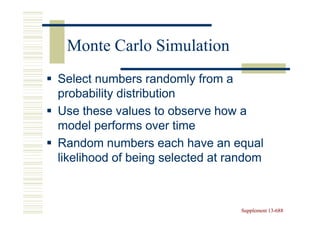
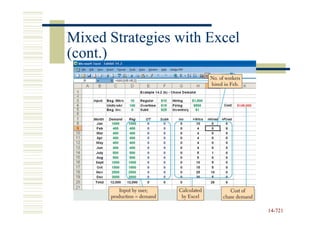
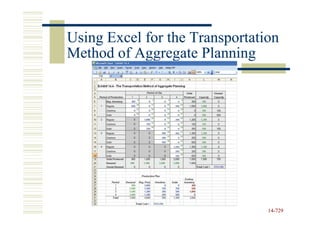
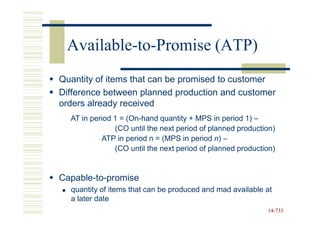
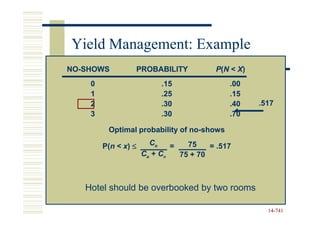
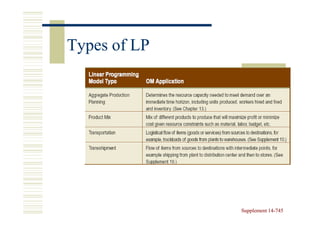
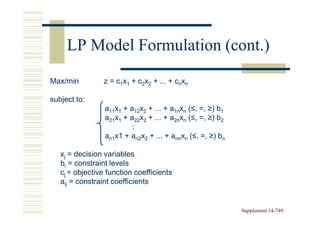
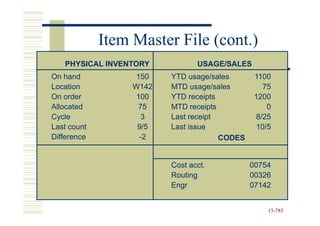
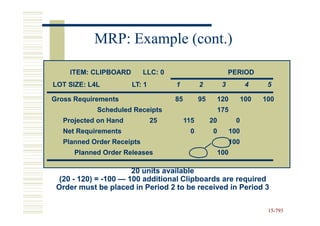
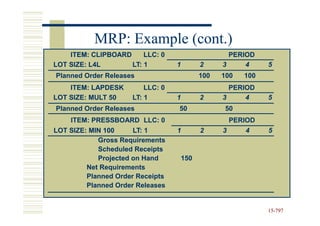
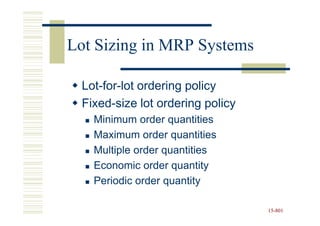
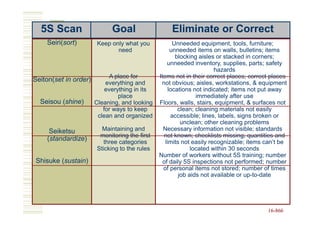
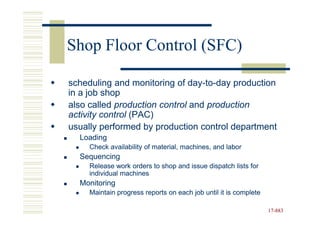
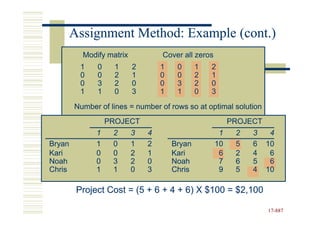
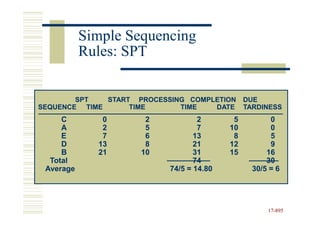
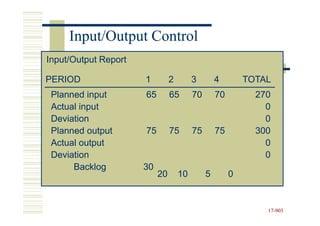
![Computing Correlation
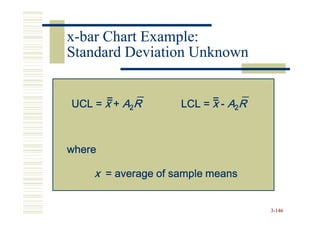
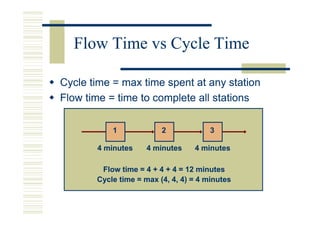
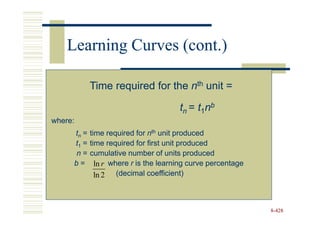
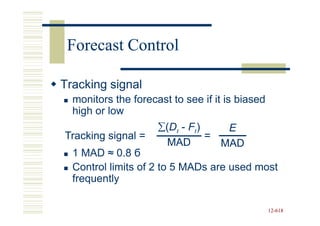
n∑ xy - ∑ x∑ y
r=
[n∑ x2 - (∑ x)2] [n∑ y2 - (∑ y)2]
[n
(8)(2,167.7) - (49)(346.9)
r=
[(8)(311) - (49)2] [(8)(15,224.7) - (346.9)2]
r = 0.947
Coefficient of determination
r2 = (0.947)2 = 0.897
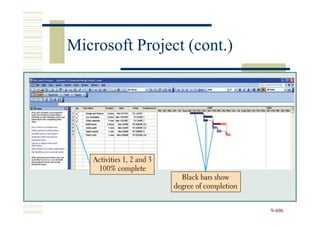
12-635
12-](https://image.slidesharecdn.com/operationsmanagement-919slidespresentation-090928145353-phpapp01-100916185709-phpapp02/85/Operationsmanagement-919slidespresentation-090928145353-phpapp01-635-320.jpg)
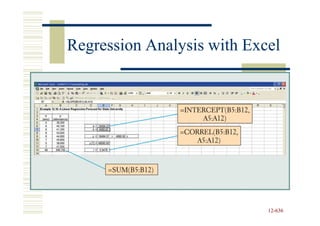
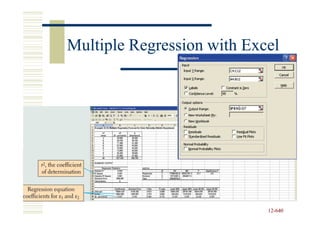
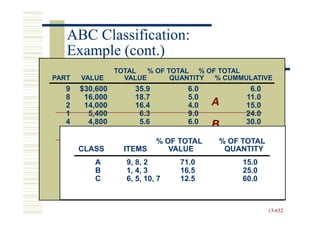
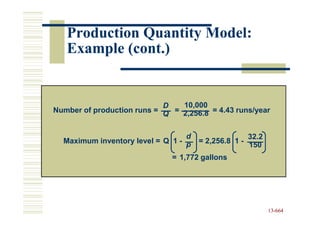
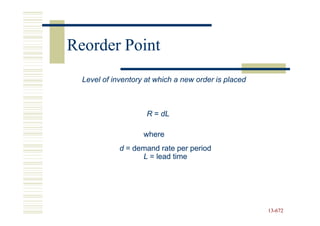
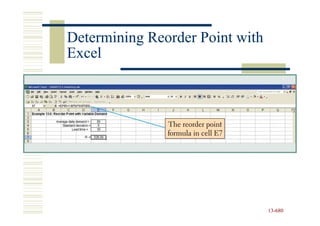
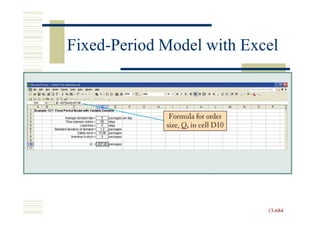

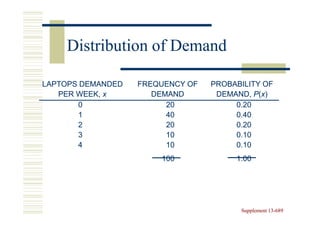

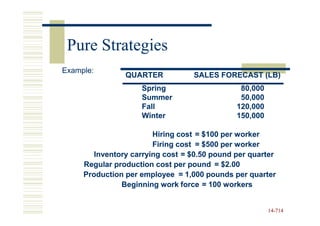
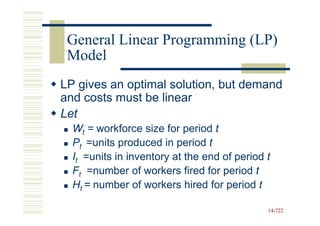
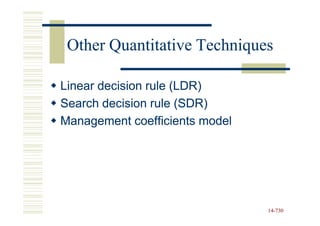
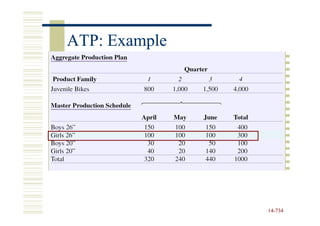
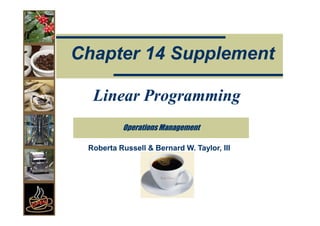
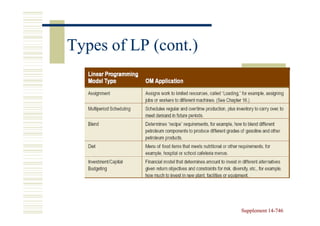
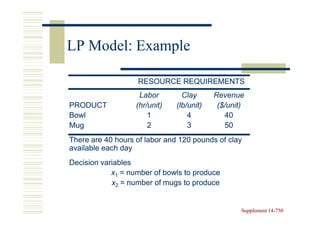
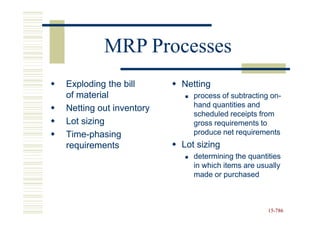
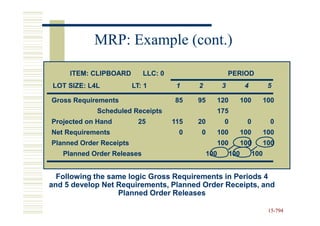
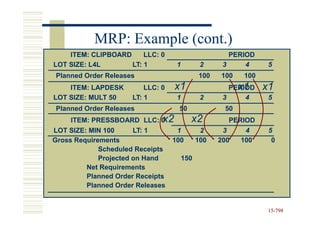
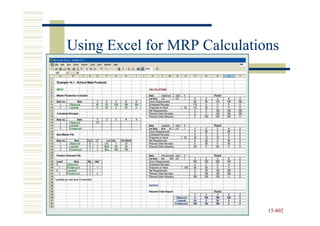

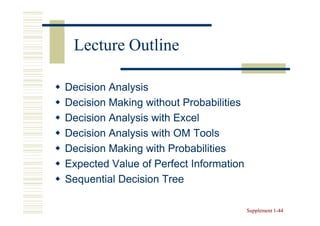
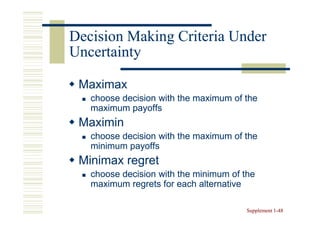
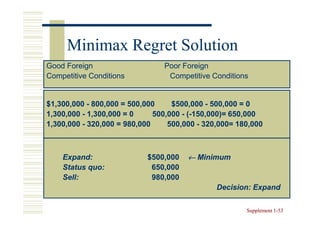
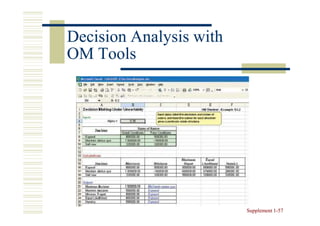
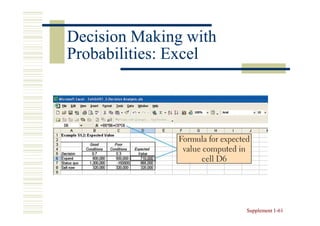
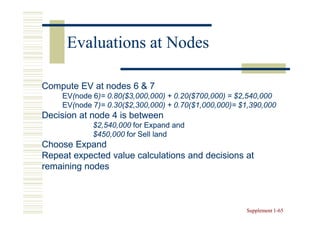
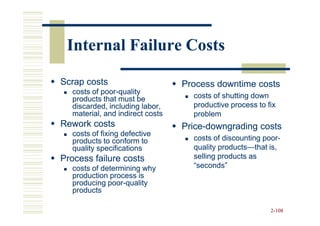
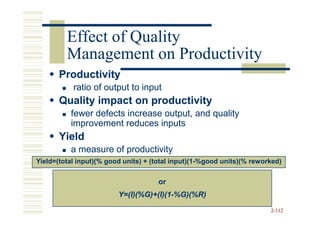
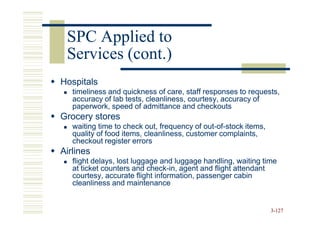
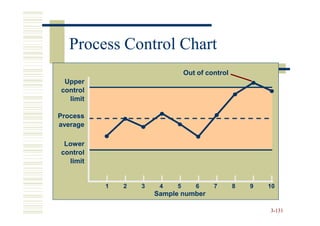
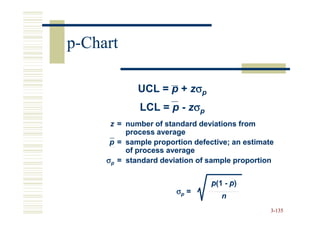
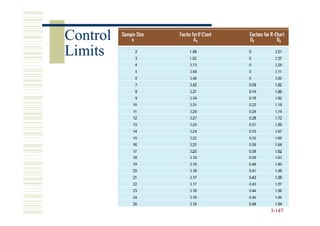
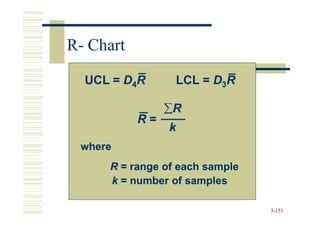
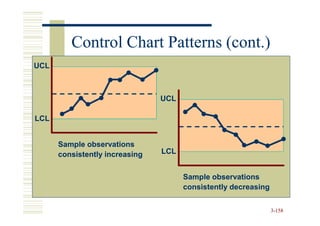
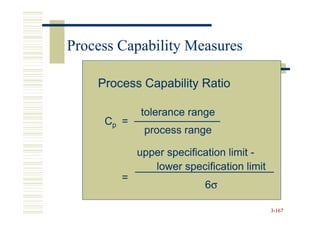
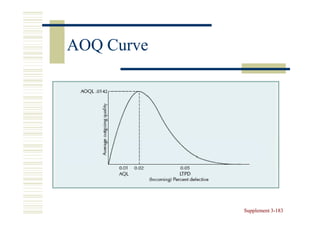
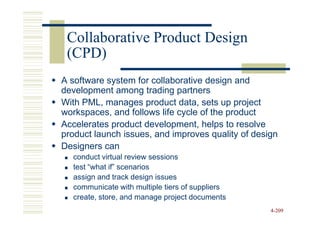
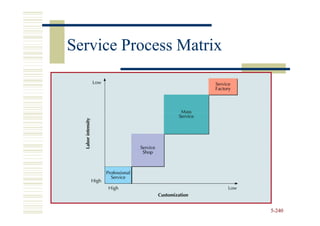
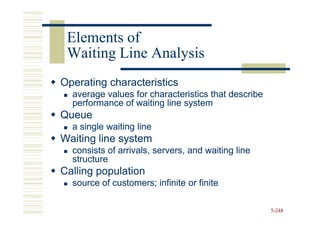
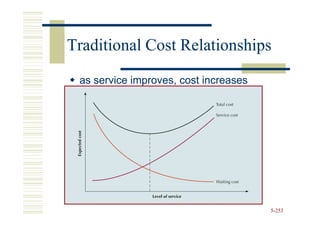
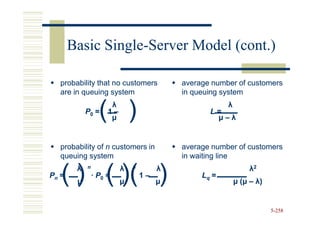
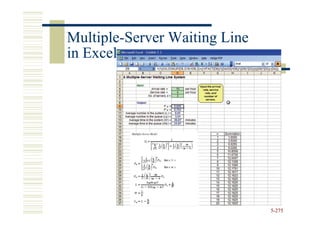
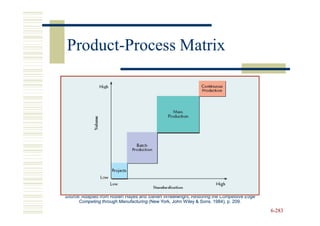
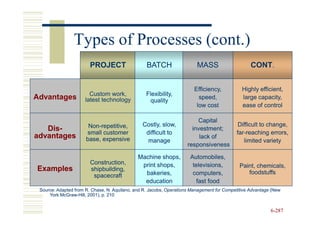
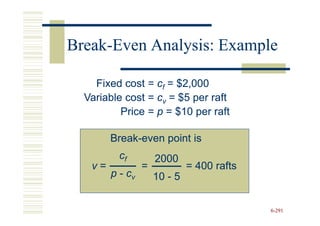
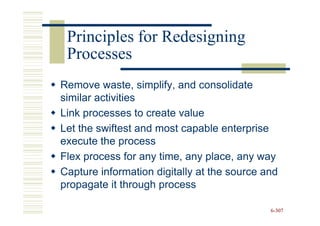
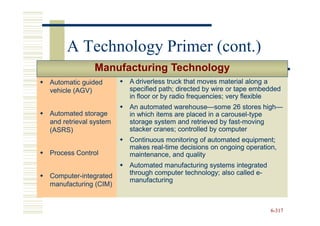
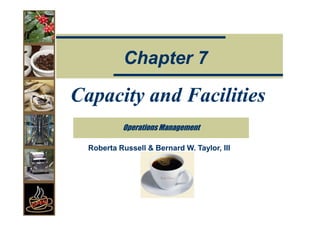
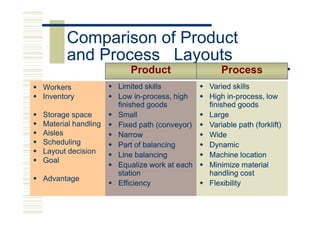
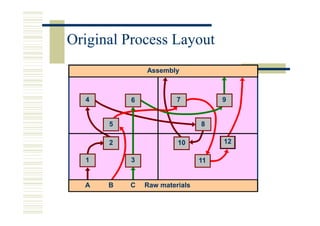
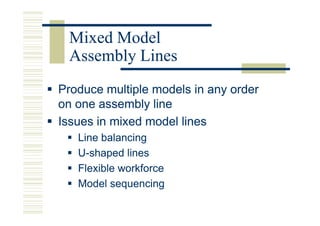
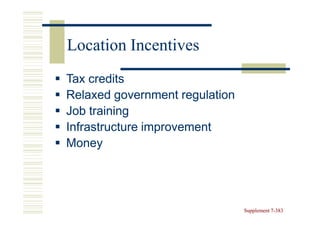
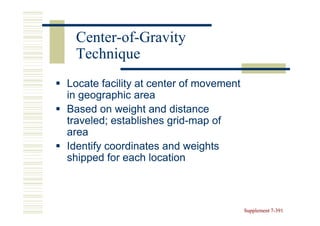
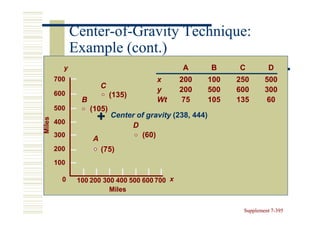
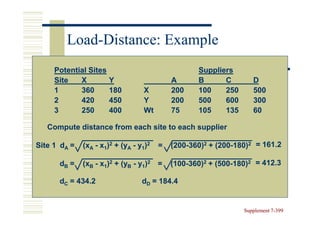
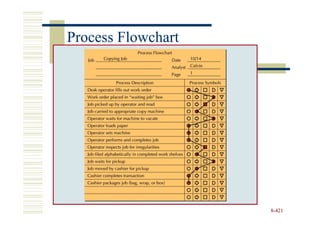
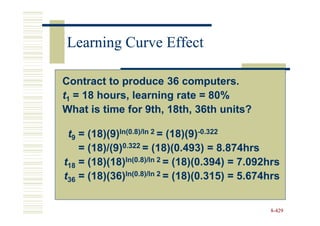
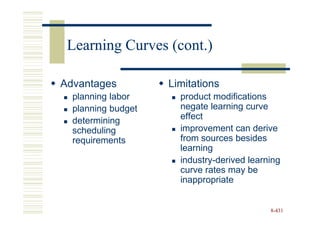
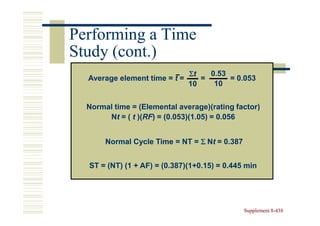
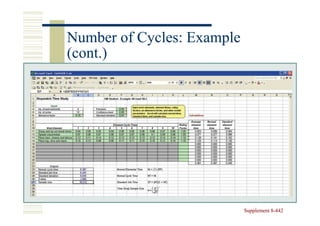
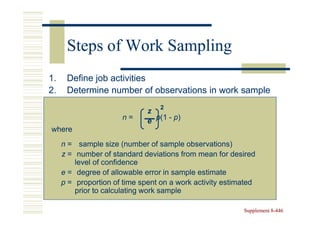
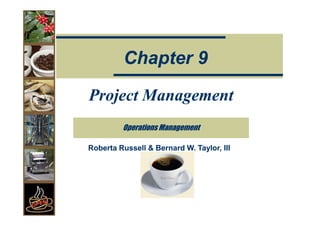
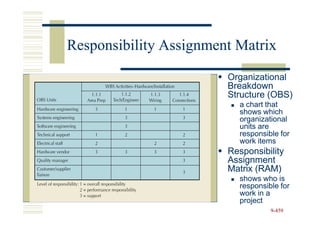
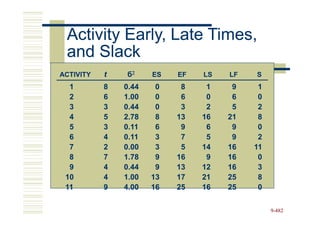
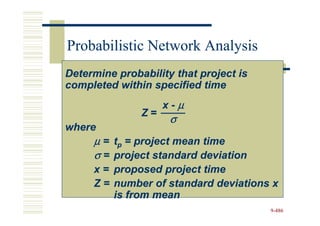
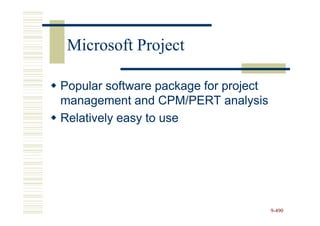
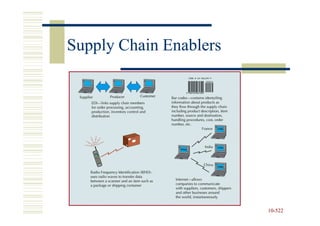
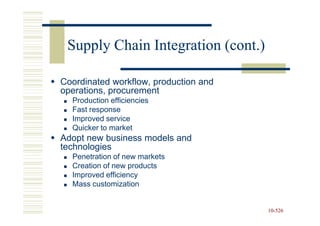
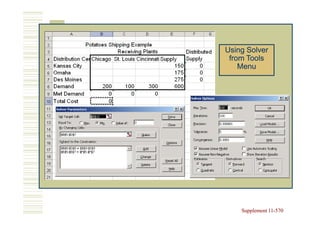
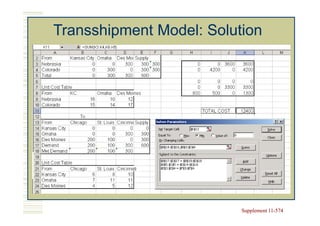
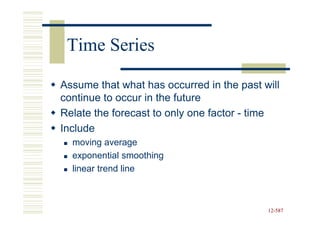
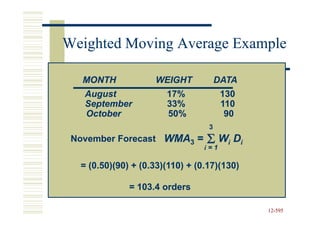
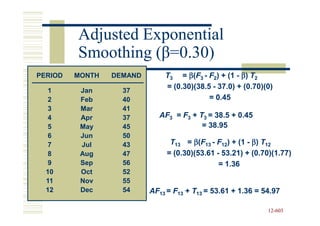
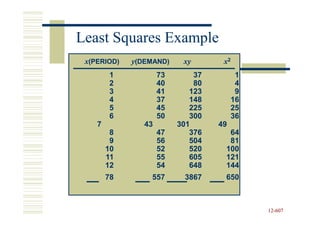
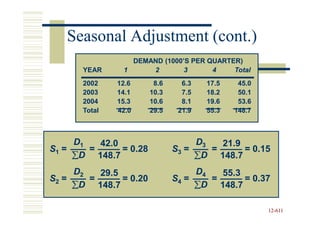
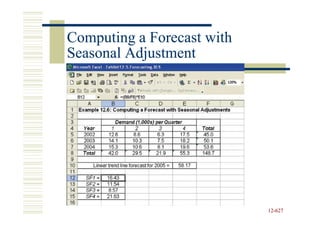
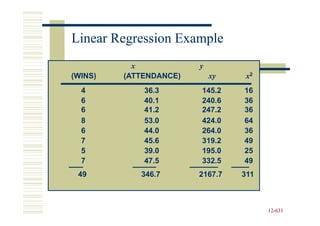
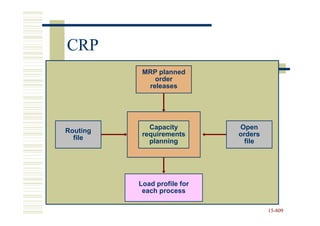
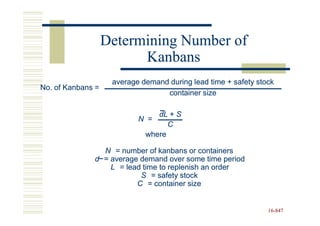
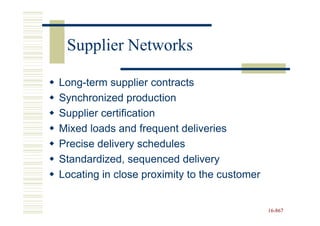
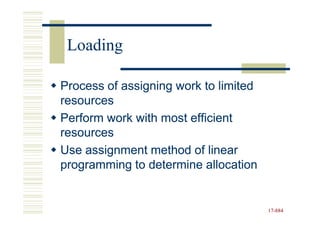
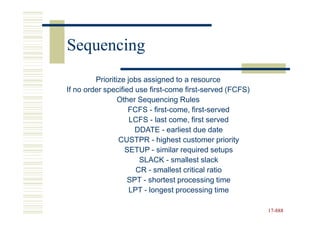
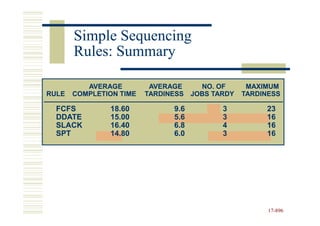
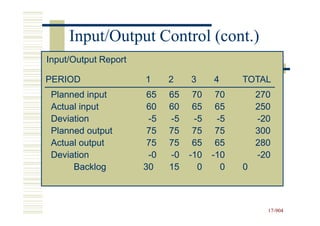
![Advanced Lot Sizing Rules: EOQ
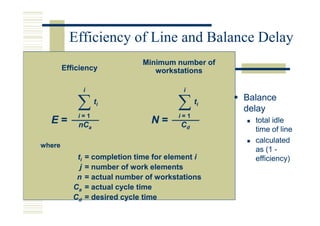
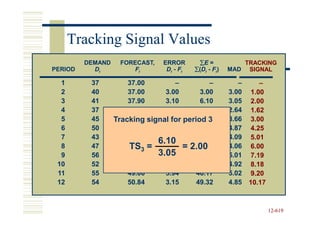
2(30)(60
EO Q = = 60 minimum order quantity
1
Total cost of EOQ = (2 X $60) + [(10 + 50 + 40) X $1)] = $220
15-804
15-](https://image.slidesharecdn.com/operationsmanagement-919slidespresentation-090928145353-phpapp01-100916185709-phpapp02/85/Operationsmanagement-919slidespresentation-090928145353-phpapp01-804-320.jpg)
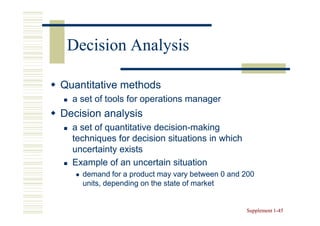
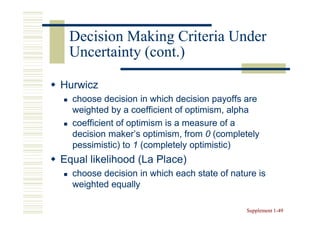
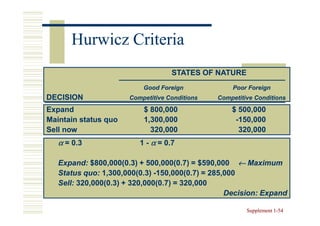
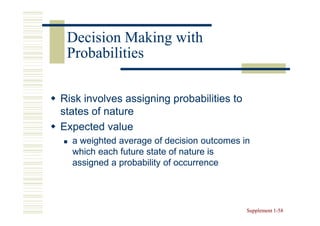
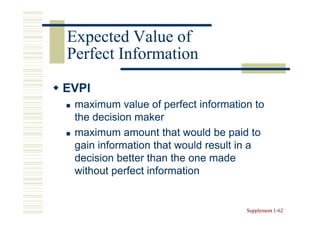
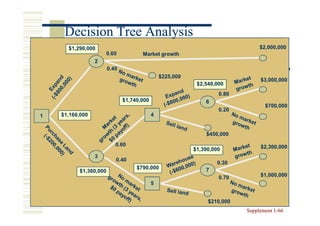
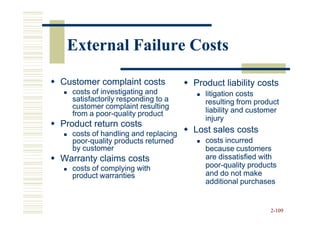
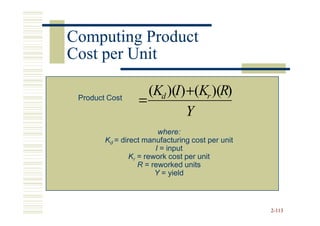
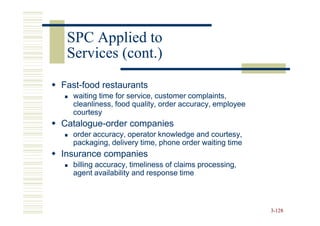
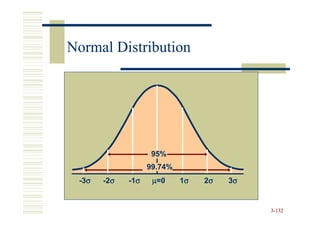
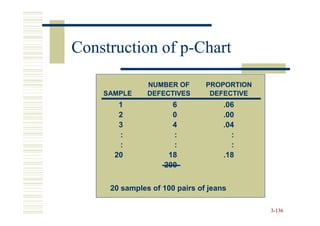
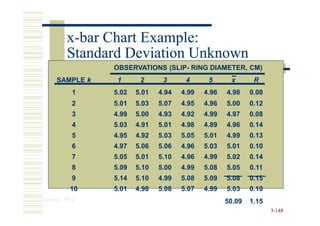
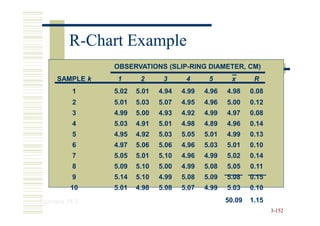
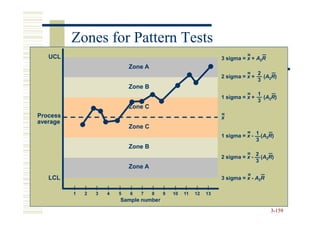
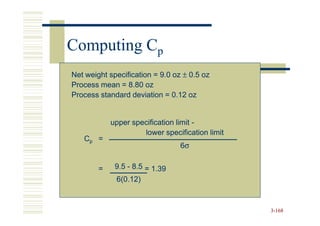
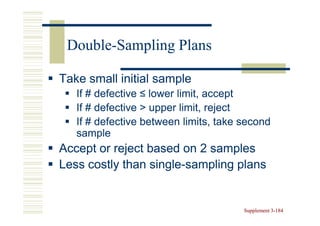
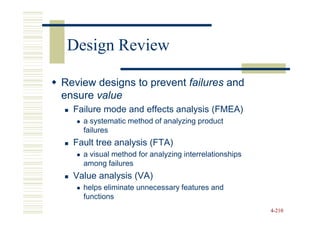
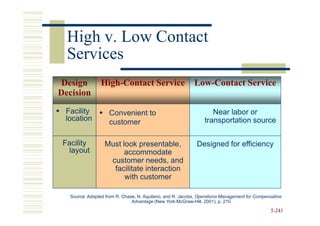
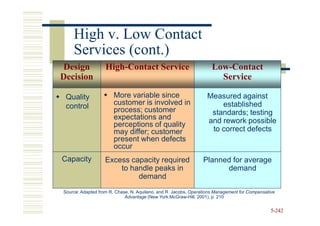
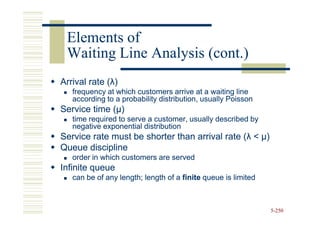
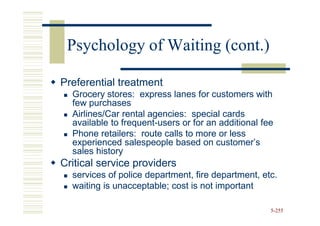
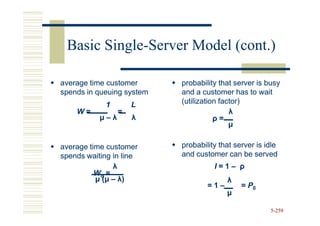
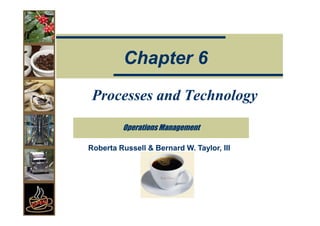
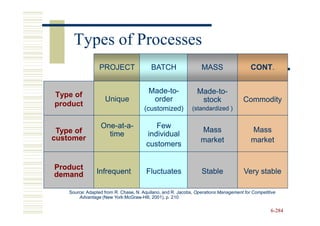
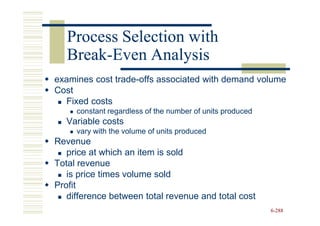
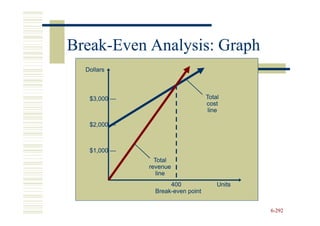
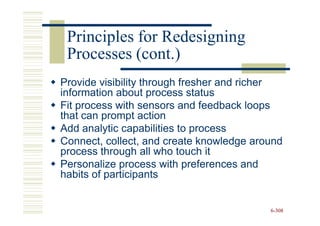
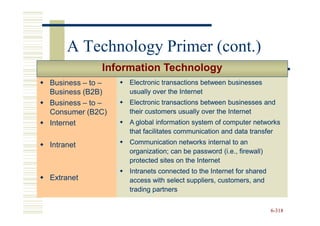
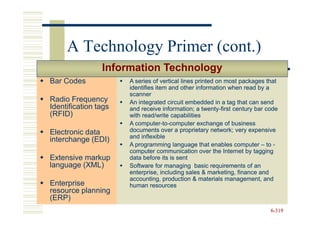
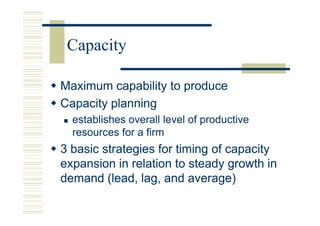
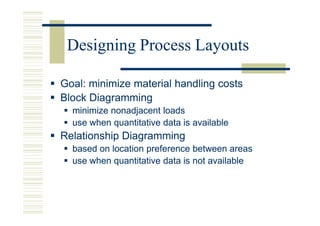
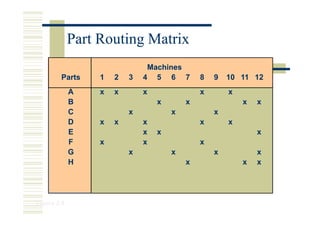
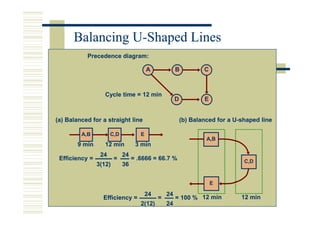
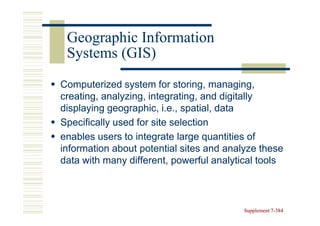
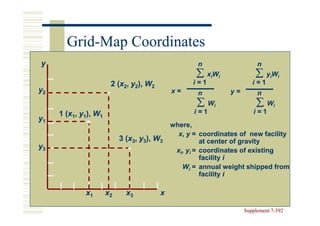
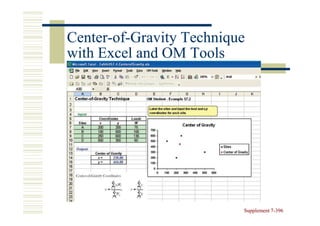
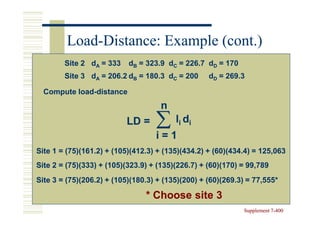
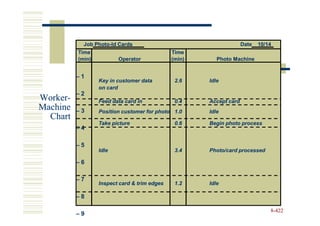
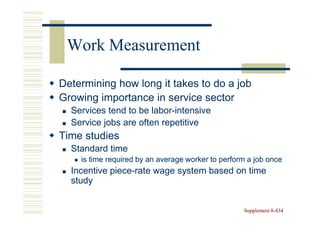
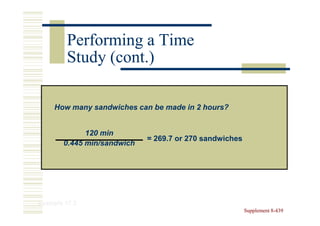
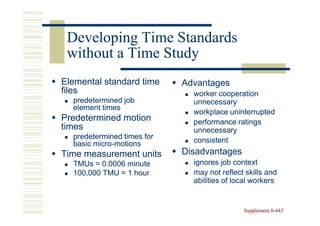
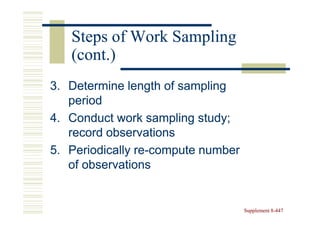
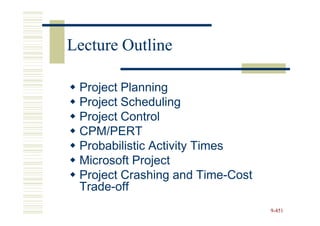
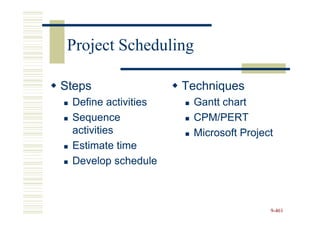
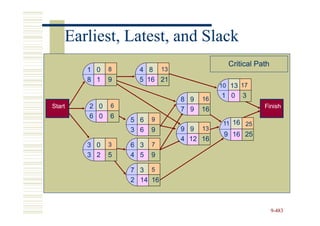
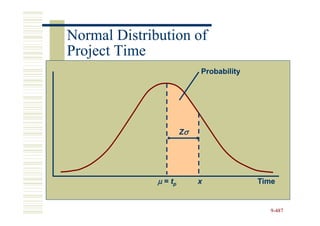
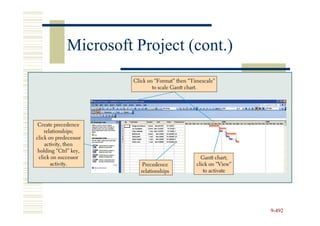
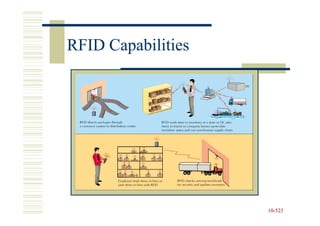
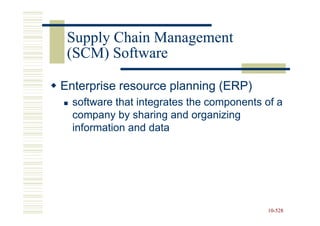
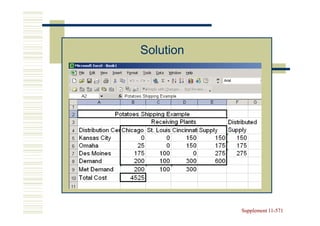
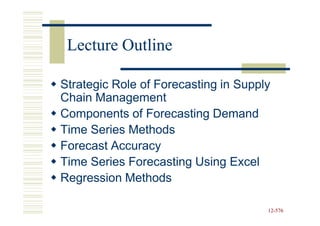
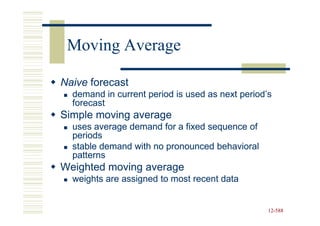
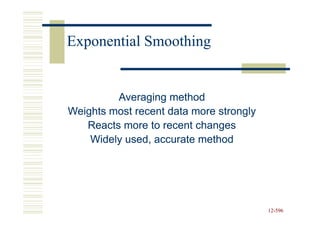
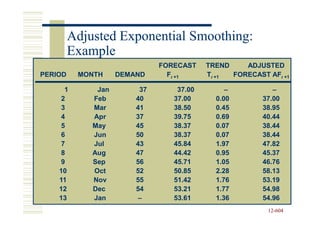
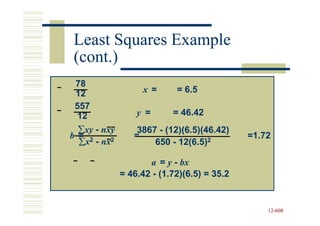
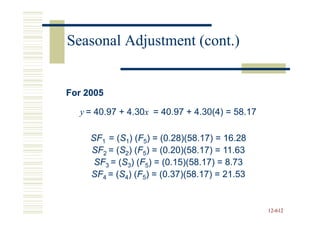
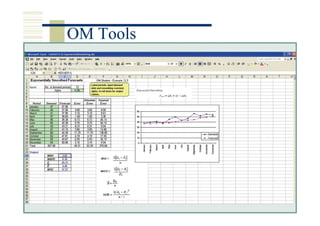
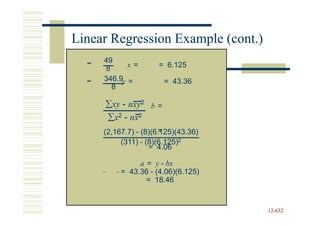
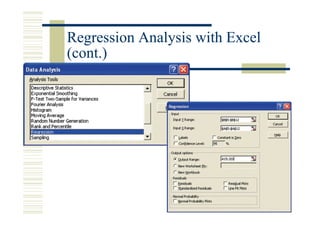
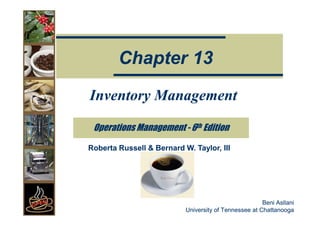
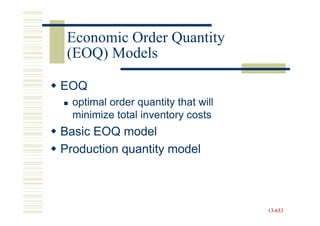
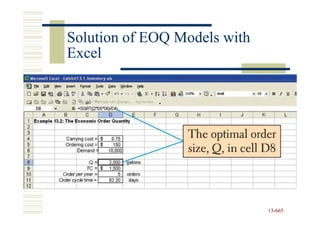
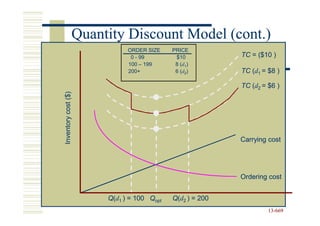
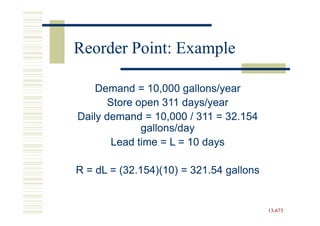
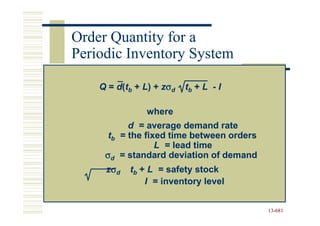
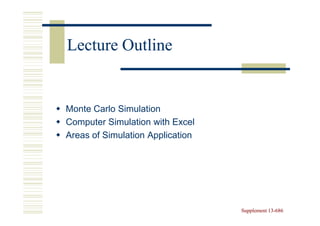
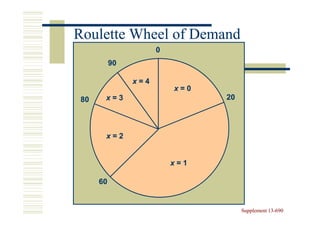
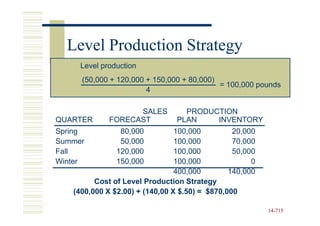
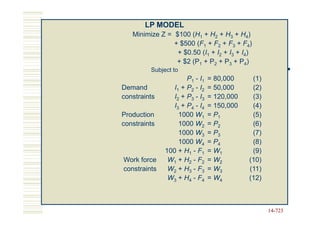
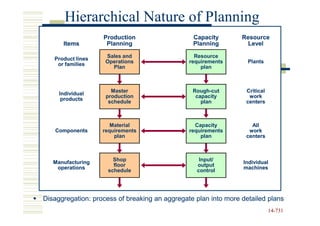
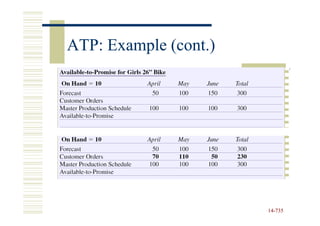
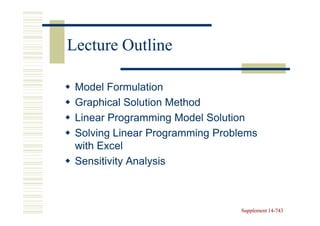
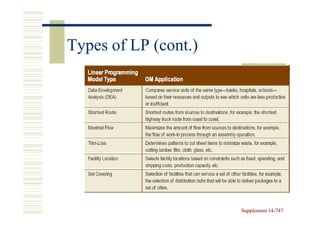
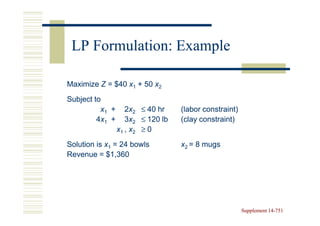
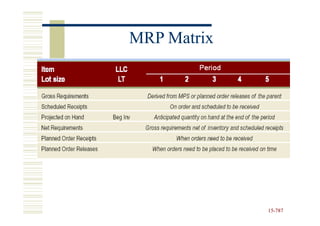
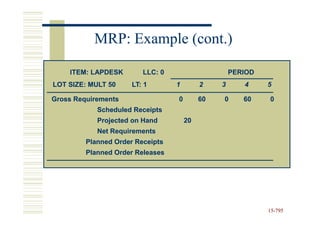
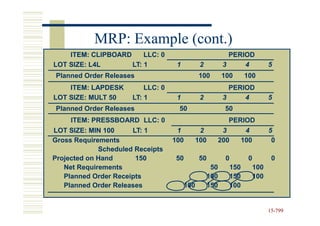
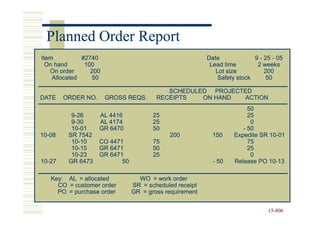
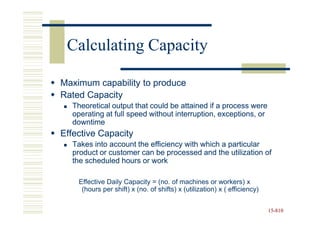
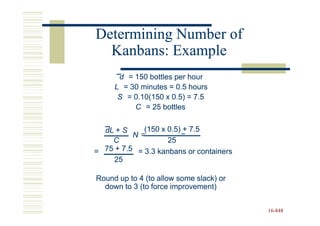
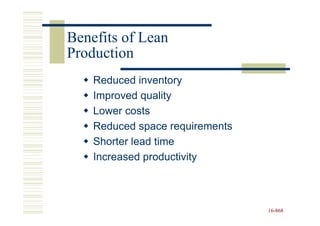
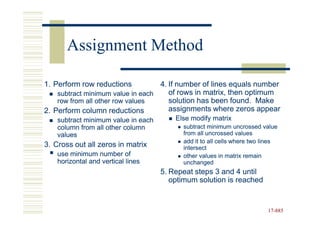
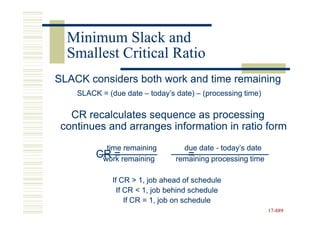
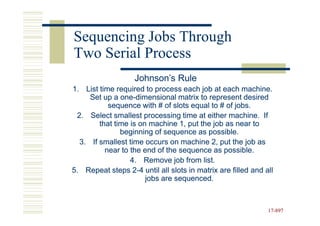
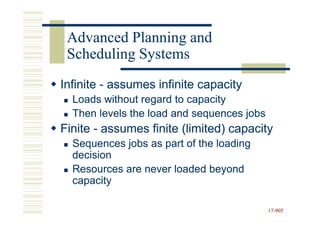
![Advanced Lot Sizing Rules: POQ
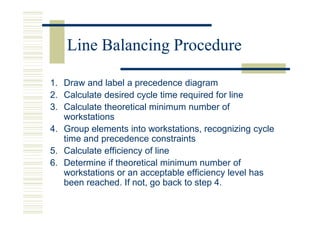
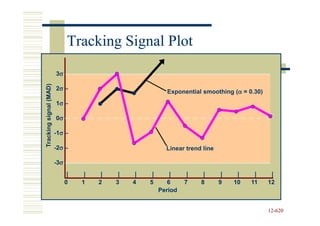
POQ = Q / d = 60 / 30 = 2 periods worth of requirements
Total cost of POQ = (2 X $60) + [(20 + 40) X $1] = $180
15-805
15-](https://image.slidesharecdn.com/operationsmanagement-919slidespresentation-090928145353-phpapp01-100916185709-phpapp02/85/Operationsmanagement-919slidespresentation-090928145353-phpapp01-805-320.jpg)


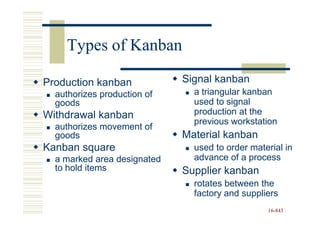


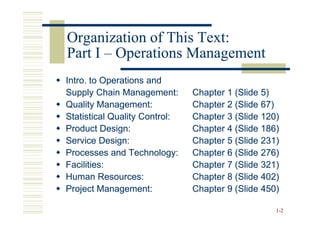
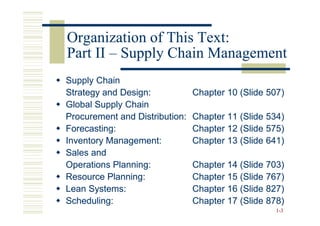
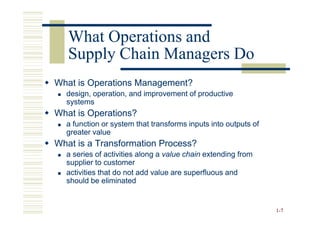
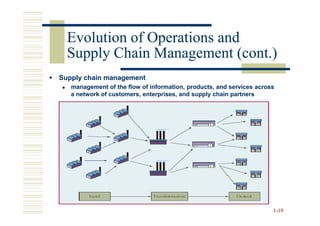
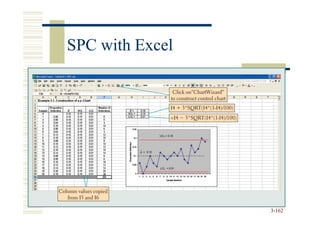
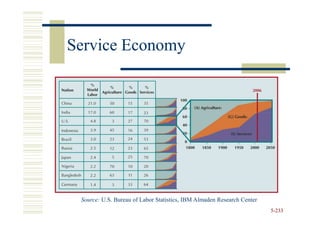
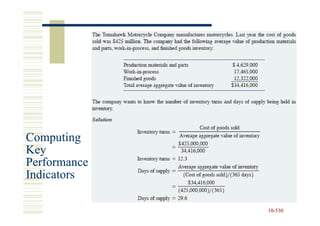
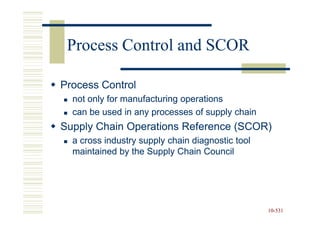
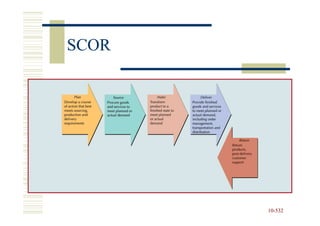
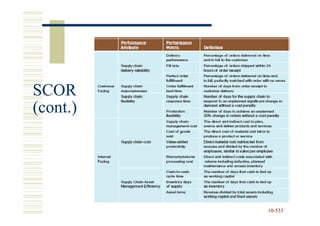
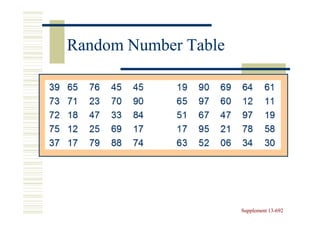
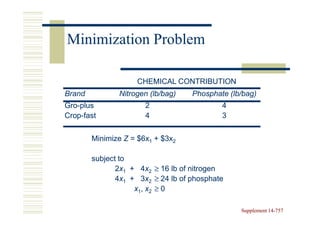
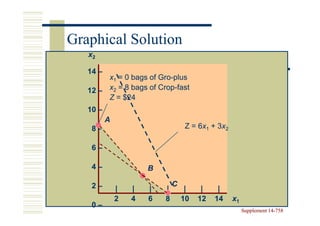
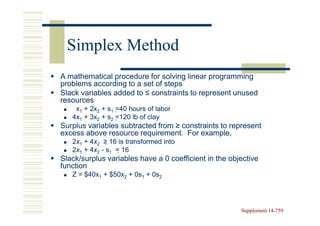
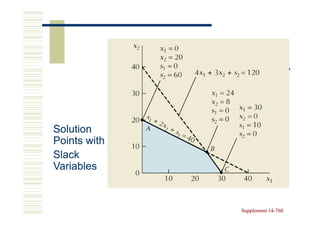
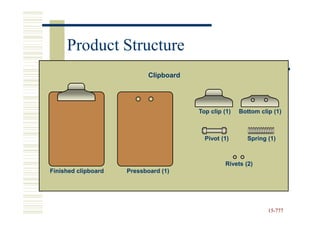
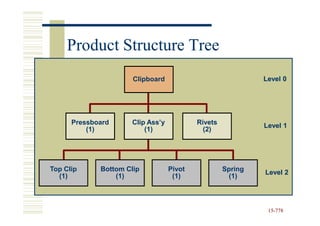
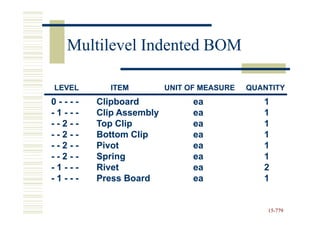
This document provides an overview of chapters 1-17 in the textbook "Operations Management" by Roberta Russell and Bernard W. Taylor III. The first part introduces operations management and supply chain management, covering topics like quality management, product design, processes and technology. The second part covers supply chain management, including supply chain strategy, procurement, forecasting, inventory management and scheduling. The document outlines the learning objectives of gaining an appreciation for the strategic importance of operations and developing skills in concepts and methods for designing and managing operations and supply chains.