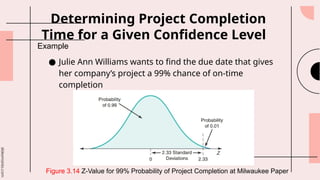
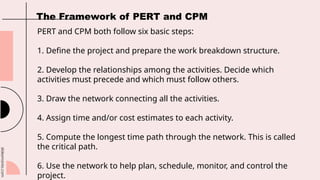
slidesmania.com
PROJECT
MANAGEMENT
slidesmania.com
01
Learning Outcomes
Describe the importance of project management
Describe project planning, scheduling and controlling
02
03 Illustrate the project management techniques using PERT
and CPM.
slidesmania.com
04
Learning Outcomes
Determine the project schedule through critical path analysis
using forward pass and backward pass processes.
Determine the variability in activity times.
05
06 Illustrate cost-time trade-offs and project crashing.
slidesmania.com
PROJECT MANAGEMENT
Project management involves all activities associated
with planning, scheduling, and controlling projects
Good project management ensures that an
organization’s resources are used efficiently and
effectively.
slidesmania.com
-world’s premier manager
of massive construction
and engineering projects
- famous for its
construction feats on the
Hoover Dam and
over 25,000 other projects
in 160 countries.
- U.S.’s largest project
manager
Did you know?
slidesmania.com
Describe the importance of project
management
● It helps ensure that projects are completed on time, within
budget, and to the expected quality of work.
● It also helps identify and mitigate risks, manage resources
effectively, and ensure stakeholders are well informed and
involved throughout the project.
01
slidesmania.com
1. Planning: This phase includes goal setting, defining the project, and
team organization.
2. Scheduling: This phase relates people, money, and supplies to
specific activities and relates activities to each other.
3. Controlling: Here the firm monitors resources, costs, quality, and
budgets. It also revises or changes plans and shifts resources to meet
time and cost demands.
The management of projects involves three phases:
slidesmania.com
Describe project planning, scheduling and
controlling
02
slidesmania.com
PROJECT
PLANNING
Work tasks can be defined with a
specific goal and deadline.
The job is unique or somewhat
unfamiliar to the existing
organization.
The work contains complex
interrelated tasks requiring
specialized skills.
The project organization may be most
helpful when:
slidesmania.com
PROJECT
PLANNING
The project is temporary but
critical to the organization.
The project cuts across
organizational lines.
The project organization may be most
helpful when:
slidesmania.com
A Sample Project Organization
slidesmania.com
Project managers receive high visibility in
a firm and are responsible for making
sure that:
(1) all necessary activities are finished in
proper sequence and on time;
(2) the project comes in within budget;
(3) the project meets its quality goals;
(4) the people assigned to the project
receive the motivation, direction, and
information needed to do their jobs.
Project Manager
slidesmania.com
Work Breakdown Structure
A hierarchical description of a project into more and
more detailed components.
The work breakdown structure typically decreases in
size from top to bottom and is indented like this:
Level
1. Project
2. Major tasks in the project
3. Subtasks in major tasks
4. Activities (or “work packages”) to be complete
slidesmania.com
slidesmania.com
Involves sequencing and allotting time to
all project activities. At this stage,
managers decide how long each activity
will take and compute the resources
needed at each stage of production.
PROJECT SCHEDULING
slidesmania.com
Gantt charts are low-cost
means of helping
managers make sure that
(1) activities are planned,
(2) order of performance
is documented,
(3) activity time
estimates are recorded,
and
(4) overall project time is
developed.
slidesmania.com
1. It shows the relationship of each activity to others and
to the whole project.
2. It identifies the precedence relationships among
activities.
3. It encourages the setting of realistic time and cost
estimates for each activity.
4. It helps make better use of people, money, and material
resources by identifying critical
bottlenecks in the project.
Purpose of Project Scheduling
slidesmania.com
Project Controlling
The control of projects, like the control of any
management system, involves close monitoring of
resources, costs, quality, and budgets. Control also means
using a feedback loop to revise the project plan and having
the ability to shift resources to where they are needed
most.
Computerized PERT/CPM reports and charts are widely
available today from scores of competing software firms.
slidesmania.com
These programs produce a broad variety of reports,
including
(1) detailed cost breakdowns,
(2) labor requirements,
(3) cost and hour summaries,
(4) raw material and expenditure forecasts,
(5) variance reports,
(6) time analysis reports, and
(7) work status reports.
slidesmania.com
Controlling projects can be difficult. The stakes are high; cost
overruns and unnecessary delays can occur due to poor
planning, scheduling, and controls. Some projects are “well-
defined,” whereas others may be “ill-defined.”
Waterfall projects
— Projects that progress smoothly in a step-by-step manner
until completed.
Agile projects
— Ill-defined projects requiring collaboration and constant
feedback to adjust to project unknowns.
slidesmania.com
Illustrate the project management
techniques using PERT and CPM.
Program evaluation and review technique (PERT) is a
project management technique that employs three time
estimates for each activity.
● Critical path method (CPM) is a project management
technique that uses only one time factor per activity.
03
slidesmania.com
PERT and CPM both follow six basic steps:
1. Define the project and prepare the work breakdown structure.
2. Develop the relationships among the activities. Decide which
activities must precede and which must follow others.
3. Draw the network connecting all the activities.
4. Assign time and/or cost estimates to each activity.
5. Compute the longest time path through the network. This is called
the critical path.
6. Use the network to help plan, schedule, monitor, and control the
project.
The Framework of PERT and CPM
slidesmania.com
Network Diagram and Approaches
There are two approaches for drawing a project network: activity on
node (AON) and activity on arrow (AOA).
Under the AON convention, nodes designate activities. Under AOA,
arrows represent activities. Activities consume time and resources.
The basic difference between AON and AOA is that the nodes in an
AON diagram represent activities. In an AOA network, the nodes
represent the starting and finishing times of an activity and are also
called events. So nodes in AOA consume neither time nor resources.
slidesmania.com
PREDECESSOR RELATIONSHIPS FOR POLLUTION CONTROL AT
MILWAUKEE PAPER
Milwaukee Paper Manufacturing had long delayed the expense of
installing advanced computerized air pollution control equipment in its
facility. But when the board of directors adopted a new proactive policy
on sustainability, it did not just authorize the budget for the state-of-the-
art equipment. It directed the plant manager, Julie Ann Williams, to
complete the installation in time for a major announcement of the policy,
on Earth Day, exactly 16 weeks away! Under strict deadline from her
bosses, Williams needs to be sure that installation of the filtering system
progresses smoothly and on time.
Example
slidesmania.com
Given the following information, develop a table showing activity
precedence relationships.
Milwaukee Paper has identified the eight activities that need to be
performed for the project to be completed. When the project begins,
two activities can be simultaneously started: building the internal
components for the device (activity A) and the modifications
necessary for the floor and roof (activity B). The construction of the
collection stack (activity C) can begin when the internal components
are completed. Pouring the concrete floor and installation of the
frame (activity D) can be started as soon as the internal components
are completed and the roof and floor have been modified.
slidesmania.com
After the collection stack has been constructed, two activities
can begin: building the high-temperature burner (activity E)
and installing the pollution control system (activity F). The air
pollution device can be installed (activity G) after the concrete
floor has been poured, the frame has been installed, and the
high-temperature burner has been built. Finally, after the
control system and pollution device have been installed, the
system can be inspected and tested (activity H).
slidesmania.com
Clearly, animals know more
than we think, and think a
great deal more than we
know.
― Irene M. Pepperberg
slidesmania.com
Activity –on-Node Example
Draw the AON network for Milwaukee Paper, using the data in Example 1.
SOLUTION:
In this example, there are two activities (A and B) that do not have any
predecessors.
Figure 3.5 Beginning AON Network for Milwaukee Paper
slidesmania.com
Figure 3.6 Intermediate AON Network for Milwaukee Paper
Figure 3.7 Complete AON Network for Milwaukee Paper
slidesmania.com
Activity-on-Arrow Example
ACTIVITY-ON-ARROW FOR MILWAUKEE PAPER
Using the data from Table 3.1 in Example 1, draw one activity at a time, starting
with A.
Figure 3.8 Complete AOA Network (with Dummy Activity) for Milwaukee Paper
slidesmania.com
Determine the project schedule through
critical path analysis using forward pass
and backward pass processes.
04
Let us assume Milwaukee Paper estimates the time required for each
activity, in weeks, as shown in Table 3.2.
slidesmania.com
To find the critical path, we calculate two distinct starting and ending times
for each activity. These are defined as follows:
Earliest start (ES) = earliest time at which an activity can start, assuming all
predecessors have been completed
Earliest finish (EF) = earliest time at which an activity can be finished
Latest start (LS) = latest time at which an activity can start so as to not delay
Latest finish (LF) = latest time by which an activity has to finish so as to not
Determining Project Schedule
slidesmania.com
Earliest Start Time Rule
Before an activity can start, all its immediate
predecessors must be finished:
◆ If an activity has only a single immediate
predecessor, its ES equals the EF of the
predecessor.
◆ If an activity has multiple immediate
predecessors, its ES is the maximum of all EF
values of its predecessors. That is:
ES = Max {EF of all immediate predecessors}
Earliest Finish Time Rule
The earliest finish time (EF) of an activity is the
sum of its earliest start time (ES) and its activity
time. That is:
EF = ES + Activity time
Forward Pass
Figure 3.9 Notation Used in Nodes for
Forward and Backward Pass
A process that identifies all
the early times.
slidesmania.com
COMPUTING EARLIEST START AND
FINISH TIMES FOR MILWAUKEE PAPER
Example
Calculate the earliest start and finish times for the
activities in the Milwaukee Paper Manufacturing project.
Use Table 3.2, which contains the activity times.
Complete the project network for the company’s project,
along with the ES and EF values for all activities.
slidesmania.com
Figure 3.10 Earliest Start and Earliest Finish Times for
Milwaukee Paper
slidesmania.com
Latest Finish Time Rule
This rule is again based on the fact that before an activity can start, all its immediate
predecessors must be finished:
◆ If an activity is an immediate predecessor for just a single activity, its LF
equals the LS of the activity that immediately follows it.
◆ If an activity is an immediate predecessor to more than one activity, its LF is
the minimum of all LS values of all activities that immediately follow it. That is:
LF = Min{LS of all immediate following activities} (3-3)
Latest Start Time Rule
The latest start time (LS) of an activity is the difference of its latest finish time (LF)
and its activity time. That is:
LS = LF Activity time
−
Backward Pass
An activity that finds all the late
start and late finish times.
slidesmania.com
COMPUTING LATEST START AND
FINISH TIMES FOR MILWAUKEE PAPER
Calculate the latest start and finish times for each activity in
Milwaukee Paper’s pollution project.
Use Figure 3.10 as a beginning point. Overlay 1 of Figure
3.10 shows the complete project network for Milwaukee
Paper, along with added LS and LF values for all activities.
slidesmania.com
Slack time - free time for an activity. Also referred to
as free float or free slack.
Slack is the length of time an activity can be delayed
without delaying the entire project. Mathematically:
Slack = LS ES or Slack = LF EF
− −
Calculating Slack Time and
Identifying the Critical Path(s)
slidesmania.com
Calculate the slack for the activities in the Milwaukee Paper project.
CALCULATING SLACK TIMES FOR MILWAUKEE PAPER
slidesmania.com
The activities with zero slack are called critical activities and are said to
be on the critical path.
The critical path is a continuous path through the project network
that:
◆ Starts at the first activity in the project (Start in our example).
◆ Terminates at the last activity in the project (H in our example).
◆ Includes only critical activities (i.e., activities with no slack time).
slidesmania.com
Determine the variability in activity
times.
05
In identifying all earliest and latest times so far, and the
associated critical path(s), we have adopted the CPM
approach of assuming that all activity times are known and
fixed constants.
That is, there is no variability in activity times. However, in
practice, it is likely that activity completion times vary
depending on various factors.
slidesmania.com
Three Time Estimates in PERT
● Optimistic time (a) = time an activity will take if everything goes
as planned. In estimating this value, there should be only a
small probability (say, 1/100) that the activity time will be < a.
● Pessimistic time (b) = time an activity will take assuming very
unfavorable conditions. In estimating this value, there should
also be only a small probability (also 1/100) that the activity time
will be > b.
● Most likely time (m) = most realistic estimate of the time
required to complete an activity.
slidesmania.com
ty Distribution
with Three Time Estimates
● To find the expected activity time,
t, the beta distribution weights the
three time estimates as follows:
t = (a + 4m + b) 6
∕
● To compute the dispersion or
variance of activity completion
time, we use the formula:1
Variance = [(b a) 6]2
− ∕
Figure 3.11 Beta Probability Distribution
with Three Time Estimates
slidesmania.com
EXPECTED TIMES AND VARIANCES FOR MILWAUKEE PAPER
Calculate the variance of activity times
slidesmania.com
Probability of Project Completion
PERT uses the variance of critical path activities to help
determine the variance of the overall project. Project
variance is computed by summing variances of critical
activities:
slidesmania.com
COMPUTING PROJECT VARIANCE AND STANDARD DEVIATION
FOR MILWAUKEE PAPER
Milwaukee Paper’s managers now wish to know the project’s
variance and standard deviation.
SOLUTION:
From Example 8 (Table 3.4), we have the variances of all of
the activities on the critical path
slidesmania.com
Figure 3.12 Probability Distribution for Project Completion
Times at Milwaukee Paper
slidesmania.com
PROBABILITY OF COMPLETING A PROJECT ON TIME
EXAMPLE
Julie Ann Williams would like to find the probability that her project
will be finished on or before the 16-week Earth Day deadline.
Where Z is the number of standard deviations the due date or
target date lies from the mean or expected date.
slidesmania.com
The shaded area to the left of the 16th
week (71.57%)
represents the probability that the project will be completed
in less than 16 weeks.
Figure 3.13 Probability That Milwaukee Paper Will Meet
the 16-Week Deadline
slidesmania.com
Determining Project Completion
Time for a Given Confidence Level
● Julie Ann Williams wants to find the due date that gives
her company’s project a 99% chance of on-time
completion
Example
Figure 3.14 Z-Value for 99% Probability of Project Completion at Milwaukee Paper
slidesmania.com
SOLUTION
Starting with the standard normal equation, we can solve for
the due date and rewrite the equation as:
If Williams can get the board to agree to give her a new
deadline of 19.1 weeks (or more), she can be 99% sure of
finishing the project by that new target date.
slidesmania.com
Illustrate cost-time trade-offs and project
crashing.
06
While managing a project, it is not uncommon for a project
manager to be faced with either (or both) of the following
situations:
(1) the project is behind schedule, and
(2) the scheduled project completion time has been moved
forward.
In either situation, some or all of the remaining activities
need to be speeded up (usually by adding resources) to finish
the project by the desired due date. The process by which we
shorten the duration of a project in the cheapest manner
slidesmania.com
The amount by which an activity can be shortened (i.e., the
difference between its normal time and crash time)
depends on the activity in question. Likewise, the cost of
crashing (or shortening) an activity depends on the nature
of the activity.
Managers are usually interested in speeding up a project at
the least additional cost. Hence, when choosing which
activities to crash, and by how much, we need to ensure the
following:
◆ The amount by which an activity is crashed is, in fact,
permissible
◆ Taken together, the shortened activity durations will
enable us to finish the project by the due date
slidesmania.com
Crashing a project involves four steps:
slidesmania.com
PROJECT CRASHING TO MEET A
DEADLINE AT MILWAUKEE PAPER
Suppose the plant manager at Milwaukee Paper
Manufacturing has been given only 13 weeks
(instead of 16 weeks) to install the new pollution
control equipment. As you recall, the length of Julie
Ann Williams’s critical path was 15 weeks, but she
must now complete the project in 13 weeks.
Example
slidesmania.com
Crash and Normal Times and
Costs for Activity B
slidesmania.com
To crash the project down to
13 weeks, Williams should
crash activity A by 1 week
and activity G by 1 week.
The total additional cost will
be $2,250 (= $750 +
$1,500). This is important
because many contracts for
projects include bonuses or
penalties for early or late
finishes.
Critical Path and Slack Times for Milwaukee Paper
slidesmania.com
ACTIVITY
slidesmania.com
1. Construct an AON network based on the following:
slidesmania.com
2. Insert a dummy activity and event to correct the following AOA network:
slidesmania.com
3. Calculate the critical path, project completion time T,
and project variance s2p, based on the following AON
network information:
slidesmania.com
4. To complete the wing assembly for an experimental aircraft,
Jim Gilbert has laid out the seven major activities involved.
These activities have been labeled A through G in the following
table, which also shows their estimated completion times (in
weeks) and immediate predecessors. Determine the expected
time and variance for each activity.
slidesmania.com
5. The following information has been computed from a project:
Expected total project time = T = 62 weeks
Project variance = 81
What is the probability that the project will be
completed 18 weeks before its expected
completion date?

Operations Management (Project Management).pptx

  • 1.
  • 2.
    slidesmania.com 01 Learning Outcomes Describe theimportance of project management Describe project planning, scheduling and controlling 02 03 Illustrate the project management techniques using PERT and CPM.
  • 3.
    slidesmania.com 04 Learning Outcomes Determine theproject schedule through critical path analysis using forward pass and backward pass processes. Determine the variability in activity times. 05 06 Illustrate cost-time trade-offs and project crashing.
  • 4.
    slidesmania.com PROJECT MANAGEMENT Project managementinvolves all activities associated with planning, scheduling, and controlling projects Good project management ensures that an organization’s resources are used efficiently and effectively.
  • 5.
    slidesmania.com -world’s premier manager ofmassive construction and engineering projects - famous for its construction feats on the Hoover Dam and over 25,000 other projects in 160 countries. - U.S.’s largest project manager Did you know?
  • 6.
    slidesmania.com Describe the importanceof project management ● It helps ensure that projects are completed on time, within budget, and to the expected quality of work. ● It also helps identify and mitigate risks, manage resources effectively, and ensure stakeholders are well informed and involved throughout the project. 01
  • 7.
    slidesmania.com 1. Planning: Thisphase includes goal setting, defining the project, and team organization. 2. Scheduling: This phase relates people, money, and supplies to specific activities and relates activities to each other. 3. Controlling: Here the firm monitors resources, costs, quality, and budgets. It also revises or changes plans and shifts resources to meet time and cost demands. The management of projects involves three phases:
  • 8.
    slidesmania.com Describe project planning,scheduling and controlling 02
  • 9.
    slidesmania.com PROJECT PLANNING Work tasks canbe defined with a specific goal and deadline. The job is unique or somewhat unfamiliar to the existing organization. The work contains complex interrelated tasks requiring specialized skills. The project organization may be most helpful when:
  • 10.
    slidesmania.com PROJECT PLANNING The project istemporary but critical to the organization. The project cuts across organizational lines. The project organization may be most helpful when:
  • 11.
  • 12.
    slidesmania.com Project managers receivehigh visibility in a firm and are responsible for making sure that: (1) all necessary activities are finished in proper sequence and on time; (2) the project comes in within budget; (3) the project meets its quality goals; (4) the people assigned to the project receive the motivation, direction, and information needed to do their jobs. Project Manager
  • 13.
    slidesmania.com Work Breakdown Structure Ahierarchical description of a project into more and more detailed components. The work breakdown structure typically decreases in size from top to bottom and is indented like this: Level 1. Project 2. Major tasks in the project 3. Subtasks in major tasks 4. Activities (or “work packages”) to be complete
  • 14.
  • 15.
    slidesmania.com Involves sequencing andallotting time to all project activities. At this stage, managers decide how long each activity will take and compute the resources needed at each stage of production. PROJECT SCHEDULING
  • 16.
    slidesmania.com Gantt charts arelow-cost means of helping managers make sure that (1) activities are planned, (2) order of performance is documented, (3) activity time estimates are recorded, and (4) overall project time is developed.
  • 17.
    slidesmania.com 1. It showsthe relationship of each activity to others and to the whole project. 2. It identifies the precedence relationships among activities. 3. It encourages the setting of realistic time and cost estimates for each activity. 4. It helps make better use of people, money, and material resources by identifying critical bottlenecks in the project. Purpose of Project Scheduling
  • 18.
    slidesmania.com Project Controlling The controlof projects, like the control of any management system, involves close monitoring of resources, costs, quality, and budgets. Control also means using a feedback loop to revise the project plan and having the ability to shift resources to where they are needed most. Computerized PERT/CPM reports and charts are widely available today from scores of competing software firms.
  • 19.
    slidesmania.com These programs producea broad variety of reports, including (1) detailed cost breakdowns, (2) labor requirements, (3) cost and hour summaries, (4) raw material and expenditure forecasts, (5) variance reports, (6) time analysis reports, and (7) work status reports.
  • 20.
    slidesmania.com Controlling projects canbe difficult. The stakes are high; cost overruns and unnecessary delays can occur due to poor planning, scheduling, and controls. Some projects are “well- defined,” whereas others may be “ill-defined.” Waterfall projects — Projects that progress smoothly in a step-by-step manner until completed. Agile projects — Ill-defined projects requiring collaboration and constant feedback to adjust to project unknowns.
  • 21.
    slidesmania.com Illustrate the projectmanagement techniques using PERT and CPM. Program evaluation and review technique (PERT) is a project management technique that employs three time estimates for each activity. ● Critical path method (CPM) is a project management technique that uses only one time factor per activity. 03
  • 22.
    slidesmania.com PERT and CPMboth follow six basic steps: 1. Define the project and prepare the work breakdown structure. 2. Develop the relationships among the activities. Decide which activities must precede and which must follow others. 3. Draw the network connecting all the activities. 4. Assign time and/or cost estimates to each activity. 5. Compute the longest time path through the network. This is called the critical path. 6. Use the network to help plan, schedule, monitor, and control the project. The Framework of PERT and CPM
  • 23.
    slidesmania.com Network Diagram andApproaches There are two approaches for drawing a project network: activity on node (AON) and activity on arrow (AOA). Under the AON convention, nodes designate activities. Under AOA, arrows represent activities. Activities consume time and resources. The basic difference between AON and AOA is that the nodes in an AON diagram represent activities. In an AOA network, the nodes represent the starting and finishing times of an activity and are also called events. So nodes in AOA consume neither time nor resources.
  • 24.
    slidesmania.com PREDECESSOR RELATIONSHIPS FORPOLLUTION CONTROL AT MILWAUKEE PAPER Milwaukee Paper Manufacturing had long delayed the expense of installing advanced computerized air pollution control equipment in its facility. But when the board of directors adopted a new proactive policy on sustainability, it did not just authorize the budget for the state-of-the- art equipment. It directed the plant manager, Julie Ann Williams, to complete the installation in time for a major announcement of the policy, on Earth Day, exactly 16 weeks away! Under strict deadline from her bosses, Williams needs to be sure that installation of the filtering system progresses smoothly and on time. Example
  • 25.
    slidesmania.com Given the followinginformation, develop a table showing activity precedence relationships. Milwaukee Paper has identified the eight activities that need to be performed for the project to be completed. When the project begins, two activities can be simultaneously started: building the internal components for the device (activity A) and the modifications necessary for the floor and roof (activity B). The construction of the collection stack (activity C) can begin when the internal components are completed. Pouring the concrete floor and installation of the frame (activity D) can be started as soon as the internal components are completed and the roof and floor have been modified.
  • 26.
    slidesmania.com After the collectionstack has been constructed, two activities can begin: building the high-temperature burner (activity E) and installing the pollution control system (activity F). The air pollution device can be installed (activity G) after the concrete floor has been poured, the frame has been installed, and the high-temperature burner has been built. Finally, after the control system and pollution device have been installed, the system can be inspected and tested (activity H).
  • 27.
    slidesmania.com Clearly, animals knowmore than we think, and think a great deal more than we know. ― Irene M. Pepperberg
  • 28.
    slidesmania.com Activity –on-Node Example Drawthe AON network for Milwaukee Paper, using the data in Example 1. SOLUTION: In this example, there are two activities (A and B) that do not have any predecessors. Figure 3.5 Beginning AON Network for Milwaukee Paper
  • 29.
    slidesmania.com Figure 3.6 IntermediateAON Network for Milwaukee Paper Figure 3.7 Complete AON Network for Milwaukee Paper
  • 30.
    slidesmania.com Activity-on-Arrow Example ACTIVITY-ON-ARROW FORMILWAUKEE PAPER Using the data from Table 3.1 in Example 1, draw one activity at a time, starting with A. Figure 3.8 Complete AOA Network (with Dummy Activity) for Milwaukee Paper
  • 31.
    slidesmania.com Determine the projectschedule through critical path analysis using forward pass and backward pass processes. 04 Let us assume Milwaukee Paper estimates the time required for each activity, in weeks, as shown in Table 3.2.
  • 32.
    slidesmania.com To find thecritical path, we calculate two distinct starting and ending times for each activity. These are defined as follows: Earliest start (ES) = earliest time at which an activity can start, assuming all predecessors have been completed Earliest finish (EF) = earliest time at which an activity can be finished Latest start (LS) = latest time at which an activity can start so as to not delay Latest finish (LF) = latest time by which an activity has to finish so as to not Determining Project Schedule
  • 33.
    slidesmania.com Earliest Start TimeRule Before an activity can start, all its immediate predecessors must be finished: ◆ If an activity has only a single immediate predecessor, its ES equals the EF of the predecessor. ◆ If an activity has multiple immediate predecessors, its ES is the maximum of all EF values of its predecessors. That is: ES = Max {EF of all immediate predecessors} Earliest Finish Time Rule The earliest finish time (EF) of an activity is the sum of its earliest start time (ES) and its activity time. That is: EF = ES + Activity time Forward Pass Figure 3.9 Notation Used in Nodes for Forward and Backward Pass A process that identifies all the early times.
  • 34.
    slidesmania.com COMPUTING EARLIEST STARTAND FINISH TIMES FOR MILWAUKEE PAPER Example Calculate the earliest start and finish times for the activities in the Milwaukee Paper Manufacturing project. Use Table 3.2, which contains the activity times. Complete the project network for the company’s project, along with the ES and EF values for all activities.
  • 35.
    slidesmania.com Figure 3.10 EarliestStart and Earliest Finish Times for Milwaukee Paper
  • 36.
    slidesmania.com Latest Finish TimeRule This rule is again based on the fact that before an activity can start, all its immediate predecessors must be finished: ◆ If an activity is an immediate predecessor for just a single activity, its LF equals the LS of the activity that immediately follows it. ◆ If an activity is an immediate predecessor to more than one activity, its LF is the minimum of all LS values of all activities that immediately follow it. That is: LF = Min{LS of all immediate following activities} (3-3) Latest Start Time Rule The latest start time (LS) of an activity is the difference of its latest finish time (LF) and its activity time. That is: LS = LF Activity time − Backward Pass An activity that finds all the late start and late finish times.
  • 37.
    slidesmania.com COMPUTING LATEST STARTAND FINISH TIMES FOR MILWAUKEE PAPER Calculate the latest start and finish times for each activity in Milwaukee Paper’s pollution project. Use Figure 3.10 as a beginning point. Overlay 1 of Figure 3.10 shows the complete project network for Milwaukee Paper, along with added LS and LF values for all activities.
  • 38.
    slidesmania.com Slack time -free time for an activity. Also referred to as free float or free slack. Slack is the length of time an activity can be delayed without delaying the entire project. Mathematically: Slack = LS ES or Slack = LF EF − − Calculating Slack Time and Identifying the Critical Path(s)
  • 39.
    slidesmania.com Calculate the slackfor the activities in the Milwaukee Paper project. CALCULATING SLACK TIMES FOR MILWAUKEE PAPER
  • 40.
    slidesmania.com The activities withzero slack are called critical activities and are said to be on the critical path. The critical path is a continuous path through the project network that: ◆ Starts at the first activity in the project (Start in our example). ◆ Terminates at the last activity in the project (H in our example). ◆ Includes only critical activities (i.e., activities with no slack time).
  • 41.
    slidesmania.com Determine the variabilityin activity times. 05 In identifying all earliest and latest times so far, and the associated critical path(s), we have adopted the CPM approach of assuming that all activity times are known and fixed constants. That is, there is no variability in activity times. However, in practice, it is likely that activity completion times vary depending on various factors.
  • 42.
    slidesmania.com Three Time Estimatesin PERT ● Optimistic time (a) = time an activity will take if everything goes as planned. In estimating this value, there should be only a small probability (say, 1/100) that the activity time will be < a. ● Pessimistic time (b) = time an activity will take assuming very unfavorable conditions. In estimating this value, there should also be only a small probability (also 1/100) that the activity time will be > b. ● Most likely time (m) = most realistic estimate of the time required to complete an activity.
  • 43.
    slidesmania.com ty Distribution with ThreeTime Estimates ● To find the expected activity time, t, the beta distribution weights the three time estimates as follows: t = (a + 4m + b) 6 ∕ ● To compute the dispersion or variance of activity completion time, we use the formula:1 Variance = [(b a) 6]2 − ∕ Figure 3.11 Beta Probability Distribution with Three Time Estimates
  • 44.
    slidesmania.com EXPECTED TIMES ANDVARIANCES FOR MILWAUKEE PAPER Calculate the variance of activity times
  • 45.
    slidesmania.com Probability of ProjectCompletion PERT uses the variance of critical path activities to help determine the variance of the overall project. Project variance is computed by summing variances of critical activities:
  • 46.
    slidesmania.com COMPUTING PROJECT VARIANCEAND STANDARD DEVIATION FOR MILWAUKEE PAPER Milwaukee Paper’s managers now wish to know the project’s variance and standard deviation. SOLUTION: From Example 8 (Table 3.4), we have the variances of all of the activities on the critical path
  • 47.
    slidesmania.com Figure 3.12 ProbabilityDistribution for Project Completion Times at Milwaukee Paper
  • 48.
    slidesmania.com PROBABILITY OF COMPLETINGA PROJECT ON TIME EXAMPLE Julie Ann Williams would like to find the probability that her project will be finished on or before the 16-week Earth Day deadline. Where Z is the number of standard deviations the due date or target date lies from the mean or expected date.
  • 49.
    slidesmania.com The shaded areato the left of the 16th week (71.57%) represents the probability that the project will be completed in less than 16 weeks. Figure 3.13 Probability That Milwaukee Paper Will Meet the 16-Week Deadline
  • 50.
    slidesmania.com Determining Project Completion Timefor a Given Confidence Level ● Julie Ann Williams wants to find the due date that gives her company’s project a 99% chance of on-time completion Example Figure 3.14 Z-Value for 99% Probability of Project Completion at Milwaukee Paper
  • 51.
    slidesmania.com SOLUTION Starting with thestandard normal equation, we can solve for the due date and rewrite the equation as: If Williams can get the board to agree to give her a new deadline of 19.1 weeks (or more), she can be 99% sure of finishing the project by that new target date.
  • 52.
    slidesmania.com Illustrate cost-time trade-offsand project crashing. 06 While managing a project, it is not uncommon for a project manager to be faced with either (or both) of the following situations: (1) the project is behind schedule, and (2) the scheduled project completion time has been moved forward. In either situation, some or all of the remaining activities need to be speeded up (usually by adding resources) to finish the project by the desired due date. The process by which we shorten the duration of a project in the cheapest manner
  • 53.
    slidesmania.com The amount bywhich an activity can be shortened (i.e., the difference between its normal time and crash time) depends on the activity in question. Likewise, the cost of crashing (or shortening) an activity depends on the nature of the activity. Managers are usually interested in speeding up a project at the least additional cost. Hence, when choosing which activities to crash, and by how much, we need to ensure the following: ◆ The amount by which an activity is crashed is, in fact, permissible ◆ Taken together, the shortened activity durations will enable us to finish the project by the due date
  • 54.
  • 55.
    slidesmania.com PROJECT CRASHING TOMEET A DEADLINE AT MILWAUKEE PAPER Suppose the plant manager at Milwaukee Paper Manufacturing has been given only 13 weeks (instead of 16 weeks) to install the new pollution control equipment. As you recall, the length of Julie Ann Williams’s critical path was 15 weeks, but she must now complete the project in 13 weeks. Example
  • 56.
    slidesmania.com Crash and NormalTimes and Costs for Activity B
  • 57.
    slidesmania.com To crash theproject down to 13 weeks, Williams should crash activity A by 1 week and activity G by 1 week. The total additional cost will be $2,250 (= $750 + $1,500). This is important because many contracts for projects include bonuses or penalties for early or late finishes. Critical Path and Slack Times for Milwaukee Paper
  • 58.
  • 59.
    slidesmania.com 1. Construct anAON network based on the following:
  • 60.
    slidesmania.com 2. Insert adummy activity and event to correct the following AOA network:
  • 61.
    slidesmania.com 3. Calculate thecritical path, project completion time T, and project variance s2p, based on the following AON network information:
  • 62.
    slidesmania.com 4. To completethe wing assembly for an experimental aircraft, Jim Gilbert has laid out the seven major activities involved. These activities have been labeled A through G in the following table, which also shows their estimated completion times (in weeks) and immediate predecessors. Determine the expected time and variance for each activity.
  • 63.
    slidesmania.com 5. The followinginformation has been computed from a project: Expected total project time = T = 62 weeks Project variance = 81 What is the probability that the project will be completed 18 weeks before its expected completion date?

Editor's Notes

  • #5 In the 1980’s, Bechtel handled the project management of the 1984 Los Angeles Summer Olympics More recently, the firm completed one of the largest and most complex rail construction in the US Washington D.C’s Silver Line Metro When companies or countries seek out firms to manage massive project, they go to Bechtel which through its outstanding project management has demonstrated its competitive advantage.
  • #9 For companies with multiple large project, such as construction firm, a project organization is an effective way of assigning the people and physical resources needed. Project organization is an organization formed to ensure that programs (projects) receive the proper management and attention.
  • #10 4. In such cases, dedicated team can be formed to focus solely on the projects successful completion 5. This means the projects involves multiple departments or teams within an organization.
  • #11 Project organization can be temporary or permanent. A permanent organization is usually called a matrix organization
  • #13 This defines the project by dividing it into major subcomponents (tasks), which are then subdivided into more detailed components, and finally into a set of activities and their related costs. Work breakdown structure is a helpful project management tool for several reasons. First, it breaks down the project into bite-size components, making the project less overwhelming and more manageable. Second, it provides a roadmap for the different individuals and teams working on the project.
  • #15 Managers may also chart separate schedules for personnel needs by type of skill (management, engineering, or pouring concrete) and materials made. One popular project scheduling approach is the Gantt chart.
  • #16 This is an illustration of a routine servicing of a Delta jetliner during a 40-minute layover shows that Gantt charts also can be used for scheduling repetitive operations. In this case, the chart helps point out potential delays. Delta saves $50 million a year with their turn around time, which is a reduction from its traditional 60-minute routine. On simple projects, scheduling charts sch as this permits managers to observe the progress of each activity and to spot and tackle problem areas. Gantt charts, though do not adequately illustrate the interrelationship between the activities and the resources. PERT and CPM, the two widely used network techniques have the ability to consider precedence relationships and interdependency of activities.
  • #18 Some of the more popular of these programs are Oracle Primavera (by Oracle), MindView (by Match Ware), HP Project (by Hewlett-Packard), Fast Track (by AEC Software), and Microsoft Project (by Microsoft).
  • #20 Well-defined projects are assumed to have changes small enough to be managed without substantially revising plans. Projects typically only become well defined after detailed extensive initial planning and careful definition of required inputs, resources, processes, and outputs. Well-established projects where constraints are known (e.g., buildings and roads) and engineered products (e.g., airplanes and cars) with well-defined specifications and drawings may fall into this category. Well-defined projects are assumed to have changes small enough to be managed without substantially revising plans. But many projects, such as software development (e.g., 3-D games) and new technology (e.g., landing the Mars land rover) are ill-define. These projects require what is known as an agile style of management with collaboration and constant feedback to adjust to the many unknowns of the evolving technology and project specifications. In agile projects, the project manager creates a general plan, based on overall requirements and a broad perspective of the solution.
  • #21 Program evaluation and review technique (PERT) and the critical path method (CPM) were both developed in the 1950s to help managers schedule, monitor, and control large and complex projects. CPM arrived first, as a tool developed to assist in the building and maintenance of chemical plants at DuPont. Independently, PERT was developed in 1958 for the U.S. Navy.
  • #22 Step 5, finding the critical path, is a major part of controlling a project. The activities on the critical path represent tasks that will delay the entire project if they are not completed on time. Although PERT and CPM differ to some extent in terminology and in the construction of the network, their objectives are the same. Furthermore, the analysis used in both techniques is very similar. The major difference is that PERT employs three time estimates for each activity. These time estimates are used to compute expected values and standard deviations for the activity. CPM makes the assumption that activity times are known with certainty and hence requires only one time factor for each activity.
  • #23 The first step in a PERT or CPM network is to divide the entire project into significant activities in accordance with the work breakdown structure.
  • #25 ACTIVITY A - Build internal components B - Modify roof and floor C - Construct collection stack D - Pour concrete and install frame
  • #26  E – Build high-temperature burner F – Install pollution control system G – Install air pollution device H – Inspect and test
  • #27 When there are many activities in a project with fairly complicated precedence relationships, it is difficult for an individual to comprehend the complexity of the project from just the tabular information. In such cases, a visual representation of the project, using a project network, is convenient and useful. A project network is a diagram of all the activities and the precedence relationships that exist between these activities in a project. Example 2 illustrates how to construct an AON project network for Milwaukee Paper Manufacturing. It is convenient to have the project network start and finish with a unique node. In the Milwaukee Paper example, it turns out that a unique activity, H, is the last activity in the project. We therefore automatically have a unique ending node.
  • #28 In the AON approach, we denote each activity by a node. The lines, or arrows, represent the precedence relationships between the activities. In this example, there are two activities (A and B) that do not have any predecessors. We draw separate nodes for each of these activities, as shown in Figure 3.5. Although not required, it is usually convenient to have a unique starting activity for a project. We have therefore included a dummy activity called Start in Figure 3.5. This dummy activity does not really exist and takes up zero time and resources. Activity Start is an immediate predecessor for both activities A and B, and it serves as the unique starting activity for the entire project.
  • #29 Next, we add a new node for activity C. Because activity A precedes activity C, we draw an arrow from node A to node C (see Figure 3.6). Likewise, we first draw a node to represent activity D. Then, because activities A and B both precede activity D, we draw arrows from A to D and from B to D (see Figure 3.6). We proceed in this fashion, adding a separate node for each activity and a separate line for each precedence relationship that exists. The complete AON project network for the Milwaukee Paper Manufacturing project is shown in Figure 3.7.
  • #30 In an AOA project network we can represent activities by arrows. A node represents an event, which marks the start or completion time of an activity. We usually identify an event (node) by a number. We see that activity A starts at event 1 and ends at event 2. Likewise, activity B starts at event 1 and ends at event 3. Activity C, whose only immediate predecessor is activity A, starts at node 2 and ends at node 4. Activity D, however, has two predecessors (i.e., A and B). Hence, we need both activities A and B to end at event 3, so that activity D can start at that event. However, we cannot have multiple activities with common starting and ending nodes in an AOA network. To overcome this difficulty, in such cases, we may need to add a dummy line (activity) to enforce the precedence relationship. The dummy activity, shown in Figure 3.8 as a dashed line, is inserted between events 2 and 3 to make the diagram reflect the precedence between A and D. The remainder of the AOA project network for Milwaukee Paper’s example is also shown.
  • #31 Look back at Figure 3.7 (in Example 2) for a moment to see Milwaukee Paper’s completed AON project network. Once this project network has been drawn to show all the activities and their precedence relationships, the next step is to determine the project schedule. That is, we need to identify the planned starting and ending time for each activity. Does this mean the project will take 25 weeks to complete? No. Don’t forget that several of the activities are being performed at the same time. It would take 25 weeks if they were done sequentially. To find out just how long the project will take, we perform the critical path analysis for the network.
  • #32 We use a two-pass process, consisting of a forward pass and a backward pass, to determine these time schedules for each activity. The early start and finish times (ES and EF) are determined during the forward pass. The late start and finish times (LS and LF) are determined during the backward pass.
  • #33 To clearly show the activity schedules on the project network, we use the notation shown in Figure 3.9. The ES of an activity is shown in the top left corner of the node denoting that activity. The EF is shown in the top right corner. The latest times, LS and LF, are shown in the bottom-left and bottom-right corners, respectively.
  • #34 With the help of Figure 3.10, we describe how these values are calculated. Because activity Start has no predecessors, we begin by setting its ES to 0. That is, activity Start can begin at time 0, which is the same as the beginning of week 1. If activity Start has an ES of 0, its EF is also 0, since its activity time is 0. Next, we consider activities A and B, both of which have only Start as an immediate predecessor. Using the earliest start time rule, the ES for both activities A and B equals zero, which is the EF of activity Start. Now, using the earliest finish time rule, the EF for A is 2 (= 0 + 2), and the EF for B is 3 (= 0 + 3). Since activity A precedes activity C, the ES of C equals the EF of A (= 2). The EF of C is therefore 4 (= 2 + 2). We now come to activity D. Both activities A and B are immediate predecessors for D. Whereas A has an EF of 2, activity B has an EF of 3. Using the earliest start time rule, we compute the ES of activity D as follows: ES of D = Max{EF of A, EF of B} = Max (2, 3) =3 The EF of D equals 7 (= 3 + 4). Next, both activities E and F have activity C as their only immediate predecessor. Therefore, the ES for both E and F equals 4 (= EF of C). The EF of E is 8 (= 4 + 4), and the EF of F is 7 (= 4 + 3). Activity G has both activities D and E as predecessors. Using the earliest start time rule, its ES is therefore the maximum of the EF of D and the EF of E. Hence, the ES of activity G equals 8 (= maximum of 7 and 8), and its EF equals 13 (= 8 + 5). Finally, we come to activity H. Because it also has two predecessors, F and G, the ES of H is the maximum EF of these two activities. That is, the ES of H equals 13 (= maximum of 13 and 7). This implies that the EF of H is 15 (= 13 + 2). Because H is the last activity in the project, this also implies that the earliest time in which the entire project can be completed is 15 weeks. Although the forward pass allows us to determine the earliest project completion time, it does not identify the critical path. To identify this path, we need to now conduct the backward pass to determine the LS and LF values for all activities.
  • #36 Just as the forward pass began with the first activity in the project, the backward pass begins with the last activity in the project. For each activity, we first determine its LF value, followed by its LS value. The following two rules are used in this process.
  • #37  We begin by assigning an LF value of 15 weeks for activity H. That is, we specify that the latest finish time for the entire project is the same as its earliest finish time. Using the latest start time rule, the LS of activity H is equal to 13 (= 15 − 2). Because activity H is the lone succeeding activity for both activities F and G, the LF for both F and G equals 13. This implies that the LS of G is 8 (= 13 − 5), and the LS of F is 10 (= 13 − 3). Proceeding in this fashion, we see that the LF of E is 8 (= LS of G), and its LS is 4 (= 8 − 4). Likewise, the LF of D is 8 (= LS of G), and its LS is 4 (= 8 − 4). We now consider activity C, which is an immediate predecessor to two activities: E and F. Using the latest finish time rule, we compute the LF of activity C as follows: LF of C = Min{LS of E, LS of F} = Min(4, 10) = 4 The LS of C is computed as 2 (= 4 − 2). Next, we compute the LF of B as 4 (= LS of D) and its LS as 1 (= 4 − 3). We now consider activity A. We compute its LF as 2 (= minimum of LS of C and LS of D). Hence, the LS of activity A is 0 (= 2 − 2). Finally, both the LF and LS of activity Start are equal to 0.
  • #38 Slack time - Free time for an activity. Also referred to as free float or free slack. After we have computed the earliest and latest times for all activities, it is a simple matter to find the amount of slack time that each activity
  • #39 Start with the data in Overlay 1 of Figure 3.10 in Example 5 and develop Table 3.3 one line at a time. SOLUTION Table 3.3 summarizes the ES, EF, LS, LF, and slack time for all of the firm’s activities. Activity B, for example, has 1 week of slack time because its LS is 1 and its ES is 0 (alternatively, its LF is 4 and its EF is 3). This means that activity B can be delayed by up to 1 week, and the whole project can still be finished in 15 weeks. On the other hand, activities A, C, E, G, and H have no slack time. This means that none of them can be delayed without delaying the entire project. Conversely, if plant manager Julie Ann Williams wants to reduce the total project times, she will have to reduce the length of one of these activities. Overlay 2 of Figure 3.10 shows the slack computed for each activity.
  • #41 For example, building internal components (activity A) for Milwaukee Paper Manufacturing is estimated to finish in 2 weeks. Clearly, supply-chain issues such as late arrival of materials, absence of key personnel, and so on could delay this activity. Suppose activity A actually ends up taking 3 weeks. Because A is on the critical path, the entire project will now be delayed by 1 week to 16 weeks. If we had anticipated completion of this project in 15 weeks, we would obviously miss our Earth Day deadline. This means that we cannot ignore the impact of variability in activity times when deciding the schedule for a project. PERT addresses this issue.
  • #42 Optimistic time The “best” activity completion time that could be obtained in a PERT network. Pessimistic time The “worst” activity time that could be expected in a PERT network. Most likely time The most probable time to complete an activity in a PERT network.
  • #43 When using PERT, we often assume that activity time estimates follow the beta probability distribution (see Figure 3.11). This continuous distribution is often appropriate for determining the expected value and variance for activity completion times.
  • #44 The critical path analysis helped us determine that Milwaukee Paper’s expected project completion time is 15 weeks. Julie Ann Williams knows, however, that there is significant variation in the time estimates for several activities. Variation in activities that are on the critical path can affect the overall project completion time—possibly delaying it. This is one occurrence that worries the plant manager considerably
  • #46 Because the activities are independent, we can add the variances of the activities on the critical path and then take the square root to determine the project’s standard deviation. Specifically, we know that the variance of activity A is 0.11, variance of activity C is 0.11, variance of activity E is 1.00, variance of activity G is 1.78, and variance of activity H is 0.11. Compute the total project variance and project standard deviation: How can this information be used to help answer questions regarding the probability of finishing the project on time? PERT makes two more assumptions: (1) total project completion times follow a normal probability distribution, and (2) activity times are statistically independent.
  • #47 With these assumptions, the bell-shaped normal curve shown in Figure 3.12 can be used to represent project completion dates. This normal curve implies that there is a 50% chance that the manufacturer’s project completion time will be less than 15 weeks and a 50% chance that it will exceed 15 weeks.
  • #48 Referring to the Normal Table in Appendix I (alternatively using the Excel formula =NORMSDIST(0.57)), we find a Z-value of 0.57 to the right of the mean indicates a probability of 0.7157. Thus, there is a 71.57% chance that the pollution control equipment can be put in place in 16 weeks or less.
  • #50 Let’s say Julie Ann Williams is worried that there is only a 71.57% chance that the pollution control equipment can be put in place in 16 weeks or less. She wants to find the deadline by which she has a 99% chance of completing the project. She hopes to use her analysis to convince the board to agree to this extended deadline, even though she is aware of the public relations damage the delay will cause. SOLUTION She first needs to compute the Z-value corresponding to 99%, as shown in Figure 3.14. Mathematically, this is similar to Example 10, except the unknown is now the due date rather than Z. Referring again to the Normal Table in Appendix I (alternatively using the Excel formula =NORMSINV(0.99)), we identify a Z-value of 2.33 as being closest to the probability of 0.99. That is, Julie Ann Williams’s due date should be 2.33 standard deviations above the mean project completion time
  • #51 Project management techniques have thus far been able to provide Julie Ann Williams with several valuable pieces of management information: 1. The project’s expected completion date is 15 weeks. 2. There is a 71.57% chance that the equipment will be in place within the 16-week deadline. PERT analysis can easily find the probability of finishing by any date Williams is interested in. 3. Five activities (A, C, E, G, and H) are on the critical path. If any one of these is delayed for any reason, the entire project will be delayed. 4. Three activities (B, D, F) are not critical and have some slack time built in. This means that Williams can borrow from their resources, and, if necessary, she may be able to speed up the whole project. 5. A detailed schedule of activity starting and ending dates, slack, and critical path activities has been made available (see Table 3.3 in Example 6).
  • #52 CPM is a technique in which each activity has a normal or standard time that we use in our computations. Associated with this normal time is the normal cost of the activity. However, another time in project management is the crash time, which is defined as the shortest duration required to complete an activity. Associated with this crash time is the crash cost of the activity. Usually, we can shorten an activity by adding extra resources (e.g., equipment, people) to it. Hence, it is logical for the crash cost of an activity to be higher than its normal cost.
  • #55 Williams needs to determine which activities to crash, and by how much, to meet this 13-week due date. Naturally, Williams is interested in speeding up the project by 2 weeks, at the least additional cost The company’s normal and crash times, and normal and crash costs, are shown in Table 3.5. Note, for example, that activity B’s normal time is 3 weeks (the estimate used in computing the critical path), and its crash time is 1 week. This means that activity B can be shortened by up to 2 weeks if extra resources are provided. The cost of these additional resources is $4,000 (= difference between the crash cost of $34,000 and the normal cost of $30,000). If we assume that the crashing cost is linear over time (i.e., the cost is the same each week), activity B’s crash cost per week is $2,000 (= $4,000/2).
  • #57 The current critical path (using normal times) is Start–A–C–E–G–H, in which Start is just a dummy starting activity. Of these critical activities, activity A has the lowest crash cost per week of $750. Julie Ann Williams should therefore crash activity A by 1 week to reduce the project completion time to 14 weeks. The cost is an additional $750. Note that activity A cannot be crashed any further, since it has reached its crash limit of 1 week At this stage, the original path Start–A–C–E–G–H remains critical with a completion time of 14 weeks. However, a new path Start–B–D–G–H is also critical now, with a completion time of 14 weeks. Hence, any further crashing must be done to both critical paths. On each of these critical paths, we need to identify one activity that can still be crashed. We also want the total cost of crashing an activity on each path to be the smallest. We might be tempted to simply pick the activities with the smallest crash cost per period in each path. If we did this, we would select activity C from the first path and activity D from the second path. The total crash cost would then be $2,000 (= $1,000 + $1,000). But we spot that activity G is common to both paths. That is, by crashing activity G, we will simultaneously reduce the completion time of both paths. Even though the $1,500 crash cost for activity G is higher than that for activities C and D, we would still prefer crashing G because the total crashing cost will now be only $1,500 (compared with the $2,000 if we crash C and D). INSIGHT: To crash the project down to 13 weeks, Williams should crash activity A by 1 week and activity G by 1 week. The total additional cost will be $2,250 (= $750 + $1,500). This is important because many contracts for projects include bonuses or penalties for early or late finishes.