Download to read offline
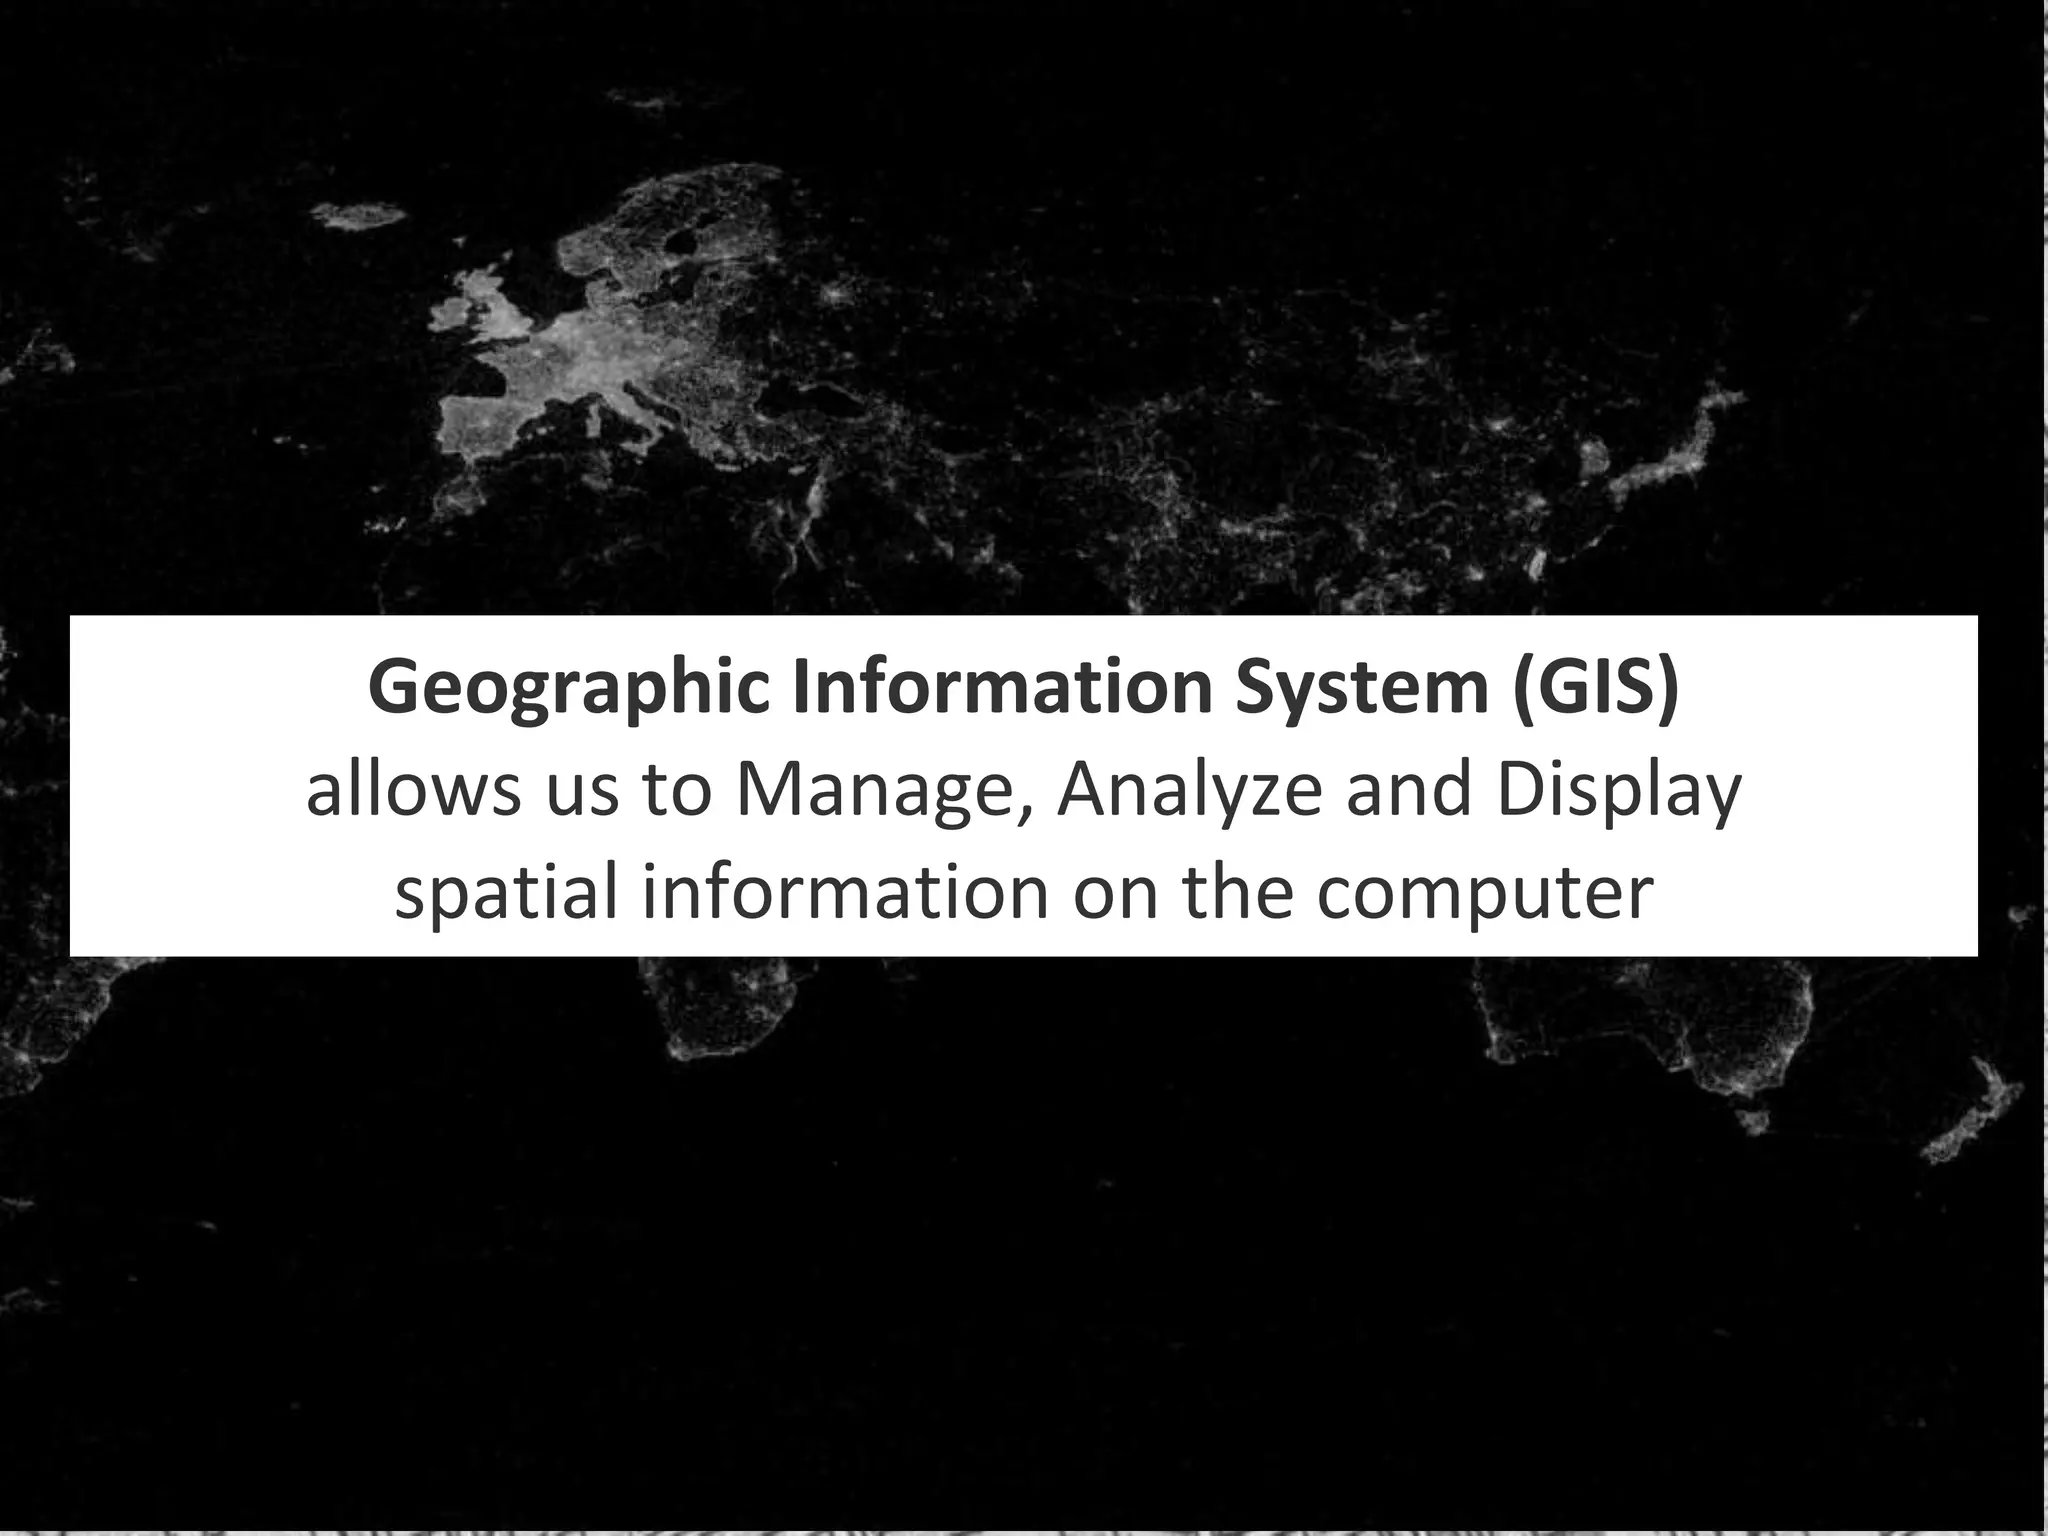
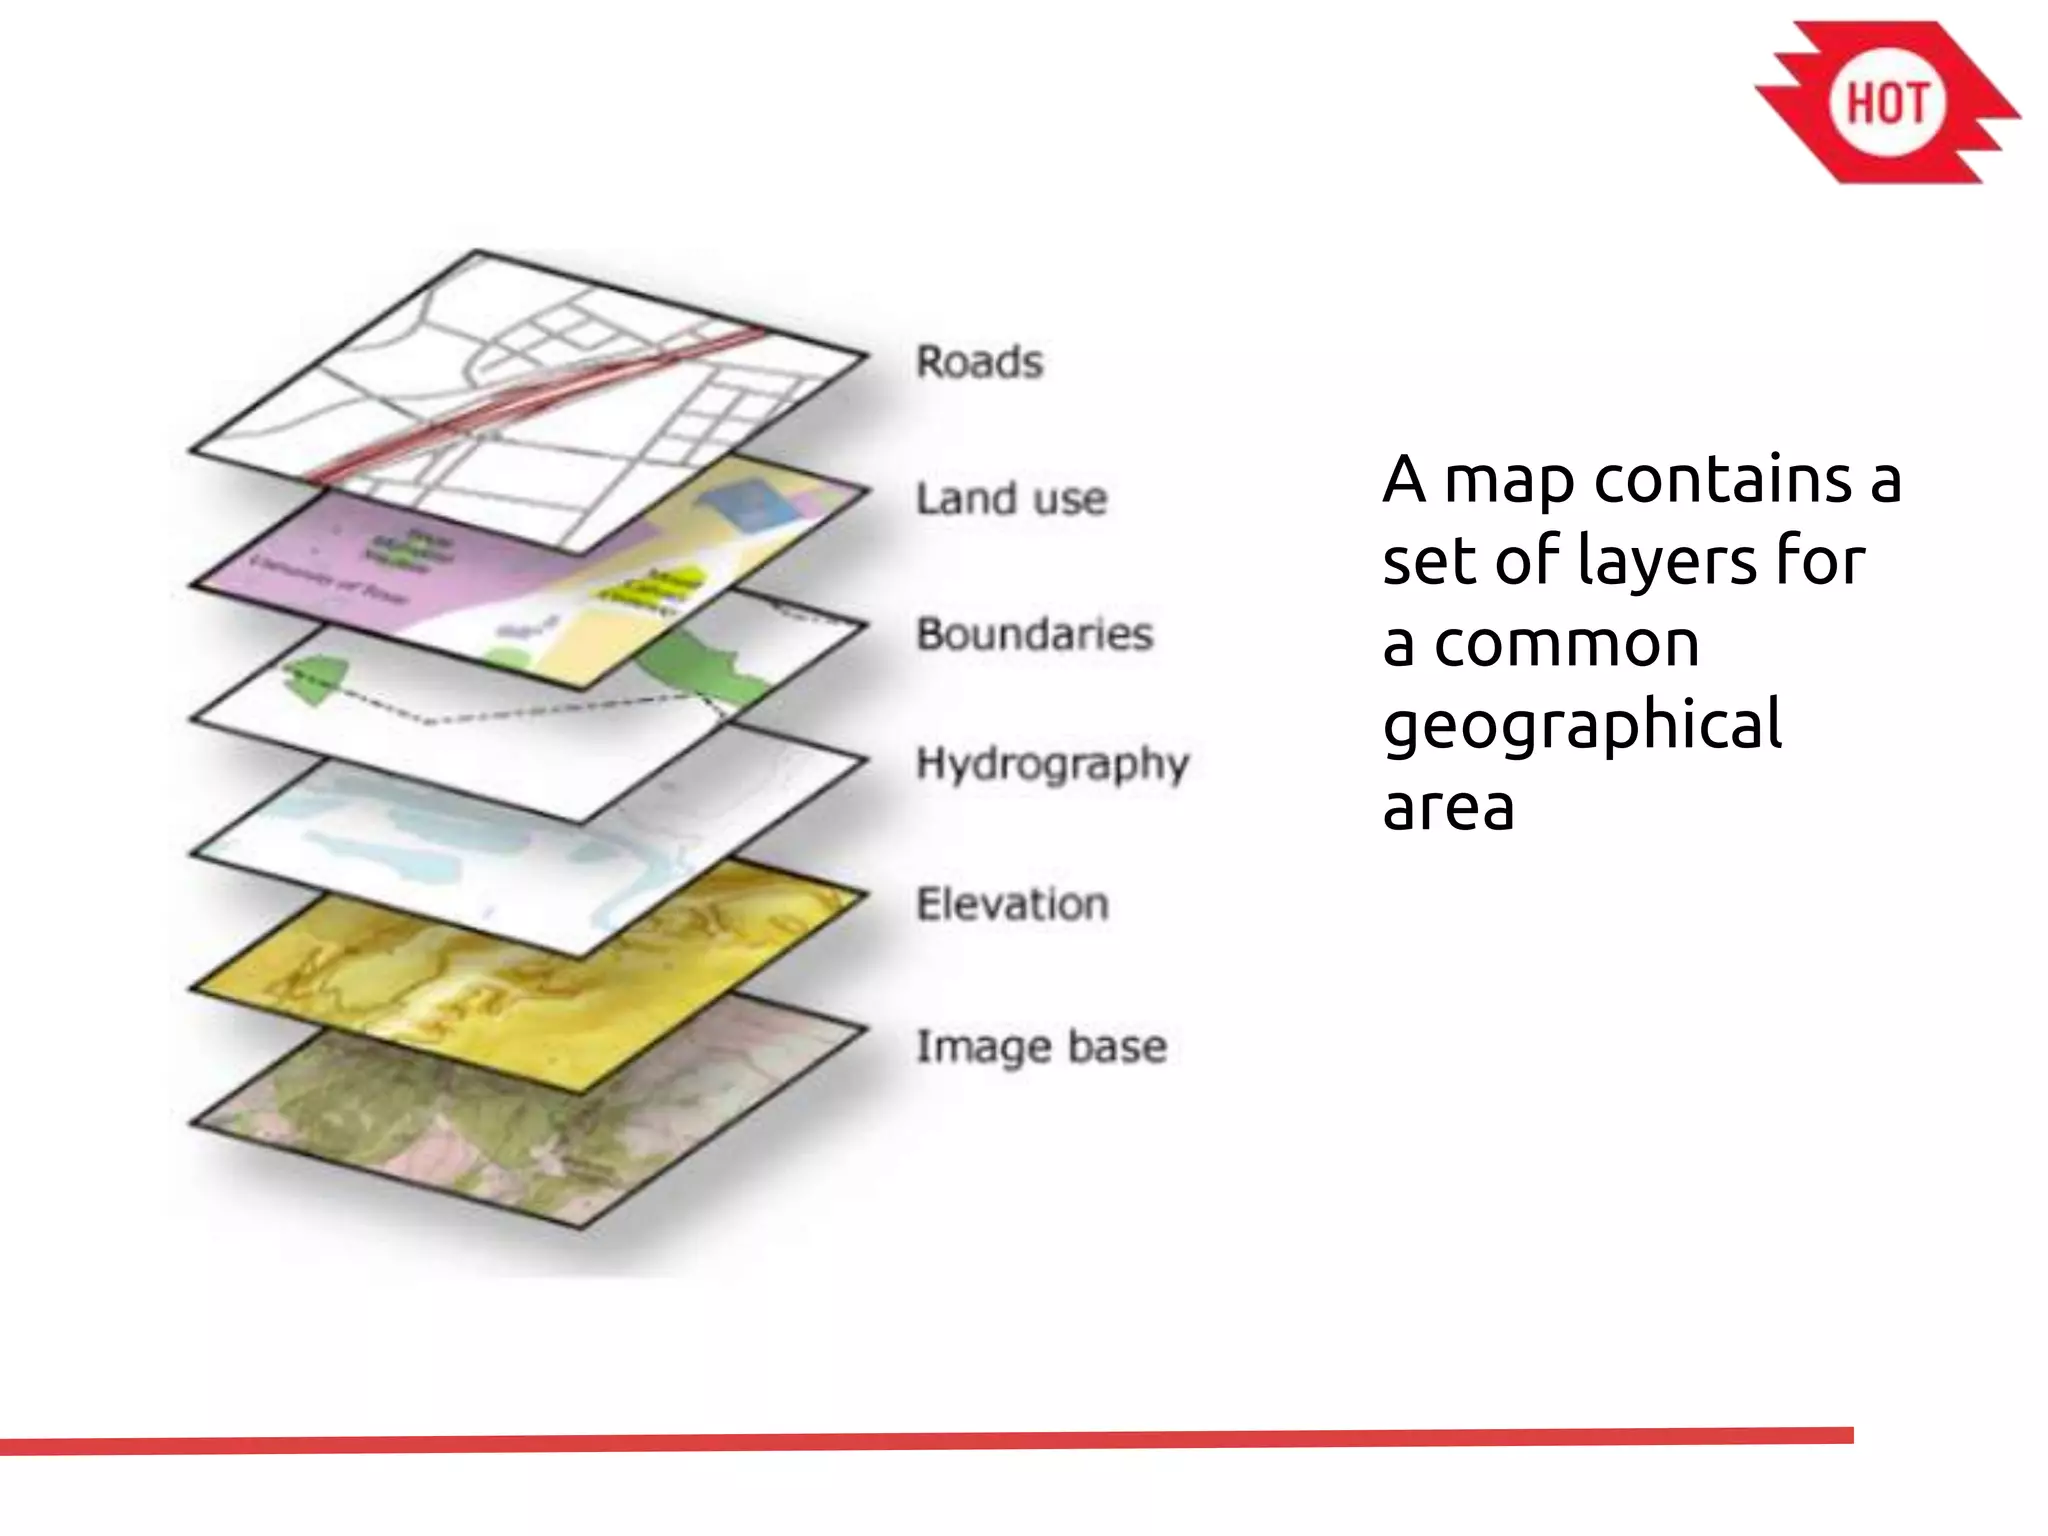
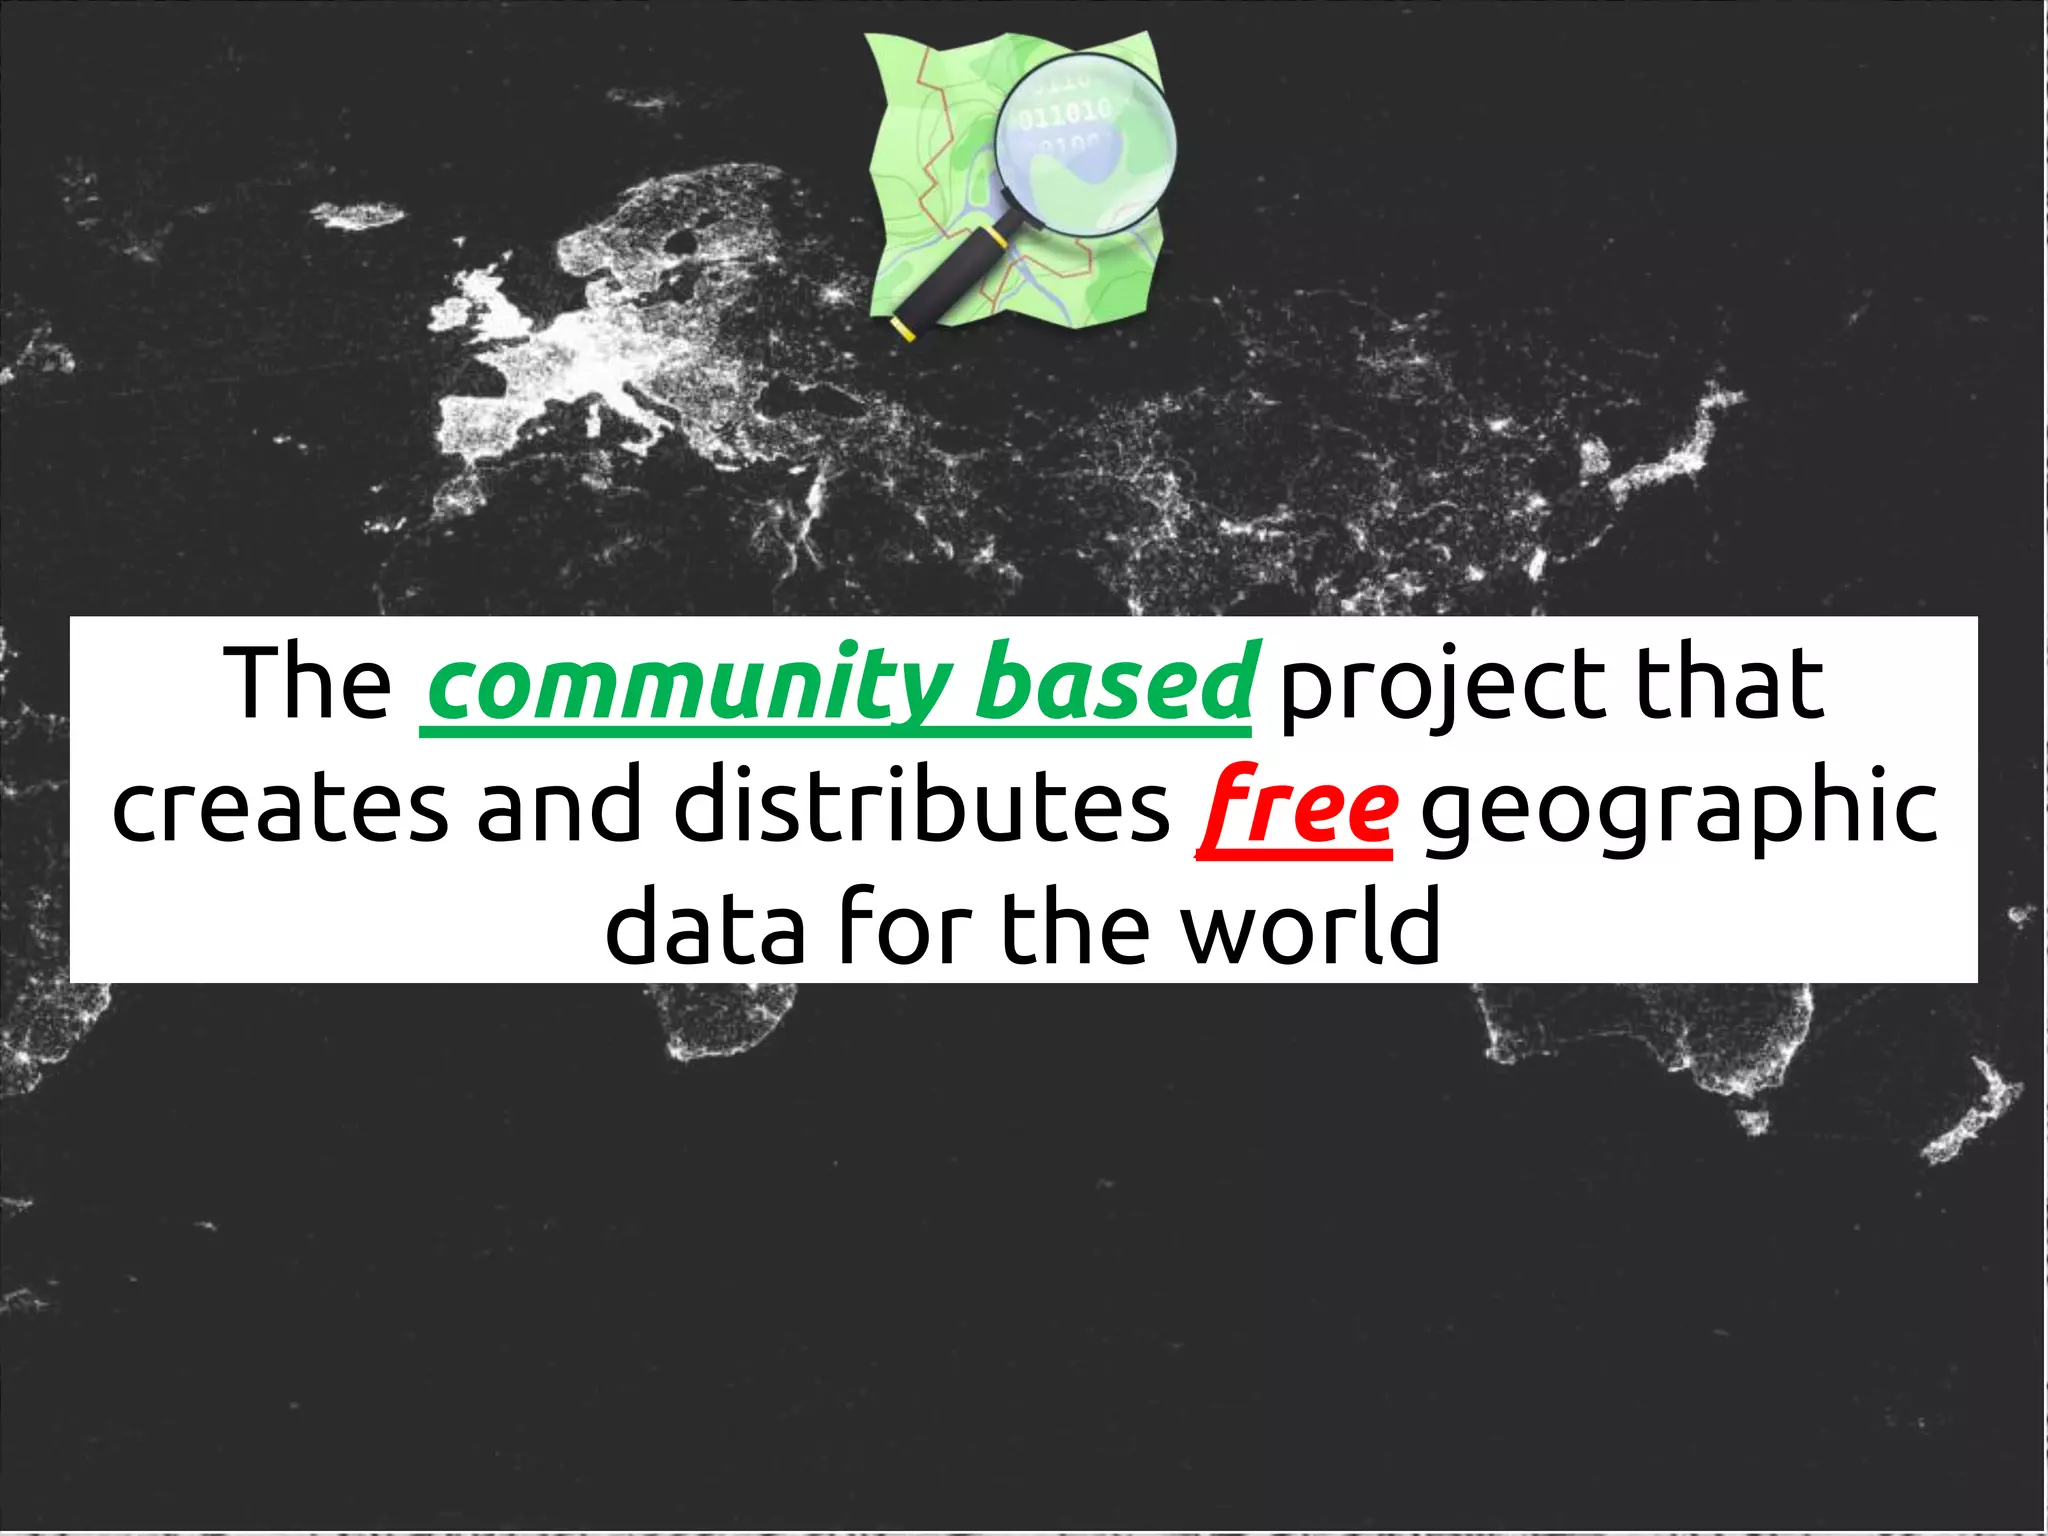
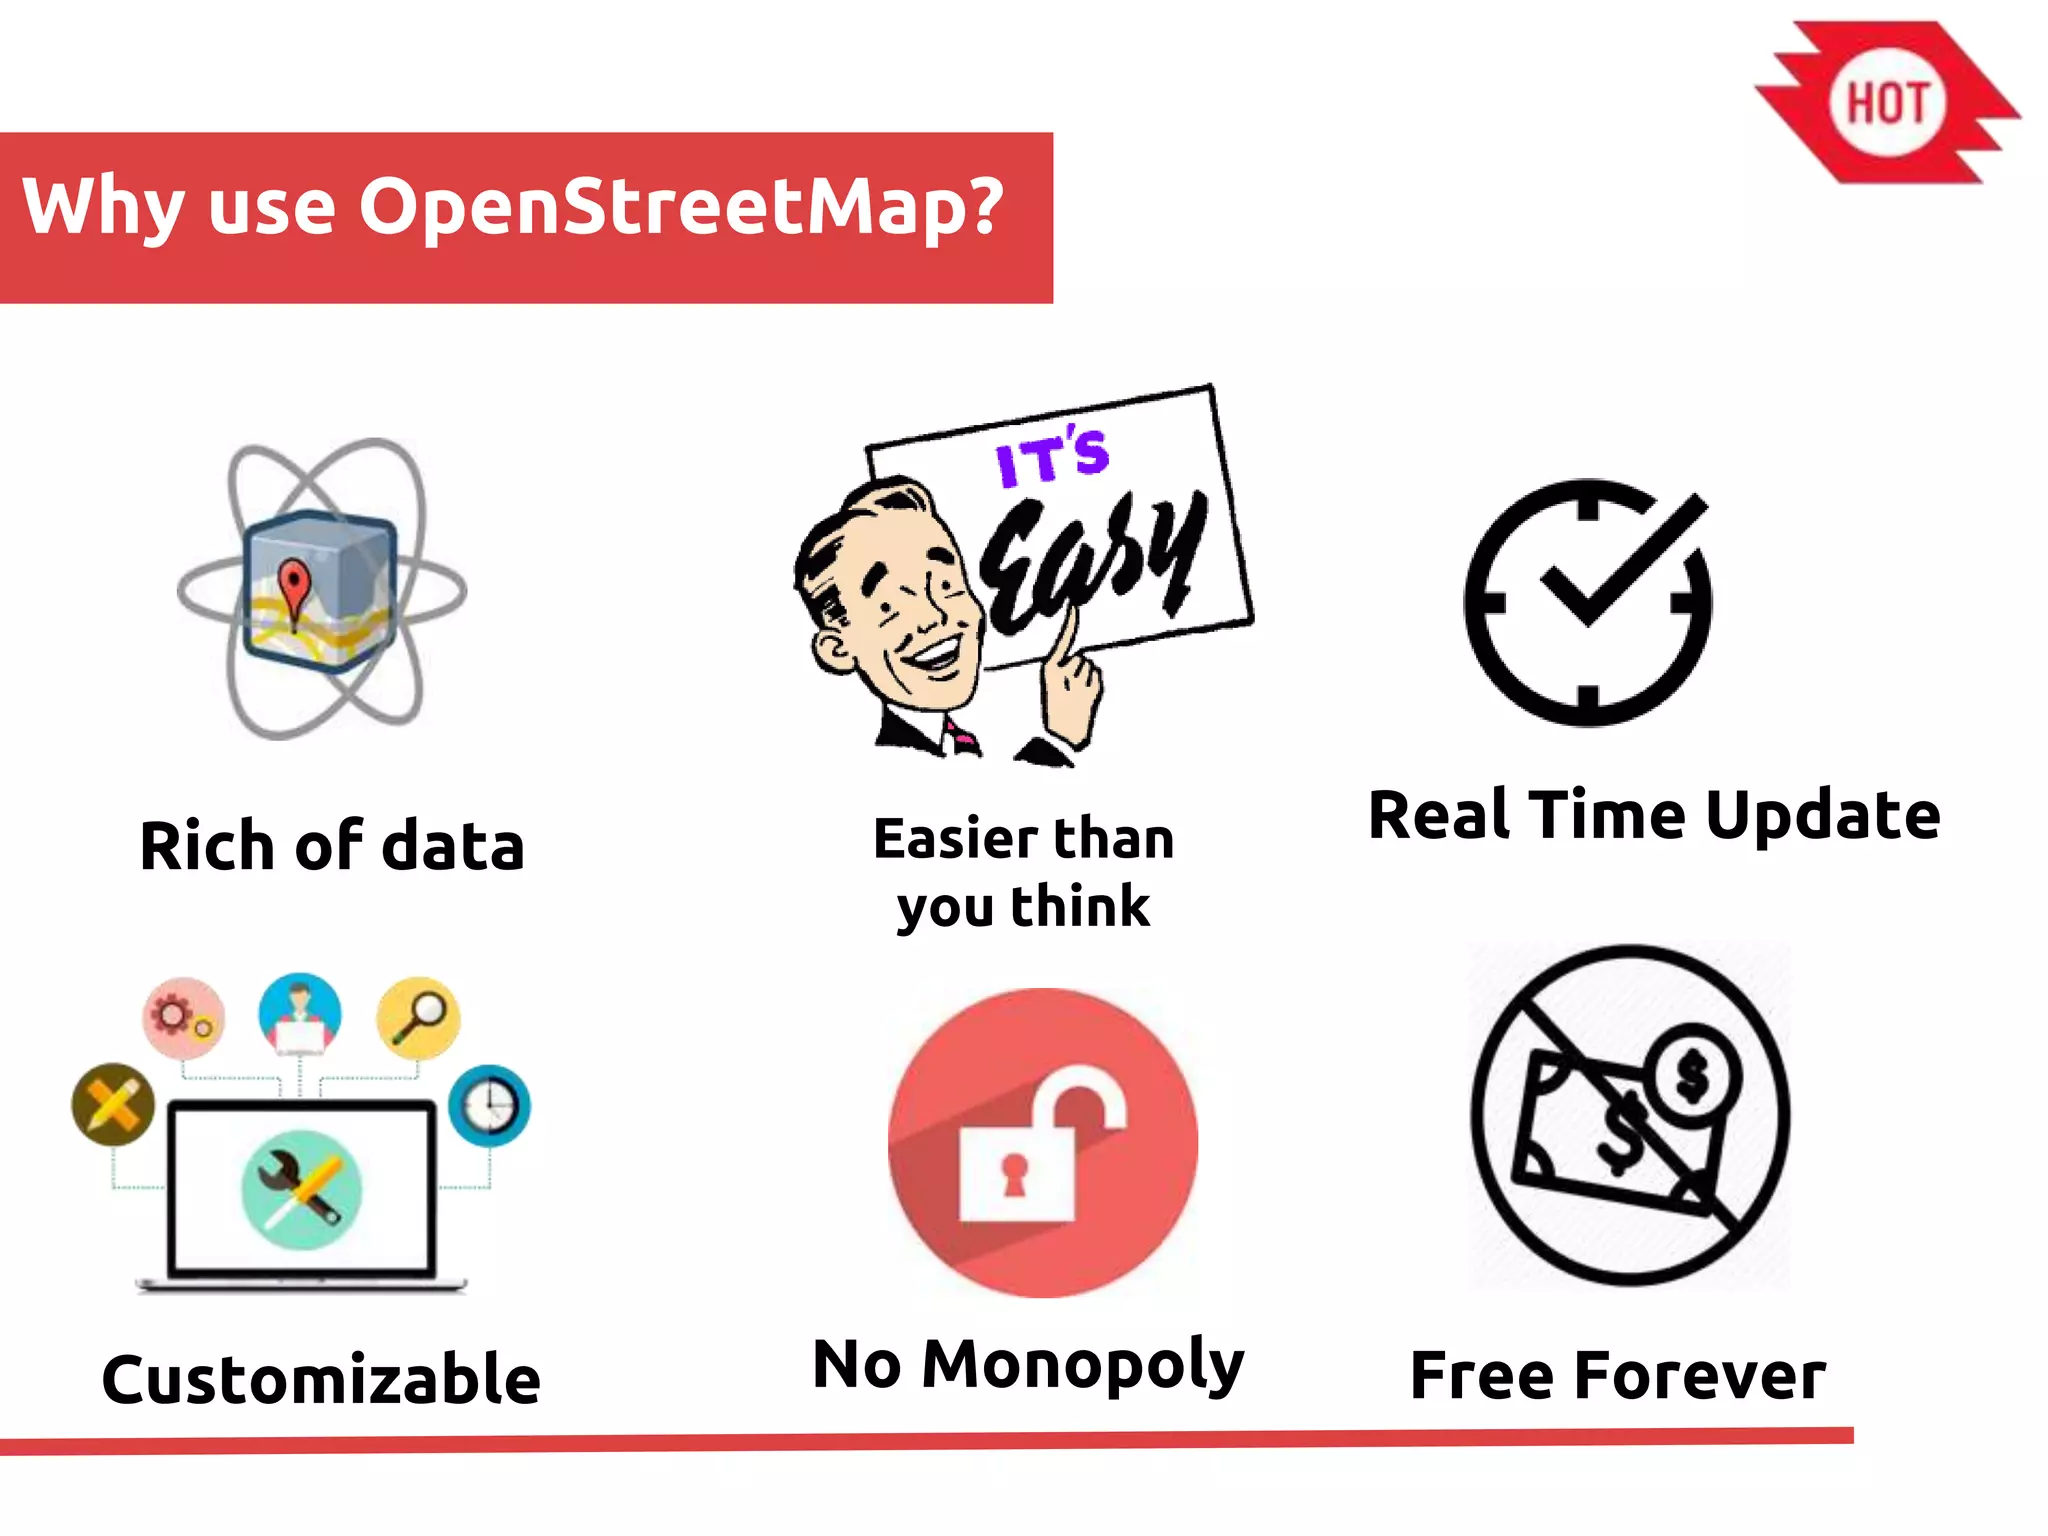
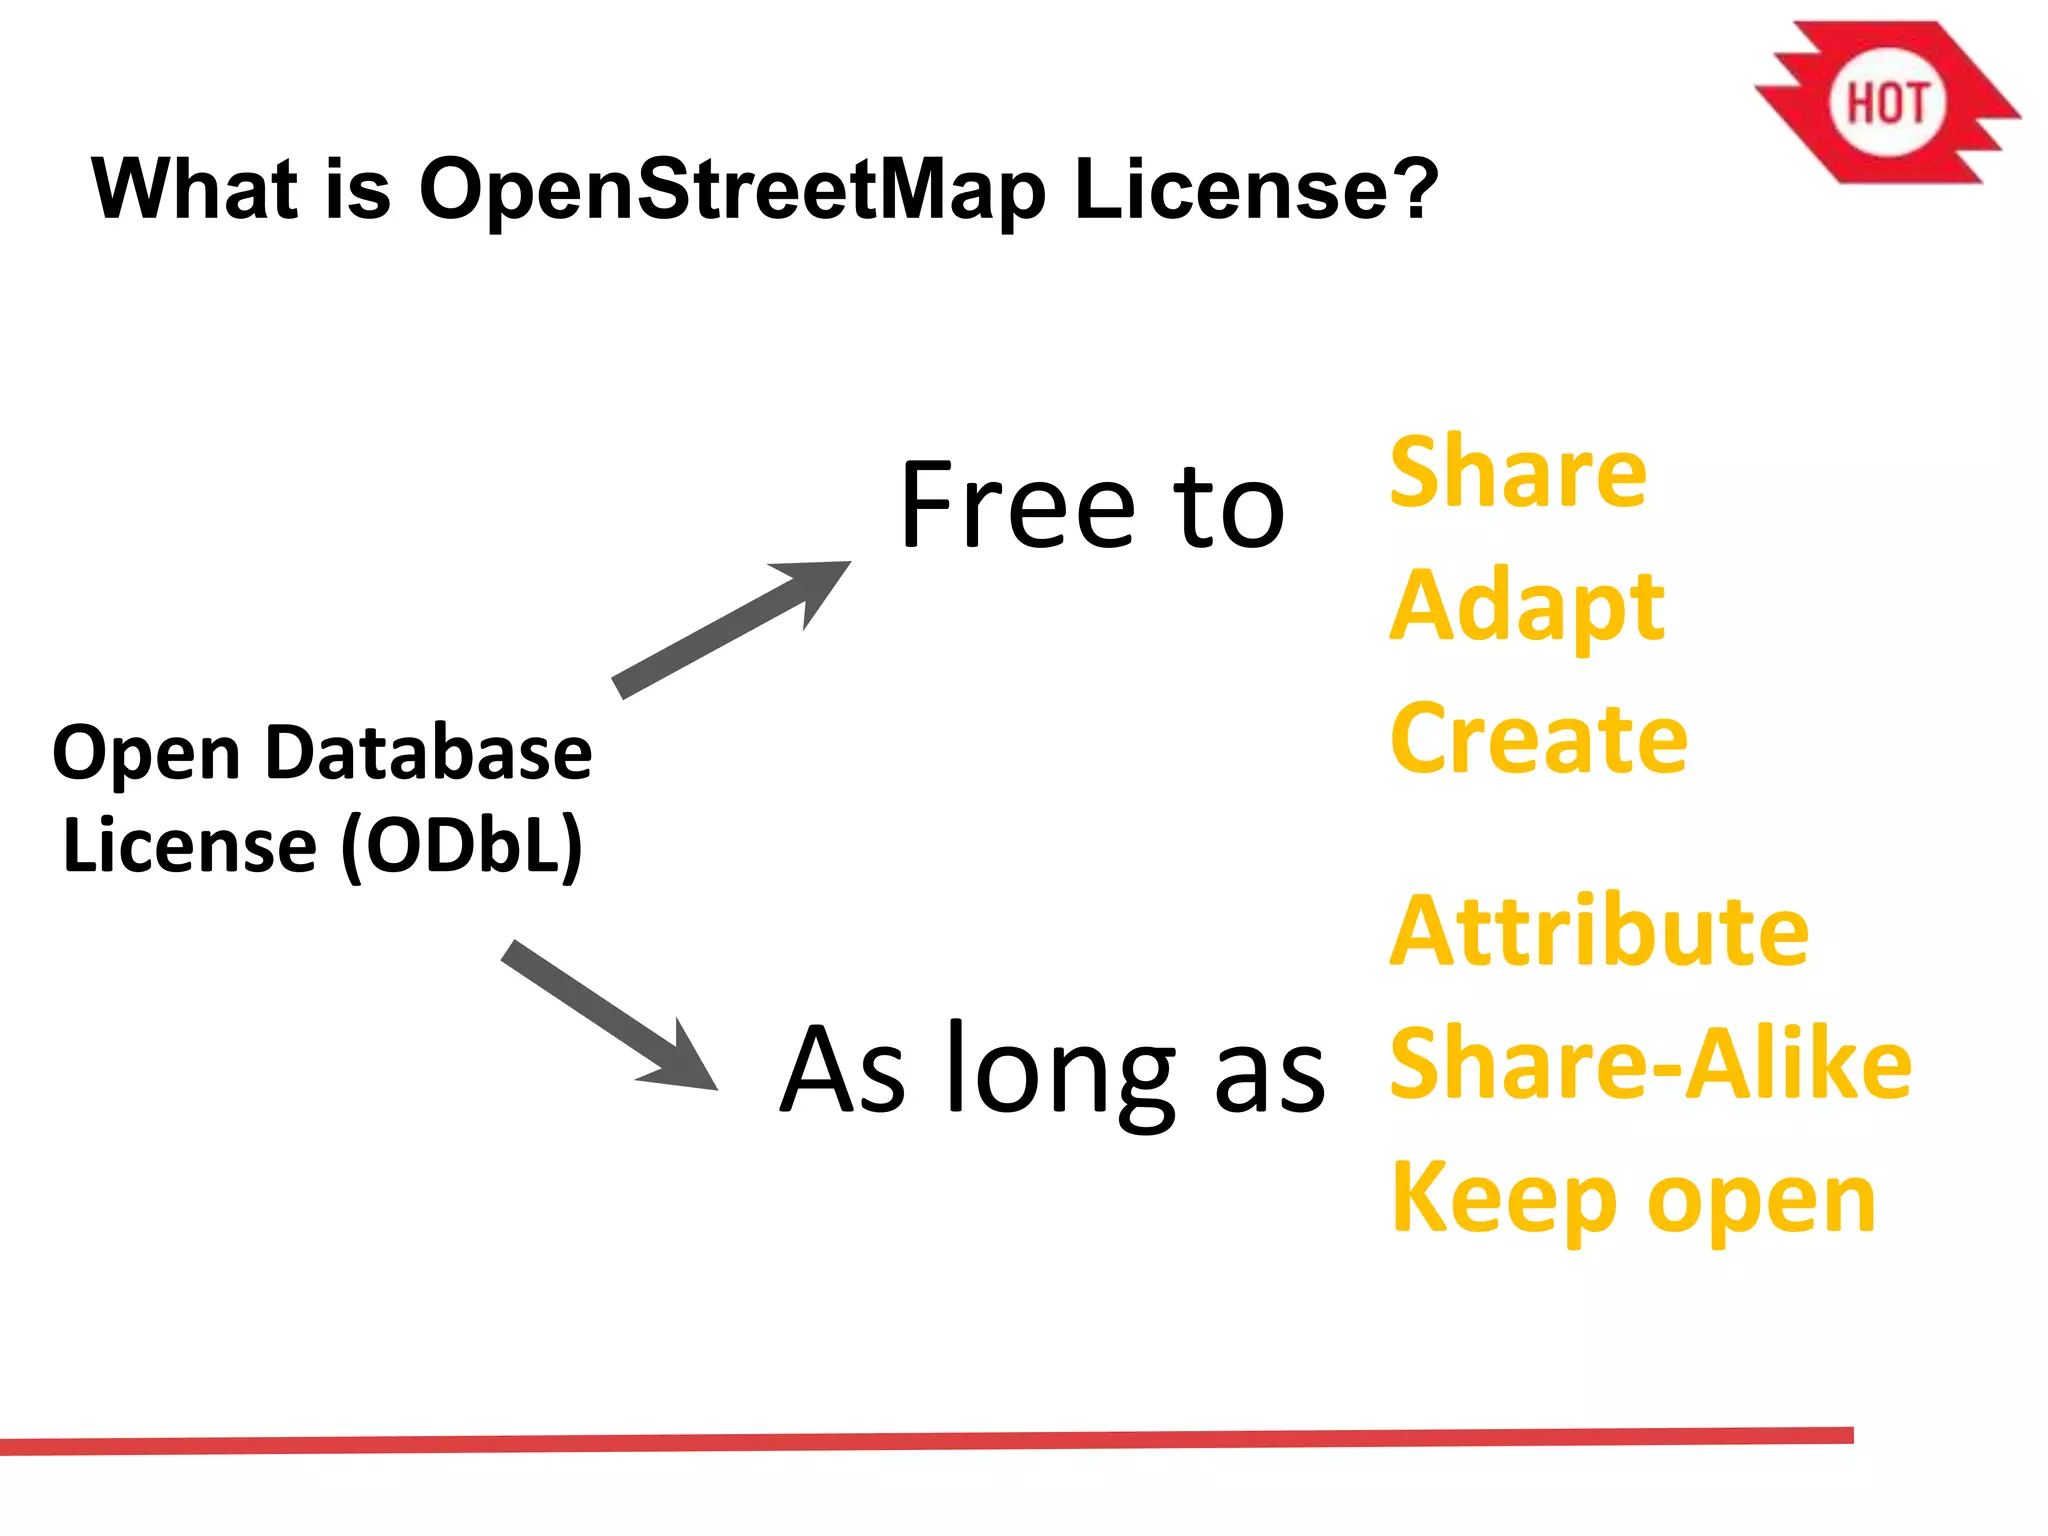
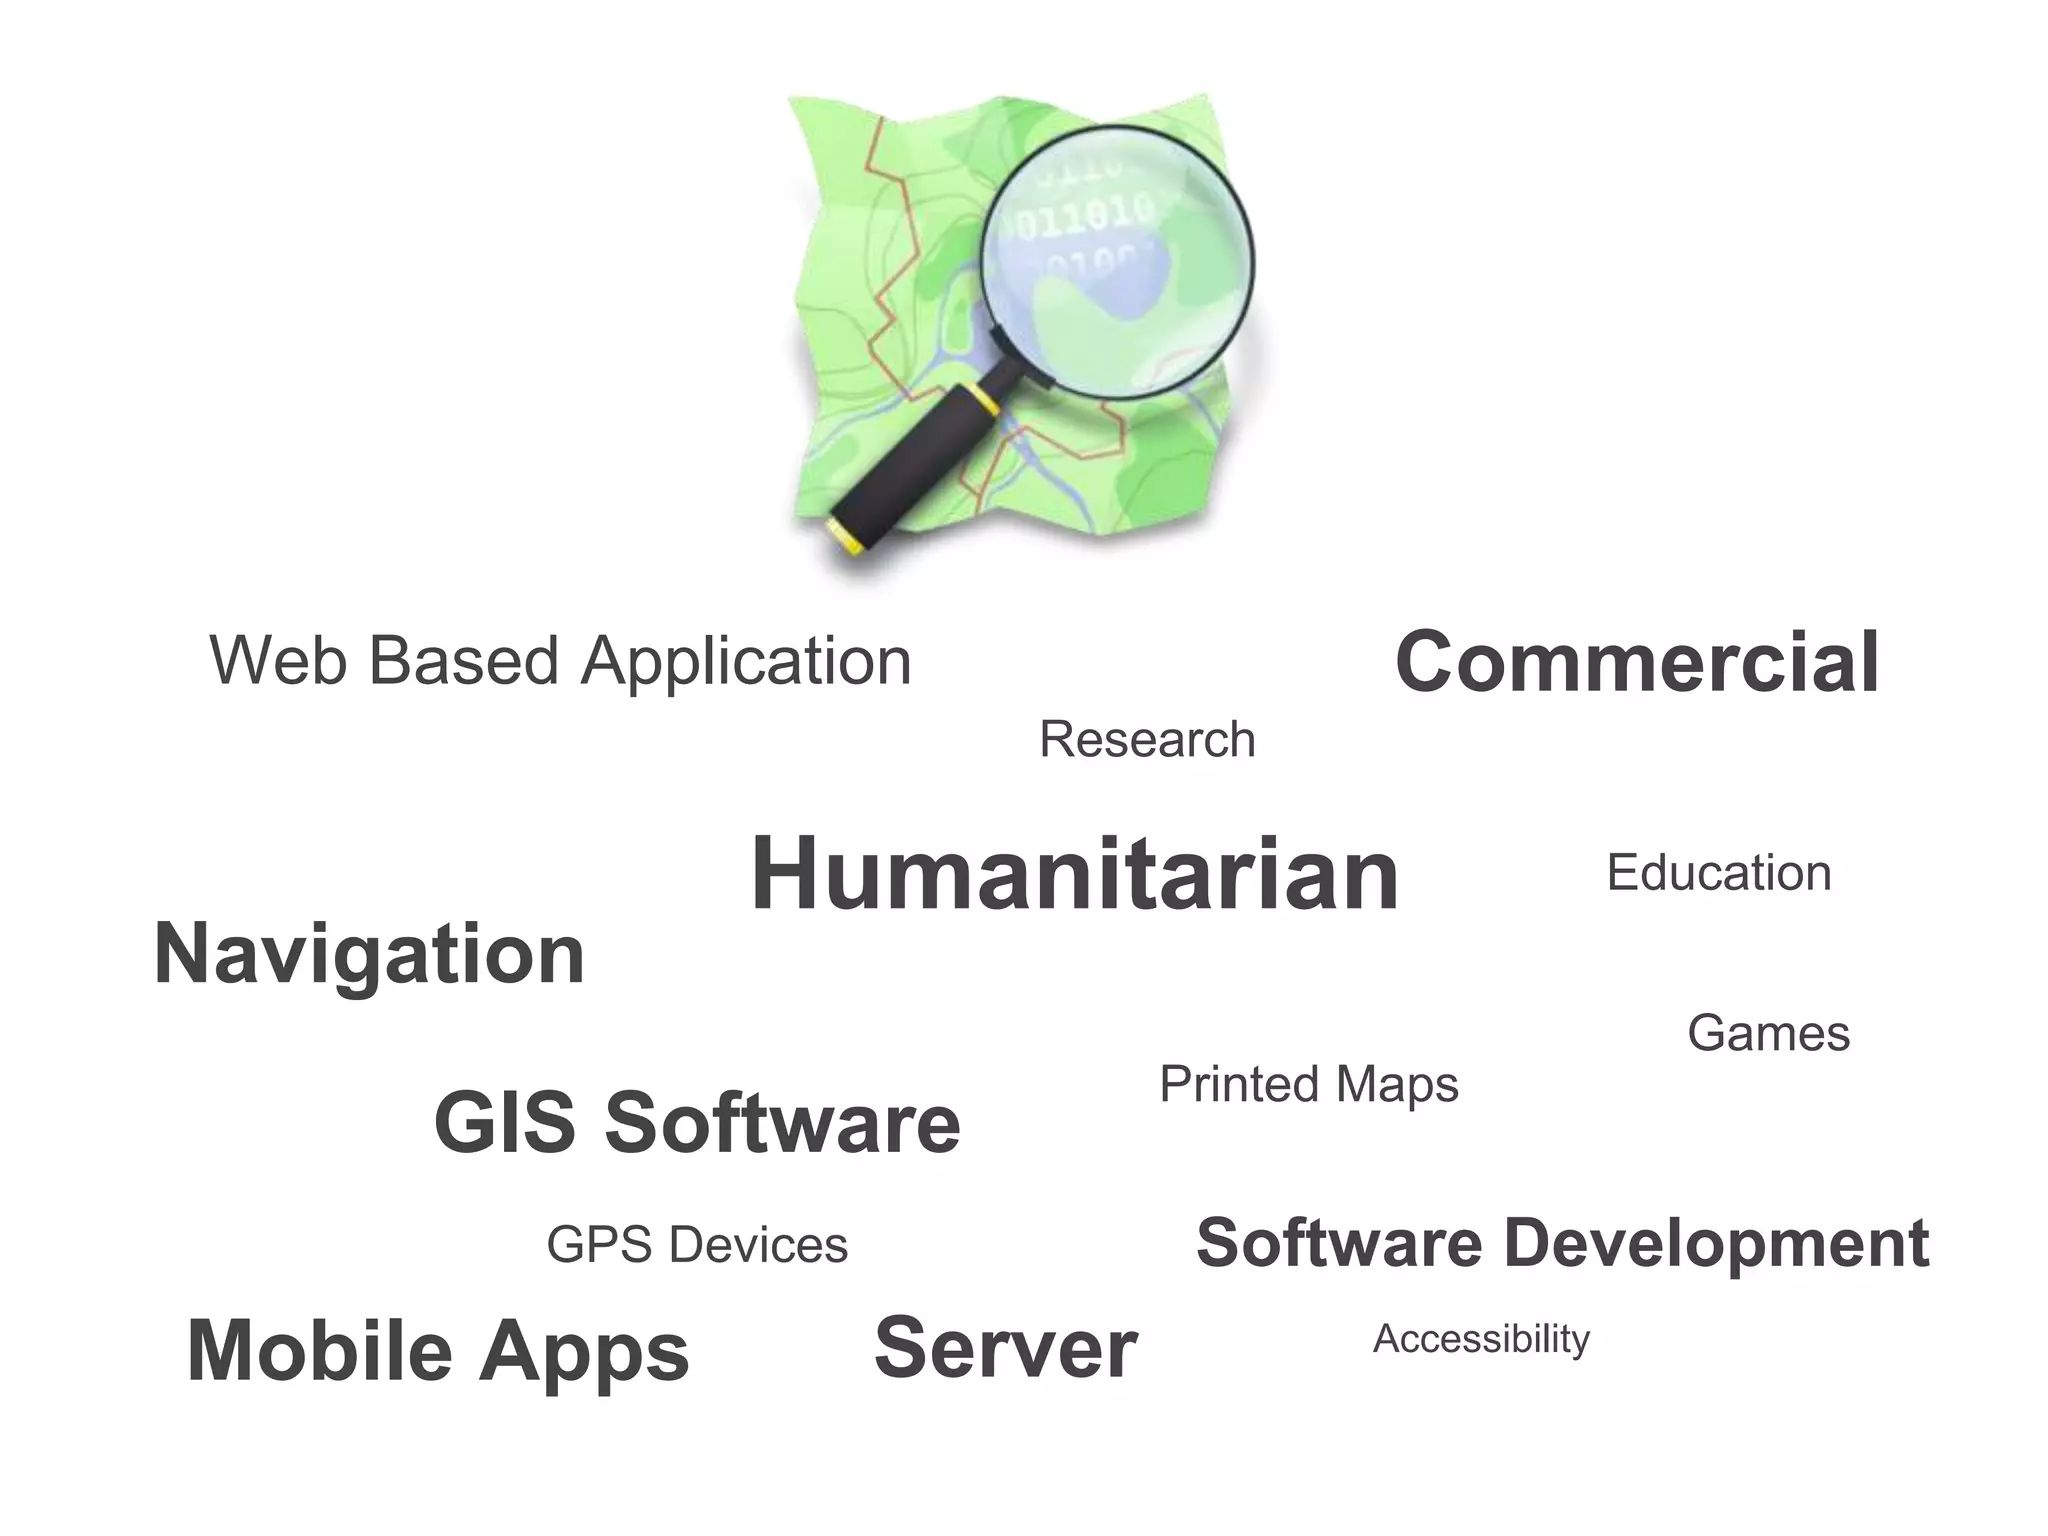
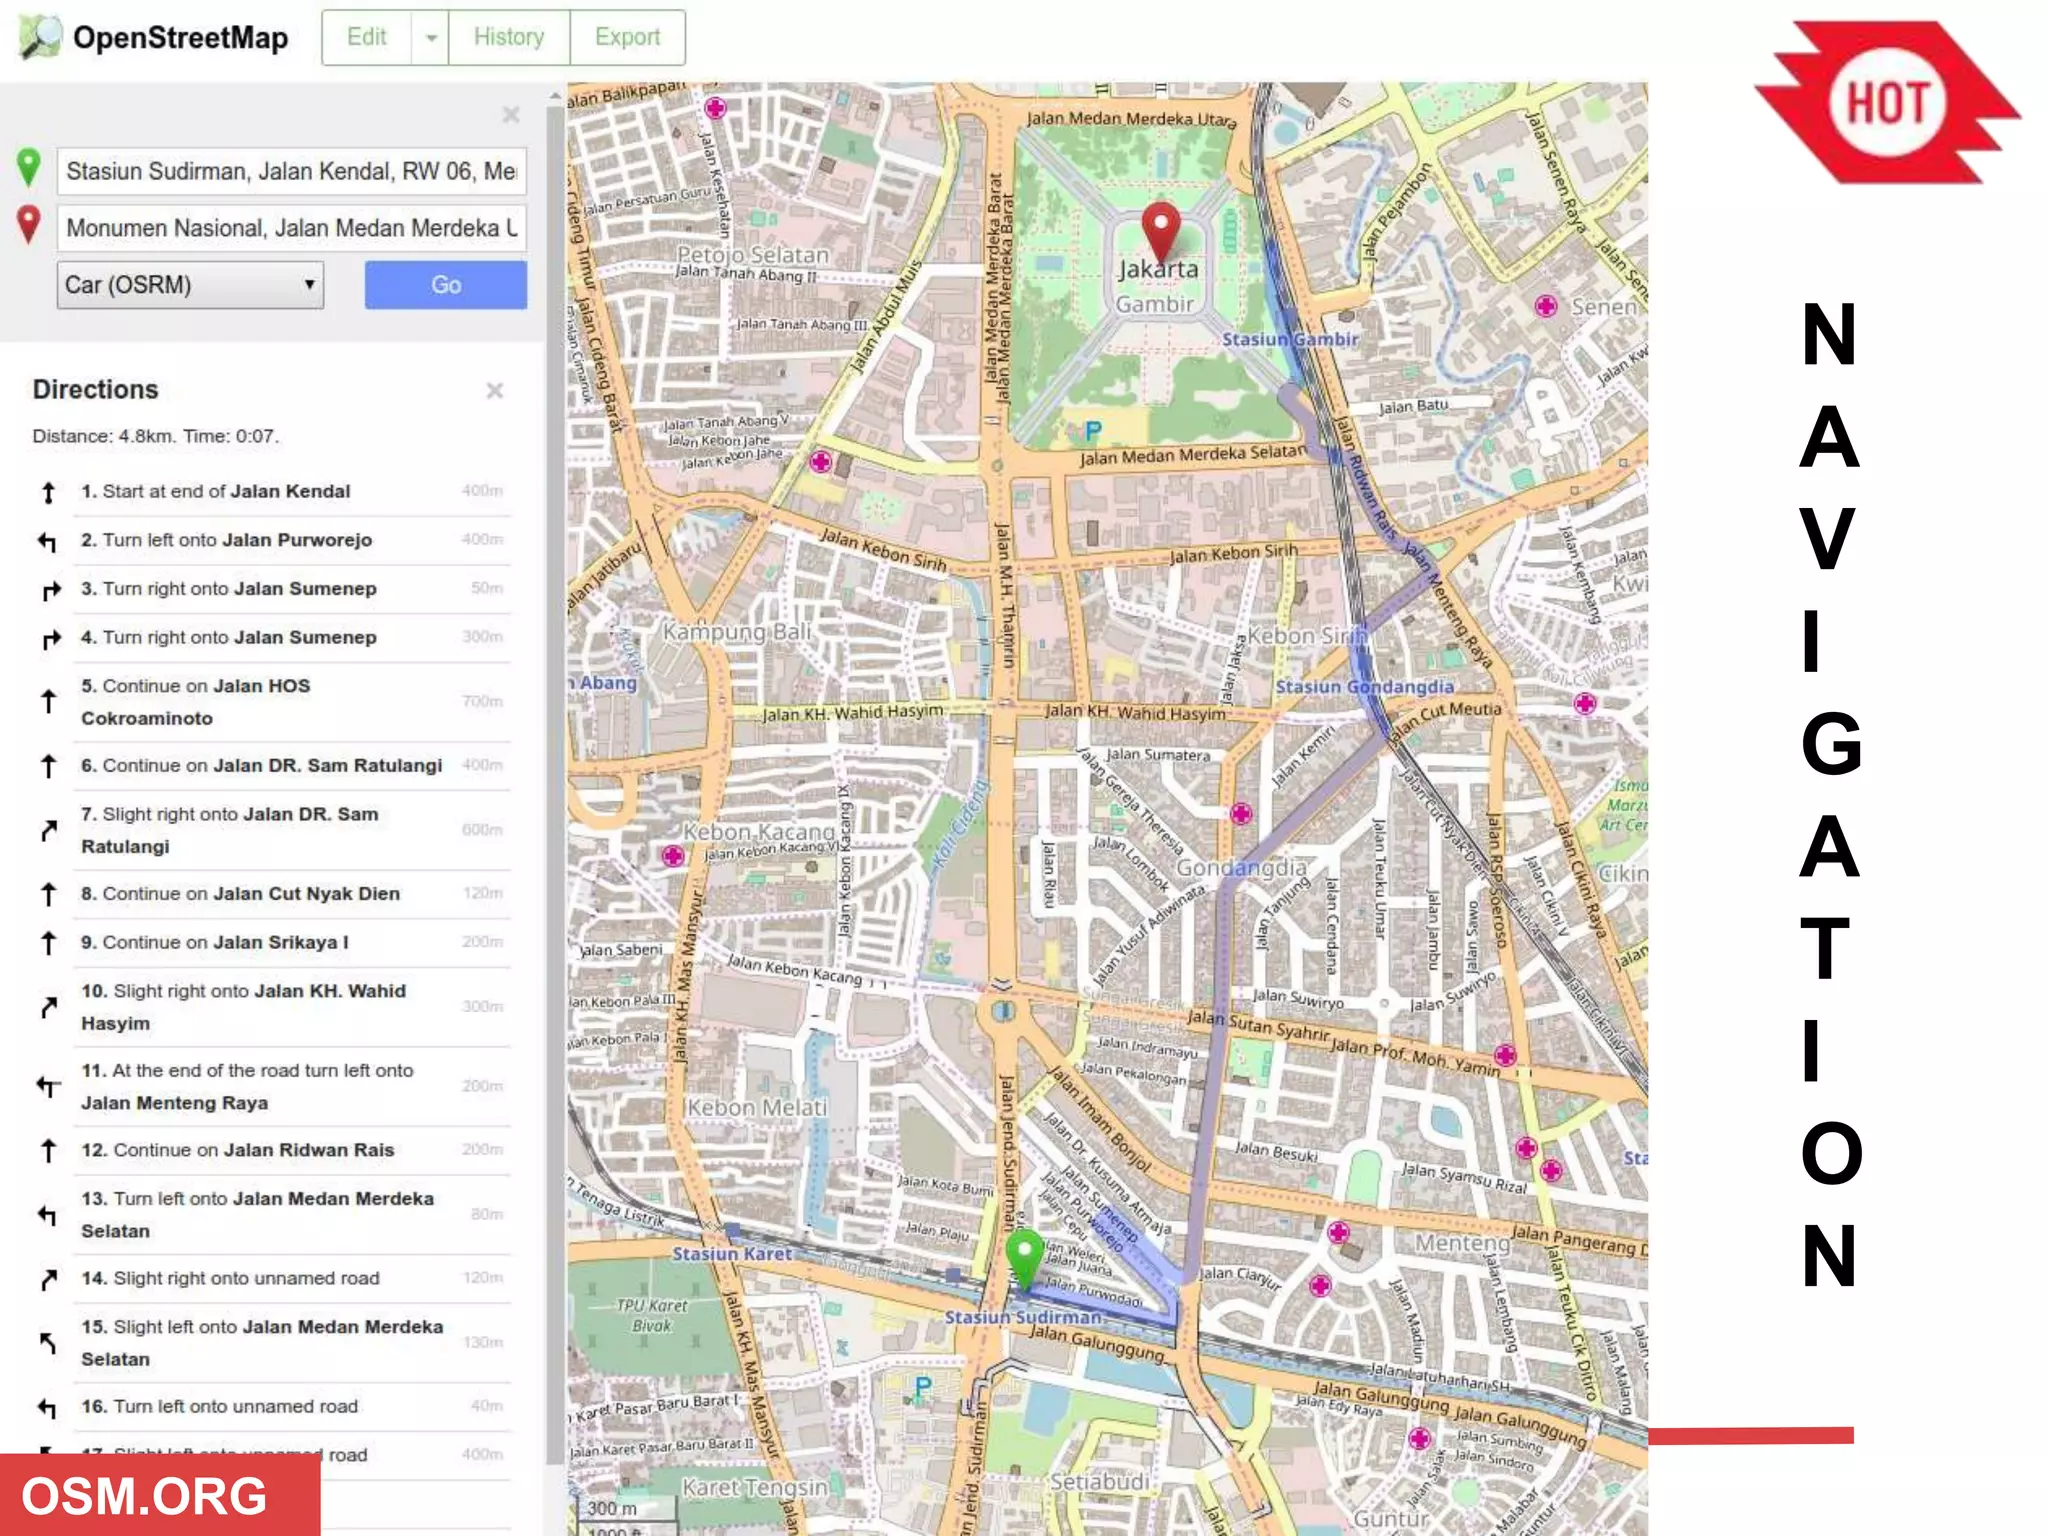
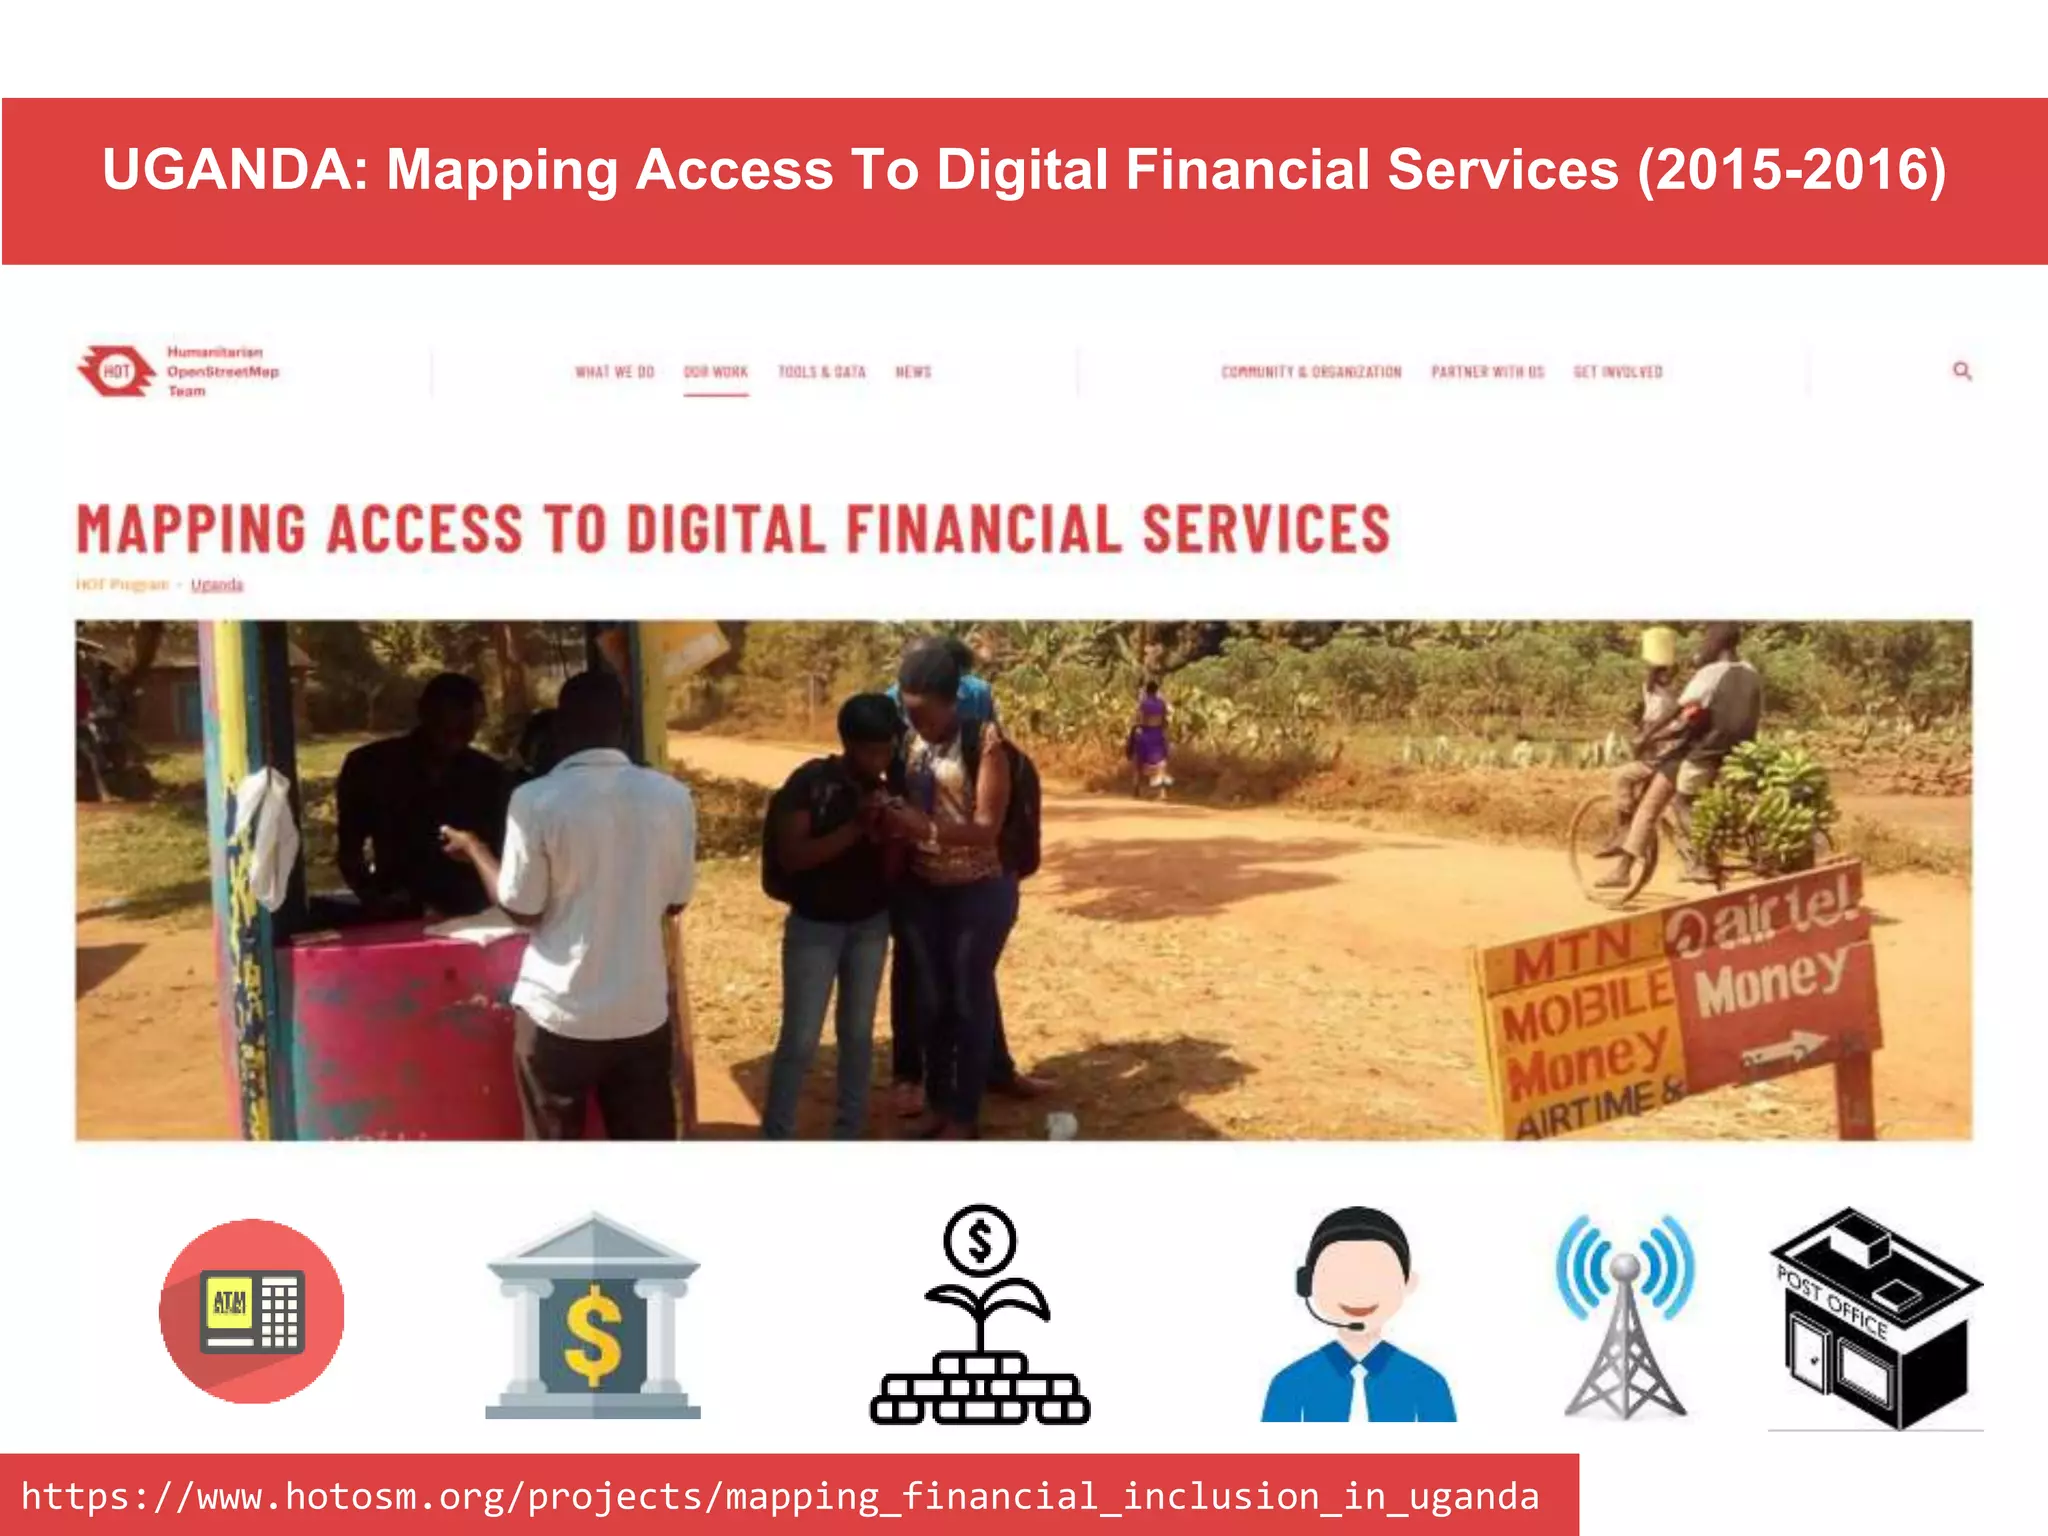
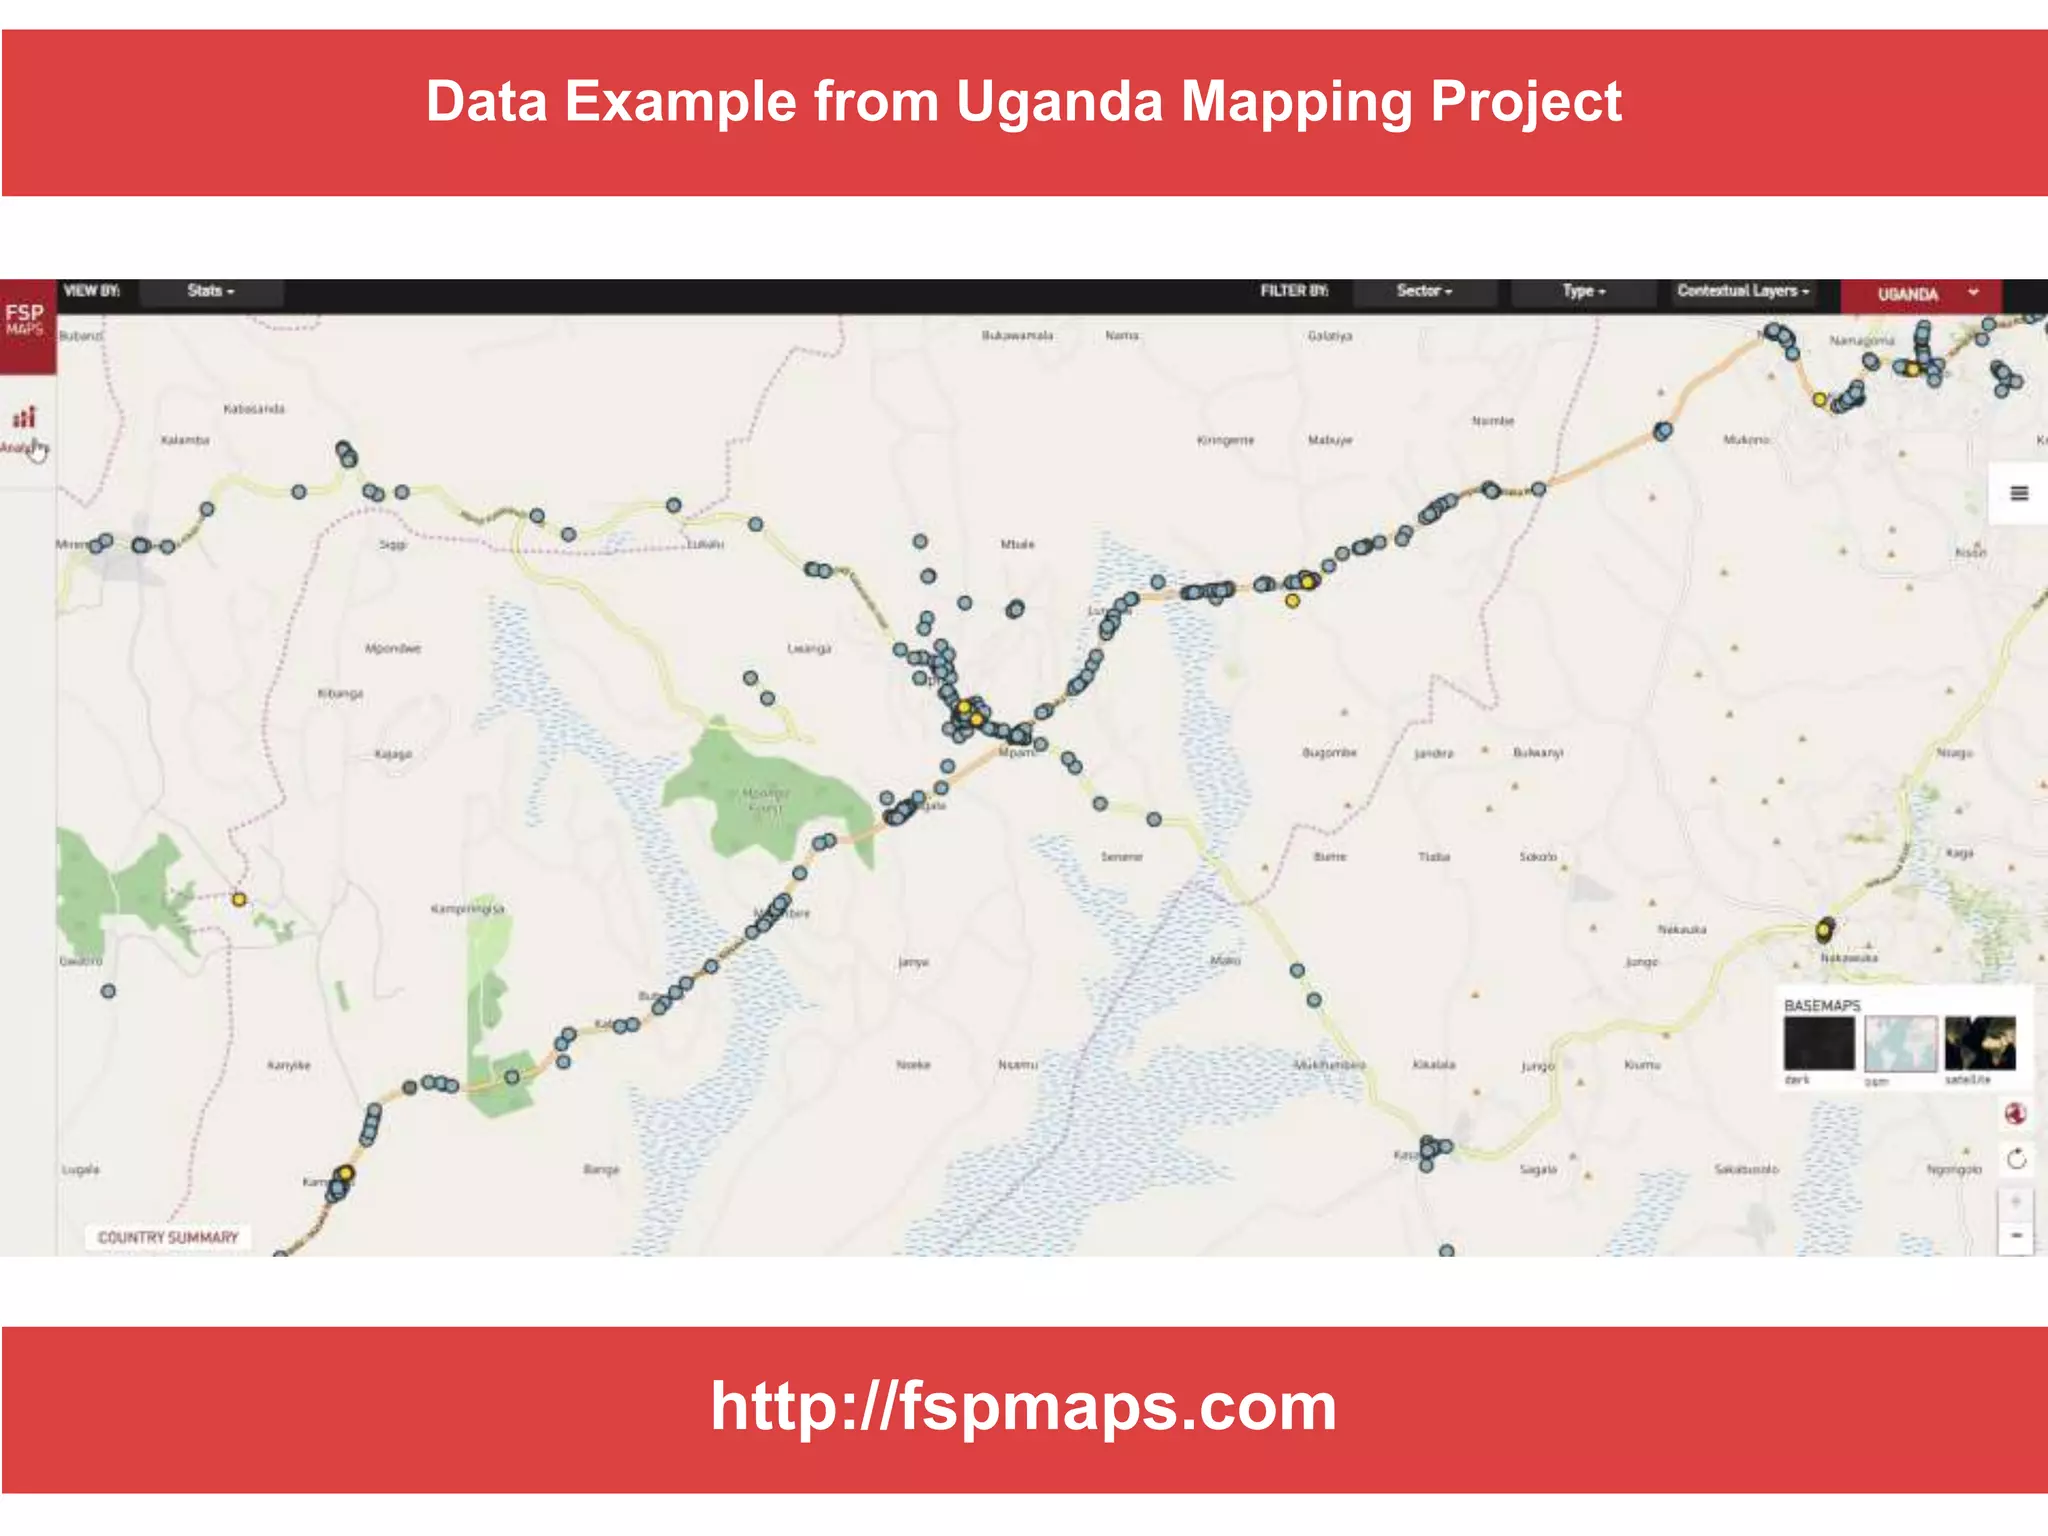
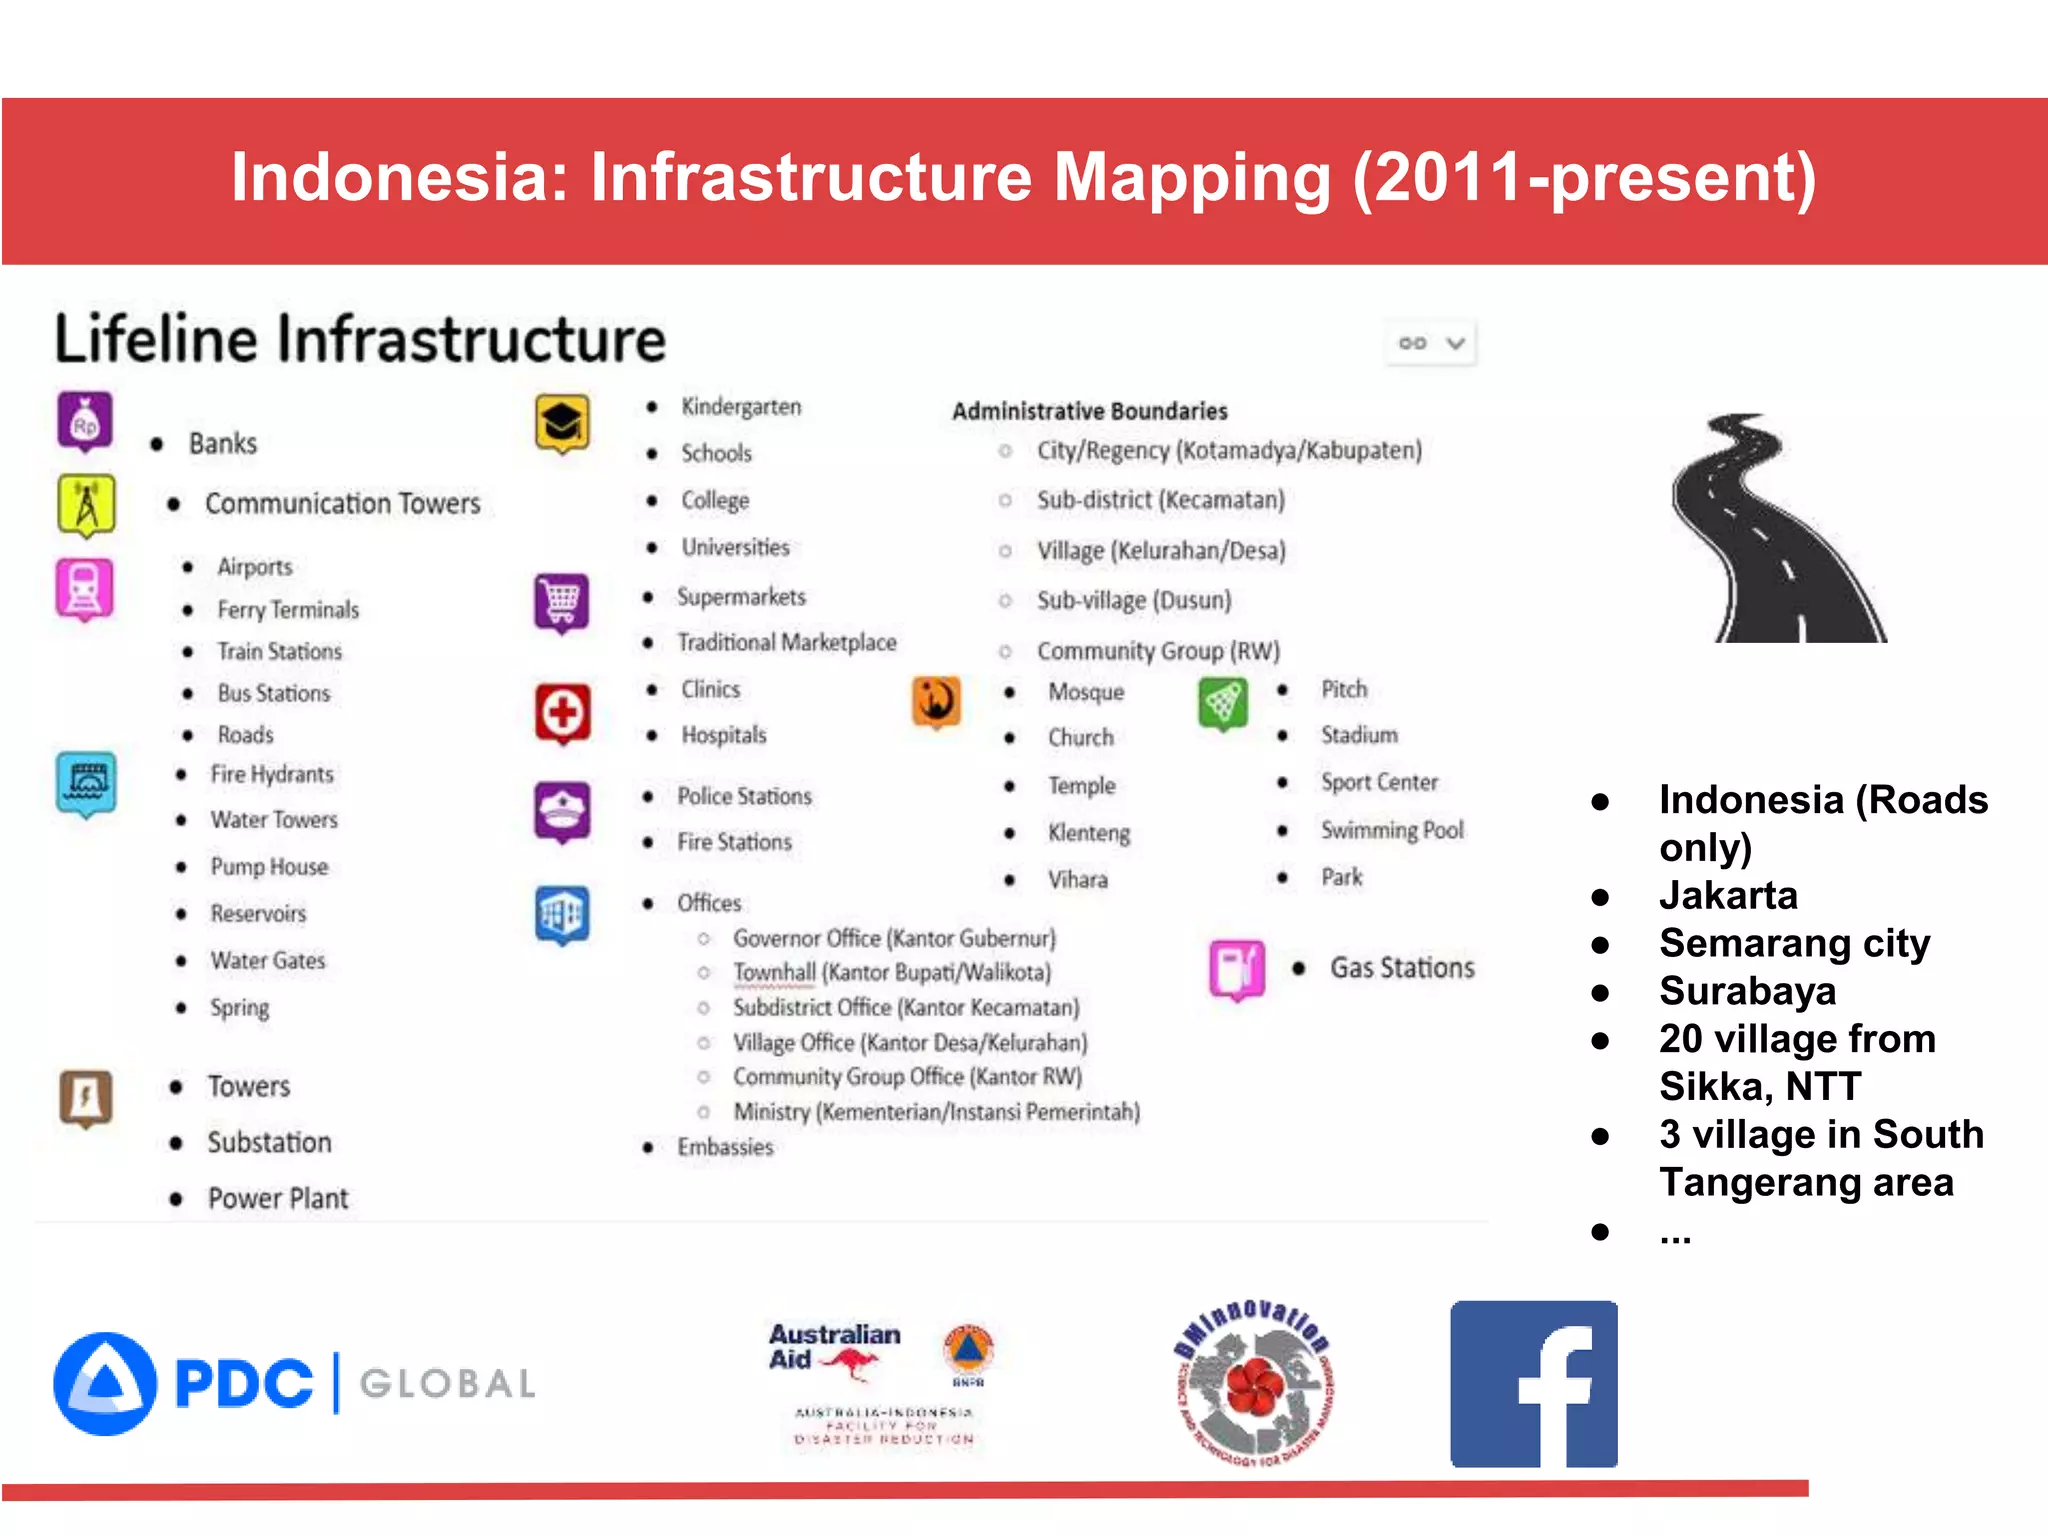
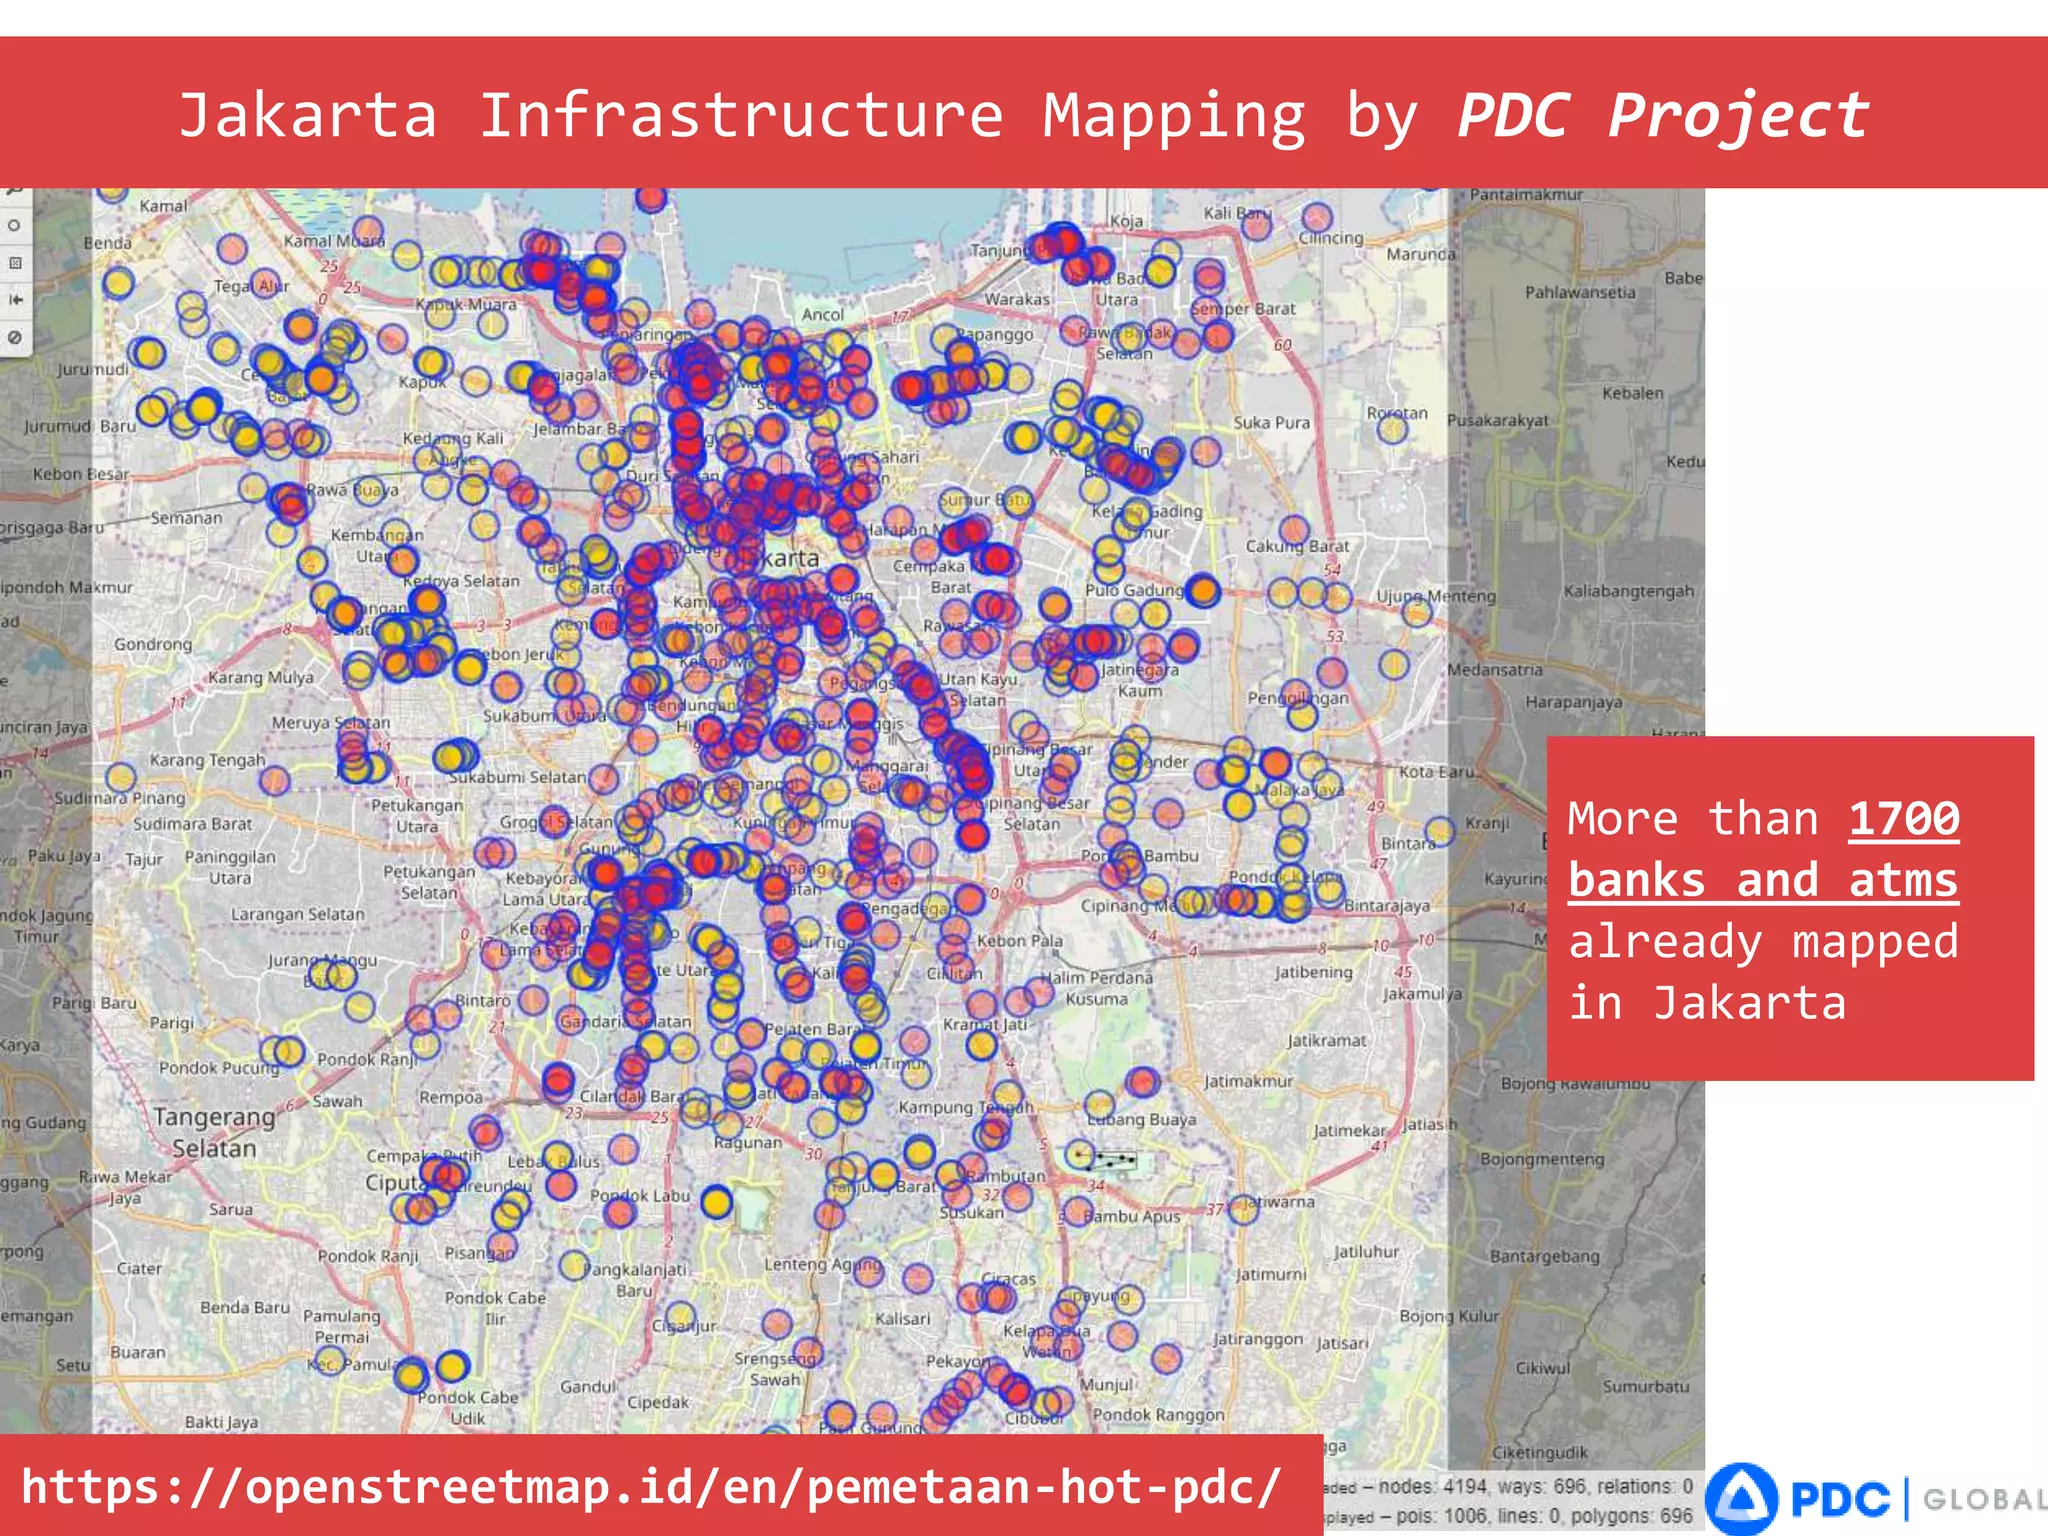
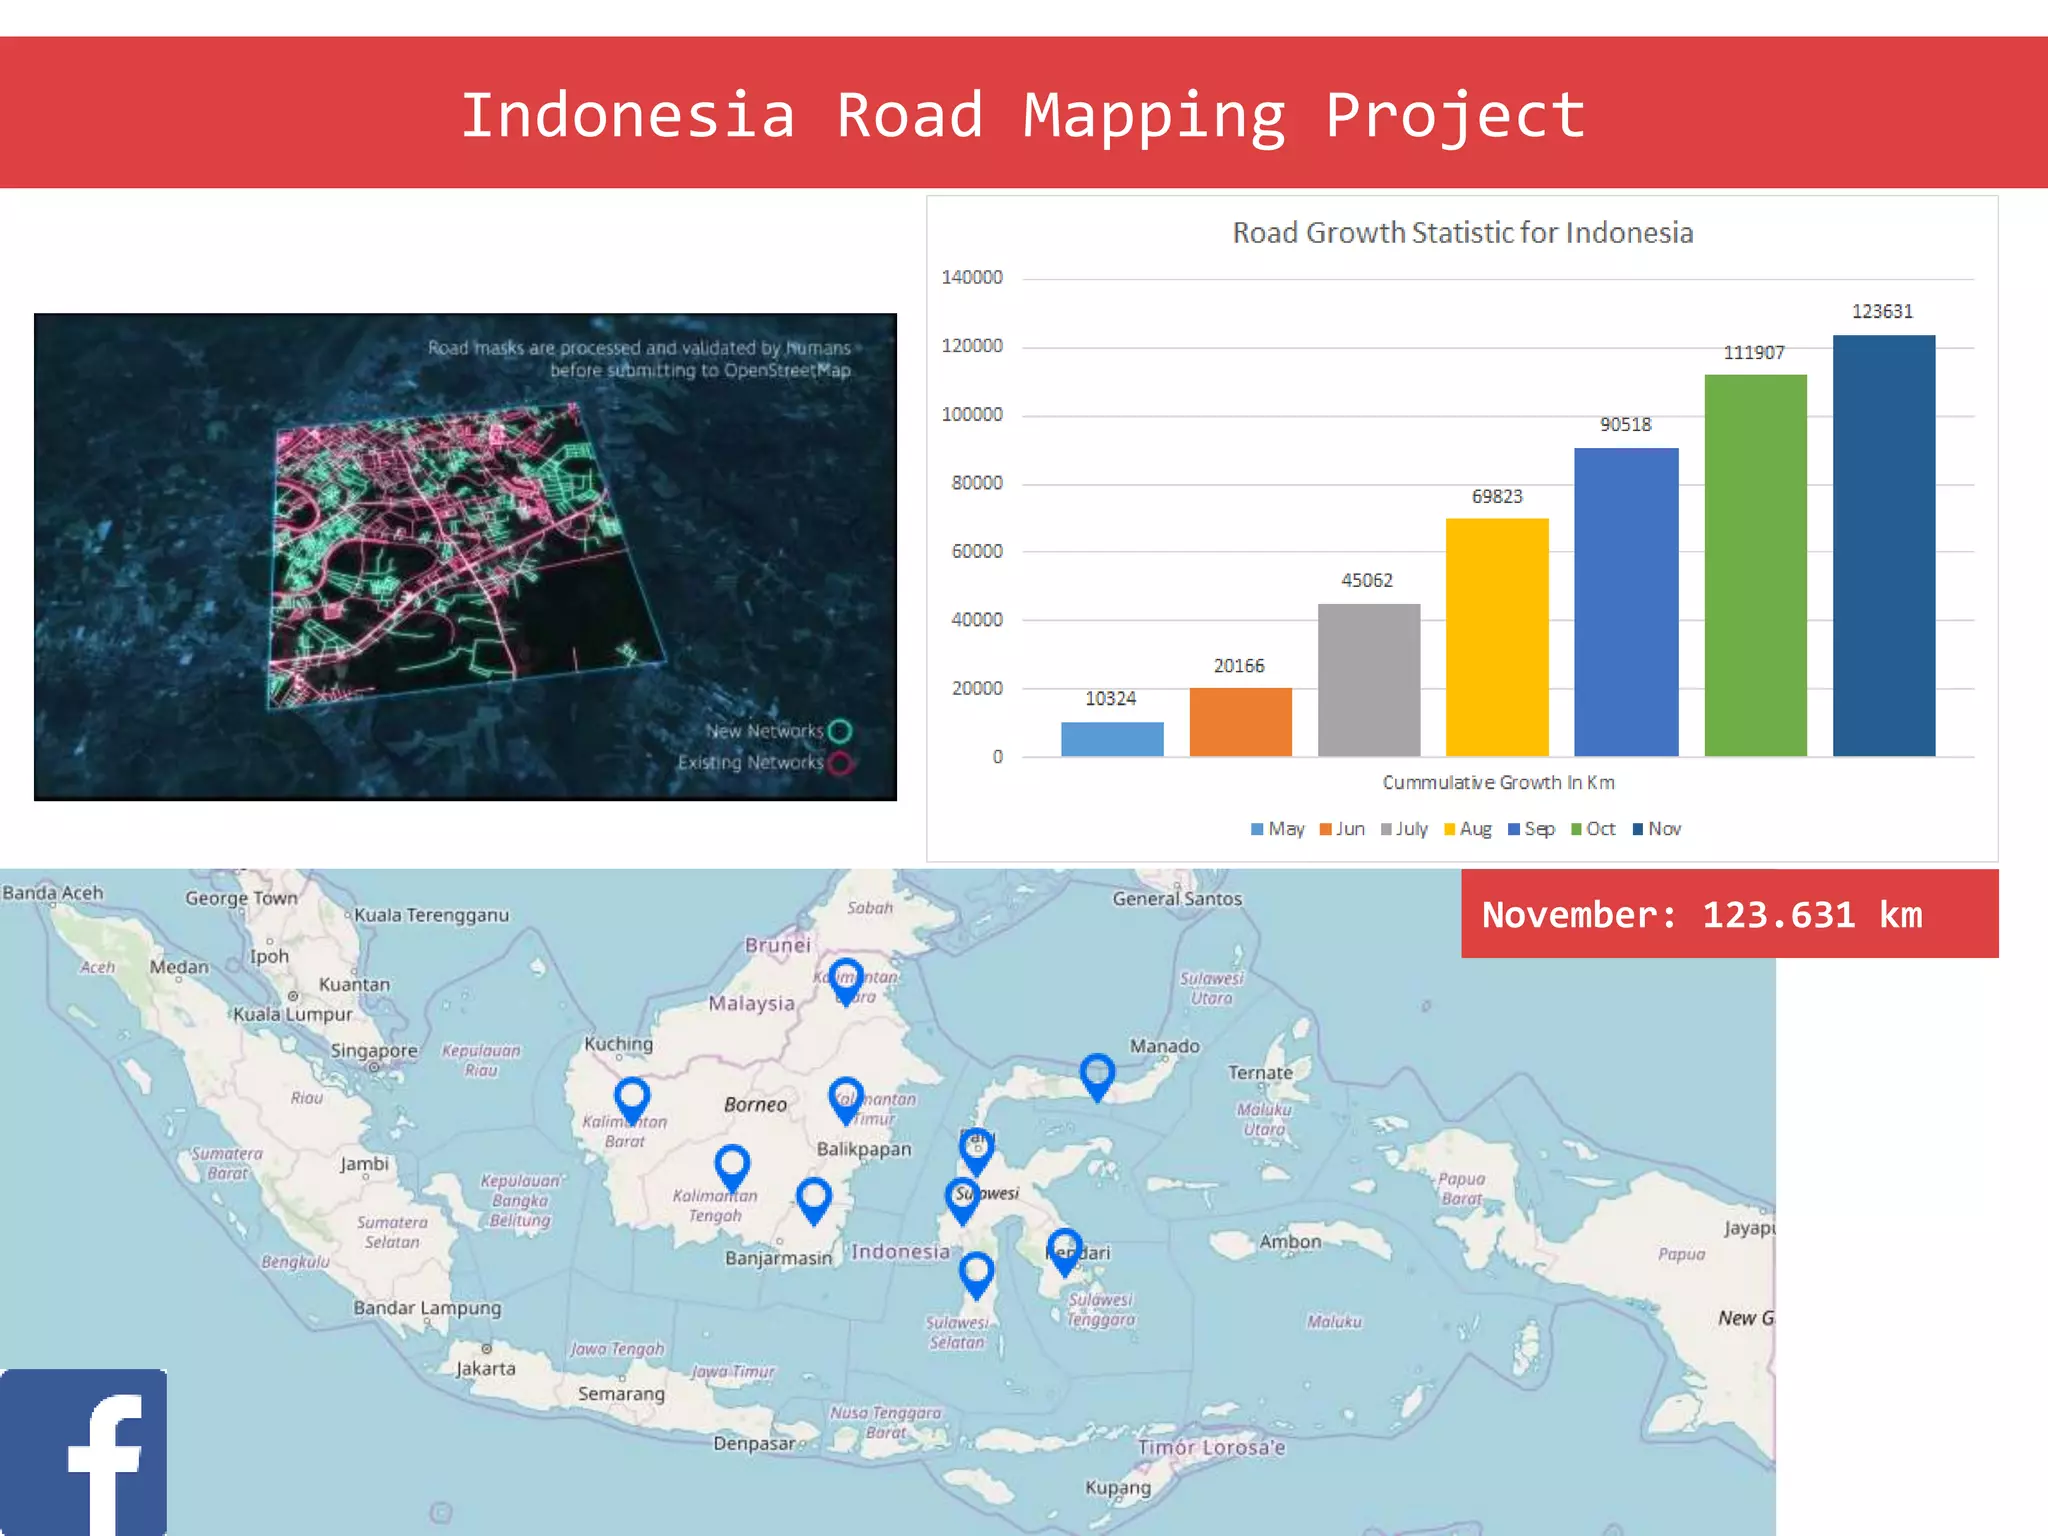
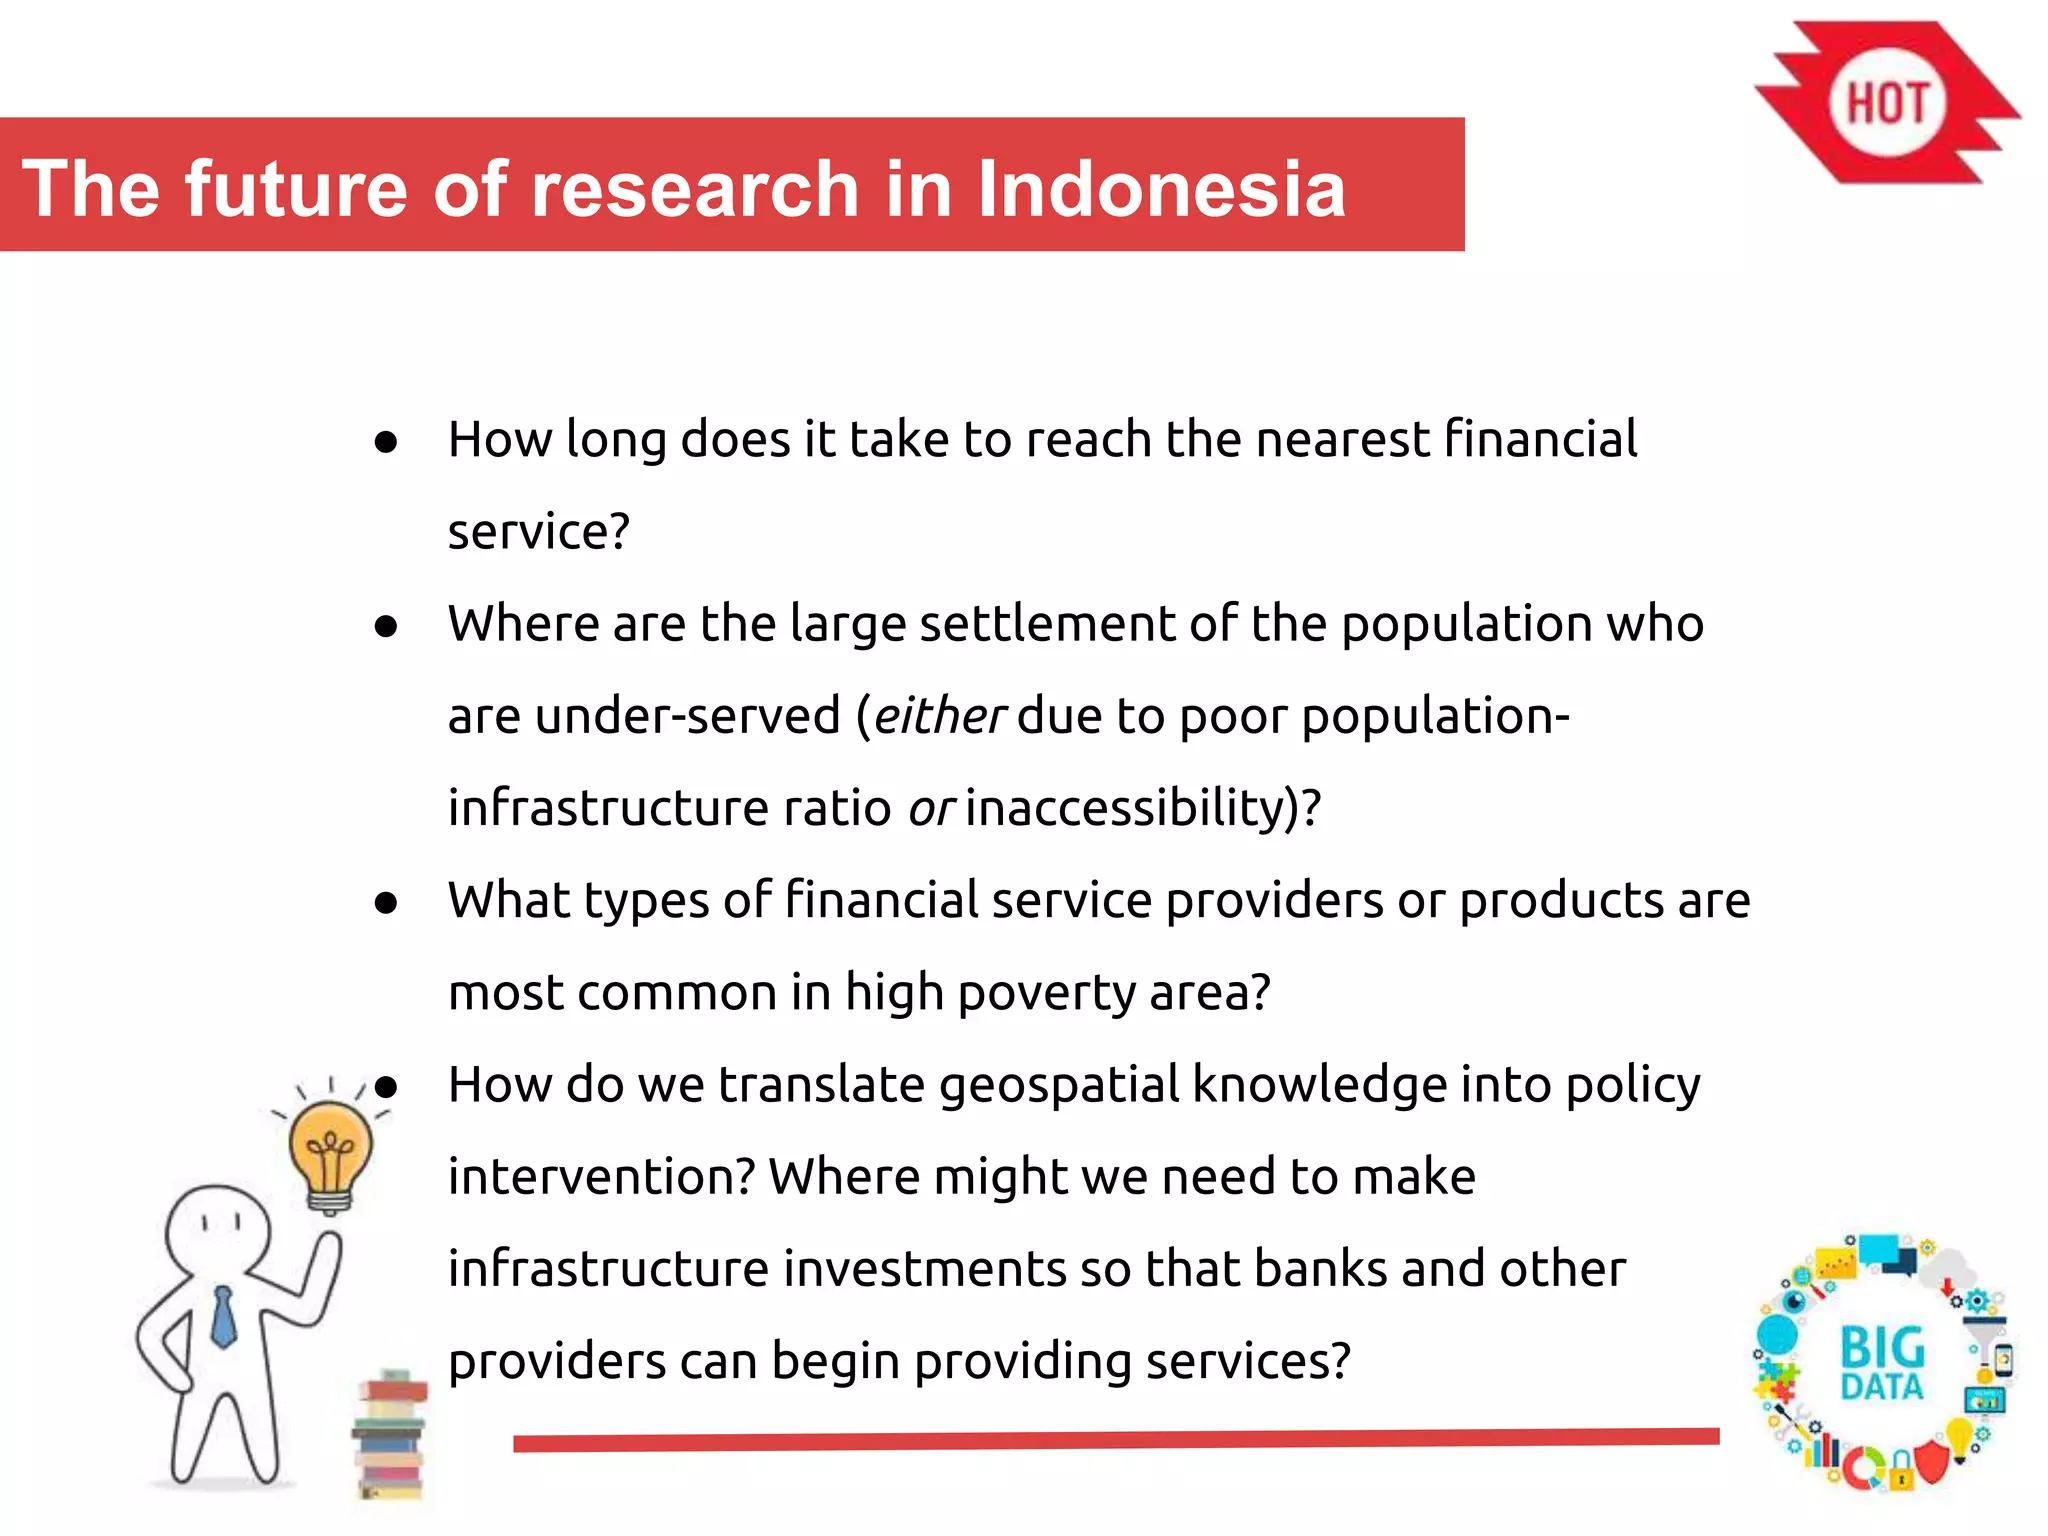
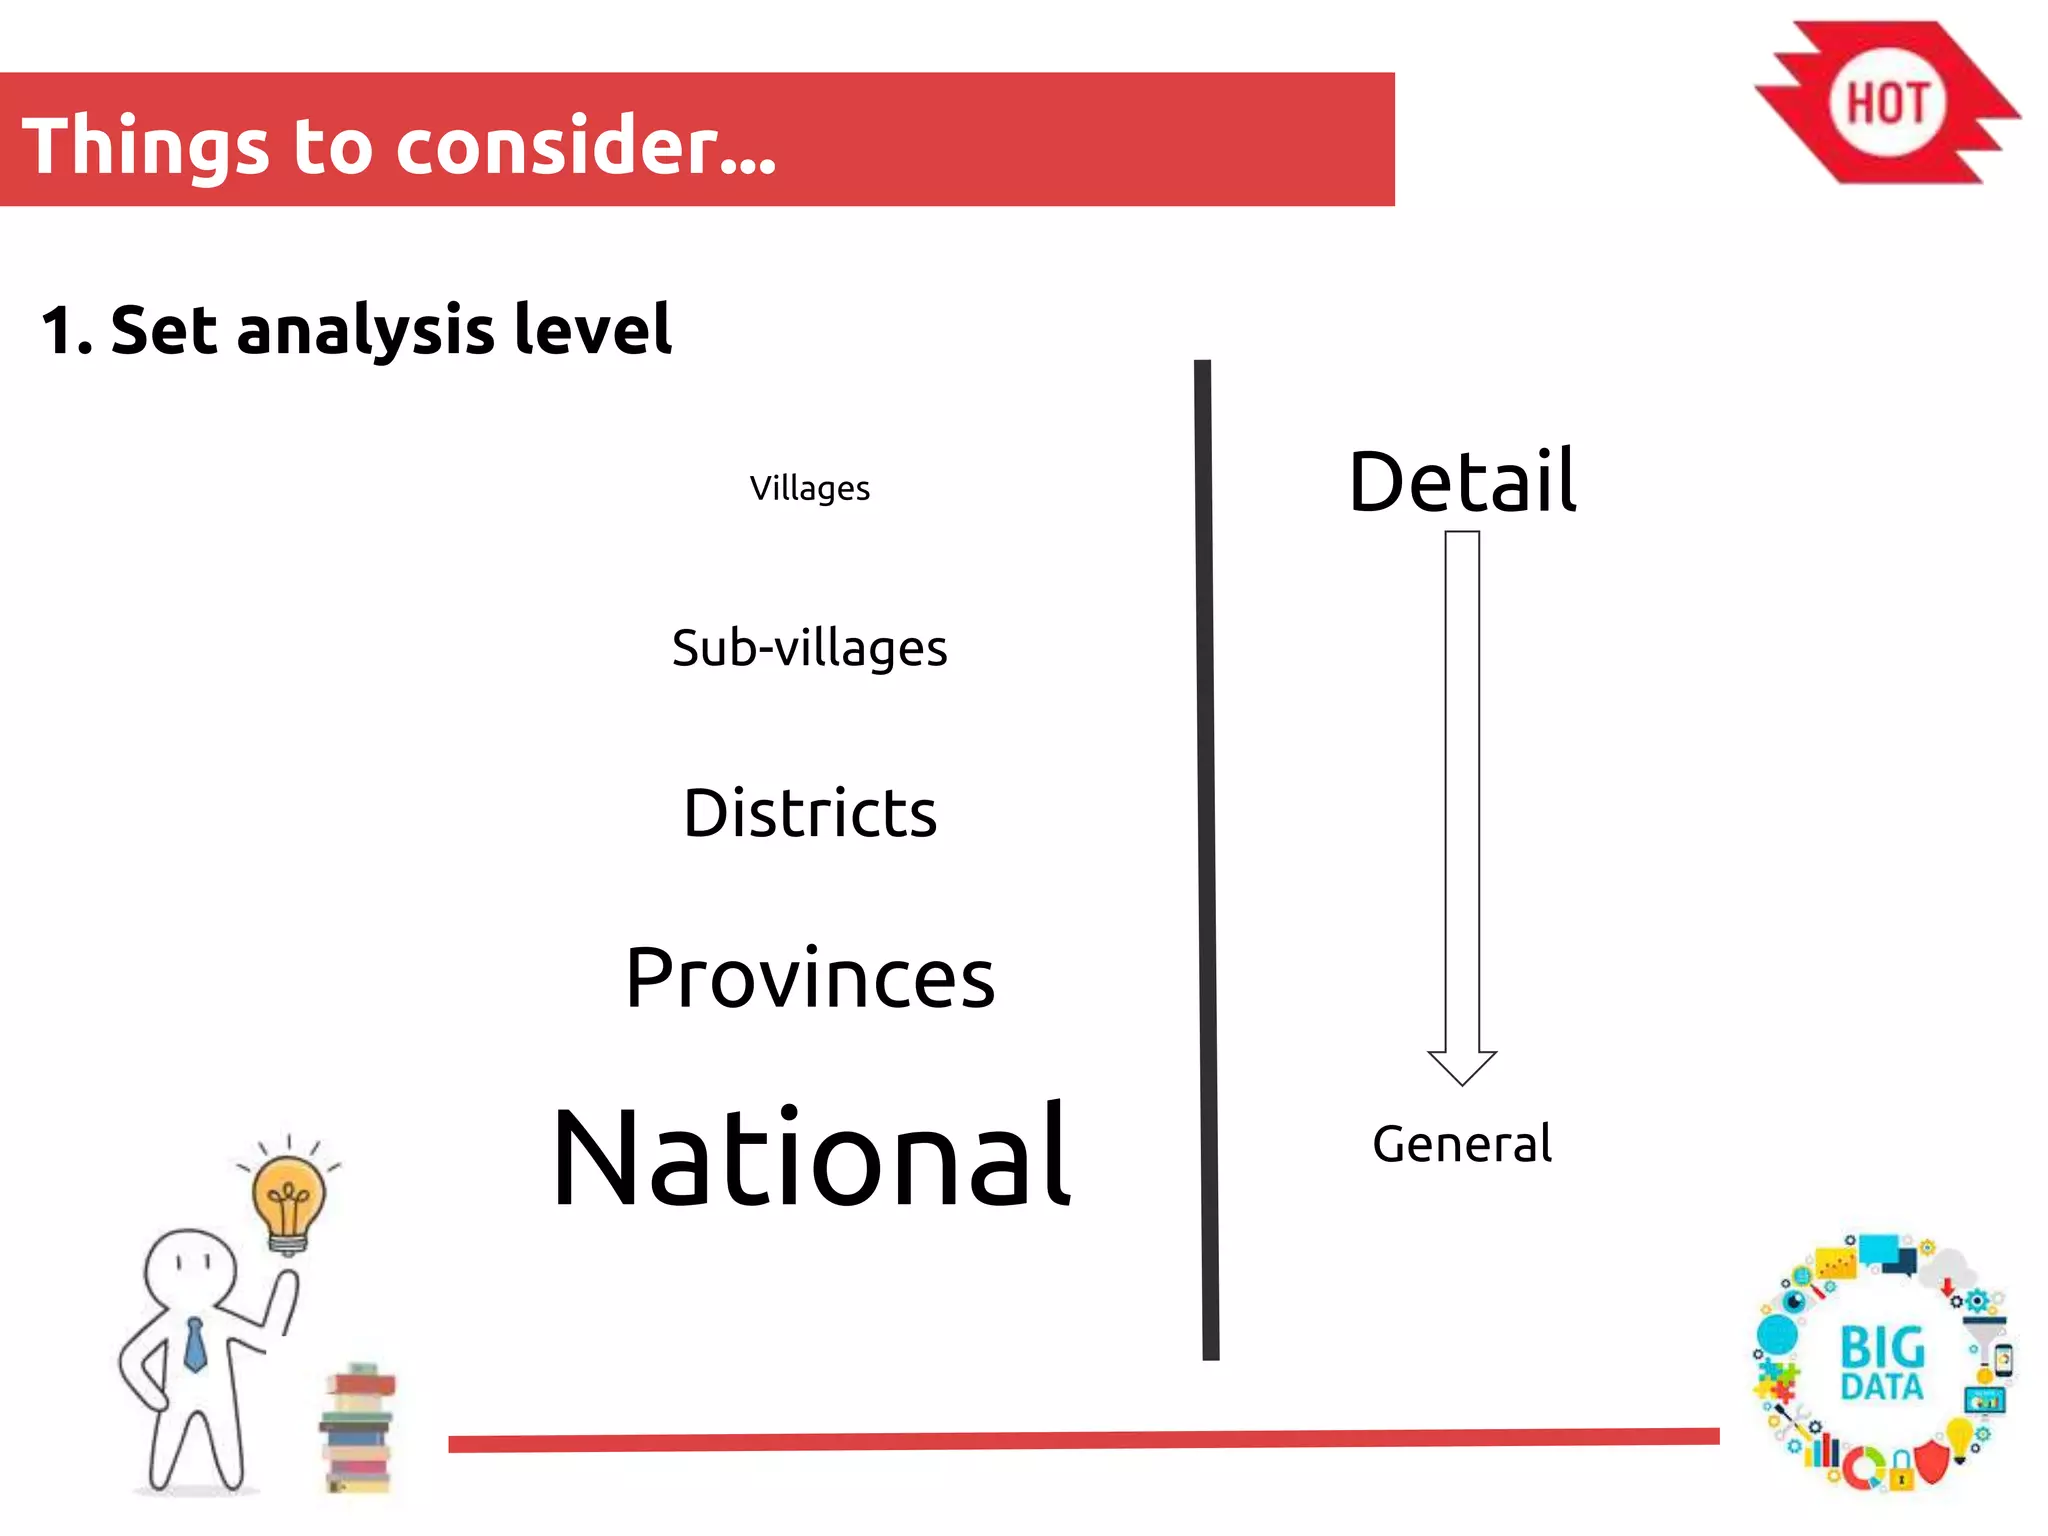
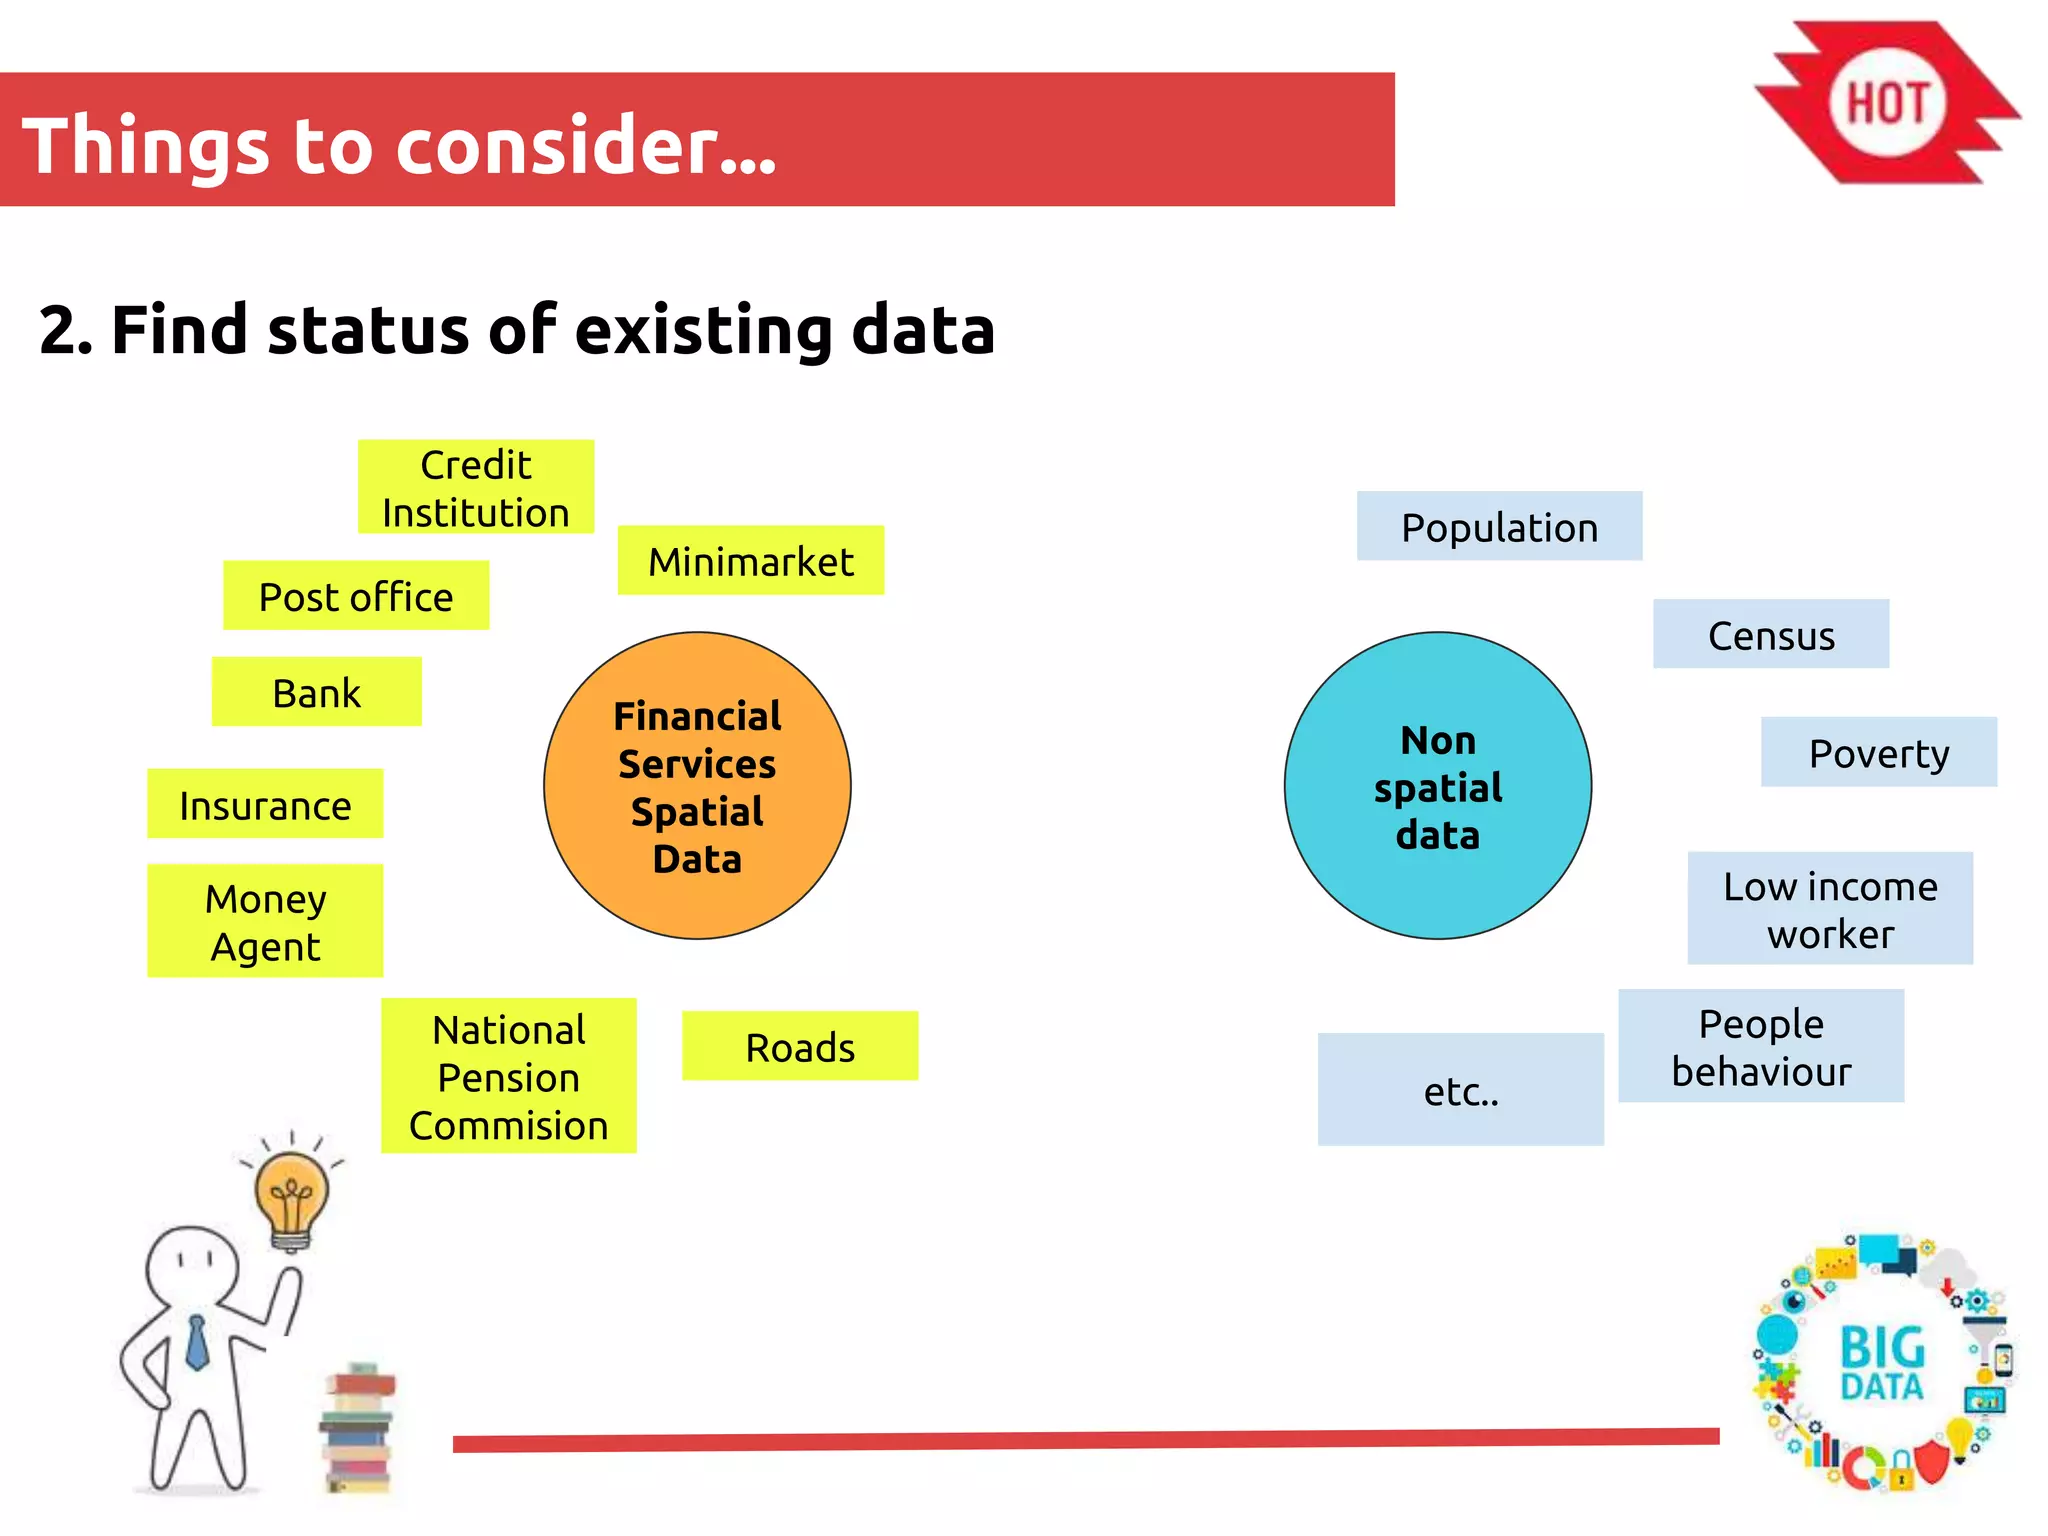

The document discusses the use of open source Geographic Information Systems (GIS) and OpenStreetMap (OSM) for enhancing financial inclusion. It highlights the benefits of OSM, such as rich data availability, no monopolies, and real-time updates, and provides examples of mapping projects in Uganda and Indonesia aimed at improving access to financial services. The text also raises important considerations for analyzing existing data and determining infrastructure needs in underserved areas.


![[Challenge:Future] Project Mass Effect](https://cdn.slidesharecdn.com/ss_thumbnails/challengefuture-project-mass-effect857-111120165945-phpapp01-thumbnail.jpg?width=640&height=640&fit=bounds)
![[Challenge:Future] Project Mass Effect](https://cdn.slidesharecdn.com/ss_thumbnails/challengefuture-project-mass-effect2254-111120163900-phpapp02-thumbnail.jpg?width=640&height=640&fit=bounds)


![[Challenge:Future] Project Mass Effect](https://cdn.slidesharecdn.com/ss_thumbnails/challengefuture-project-mass-effect1674-111120161846-phpapp02-thumbnail.jpg?width=640&height=640&fit=bounds)