© Copyright Open Gaming Alliance 2016 - Page 1
–
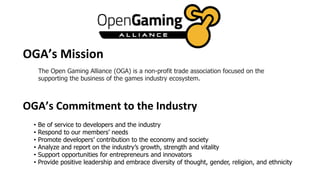
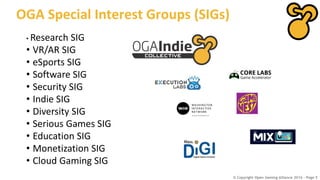
The Open Gaming Alliance (OGA) is a non-profit trade association focused on the
supporting the business of the games industry ecosystem.
• Be of service to developers and the industry
• Respond to our members’ needs
• Promote developers’ contribution to the economy and society
• Analyze and report on the industry’s growth, strength and vitality
• Support opportunities for entrepreneurs and innovators
• Provide positive leadership and embrace diversity of thought, gender, religion, and ethnicity
OGA’s Mission
OGA’s Commitment to the Industry
© Copyright Open Gaming Alliance 2016 - Page 4
New OGA Members in 2015 (not all announced yet)
© Copyright Open Gaming Alliance 2016 - Page 5
OGA Special Interest Groups (SIGs)
• Research SIG
• VR/AR SIG
• eSports SIG
• Software SIG
• Security SIG
• Indie SIG
• Diversity SIG
• Serious Games SIG
• Education SIG
• Monetization SIG
• Cloud Gaming SIG
© Copyright Open Gaming Alliance 2016 - Page 6
VR Development has Changed
1980s-2000s
• Tools very expensive or custom built
• Specialized high-end systems
• Cost millions of dollars to build
• Applications: Training, Experimental
Nicole Stenger, 1992
2016
• Indies developers are leading the charge on
content = 62% are indies
• Unity and Unreal democratized market
• 8%+ of developers doing VR games
• Applications: Games and Film & Enterprise
Playful Corp. – Lucky’s Tale
Source: M2 Advisory Group
© Copyright Open Gaming Alliance 2016 - Page 7
What We Know About VR
Key Players:
• Oculus Rift (VR - Facebook) – Q1 2016 $599
• Samsung Gear VR, Sony Morpheus – Q1 2016
• Razer OSVR, Google Cardboard, Magic Leap, Envelop VR (Uber Games spin off startup), Microsoft HoloLens,
Valve & HTC VR (aka Steam VR), Starbreeze, GearVR, Vuzix (Intel invests $25m), Immersion, Fove.
Considerations:
• Expect slow volume ramp time
- Comparison: Consoles in full swing typically sell between ~9-15m annually on average when fully ramped
• Estimated *entry* Price Points of HMD: ~$350-$650
• Risk Factors:
- Cost of produce the content
- High barrier to entry for what is roughly mainstream to high end.
- Oculus Recommended Specs for the full Rift experience: ($800 - $1000 not including monitor)
- NVIDIA GTX 970 / AMD 290 equivalent or greater (starts at $350)
- Intel i5-4590 equivalent or greater
- 8GB+ RAM
- Compatible HDMI 1.3 video output
- 2x USB 3.0 ports
- Windows 7 SP1 or newer
2/2/2016 Open Gaming Alliance Confidential - For OGA members only
© Copyright Open Gaming Alliance 2016 - Page 8
2015-2016 Projections
• 2016: 38 million VR headsets will be sold –
This is very high for year 1 sales
• 2016: VR/AR market $5 billion –
Again, high for year 1 of sales
• Q4 2014 & 2015: $1B in M&A (2015 = $250M)
This is actual
Market Size of VR and AR – Who Knows?
Analyst are aggressive on projections, a little too optimistic:
2020: Total VR & AR Market = $150 Billion
This is very aggressive for 4 year growth
© Copyright Open Gaming Alliance 2016 - Page 9
State of Gaming – What We DO Know
1. PC Gaming Software growth 12% in 2014 > 13% for CY 2015!!! Great Year for PC Gaming!
2. Biggest Games
 CoD BO III, Newly Released: Fallout 4, Battlefront, CoD BO III, etc. Existing: LoL, Dota 2, Hearthstone,
Minecraft
 Big Games continue to drive sell up & increased frequency to refresh
3. VR, & AR (HMD = Head Mounted Display)
 Potential for additional opportunities in sell up & refresh
4. Microsoft
 Windows 10, & DirectX 12 – now on your Xbox One!? Universal Apps
5. Valve’s Steam OS, Machine, & Controller – launches!
6. GDC 2016
 Expect focus to be around VR
7. eSports: Popularity hits a minimum of ~150+m viewers
8. 4K (UHD) display prices continue to drop
 1080p is the new 720p
9. Smart Toys Growing
- Disney Infinity 3.0
2/2/2016 Open Gaming Alliance Confidential - For OGA members only
© Copyright Open Gaming Alliance 2016 - Page 10
Gaming Demographics
PC Gaming Install Base: Estimates 711 Million ‘Active Users’ from an estimated ~1.2+ Billion PC Gaming TAM
CY 2014 Open Gaming Alliance Confidential - For OGA members only
Enthusiast
Mainstream
Entry (Casual – Web)
36m
250m
425m
3+
Years
5+
Years
7+
Years
PC Refresh &
Upgrade Cycle
Sources: Open Gaming Alliance Pinnacle Report, DFC, JPR, IDC, ISV Discussions, Public Domain PR Releases, and Intel Est.
Recognize that there’s no
perfect system. Gamer
habits, spending, time
spent highly variable.
© Copyright Open Gaming Alliance 2016 - Page 11
© Copyright Open Gaming Alliance 2016 - Page 12
© Copyright Open Gaming Alliance 2016 - Page 13
Hardware
OGA Estimates - PC Gaming Hardware Market
•Gaming Hardware Market = $86.1B
• How do we get this #?
- Total HW Market = $631 Billion.
- Combination of public records/filings vetted against private and other sources.
- Removing all OEM Consumer PCs, & Apple still nets $31.1B directly coming from Gaming Hardware.
• Key Segments
1. OEM PC sales for gaming (Attribution less than the OGA est) = $50B
2. OEM Gaming Branded(“Boutique”) PCs for Gaming = $5.5B
3. Apple = 22mu 2014 OSX devices w/25% gamer attribution = $5B
4. DIY AIB/Components = $10B
5. DIY/MOBO = $1.5B
6. Displays = attributed at $8.5B
7. Audio = attributed at $2B
8. Peripherals = $3.6B
- NOTE: Subject to change when more accurate data becomes available
2/2/2016 Open Gaming Alliance Confidential - For OGA members only
Sources: Open Gaming Alliance Pinnacle Report, Public Domain & Filings
© Copyright Open Gaming Alliance 2016 - Page 14
2007 to 2018
The OGA view of the transition to F2P & Digital Distribution
• Business models: Dominance of F2P/Freemium the #1 Driver due to low cost/barriers to entry
- Over 56% of PC Gaming SW Revs coming from APAC region
2/2/2016 Open Gaming Alliance Confidential - For OGA members only
Sources: Open Gaming Alliance (DFC) Pinnacle Report
© Copyright Open Gaming Alliance 2016 - Page 15
We Will Need Diversity
Diversity of: Development, Content, Applications, Consumers
© Copyright Open Gaming Alliance 2016 - Page 16
Partnership
• Provide collaboration across markets
• Support standardization for development and consumer adoption
• Build unified initiatives that support growth of ecosystem
OGA & ITA PARTNERSHIP
© Copyright Open Gaming Alliance 2016 - Page 17
© Copyright Open Gaming Alliance 2016 - Page 18
Wanda Meloni
Executive Director, OGA
wanda@m2research.com
Open Gaming Alliance – Thank You

Open Gaming Alliance @ CES VR Fest 2016

  • 1.
    © Copyright OpenGaming Alliance 2016 - Page 1 –
  • 2.
    The Open GamingAlliance (OGA) is a non-profit trade association focused on the supporting the business of the games industry ecosystem. • Be of service to developers and the industry • Respond to our members’ needs • Promote developers’ contribution to the economy and society • Analyze and report on the industry’s growth, strength and vitality • Support opportunities for entrepreneurs and innovators • Provide positive leadership and embrace diversity of thought, gender, religion, and ethnicity OGA’s Mission OGA’s Commitment to the Industry
  • 4.
    © Copyright OpenGaming Alliance 2016 - Page 4 New OGA Members in 2015 (not all announced yet)
  • 5.
    © Copyright OpenGaming Alliance 2016 - Page 5 OGA Special Interest Groups (SIGs) • Research SIG • VR/AR SIG • eSports SIG • Software SIG • Security SIG • Indie SIG • Diversity SIG • Serious Games SIG • Education SIG • Monetization SIG • Cloud Gaming SIG
  • 6.
    © Copyright OpenGaming Alliance 2016 - Page 6 VR Development has Changed 1980s-2000s • Tools very expensive or custom built • Specialized high-end systems • Cost millions of dollars to build • Applications: Training, Experimental Nicole Stenger, 1992 2016 • Indies developers are leading the charge on content = 62% are indies • Unity and Unreal democratized market • 8%+ of developers doing VR games • Applications: Games and Film & Enterprise Playful Corp. – Lucky’s Tale Source: M2 Advisory Group
  • 7.
    © Copyright OpenGaming Alliance 2016 - Page 7 What We Know About VR Key Players: • Oculus Rift (VR - Facebook) – Q1 2016 $599 • Samsung Gear VR, Sony Morpheus – Q1 2016 • Razer OSVR, Google Cardboard, Magic Leap, Envelop VR (Uber Games spin off startup), Microsoft HoloLens, Valve & HTC VR (aka Steam VR), Starbreeze, GearVR, Vuzix (Intel invests $25m), Immersion, Fove. Considerations: • Expect slow volume ramp time - Comparison: Consoles in full swing typically sell between ~9-15m annually on average when fully ramped • Estimated *entry* Price Points of HMD: ~$350-$650 • Risk Factors: - Cost of produce the content - High barrier to entry for what is roughly mainstream to high end. - Oculus Recommended Specs for the full Rift experience: ($800 - $1000 not including monitor) - NVIDIA GTX 970 / AMD 290 equivalent or greater (starts at $350) - Intel i5-4590 equivalent or greater - 8GB+ RAM - Compatible HDMI 1.3 video output - 2x USB 3.0 ports - Windows 7 SP1 or newer 2/2/2016 Open Gaming Alliance Confidential - For OGA members only
  • 8.
    © Copyright OpenGaming Alliance 2016 - Page 8 2015-2016 Projections • 2016: 38 million VR headsets will be sold – This is very high for year 1 sales • 2016: VR/AR market $5 billion – Again, high for year 1 of sales • Q4 2014 & 2015: $1B in M&A (2015 = $250M) This is actual Market Size of VR and AR – Who Knows? Analyst are aggressive on projections, a little too optimistic: 2020: Total VR & AR Market = $150 Billion This is very aggressive for 4 year growth
  • 9.
    © Copyright OpenGaming Alliance 2016 - Page 9 State of Gaming – What We DO Know 1. PC Gaming Software growth 12% in 2014 > 13% for CY 2015!!! Great Year for PC Gaming! 2. Biggest Games  CoD BO III, Newly Released: Fallout 4, Battlefront, CoD BO III, etc. Existing: LoL, Dota 2, Hearthstone, Minecraft  Big Games continue to drive sell up & increased frequency to refresh 3. VR, & AR (HMD = Head Mounted Display)  Potential for additional opportunities in sell up & refresh 4. Microsoft  Windows 10, & DirectX 12 – now on your Xbox One!? Universal Apps 5. Valve’s Steam OS, Machine, & Controller – launches! 6. GDC 2016  Expect focus to be around VR 7. eSports: Popularity hits a minimum of ~150+m viewers 8. 4K (UHD) display prices continue to drop  1080p is the new 720p 9. Smart Toys Growing - Disney Infinity 3.0 2/2/2016 Open Gaming Alliance Confidential - For OGA members only
  • 10.
    © Copyright OpenGaming Alliance 2016 - Page 10 Gaming Demographics PC Gaming Install Base: Estimates 711 Million ‘Active Users’ from an estimated ~1.2+ Billion PC Gaming TAM CY 2014 Open Gaming Alliance Confidential - For OGA members only Enthusiast Mainstream Entry (Casual – Web) 36m 250m 425m 3+ Years 5+ Years 7+ Years PC Refresh & Upgrade Cycle Sources: Open Gaming Alliance Pinnacle Report, DFC, JPR, IDC, ISV Discussions, Public Domain PR Releases, and Intel Est. Recognize that there’s no perfect system. Gamer habits, spending, time spent highly variable.
  • 11.
    © Copyright OpenGaming Alliance 2016 - Page 11
  • 12.
    © Copyright OpenGaming Alliance 2016 - Page 12
  • 13.
    © Copyright OpenGaming Alliance 2016 - Page 13 Hardware OGA Estimates - PC Gaming Hardware Market •Gaming Hardware Market = $86.1B • How do we get this #? - Total HW Market = $631 Billion. - Combination of public records/filings vetted against private and other sources. - Removing all OEM Consumer PCs, & Apple still nets $31.1B directly coming from Gaming Hardware. • Key Segments 1. OEM PC sales for gaming (Attribution less than the OGA est) = $50B 2. OEM Gaming Branded(“Boutique”) PCs for Gaming = $5.5B 3. Apple = 22mu 2014 OSX devices w/25% gamer attribution = $5B 4. DIY AIB/Components = $10B 5. DIY/MOBO = $1.5B 6. Displays = attributed at $8.5B 7. Audio = attributed at $2B 8. Peripherals = $3.6B - NOTE: Subject to change when more accurate data becomes available 2/2/2016 Open Gaming Alliance Confidential - For OGA members only Sources: Open Gaming Alliance Pinnacle Report, Public Domain & Filings
  • 14.
    © Copyright OpenGaming Alliance 2016 - Page 14 2007 to 2018 The OGA view of the transition to F2P & Digital Distribution • Business models: Dominance of F2P/Freemium the #1 Driver due to low cost/barriers to entry - Over 56% of PC Gaming SW Revs coming from APAC region 2/2/2016 Open Gaming Alliance Confidential - For OGA members only Sources: Open Gaming Alliance (DFC) Pinnacle Report
  • 15.
    © Copyright OpenGaming Alliance 2016 - Page 15 We Will Need Diversity Diversity of: Development, Content, Applications, Consumers
  • 16.
    © Copyright OpenGaming Alliance 2016 - Page 16 Partnership • Provide collaboration across markets • Support standardization for development and consumer adoption • Build unified initiatives that support growth of ecosystem OGA & ITA PARTNERSHIP
  • 17.
    © Copyright OpenGaming Alliance 2016 - Page 17
  • 18.
    © Copyright OpenGaming Alliance 2016 - Page 18 Wanda Meloni Executive Director, OGA wanda@m2research.com Open Gaming Alliance – Thank You