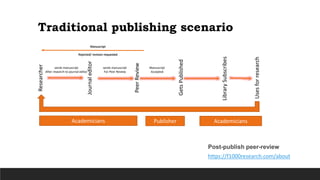
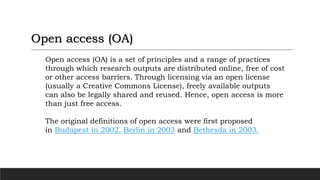
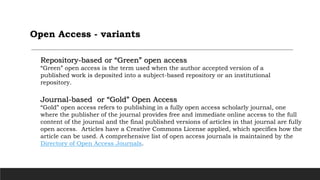
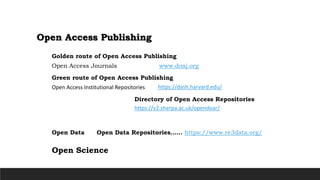
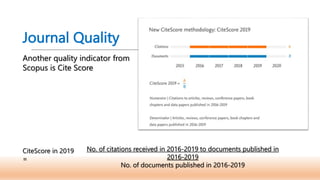
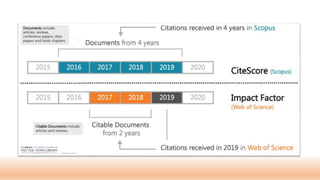
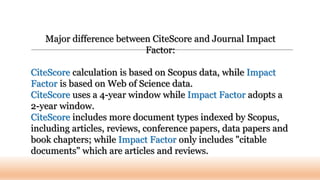
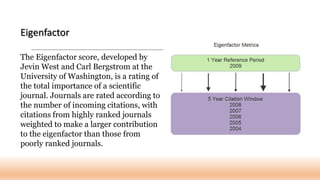
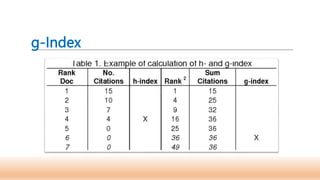
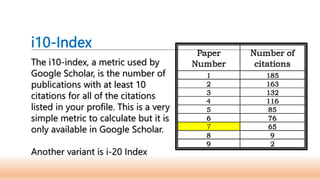
Open Access and
Institutional
Repositories
Dr Gopakumar V
Head, Knowledge Centre
Digital University Kerala
Open Access to scholarly literature
Why do scholars publish their findings?
• Scholarly publications add to the body of knowledge
• Publishing is a key way for authors to validate their work
• The scholar becomes a recognized expert in your field
• Your findings will help develop or improve on existing policy
• Publications will help a scholar advance in his/her career
• Scholar gains inner satisfaction..
• and many more
Traditional publishing scenario
Researcher
Journal
editor
Peer
Review
Gets
Published
Library
Subscribes
Uses
for
research
sends manuscript
After research to journal editor
sends manuscript
For Peer Review
Manuscript
Accepted
Manuscript
Rejected/ revision requested
Academicians Academicians
Publisher
Post-publish peer-review
https://f1000research.com/about
Open access (OA) is a set of principles and a range of practices
through which research outputs are distributed online, free of cost
or other access barriers. Through licensing via an open license
(usually a Creative Commons License), freely available outputs
can also be legally shared and reused. Hence, open access is more
than just free access.
The original definitions of open access were first proposed
in Budapest in 2002, Berlin in 2003 and Bethesda in 2003.
Open access (OA)
Repository-based or “Green” open access
“Green” open access is the term used when the author accepted version of a
published work is deposited into a subject-based repository or an institutional
repository.
Journal-based or “Gold” Open Access
“Gold” open access refers to publishing in a fully open access scholarly journal, one
where the publisher of the journal provides free and immediate online access to the full
content of the journal and the final published versions of articles in that journal are fully
open access. Articles have a Creative Commons License applied, which specifies how the
article can be used. A comprehensive list of open access journals is maintained by the
Directory of Open Access Journals.
Open Access - variants
Open Access Publishing
Open Access Journals www.doaj.org
Golden route of Open Access Publishing
Open Access Institutional Repositories
Green route of Open Access Publishing
https://v2.sherpa.ac.uk/opendoar/
Directory of Open Access Repositories
Open Data Open Data Repositories…… https://www.re3data.org/
Open Science
https://dash.harvard.edu/
Publication / Research
metrics: Do we have
standard measures?
Dr Gopakumar V
Head, Knowledge Centre
Digital University Kerala
librarian@duk.ac.in
Serials Crisis and selection of Journals
Quality concerns
Return on Investment on case of research funding
Introduction
An indicator of the quality of publication /
research.
There is increasing literature, discussion and
advocacy to identify flaws and alternatives.
Publication / Research
metrics
What do publication metrics aim to
measure?
1. Journal quality
e.g. journal impact factor (WoS),
CiteScore (Elsevier)
SCImago Journal Rank (SJR)
2. Individual article quality
e.g. Citation count
3. Individual researcher / institute quality
e.g. h-index
Who provides publication metrics and
why?
Web of Science/Clarivate
Scopus/Elsevier
Dimensions – new https://www.dimensions.ai/
Google Scholar
Altmetrics (measures twitter, downloads, blogs, media,
etc)
Journal Quality
The most widely used metric is the Journal
Impact Factor (JIF).
Supplier of this metric is Web of Science.
Calculation of JIF is done as follows
Journal impact factor (for year X) = Citations in year X for papers published in years X-1, X-2
Number of papers published in years X-1, X-2
Journal Quality
Another quality indicator from
Scopus is Cite Score
CiteScore in 2019
=
No. of citations received in 2016-2019 to documents published in
2016-2019
No. of documents published in 2016-2019
Major difference between CiteScore and Journal Impact
Factor:
CiteScore calculation is based on Scopus data, while Impact
Factor is based on Web of Science data.
CiteScore uses a 4-year window while Impact Factor adopts a
2-year window.
CiteScore includes more document types indexed by Scopus,
including articles, reviews, conference papers, data papers and
book chapters; while Impact Factor only includes "citable
documents" which are articles and reviews.
The Eigenfactor score, developed by
Jevin West and Carl Bergstrom at the
University of Washington, is a rating of
the total importance of a scientific
journal. Journals are rated according to
the number of incoming citations, with
citations from highly ranked journals
weighted to make a larger contribution
to the eigenfactor than those from
poorly ranked journals.
Eigenfactor
The SJR of a journal calculated on the basis of the Scopus citation data
divided by the number of articles published by the journal over 3 years.
Similar to Eigenfactor methods, but based on citations in Scopus instead
of Web of Science.
Freely available at scimagojr.com
Covers more journals (~20,000) than JCR because Scopus covers more
journals than Web of Science
3 years of citations;
no self-citations
SCImago Journal Ranking (SJR)
The journal Immediacy Index indicates how quickly articles in
a journal are cited.
The aggregate Immediacy Index indicates how quickly articles
in a subject category are cited.
Some other quality indicators
The Immediacy Index is calculated by dividing the
number of citations to articles published in a given
year by the number of articles published in that
year.
Article Influence Score
The average influence of a journal's articles over the first five years after
publication. It is calculated by dividing a journal's Eigenfactor Score by
the number of articles in the journal.
Individual paper quality
Citation count is the standard metric used..
Web of Science and Google Scholar provides the data
Individual Researcher quality
Can this be done with a metric….??
The most commonly used is h-index
H-Index is provided by Web of Science
(Also provided by Google Scholar)
There is a correlation between h-index and the
numbers of quality papers produced by a
researcher
The h-index, or the Hirsch index, is the science-metric
indicator proposed in 2005 by the Argentine-American
physicist Jorge Hirsch of the University of California at
San Diego.
The Hirsch index is a quantitative characteristic of the
productivity of a scientist, a group of scientists, a scientific
organization, or the country as a whole, based on the
number of publications and the number of
citations of these publications
h-Index
h-Index calculation
According to Hirsch:
The scientist has an index h
if h from his Np articles are
cited at least h times each,
while the remaining (Np-h)
articles are cited no more
than h times each.
h-Index calculation
In other words, the scientist with the index h published
h articles, each of which was referred to at least h times.
So, if this researcher published 100 articles, for each of
which there is only one reference, his h-index is 1.
The same is the h-index of the researcher who
published one article, which was referenced 100 times.
g-Index
The g-index is an author-level metric suggested in 2006
by Leo Egghe. It is a variant of h-index. The index is
calculated based on the distribution of citations
received by a given researcher's publications, such that
given a set of articles ranked in decreasing order of the
number of citations that they received, the g-index is
the unique largest number such that the top g articles
received together at least g2 citations.
g-Index
i10-Index
The i10-index, a metric used by
Google Scholar, is the number of
publications with at least 10
citations for all of the citations
listed in your profile. This is a very
simple metric to calculate but it is
only available in Google Scholar.
Another variant is i-20 Index
Paper
Number
Number of
citations
1 185
2 163
3 132
4 116
5 85
6 76
7 65
8 9
9 2
These systematic thoughts together can be
called as Science of science
Several interpretations but none conclusive
They are useful …….but flawed…
Standard metrics accepted by all are not
there….
Thank you

Open Access and IR along with Quality Indicators.pptx

  • 1.
    Open Access and Institutional Repositories DrGopakumar V Head, Knowledge Centre Digital University Kerala
  • 2.
    Open Access toscholarly literature Why do scholars publish their findings? • Scholarly publications add to the body of knowledge • Publishing is a key way for authors to validate their work • The scholar becomes a recognized expert in your field • Your findings will help develop or improve on existing policy • Publications will help a scholar advance in his/her career • Scholar gains inner satisfaction.. • and many more
  • 3.
    Traditional publishing scenario Researcher Journal editor Peer Review Gets Published Library Subscribes Uses for research sendsmanuscript After research to journal editor sends manuscript For Peer Review Manuscript Accepted Manuscript Rejected/ revision requested Academicians Academicians Publisher Post-publish peer-review https://f1000research.com/about
  • 4.
    Open access (OA)is a set of principles and a range of practices through which research outputs are distributed online, free of cost or other access barriers. Through licensing via an open license (usually a Creative Commons License), freely available outputs can also be legally shared and reused. Hence, open access is more than just free access. The original definitions of open access were first proposed in Budapest in 2002, Berlin in 2003 and Bethesda in 2003. Open access (OA)
  • 5.
    Repository-based or “Green”open access “Green” open access is the term used when the author accepted version of a published work is deposited into a subject-based repository or an institutional repository. Journal-based or “Gold” Open Access “Gold” open access refers to publishing in a fully open access scholarly journal, one where the publisher of the journal provides free and immediate online access to the full content of the journal and the final published versions of articles in that journal are fully open access. Articles have a Creative Commons License applied, which specifies how the article can be used. A comprehensive list of open access journals is maintained by the Directory of Open Access Journals. Open Access - variants
  • 6.
    Open Access Publishing OpenAccess Journals www.doaj.org Golden route of Open Access Publishing Open Access Institutional Repositories Green route of Open Access Publishing https://v2.sherpa.ac.uk/opendoar/ Directory of Open Access Repositories Open Data Open Data Repositories…… https://www.re3data.org/ Open Science https://dash.harvard.edu/
  • 7.
    Publication / Research metrics:Do we have standard measures? Dr Gopakumar V Head, Knowledge Centre Digital University Kerala librarian@duk.ac.in
  • 8.
    Serials Crisis andselection of Journals Quality concerns Return on Investment on case of research funding Introduction
  • 9.
    An indicator ofthe quality of publication / research. There is increasing literature, discussion and advocacy to identify flaws and alternatives. Publication / Research metrics
  • 10.
    What do publicationmetrics aim to measure? 1. Journal quality e.g. journal impact factor (WoS), CiteScore (Elsevier) SCImago Journal Rank (SJR) 2. Individual article quality e.g. Citation count 3. Individual researcher / institute quality e.g. h-index
  • 11.
    Who provides publicationmetrics and why? Web of Science/Clarivate Scopus/Elsevier Dimensions – new https://www.dimensions.ai/ Google Scholar Altmetrics (measures twitter, downloads, blogs, media, etc)
  • 12.
    Journal Quality The mostwidely used metric is the Journal Impact Factor (JIF). Supplier of this metric is Web of Science. Calculation of JIF is done as follows Journal impact factor (for year X) = Citations in year X for papers published in years X-1, X-2 Number of papers published in years X-1, X-2
  • 13.
    Journal Quality Another qualityindicator from Scopus is Cite Score CiteScore in 2019 = No. of citations received in 2016-2019 to documents published in 2016-2019 No. of documents published in 2016-2019
  • 15.
    Major difference betweenCiteScore and Journal Impact Factor: CiteScore calculation is based on Scopus data, while Impact Factor is based on Web of Science data. CiteScore uses a 4-year window while Impact Factor adopts a 2-year window. CiteScore includes more document types indexed by Scopus, including articles, reviews, conference papers, data papers and book chapters; while Impact Factor only includes "citable documents" which are articles and reviews.
  • 16.
    The Eigenfactor score,developed by Jevin West and Carl Bergstrom at the University of Washington, is a rating of the total importance of a scientific journal. Journals are rated according to the number of incoming citations, with citations from highly ranked journals weighted to make a larger contribution to the eigenfactor than those from poorly ranked journals. Eigenfactor
  • 17.
    The SJR ofa journal calculated on the basis of the Scopus citation data divided by the number of articles published by the journal over 3 years. Similar to Eigenfactor methods, but based on citations in Scopus instead of Web of Science. Freely available at scimagojr.com Covers more journals (~20,000) than JCR because Scopus covers more journals than Web of Science 3 years of citations; no self-citations SCImago Journal Ranking (SJR)
  • 18.
    The journal ImmediacyIndex indicates how quickly articles in a journal are cited. The aggregate Immediacy Index indicates how quickly articles in a subject category are cited. Some other quality indicators The Immediacy Index is calculated by dividing the number of citations to articles published in a given year by the number of articles published in that year. Article Influence Score The average influence of a journal's articles over the first five years after publication. It is calculated by dividing a journal's Eigenfactor Score by the number of articles in the journal.
  • 19.
    Individual paper quality Citationcount is the standard metric used.. Web of Science and Google Scholar provides the data
  • 20.
    Individual Researcher quality Canthis be done with a metric….?? The most commonly used is h-index H-Index is provided by Web of Science (Also provided by Google Scholar) There is a correlation between h-index and the numbers of quality papers produced by a researcher
  • 21.
    The h-index, orthe Hirsch index, is the science-metric indicator proposed in 2005 by the Argentine-American physicist Jorge Hirsch of the University of California at San Diego. The Hirsch index is a quantitative characteristic of the productivity of a scientist, a group of scientists, a scientific organization, or the country as a whole, based on the number of publications and the number of citations of these publications h-Index
  • 22.
    h-Index calculation According toHirsch: The scientist has an index h if h from his Np articles are cited at least h times each, while the remaining (Np-h) articles are cited no more than h times each.
  • 23.
    h-Index calculation In otherwords, the scientist with the index h published h articles, each of which was referred to at least h times. So, if this researcher published 100 articles, for each of which there is only one reference, his h-index is 1. The same is the h-index of the researcher who published one article, which was referenced 100 times.
  • 24.
    g-Index The g-index isan author-level metric suggested in 2006 by Leo Egghe. It is a variant of h-index. The index is calculated based on the distribution of citations received by a given researcher's publications, such that given a set of articles ranked in decreasing order of the number of citations that they received, the g-index is the unique largest number such that the top g articles received together at least g2 citations.
  • 25.
  • 26.
    i10-Index The i10-index, ametric used by Google Scholar, is the number of publications with at least 10 citations for all of the citations listed in your profile. This is a very simple metric to calculate but it is only available in Google Scholar. Another variant is i-20 Index Paper Number Number of citations 1 185 2 163 3 132 4 116 5 85 6 76 7 65 8 9 9 2
  • 27.
    These systematic thoughtstogether can be called as Science of science Several interpretations but none conclusive They are useful …….but flawed… Standard metrics accepted by all are not there….
  • 28.

Editor's Notes

  • #10 © Copyright Showeet.com – Free PowerPoint Templates
  • #11 © Copyright Showeet.com – Free PowerPoint Templates
  • #12 © Copyright Showeet.com – Free PowerPoint Templates
  • #13 © Copyright Showeet.com – Free PowerPoint Templates
  • #14 © Copyright Showeet.com – Free PowerPoint Templates
  • #24 Very slow They measure the past, not necessarily the present. Age is heavily favoured. Favours those that are middle author/honorary author on a lot of papers Self citations!
  • #25 Very slow They measure the past, not necessarily the present. Age is heavily favoured. Favours those that are middle author/honorary author on a lot of papers Self citations!
  • #26 Very slow They measure the past, not necessarily the present. Age is heavily favoured. Favours those that are middle author/honorary author on a lot of papers Self citations!
  • #27 Very slow They measure the past, not necessarily the present. Age is heavily favoured. Favours those that are middle author/honorary author on a lot of papers Self citations!
  • #29 © Copyright Showeet.com – Free PowerPoint Templates